Back to Journals » Journal of Multidisciplinary Healthcare » Volume 18
Development and Validation of a Dynamic Online Nomogram for Predicting Inpatient Fall Risk: A Cohort Study
Authors Jiang S, Zhao F, Liang Y, Wang S, Xu Q, Wang R, Wu T, Yang H
Received 1 April 2025
Accepted for publication 23 July 2025
Published 7 August 2025 Volume 2025:18 Pages 4819—4832
DOI https://doi.org/10.2147/JMDH.S531799
Checked for plagiarism Yes
Review by Single anonymous peer review
Peer reviewer comments 2
Editor who approved publication: Professor Charles V Pollack
Su Jiang,1,* Feng Zhao,2,* Yan Liang,2 Sulei Wang,2 Qiuyue Xu,3 Ruilin Wang,4 Tianchen Wu,2 Hui Yang3
1Department of Rehabilitation Medicine, The Affiliated Taizhou People’s Hospital of Nanjing Medical University, Taizhou, 225300, People’s Republic of China; 2Department of Neurology, Nanjing Hospital of Chinese Medicine Affiliated to Nanjing University of Chinese Medicine, Nanjing, 210012, People’s Republic of China; 3School of Nursing, Nanjing University of Chinese Medicine, Nanjing, 210023, People’s Republic of China; 4College of Acupuncture, Moxibustion and Orthopedics, Hubei University of Chinese Medicine, Wuhan, 430000, People’s Republic of China
*These authors contributed equally to this work
Correspondence: Hui Yang, School of Nursing, Nanjing University of Chinese Medicine, No. 138 of Xianlin Road, Qixia District, Nanjing, 210023, People’s Republic of China, Tel +86 25 85811993, Email [email protected] Tianchen Wu, Department of Neurology, Nanjing Hospital of Chinese Medicine Affiliated to Nanjing University of Chinese Medicine, No. 157 Daming Road, Qinhuai District, Nanjing, 210012, People’s Republic of China, Tel +86 25 5227 6666, Email [email protected]
Objective: This study aimed to develop and validate a dynamic online nomogram for predicting inpatient fall risk using data from a Dryad database cohort to strengthen fall prevention strategies and enhance patient safety in hospital settings.
Methods: We analyzed data from a cohort study conducted at Fukushima Medical University Hospital, with external validation using an independent dataset from Taizhou People’s Hospital (2019– 2023, n=2000). Following multiple imputation, 9470 cases were included and divided into training (n=6631) and validation (n=2839) sets. LASSO regression identified fall-associated factors, leading to development of two predictive models using binomial logistic regression. Model 1 incorporated all selected variables, while Model 2 emphasized clinically relevant factors. Discriminatory power, calibration, and clinical decision curve analysis were conducted for both models.
Results: LASSO regression identified 14 key variables, reduced to 11 in Model 1 and 6 clinically relevant variables in Model 2. Both models demonstrated comparable performance (Z=1.152, p=0.249), with Model 2 selected for clinical applicability. Bootstrap validation showed strong performance with AUC of 0.801 (training set) and 0.796 (validation set). Calibration was adequate (Hosmer-Lemeshow test p> 0.05). Decision curve analysis indicated potential intervention benefit for predicted probabilities of 1– 95.1% (training) and 1– 89.2% (validation). External validation in 2000 patients demonstrated robust generalizability (AUC=0.87, 95% CI: 0.80– 0.93).
Conclusion: We developed a predictive model for assessing fall risk among hospitalized patients. This model supports individualized patient evaluations, assists in identifying high-risk patients, and may contribute to reducing fall incidence in hospital settings.
Keywords: dynamic nomogram, fall risk assessment, hospital fall prevention, inpatient falls, patient safety, prediction model
Introduction
Falls can result in physical injuries and adversely affect patients’ quality of life. They are a common issue in both community and hospital settings, particularly among older adults, with over 50% of individuals aged 80 years and older experiencing at least one fall annually.1 Inpatient falls not only impede recovery but also contribute to avoidable disputes and diminish patient confidence in healthcare providers.
Falls occurring in hospitals or nursing homes are classified as institution-acquired falls.2 In hospital settings, the incidence of falls is 3% among adults and 7.3% among older adults (≥ 60 years).3 Inpatient falls continue to be a significant challenge in hospital management.4 A retrospective analysis of the NRLS database, which includes adverse event reports from 472 healthcare organizations, indicated that falls accounted for 32.3% of all reported patient safety incidents.5 Multiple factors contribute to inpatient falls, including patient history, such as dementia, stroke, or prior falls; medication history, including the use of psychoactive drugs, sedatives, and antidepressants; level of care dependency; and wheelchair use.6–9
Several approaches have been developed for fall risk prediction in hospitalized elderly patients, including sensor-based models using wearable devices,10 EMR-based interventions with automated alerts,11 and population-specific models for specialized groups such as hemodialysis patients.12 However, these models have limitations hindering clinical adoption: sensor-based approaches require specialized equipment impractical for routine use, many EMR-based models target specific populations or require extensive data inputs, and few provide real-time accessibility at the point of care. Recent systematic reviews have shown that AI-based fall risk prediction models can achieve accuracies exceeding 70%, though most focus on community-dwelling populations or require specialized sensor equipment, limiting their hospital applicability.13 This study developed a web-based nomogram using readily available clinical variables selected through statistical optimization and clinical relevance assessment. We compared comprehensive and simplified versions to balance accuracy with usability, creating a tool accessible through standard browsers for real-time clinical decision-making.
Effective inpatient fall prevention depends on improving nursing assessments. The use of fall risk assessment tools to identify high-risk patients, early detection of fall risk factors, and timely nursing interventions can significantly reduce fall incidence. The Morse Fall Scale is a widely utilized clinical tool for assessing fall risk.14
A predictive model for inpatient fall risk was developed and presented as a nomogram in this study. Static and dynamic nomograms are widely utilized in clinical prediction data assessment.15 Among dynamic nomograms, online versions offer distinct advantages, allowing healthcare providers to efficiently assess patient fall risk using mobile devices or computers.
Materials and Methods
Participants
Data from a cohort study conducted at Fukushima Medical University Hospital in Japan were analyzed in this study. Hayakawa et al shared and transferred the dataset, along with its associated copyright, to the Dryad public database.16 Following the terms of service of the Dryad public database, this dataset was available for secondary analysis and novel research applications. A total of 9957 adult patients hospitalized at Fukushima Medical University Hospital over a one-year period (August 2008 – September 2009) were included in this study. Informed consent was obtained from all patients upon admission. Clinical trial number: not applicable. External Validation Dataset: To address generalizability concerns and validate model performance across different healthcare settings, we conducted external validation using an independent dataset from Taizhou People’s Hospital (2019–2023, four-year period). The required sample size for external validation was calculated using the pmsampsize package with the following parameters: C-statistic = 0.79, prevalence = 0.023, and 6 predictor variables. Based on the calculation result of 1878 patients, we selected 2000 hospitalized patients using stratified random sampling to ensure representativeness across key demographic and clinical variables.
Measurements
Clinical data were collected at admission through a structured questionnaire administered via face-to-face interviews conducted by nurses and physicians. Variable Definitions: Cognitive dysfunction was defined as any documented history of cognitive impairment in medical records, including diagnosed conditions such as dementia, mild cognitive impairment, or delirium. This information was obtained through comprehensive medical history review and clinical assessment during admission. Wheelchair use was recorded as a binary variable (yes/no) based on the patient’s requirement for wheelchair assistance for mobility at admission, determined through direct clinical observation and assessment of mobility status. Activities of daily living (ADL) were assessed using seven specific functional activities: standing, sitting, dressing, eating, toileting, evacuation, and face washing. Each activity was evaluated by trained nursing staff to determine whether the patient could perform it independently or required assistance. Patients needing help with any single activity were classified as having “low ADL level”. Manual Muscle Testing (MMT) was performed by qualified healthcare professionals using standardized manual muscle testing protocols. Lower extremity muscle strength was assessed bilaterally, with muscle impairment defined as an MMT score below 4.17 Medication use was systematically documented based on active prescriptions at admission, including laxatives, sedatives, hypnotics, and psychotropic drugs. Each medication category was recorded as present or absent based on current prescription status. Fall history was defined as any documented fall events prior to the current hospitalization, obtained through patient interview and medical record review. All assessments were conducted using standardized protocols to ensure consistency and reliability of data collection across all participants.
Statistical Analysis
Data analysis was conducted using R (version R-4.2.1)18 and RStudio (version 2022.07.1 Build 554).19 Descriptive statistics for categorical data were reported as frequencies (%). Normally distributed continuous variables were presented as mean ± standard deviation (mean ± SD), while non-normally distributed continuous variables were expressed as median (M [P25, P75]). Baseline characteristics between the two groups were compared using statistical tests appropriate to the variable type and distribution. Independent-samples t-tests were applied to normally distributed data, while the Mann–Whitney U-test was used for non-normally distributed data. Categorical variables were analyzed using chi-square tests. A two-sided p < 0.05 was considered statistically significant. Relevant R packages utilized for analysis are specified in subsequent sections. The analysis followed structured steps to validate the hypotheses.
Following the exclusion of 487 patients due to missing follow-up data and refusal to provide personal information, the final dataset included 9470 patients. To mitigate potential bias resulting from missing values, multiple imputation was performed using the MICE (Multivariate Imputation via Chained Equations) package in R. The imputation process was executed with the following parameters: maximum iterations (maxit) set to 500, predictive mean matching (meth = “pmm”) as the imputation method, and a random seed (seed) of 50. By generating multiple complete datasets, multiple imputation reduces the influence of missing data, thereby enhancing the accuracy of subsequent analyses.
After imputing missing values, the 9470 patients were randomly assigned to a training set (70%) and a validation set (30%). Variable selection for model development was conducted on the training set using LASSO (Least Absolute Shrinkage and Selection Operator) regression analysis, which regulates the number of included variables by adjusting the penalty coefficient (λ).20 A workflow overview is presented in Figure 1. LASSO coefficient paths and ten-fold cross-validation plots are shown in Figure 2A, and the optimal cut-off is marked by the black dashed line in Figure 2B. The optimal λ value was determined through a systematic optimization process using the Extended Bayesian Information Criterion (EBIC).21,22 LASSO Parameter Optimization Process: The LASSO regression path was computed across a sequence of λ values ranging from λ_max (where all coefficients are zero) to λ_min (typically λ_max/1000). For each λ value, we calculated the corresponding EBIC using the formula:

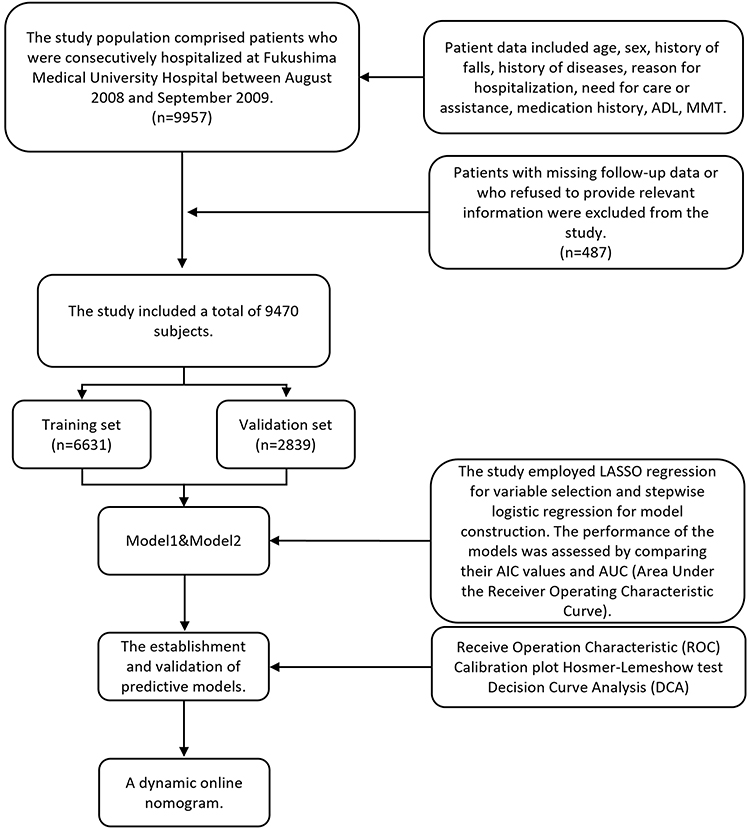 |
Figure 1 Research flowchart. |
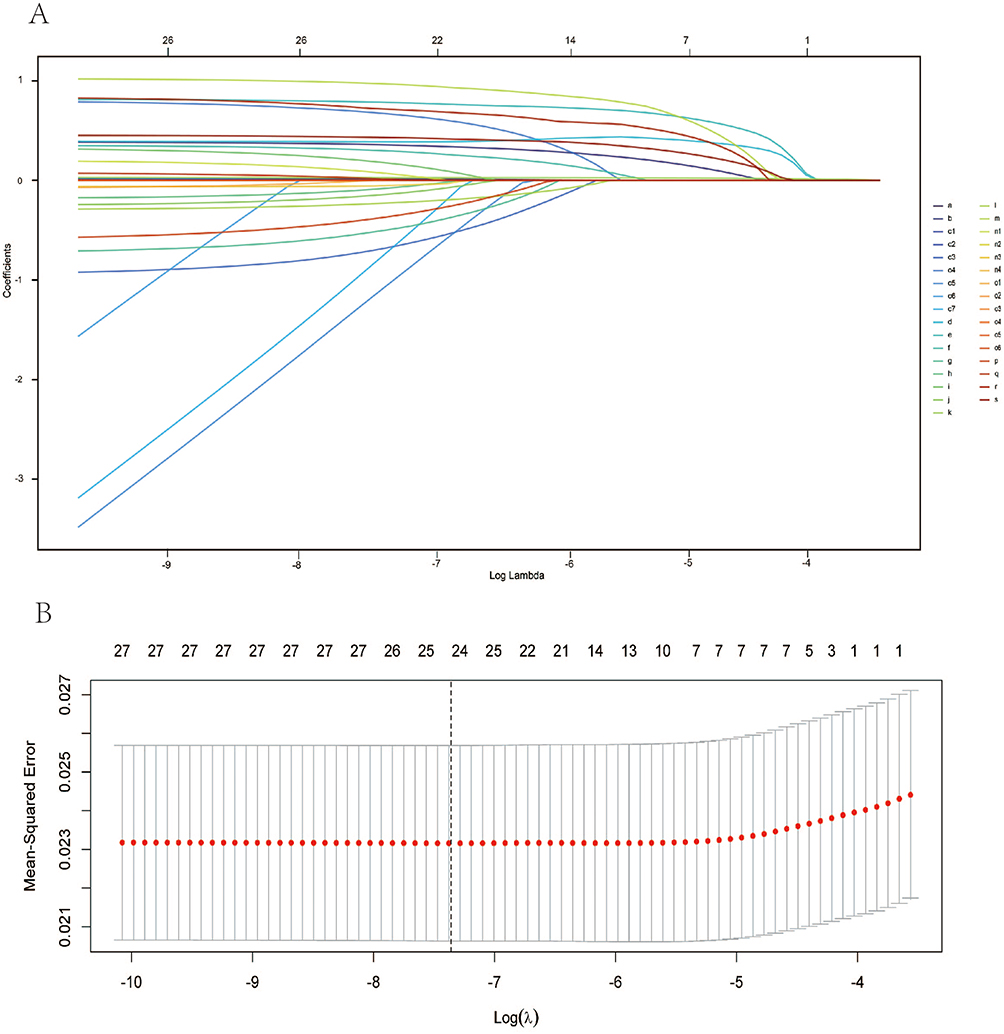 |
Figure 2 LASSO regression variable selection and cross-validation for fall risk prediction model. (A) LASSO path diagram. Coefficient trajectories across log(λ) values. Numbers at top indicate non-zero coefficients at each λ. Variable key: a = ADL total; b = C-Age; c1-c7 = visual acuity (one-hot encoded); d = needs help to move; e = history of falls; f = hypnotic medication use; g = inhibition; h = laxative medication use; i = MMT left; j = MMT right; k = length of hospital stay; l = planned surgery; m = psychotropic medication use; n1-n4 = rehabilitation categories (one-hot encoded); o1-o6 = remote care system categories (one-hot encoded); p = sedative medication use; q = sex; r = cognitive dysfunction; s = wheelchair use. (B) Cross-validation plot for optimal λ selection using EBIC. Gray bars show 95% confidence intervals. Vertical dashed line indicates optimal λ value. Numbers at top show variables retained at each λ, with 14 variables selected in final model. |
where k represents the number of non-zero coefficients, n is the sample size (6631 in the training set), p is the total number of predictors (19 variables), and γ is the EBIC parameter set to 0.5. The γ parameter controls the strength of the penalty for model complexity, with γ = 0.5 providing a balance between model fit and sparsity that is particularly suitable for clinical prediction models. EBIC Threshold Selection Rationale: EBIC was chosen over traditional cross-validation methods for several reasons: (1) it provides a more stable variable selection in finite samples, (2) it explicitly penalizes model complexity through the γ parameter, reducing the risk of overfitting, and (3) it has been demonstrated to be more effective in high-dimensional settings where p approaches n. The optimal λ value was selected as the one that minimized the EBIC, corresponding to the point indicated by the black dashed line in Figure 2B. This selection process resulted in 14 variables with non-zero coefficients, which were subsequently used to construct the logistic regression model through backward stepwise selection.
The shortlisted variables underwent backward stepwise logistic regression analysis to develop Model 1. The significance of Model 1 variables was ranked using the R package “tornado.” A reduced model, Model 2, was then constructed by selecting only the most influential variables. A comparison of both models was performed to determine the optimal model for predicting inpatient fall risk.
The models’ performance was assessed using the receiver operating characteristic (ROC) curve and the area under the curve (AUC). An AUC value above 0.75 indicates strong discriminative ability, while values between 0.5 and 0.75 indicate moderate performance. The model’s calibration was evaluated through the Hosmer-Lemeshow test, which divides the dataset into 10 deciles based on predicted probabilities and compares actual event frequencies with predicted values. A well-calibrated model should demonstrate a linear relationship with an intercept of 0 and a slope of 1. While AUC measures overall accuracy, it may not fully capture prognostic performance. To address this limitation, a loss function was applied to assess statistical inference quality, and decision curve analysis (DCA) was employed to evaluate clinical utility and decision-making benefits.23 The final prediction model was visually represented using a nomogram.24 The model development and reporting of the result adhered to the TRIPOD statement guidelines.25
External Validation
We performed external validation using data from 2000 patients at Taizhou People’s Hospital, collected between 2019 and 2023. Patients were selected using stratified random sampling to ensure representativeness. Model performance was assessed using ROC analysis with 1000 bootstrap iterations, confusion matrix analysis, and calibration assessment.
Results
Missing Value Analysis and Baseline Characteristics of the Study Participants After Multiple Imputation
The results of the missing value analysis are presented in Supplementary Figure 1. Following multiple imputation, the fitted curves of the imputed data displayed variations. As presented in Supplementary Figure 2, the fitted curve from the fifth imputation most closely resembled the original data. Consequently, imputed values with action = 5 were selected to complete the original dataset. The baseline characteristics of the 9470 patients after multiple imputation are presented in Table 1. The dataset was partitioned into a training set (n = 6631) and a validation set (n = 2839) in a 7:3 ratio. In the training set, 6465 patients did not experience a fall, while 166 did. In the validation set, 2775 patients did not experience a fall, whereas 64 did.
 |
Table 1 Baseline Characteristics of Subjects Based on Multiple Interpolation |
LASSO Regression Analysis for Variable Selection and Predictive Model Construction
Nineteen variables listed in Table 1—including gender, C-age, duration of hospital stay, planned surgery, history of falls, cognitive dysfunction, inhibition, visual acuity, ADL total, MMT right, MMT left, wheelchair use, need for movement assistance, rehabilitation, laxative use, sedative use, hypnotic use, psychotropic medication, and remote caring—were incorporated into the model. To meet the requirements of LASSO regression analysis, categorical and multi-categorical variables were converted into dummy variables before inclusion. LASSO regression analysis paths and cross-validation plots were generated, and the penalty coefficient was adjusted (Figure 2A). The cutoff point was determined based on the EBIC, as indicated by the black dashed line on the X-axis in Figure 2B. This selection process resulted in 14 variables with non-zero coefficients: age, duration of stay in hospital, planned surgery, history of falls, cognitive dysfunction, inhibition, ADL total, MMT right, MMT left, wheelchair use, need for movement assistance, and use of sedatives, hypnotics, and psychotropic medications. These variables were subsequently used to construct a logistic regression analysis model. A backward stepwise regression analysis was then performed, ultimately refining the selection to 11 variables: C-age, duration of stay in hospital, planned surgery, history of falls, cognitive dysfunction, MMT right, MMT left, wheelchair use, need for movement assistance, and hypnotic and psychotropic medication. These variables formed the basis for Predictive Model 1 (Figure 3A).
 |
Figure 3 (A) Stepwise backward regression-forest map for Model 1; (B) Bar chart of the importance of variables; (C) Stepwise backward regression-forest map for Model 2. |
A sensitivity analysis was performed using the Tornado package to identify the most influential variables. The results were compared with those obtained through backward stepwise selection. A fall prediction model for hospitalized patients was developed using a minimal set of variables, taking into account clinical applicability and model simplicity. The selection was based on the Cumulative Deviance Explained (CDE) and Marginal Deviance Explained (MDE) metrics, which quantify the contribution of each variable to the model coefficients.26,27 The six variables with the greatest impact were duration of hospital stay, C-age, history of falls, wheelchair use, psychotropic medication, and cognitive dysfunction (Figure 3B). Model 2 was developed using these six key variables identified as most influential in the analysis (Figure 3C).
Evaluating the Discriminative Ability of Model 1 vs Model 2
A comparative analysis was conducted to evaluate the discriminative ability of Model 1 and Model 2, with the results displayed in Figure 4A. Model 1 (AIC: 1313.9) demonstrated a discriminative power with an AUC of 0.802 [95% CI (0.764, 0.841)] (dashed line), whereas Model 2 (AIC: 1316.4) exhibited an AUC of 0.796 [95% CI (0.757, 0.834)] (solid line). Variance analysis indicated no statistically significant difference between the two models (Z = 1.152, p = 0.249). Thus, both models demonstrated comparable predictive performance for in-hospital fall events.
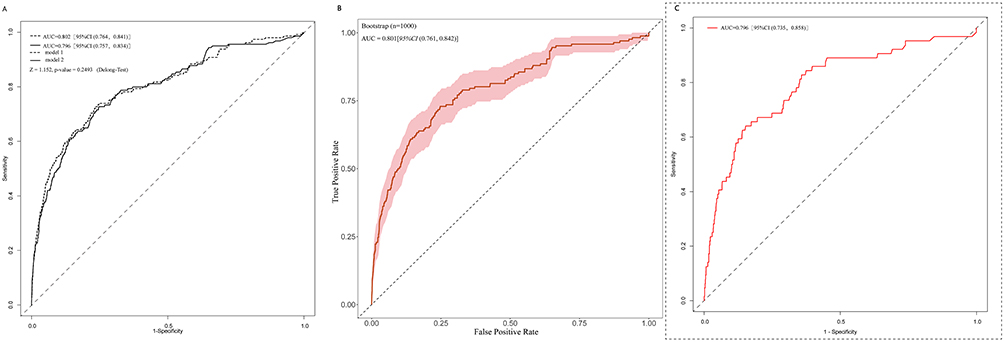 |
Figure 4 (A) Difference analysis of discrimination between model 1 and model 2; (B) Bootstrap verification of model 2 discrimination; (C) Discriminative power of prediction model 2 (on the validation set). |
Given the comparable discriminative power of both models, Model 2 was selected for nomogram construction due to its parsimony and reduced number of variables. Bootstrap validation was performed on Model 2 with 1000 iterations, yielding an AUC of 0.801 [95% CI (0.761, 0.842)] (Figure 4B). Notably, Model 2 also achieved an AUC of 0.796 [95% CI (0.735, 0.858)] in the validation dataset (Figure 4C).
Evaluating the Calibration of Model 2
The calibration of Model 2 was evaluated using the Hosmer-Lemeshow test in both the training and validation datasets (Figure 5). Calibration was assessed by determining the calibration slope across 10 deciles of predicted risk, ranging from the lowest to the highest. In the training dataset (Figure 5A), the Hosmer-Lemeshow test produced a Chi-square statistic of 12.334 with a p-value of 0.195. Similarly, in the validation dataset (Figure 5B), the test yielded a Chi-square statistic of 10.692 with a p-value of 0.229. These findings indicate that Model 2 demonstrates good calibration, as the predicted probabilities closely correspond to the observed fall rates.
 |
Figure 5 Hosmer-Lemeshow calibration curve for predicting the risk of in-hospital falls of inpatients by prediction model 2. (A) for Training set. (B) for Validation set. |
Clinical Application and Visualization of a Fall Prediction Model
The clinical utility of the developed prediction model was assessed using DCA (Figure 6). In the training dataset (dashed line) and validation dataset (solid line), the DCA curves indicated a potential benefit of intervention within predicted probability ranges of 1% to 95.1% and 1% to 89.2%, respectively. Beyond these thresholds, substantial fluctuations in the curves may influence predictive probabilities, resulting in the selection of 0.951 and 0.892 as cutoff values.
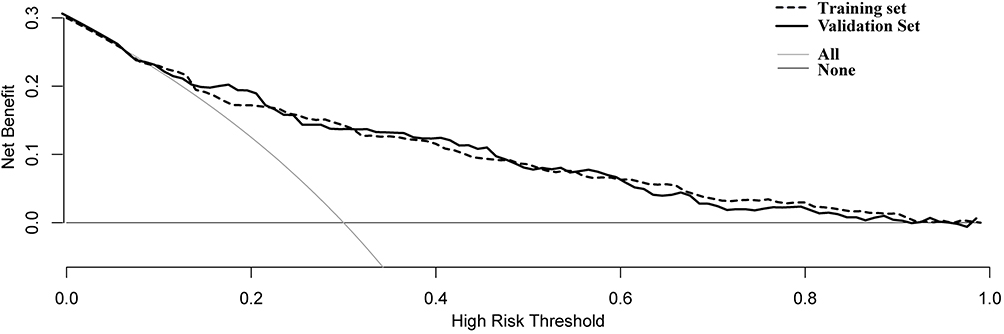 |
Figure 6 Decision curve analysis of a clinical prediction model (model 2) for in-hospital fall risk in inpatients. The blue curve represents the training dataset, while the red curve represents the validation dataset. |
A nomogram was developed to visually represent and facilitate the application of the fall prediction model. The total score is determined by summing the scores assigned to each predictive risk factor in the model. Using this total score, the probability axis can be referenced to estimate a patient’s likelihood of experiencing an in-hospital fall (Supplementary Figure 3). To enhance clinical usability, a dynamic nomogram was implemented using the DynNom and shiny packages in R, enabling interactive visualization of fall risk prediction (Supplementary Figure 4). This dynamic nomogram is accessible through an online web application.28
External Validation Results
External validation was conducted using 2000 patients from Taizhou People’s Hospital (2019–2023). The model demonstrated robust discriminative performance with an AUC of 0.87 (95% CI: 0.80–0.93) based on 1000 bootstrap iterations (Figure 7A). The confusion matrix analysis revealed an overall accuracy of 98.15%, correctly classifying 1963 out of 2000 patients (Figure 7B). Model performance metrics showed high specificity of 99.85% (1961/1964) and low sensitivity of 5.56% (2/36), with a positive predictive value of 40.00% (2/5) and negative predictive value of 98.30% (1961/1995).
 |
Figure 7 (A) ROC curve of external validation dataset with 1000 bootstrap iterations (n=2000). (B) Confusion matrix of external validation dataset (n=2000). The bold numbers denote the counts of true positives (1961) and true negatives (34), emphasizing the model’s accuracy in correctly classifying the majority of cases. The percentages indicate the distribution of predictions across the actual classes, with 98% of the predictions correctly identifying the negative class (0) and 94.4% correctly identifying the positive class (1). |
The fall incidence rate in the external validation cohort was 1.8% (36/2000), which closely aligned with the original development cohort (2.3–2.5%), confirming consistency across different healthcare settings and time periods. While the model demonstrated excellent specificity in identifying patients at low risk for falls, the low sensitivity indicates limited ability to capture all patients who would actually experience falls. These findings support the model’s clinical utility for ruling out fall risk in the majority of patients while highlighting the need for additional clinical judgment in high-risk assessment.
Discussion
Falls among hospitalized patients represent a critical healthcare concern, contributing to increased morbidity, mortality, and substantial healthcare expenditures. To address this issue, a dynamic online nomogram was developed and validated for predicting inpatient fall risk. Our nomogram’s superior performance compared to established tools (AUC 0.62–0.76)29–31 and competitive results with machine learning models can be attributed to LASSO-optimized variable selection using objective clinical data. Unlike complex algorithms such as random forest, our approach maintains clinical interpretability while achieving robust discriminative performance, addressing the critical balance between accuracy and practical usability in hospital settings. This predictive model integrates six key factors: age, duration of stay in hospital, history of falls, cognitive dysfunction, wheelchair use, and psychotropic medication use. The association between advanced age and fall risk has been well-established in the literature. A systematic review and meta-analysis by Deandrea et al consistently demonstrated a correlation between increasing age and heightened fall risk across diverse healthcare settings.32 The present findings further quantify this relationship within hospital environments, indicating that patients over 75 years of age have a significantly higher fall risk (OR = 1.89, 95% CI 1.34–2.67, p < 0.001). These results align with recent investigations by Toye et al, which detail the impact of age-related physiological changes on fall susceptibility.33
Beyond age, the duration of hospitalization emerged as a significant predictor in this analysis. This finding expands on the work of Najafpour et al, whose prospective nested case-control study identified a strong association between prolonged hospital stays and increased fall risk.34 These findings are refined by the present study by offering precise temporal risk estimates, demonstrating that each additional week of hospitalization is associated with an approximate 8% increase in fall risk (OR = 1.08, 95% CI 1.04–1.12, p < 0.001). Notably, the influence of prior falls on subsequent fall risk was particularly pronounced. The analysis indicated that patients with a history of falls faced a 2.20-fold increased risk of recurrence (95% CI 1.48–3.25, p < 0.001). This observation is consistent with the meta-analysis by Deandrea et al, which reported comparable risk ratios in acute care settings.32 Such consistency underscores the necessity of incorporating fall history into initial patient assessments to enhance fall prevention strategies.
Cognitive dysfunction was identified as a significant predictor, expanding on the foundational work of Tinetti et al.35 The analysis indicated that cognitive impairment nearly doubled the risk of falls (OR = 1.98, 95% CI 1.11–3.53, p = 0.021). Additional support for these findings is provided in the systematic review by Kropelin et al, which identified cognitive impairment as a major risk factor in institutional settings.36 The impact of wheelchair use on mobility limitations was also highlighted in this study. While the WHO Quality of Life Assessment previously documented the effects of pain and discomfort on posture and transfer efficiency among wheelchair users, the present study quantified this risk specifically in the hospital setting.37 Findings indicated that individuals using wheelchairs experienced a 2.15-fold increase in fall risk (95% CI 1.42–3.26, p < 0.001). Furthermore, psychotropic medication use was confirmed as a significant risk factor, reinforcing previous research in this domain. A systematic review by Harlein et al established a strong association between psychotropic medications and falls, and the present study demonstrated that patients who had been prescribed these medications had a 2.64-fold increased fall risk (95% CI 1.66–4.22, p < 0.001).38 These findings emphasize the necessity of comprehensive medication review as a critical component of fall prevention strategies.
Limitations of the Study
Despite the promising performance of the predictive model, several key limitations must be considered. First, this study was conducted at a single medical center in Japan, potentially restricting the generalizability of the findings to healthcare settings with different demographic characteristics and clinical practices. The homogeneity of the study population may not fully capture the diversity observed in other medical environments. Second, although the model incorporates six essential predictive factors, certain relevant variables were not included due to data limitations. Unmeasured factors, such as environmental conditions (eg, room lighting, flooring conditions, bed height), staffing patterns, daily fluctuations in patient condition, temporal variations in mobility status and specific medication changes, may also influence fall risk. The exclusion of these factors may potentially lead to underestimation of fall risk, particularly in patients whose risk profile changes significantly during their hospital stay. Future research should prioritize systematic collection of environmental assessments and real-time monitoring of dynamic risk factors to develop more comprehensive prediction models. Additionally, our retrospective data lacked subjective assessment components required for established fall risk assessment tools (eg, mental status, gait evaluation), preventing direct head-to-head comparison with instruments like STRATIFY, Morse Fall Scale, or Hendrich II Fall Risk Model. Nevertheless, our nomogram’s performance (AUC: 0.801 in training, 0.796 in validation) compares favorably to these conventional tools, which typically demonstrate AUC values of 0.62–0.76 in hospitalized patients.29–31 Future prospective studies should incorporate comprehensive data collection to enable rigorous comparisons with established assessment instruments. Third, our study introduced potential selection bias through exclusion of 487 patients due to missing data and reliance on admission-time structured questionnaires, which may not capture dynamic risk changes during hospitalization. While multiple imputation was employed to address missing data, systematic differences between included and excluded patients may affect the generalizability of our findings. The retrospective study design may have introduced selection bias and restricted the ability to assess dynamic risk factors that fluctuate during hospitalization. Furthermore, temporal variations in fall risk throughout the day and across different hospitalization phases were not comprehensively examined in the current model. Although originally developed using Japanese data (2008–2009), external validation with contemporary Chinese data from Taizhou People’s Hospital (2019–2023) demonstrated robust cross-cultural and temporal generalizability. However, broader multi-center validation across diverse populations and healthcare systems remains necessary to establish global applicability.
Future Perspectives
Expanding upon these findings while recognizing the outlined limitations, several promising research directions warrant further exploration. First, multi-center validation studies conducted across various healthcare systems and geographical regions are necessary to establish the broader applicability of the predictive model. Incorporating diverse patient populations and clinical environments in these studies would enhance the model’s generalizability. Second, future investigations should explore additional risk factors, particularly those associated with environmental conditions, staffing patterns, and temporal fluctuations in fall risk. The integration of real-time monitoring systems and wearable technologies could provide valuable data for refining predictive accuracy. Third, prospective studies assessing the application of the nomogram in clinical practice would be instrumental in evaluating its influence on fall prevention strategies and healthcare resource utilization. Additionally, cost-effectiveness analyses of implementing this predictive tool across different healthcare settings would offer critical insights for healthcare administrators and policymakers. The development of automated risk assessment systems integrated with electronic health records offers a promising approach, potentially improving the efficiency and accuracy of fall risk prediction in clinical practice.
Conclusion
A predictive model incorporating six variables—duration of stay in hospital, C-age, history of falls, wheelchair use, psychotropic medication use, and cognitive dysfunction—was developed and presented as a dynamic nomogram for estimating in-hospital fall risk. As a decision-support tool accessible via mobile devices, this nomogram facilitates early risk identification and informs targeted interventions. Prospective clinical trials are needed to evaluate its effectiveness in reducing fall rates and improving patient safety outcomes.
Abbreviations
LASSO, Least Absolute Shrinkage and Selection Operator; DCA, Decision Curve Analysis; AUC, Area Under the Curve; ADL, Activities of Daily Living; MMT, Manual Muscle Test; MICE, Multivariate Imputation via Chained Equations; EBIC, Extended Bayesian Information Criterion; ROC, Receiver Operating Characteristic; TRIPOD, Transparent Reporting of a multivariable prediction model for Individual Prognosis Or Diagnosis; CDE, Cumulative Deviance Explained; MDE, Marginal Deviance Explained.
Data Sharing Statement
The data that support the findings of this study are openly available in Dryad public database (https://doi.org/10.5061/dryad.16h8j), reference number [doi: 10.1136/bmjopen-2014-005385].
Ethics Approval and Consent to Participate
This study analyzed open-source data that was originally collected with ethical approval from the ethics board of Fukushima Medical University (approval registration No.726). The original data collection, including informed consent procedures and questionnaire validation, is documented in [doi: 10.1136/bmjopen-2014-005385]. Our secondary analysis was conducted in accordance with the Declaration of Helsinki. This study was approved by the Ethics Committee of the Affiliated Taizhou People’s Hospital of Nanjing Medical University (approval number: KY2024-027-01).
Acknowledgments
We appreciate Dr. Hayakawa and his research team for making their research data available online (https://doi.org/10.5061/dryad.16h8j).
Funding
National Natural Science Foundation of China (81904112); the project Ningwei Traditional Chinese Medicine (No.6, 2024); the Natural Science Foundation of Jiangsu Province (G rants No. BK20190136); the Natural Science Foundation of the Jiangsu Higher Education Institutions of China (No.24KJB360012).
Disclosure
The authors declared no potential conflicts of interest with respect to the research, authorship, and/or publication of this article.
References
1. Bor A, Matuz M, Csatordai M, et al. Medication use and risk of falls among nursing home residents: a retrospective cohort study. Int J Clin Pharm. 2017;39(2):408–415. doi:10.1007/s11096-017-0426-6
2. Hoedl M, Eglseer D, Bernet N, et al. Which factors influence the prevalence of institution-acquired falls? Results from an international, multi-center, cross-sectional survey. J Nurs Scholarsh. 2022;54(4):462–469. doi:10.1111/jnu.12758
3. Rao WW, Zong QQ, Lok GKI, et al. Prevalence of falls in adult and older adult psychiatric patients in China: a systematic review and comprehensive meta-analysis of observational studies. Psychiatry Res. 2018;266:18–25. doi:10.1016/j.psychres.2018.05.016
4. Spetz J, Brown DS, Aydin C. The economics of preventing hospital falls: demonstrating ROI through a simple model. J Nurs Adm. 2015;45(1):50–57. doi:10.1097/NNA.0000000000000154
5. Healey F, Scobie S, Oliver D, Pryce A, Thomson R, Glampson B. Falls in English and Welsh hospitals: a national observational study based on retrospective analysis of 12 months of patient safety incident reports. Qual Saf Health Care. 2008;17(6):424–430. doi:10.1136/qshc.2007.024695
6. Kosse NM, de Groot MH, Vuillerme N, Hortobagyi T, Lamoth CJ. Factors related to the high fall rate in long-term care residents with dementia. Int Psychogeriatr. 2015;27(5):803–814. doi:10.1017/S104161021400249X
7. Westerlind B, Ostgren CJ, Molstad S, Midlov P, Hagg S. Use of non-benzodiazepine hypnotics is associated with falls in nursing home residents: a longitudinal cohort study. Aging Clin Exp Res. 2019;31(8):1087–1095. doi:10.1007/s40520-018-1056-0
8. Mazur K, Wilczynski K, Szewieczek J. Geriatric falls in the context of a hospital fall prevention program: delirium, low body mass index, and other risk factors. Clin Interv Aging. 2016;11:1253–1261. doi:10.2147/CIA.S115755
9. O’Neil CA, Krauss MJ, Bettale J, et al. Medications and patient characteristics associated with falling in the hospital. J Patient Saf. 2018;14(1):27–33. doi:10.1097/PTS.0000000000000163
10. Wang B, Liu Y, Lu A, Wang C. Application of wearable sensors in constructing a fall risk prediction model for community-dwelling older adults: a scoping review. Arch Gerontol Geriatr. 2025;129:105689. doi:10.1016/j.archger.2024.105689
11. Weber V, White A, McIlvried R. An electronic medical record (EMR)-based intervention to reduce polypharmacy and falls in an ambulatory rural elderly population. J Gen Intern Med. 2008;23(4):399–404. doi:10.1007/s11606-007-0482-z
12. Li L, Xu W, Fang Y, et al. Construction and validation of a fall risk prediction model in elderly maintenance hemodialysis patients: a multicenter prospective cohort study. Ren Fail. 2025;47(1):2455524. doi:10.1080/0886022X.2025.2455524
13. Gonzalez-Castro A, Leiros-Rodriguez R, Prada-Garcia C, Benitez-Andrades JA. The applications of artificial intelligence for assessing fall risk: systematic review. J Med Internet Res. 2024;26:e54934. doi:10.2196/54934
14. Baek S, Piao J, Jin Y, Lee SM. Validity of the Morse fall scale implemented in an electronic medical record system. J Clin Nurs. 2014;23(17–18):2434–2440.
15. Jalali A, Alvarez-Iglesias A, Roshan D, Newell J. Visualising statistical models using dynamic nomograms. PLoS One. 2019;14(11):e0225253. doi:10.1371/journal.pone.0225253
16. Hayakawa T, Hashimoto S, Kanda H, Hirano N, Kurihara Y, Kawashima T. Risk factors of falls in inpatients and their practical use in identifying high-risk persons at admission: Fukushima Medical University Hospital cohort study. BMJ Open. 2014;4(8):e005385. doi:10.1136/bmjopen-2014-005385
17. Rider LG, Koziol D, Giannini EH, et al. Validation of manual muscle testing and a subset of eight muscles for adult and juvenile idiopathic inflammatory myopathies. Arthritis Care Res. 2010;62(4):465–472. doi:10.1002/acr.20035
18. R Core Team. R: a language and environment for statistical computing. Vienna, Austria: R Foundation for Statistical Computing; 2022. Available from: https://www.R-project.org/.
19. RStudio Team. RStudio: integrated development environment for R. Boston, MA: RStudio, PBC; 2022. Available from: https://posit.co/download/rstudio-desktop/.
20. Tang G, Qi L, Sun Z, et al. Evaluation and analysis of incidence and risk factors of lower extremity venous thrombosis after urologic surgeries: a prospective two-center cohort study using LASSO-logistic regression. Int J Surg. 2021;89:105948. doi:10.1016/j.ijsu.2021.105948
21. Sauerbrei W, Royston P, Binder H. Selection of important variables and determination of functional form for continuous predictors in multivariable model building. Stat Med. 2007;26(30):5512–5528. doi:10.1002/sim.3148
22. Kidd AC, McGettrick M, Tsim S, Halligan DL, Bylesjo M, Blyth KG. Survival prediction in mesothelioma using a scalable lasso regression model: instructions for use and initial performance using clinical predictors. BMJ Open Respir Res. 2018;5(1):e000240. doi:10.1136/bmjresp-2017-000240
23. Wu J, Zhang H, Li L, Hu M, Chen L, Xu B. Song Q: a nomogram for predicting overall survival in patients with low-grade endometrial stromal sarcoma: a population-based analysis. Cancer Commun. 2020;40(7):301–312. doi:10.1002/cac2.12067
24. Park SY. Nomogram: an analogue tool to deliver digital knowledge. J Thorac Cardiovasc Surg. 2018;155(4):1793. doi:10.1016/j.jtcvs.2017.12.107
25. Moons KG, Altman DG, Reitsma JB, et al. Transparent Reporting of a multivariable prediction model for Individual Prognosis or Diagnosis (TRIPOD): explanation and elaboration. Ann Intern Med. 2015;162(1):W1–73. doi:10.7326/M14-0698
26. de Oliveira AMB, Binner JM, Mandal A, Kelly L, Power GJ. Using GAM functions and Markov-switching models in an evaluation framework to assess countries’ performance in controlling the COVID-19 pandemic. BMC Public Health. 2021;21(1):2173. doi:10.1186/s12889-021-11891-6
27. Merkle EC, Furr D, Rabe-Hesketh S. Bayesian comparison of latent variable models: conditional versus marginal likelihoods. Psychometrika. 2019;84(3):802–829. doi:10.1007/s11336-019-09679-0
28. Wu T, Jiang S, Zhao F, Yang H, Liang Y, Wang S. Hospital fall prediction dynamic nomogram [web application]. 2024. Available from: https://wutianchen2006.shinyapps.io/Hospital_fall_prediction/.
29. Aranda-Gallardo M, Morales-Asencio JM, Canca-Sanchez JC, et al. Instruments for assessing the risk of falls in acute hospitalized patients: a systematic review and meta-analysis. BMC Health Serv Res. 2013;13:122. doi:10.1186/1472-6963-13-122
30. Strini V, Schiavolin R, Prendin A. Fall risk assessment scales: a systematic literature review. Nurs Rep. 2021;11(2):430–443. doi:10.3390/nursrep11020041
31. Park SH. Tools for assessing fall risk in the elderly: a systematic review and meta-analysis. Aging Clin Exp Res. 2018;30(1):1–16. doi:10.1007/s40520-017-0749-0
32. Deandrea S, Bravi F, Turati F, Lucenteforte E, La Vecchia C, Negri E. Risk factors for falls in older people in nursing homes and hospitals. A systematic review and meta-analysis. Arch Gerontol Geriatr. 2013;56(3):407–415. doi:10.1016/j.archger.2012.12.006
33. Toye C, Slatyer S, Kitchen S, et al. Bed moves, ward environment, staff perspectives and falls for older people with high falls risk in an acute hospital: a mixed methods study. Clin Interv Aging. 2019;14:2223–2237. doi:10.2147/CIA.S211424
34. Najafpour Z, Godarzi Z, Arab M, Yaseri M. Risk factors for falls in hospital in-patients: a prospective nested case control study. Int J Health Policy Manag. 2019;8(5):300–306. doi:10.15171/ijhpm.2019.11
35. Kropelin TF, Neyens JC, Halfens RJ, Kempen GI, Hamers JP. Fall determinants in older long-term care residents with dementia: a systematic review. Int Psychogeriatr. 2013;25(4):549–563. doi:10.1017/S1041610212001937
36. Skevington SM, Lotfy M, O’Connell KA. Group W: the World Health Organization’s WHOQOL-BREF quality of life assessment: psychometric properties and results of the international field trial. A report from the WHOQOL group. Qual Life Res. 2004;13(2):299–310. doi:10.1023/B:QURE.0000018486.91360.00
37. Tinetti ME, Speechley M, Ginter SF. Risk factors for falls among elderly persons living in the community. N Engl J Med. 1988;319(26):1701–1707. doi:10.1056/NEJM198812293192604
38. Harlein J, Dassen T, Halfens RJ, Heinze C. Fall risk factors in older people with dementia or cognitive impairment: a systematic review. J Adv Nurs. 2009;65(5):922–933. doi:10.1111/j.1365-2648.2008.04950.x
 © 2025 The Author(s). This work is published and licensed by Dove Medical Press Limited. The
full terms of this license are available at https://www.dovepress.com/terms
and incorporate the Creative Commons Attribution
- Non Commercial (unported, 4.0) License.
By accessing the work you hereby accept the Terms. Non-commercial uses of the work are permitted
without any further permission from Dove Medical Press Limited, provided the work is properly
attributed. For permission for commercial use of this work, please see paragraphs 4.2 and 5 of our Terms.
© 2025 The Author(s). This work is published and licensed by Dove Medical Press Limited. The
full terms of this license are available at https://www.dovepress.com/terms
and incorporate the Creative Commons Attribution
- Non Commercial (unported, 4.0) License.
By accessing the work you hereby accept the Terms. Non-commercial uses of the work are permitted
without any further permission from Dove Medical Press Limited, provided the work is properly
attributed. For permission for commercial use of this work, please see paragraphs 4.2 and 5 of our Terms.