Back to Journals » International Journal of General Medicine » Volume 16
Development and Validation of a Diagnostic Model Based on Hypoxia-Related Genes in Myocardial Infarction
Authors Jiang K, Kang L, Jiang A, Zhao Q
Received 23 February 2023
Accepted for publication 18 May 2023
Published 29 May 2023 Volume 2023:16 Pages 2111—2123
DOI https://doi.org/10.2147/IJGM.S407759
Checked for plagiarism Yes
Review by Single anonymous peer review
Peer reviewer comments 2
Editor who approved publication: Prof. Dr. Yuriy Sirenko
Ke Jiang,1,* Ling Kang,1,* Andong Jiang,2 Qiang Zhao1
1Department of Cardiovascular Medicine, The Second Affiliated Hospital of Shandong First Medical University, Tai’an, Shandong, People’s Republic of China; 2Medical Imaging Department, The Second Affiliated Hospital of Shandong First Medical University, Tai’an, Shandong, People’s Republic of China
*These authors contributed equally to this work
Correspondence: Qiang Zhao, Department of Cardiovascular Medicine, The Second Affiliated Hospital of Shandong First Medical University, No. 366, Taishan Street, Tai’an, Shandong, 271000, People’s Republic of China, Tel +86-13583832661, Email [email protected]
Purpose: Myocardial infarction (MI) is a common cardiovascular disease, and its underlying pathological mechanism remains unclear. We aimed to develop a diagnostic model to distinguish different subtypes of MI.
Patients and Methods: The gene expression profiles of MI from the GEO database and hypoxia-related genes (HRGs) from MSigDB were downloaded. Then, the different MI subtypes based on HRGs were identified with unsupervised clustering. The difference of expression patterns and hypoxic-immune status among different subtypes of MI were investigated. The diagnostic model to distinguish the different subtypes of MI was developed and validated.
Results: Based on HRGs, MI samples were divided into two subtypes, cluster A and cluster B. A total of 211 genes showed significant changes in expression between the two subtypes. Cluster A was characterized by high hypoxia status and low immunity status. Based on weighted gene co-expression network analysis, ROC analysis and LASSO regression algorithm, 5 genes were identified as potential diagnostic markers. Finally, a diagnostic model based on these 5 genes was established, which can distinguish the two subtypes well.
Conclusion: The five hub genes, including ANKRD36, HLTF, KIF3A, OXCT1 and VPS13A, may be associated with the different subtypes of MI.
Keywords: myocardial infarction, hypoxia, immune, diagnostic model
Introduction
Myocardial infarction (MI) is one of the leading causes of human mortality.1 MI is characterized by myocardial ischemia and hypoxia caused by coronary artery occlusion, which in turn triggers inflammation and apoptosis.2 Extensive studies support that the inflammatory response and myocardial apoptosis are important in the pathogenesis of acute MI.3 When MI occurs, hypoxia leads to injury and necrosis of cardiomyocytes, which release pro-inflammatory chemokines to recruit inflammatory cells to the infarcted area and remove necrotic cardiomyocytes.2 Although early treatment with reperfusion and pharmacological approaches significantly reduced mortality after MI, in-hospital mortality remained high.4 Therefore, it is desperately warranted to illustrate the underlying pathogenesis of MI.
Hypoxia plays an important role in MI. Myocardial cells undergo ischemia and hypoxia, followed by apoptosis, inflammation of the damaged tissue, and infiltration of immune cells.5 Hypoxia was demonstrated to serve as a possible regulator of the activity of epicardial mesothelial cells after MI.6 Hypoxia can promote neutrophil survival after acute MI.7 Kologrivova et al indicated that cells of the immune system are involved in resolution of inflammation and repair in MI.8 Immunoregulatory therapy may have great potential to accelerate cardiac repair and improve ventricular remodeling after MI. Hence, it is important to explore the relationship between hypoxia, immunity and MI for providing new therapeutic methods.
In this study, we identified different MI subtypes based on hypoxia-related genes and investigated the differences among these MI subtypes. A diagnostic model was developed to distinguish different subtypes of MI, which may be conducive to understand the molecular mechanisms underlying MI and potentially provide an approach for personalized therapy of MI patients.
Materials and Methods
Datasets Selection and Data Preprocessing
The gene expression profiles of MI were acquired from the GEO database by searching keywords “MI (myocardial infarction)” and “Homo sapiens”. The datasets that met the following criteria were included in our study: no less than 5 samples and including control samples. After filtering, two datasets (GSE59867 and GSE62646), treated as training sets, and two datasets (GSE123342 and GSE48060), served as validation sets, were included in the study. GSE59867 consisted of 111 patients with MI and 46 controls, and GSE62646 included 28 MI cases and 14 controls. GSE123342 consisted of 67 patients with MI and 22 controls, and GSE48060 included 26 MI cases without recurrent events and 21 controls. All these four datasets examined the blood samples. For the MI group, samples with the earliest sampling time (<48h) available in each dataset were selected for analysis. In addition, 200 hypoxia-related genes (HRGs) in “HALLMARK_HYPOXIA” were retrieved from MSigDB.
Differentially Expressed Genes (DEGs) Analysis
The “limma” package in R was applied to acquire the DEGs between MI and controls with adj_p < 0.05 and |log2 (Fold Change)| > 0.4. The ggplot2 R package was used to draw volcano plot and heatmap. David was employed to perform GO classification and KEGG pathway enrichment analysis (p < 0.05).
Unsupervised Clustering and DEG Analysis Among Different MI Subtypes
Based on the expression levels of HRGs, the “ConsensusClusterPlus” package was used to classify the patients with MI into different subtypes. With adj_p < 0.05 and |log2 (Fold Change)| > 0.4, DEGs among different MI subtypes were identified by “limma” package in R. To investigate the difference on biological process among groups, GSVA enrichment analysis was performed using “GSVA” R packages. The gene sets of “c2.cp.kegg.v7.2. symbols” were downloaded from MSigDB database for running GSVA analysis. Differentially expressed pathways were identified using the “limma” package in R, and FDR < 0.05 was considered as statistically significant.
Estimation of Immune Microenvironment (IME) Cell Infiltration
The ssGSEA algorithm was applied to quantify the relative abundance of each cell infiltration in the IME of MI. The gene set for marking each IME infiltration immune cell type was acquired from a previous study.9 ImmPort database was applied to acquire immune response-related mRNAs. The enrichment scores calculated by ssGSEA analysis were used to represent the relative abundance of each TME infiltrating cell and activity of specific immune responses in each sample. The Wilcox test was used to compare the differences in immune cell infiltration and immune response activity among different MI subgroups. Furthermore, the expression of HLA-related genes was also compared among different MI subgroups.
Weighted Gene Co-Expression Network Analysis (WGCNA)
To construct a scale-free gene co-expression network, the top 25% genes were subjected to the subsequent analysis with WGCNA package in R. First, the samples were clustered with “hclust” function to eliminate the samples with obvious outliers. Then, the “pickSoftThreshold” function is used to select an appropriate soft threshold power regulator to build the scale-free topology. The height is set to 0.90. Then, the adjacency matrix is calculated according to the kernel value, and the adjacency matrix is transformed into topological overlap matrix and the corresponding dissimilarity matrix. Genes with similar expression patterns were grouped together, and modules were divided according to the “cutreeDynamic” function with default parameters. The minimal gene module size was set to 100 to obtain appropriate modules, and the threshold to merge similar modules was set to 0.25.
Identification of Hub Genes
The gene significance (GS) and module membership (MM) were calculated to select candidate hub genes. We defined the genes with |GS| > 0.3 and |MM| > 0.5 in hub modules as MI subtype-associated genes. The intersection of MI subtype-associated genes and DEGs between MI and controls was defined as hub genes. The GO and KEGG enrichment analyses were conducted for hub genes with David (p < 0.05).
Drug Prediction
We intersected the DEGs between MI group and control group with the DEGs among different MI subtypes. Then, potential candidate drugs were predicted based on intersection genes using the DGIbd database (https://dgidb.org) to offer novel insights for disease diagnosis, treatment and research.
Construction of Diagnostic Model for MI Subtype
The “pROC” package in R was used to draw ROC curve for each hub gene in training sets and validation sets. Then, the genes with area under the ROC curve (AUC) >0.85 in all subtypes were subjected to the subsequent analysis. The LASSO regression using “glmnet” package in R was utilized to develop a diagnostic model for MI subtype. ROC analysis was performed to determine the accuracy of the diagnostic model.
Real-Time qPCR (RT-qPCR)
A total of 28 blood samples were obtained from 13 patients with MI and 15 normal controls for RT-qPCR. Every individual provided the written informed consent. Relative gene expression was analyzed by 2−ΔΔCT method. GAPDH and ACTB were used as internal reference. The study was approved by the ethics committee of the university.
Results
Differentially Expressed Analysis
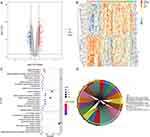
Compared with normal controls, 389 DEGs, including 191 up-regulated mRNAs and 198 down-regulated mRNAs, were identified in MI with adj_p < 0.05 and |log2 (Fold Change)| > 0.4 (Figure 1A and B). These 389 DEGs were enriched in protein binding, transmembrane signaling receptor activity, RNA processing, signal transduction and plasma membrane (Figure 1C). KEGG analysis revealed several significantly enriched pathways, including cytokine–cytokine receptor interaction, human T-cell leukemia virus 1 infection and complement and coagulation cascades (Figure 1D).
Identification of Two Different Subtypes in MI
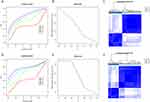
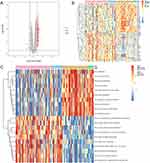
Consensus clustering revealed that the k = 2 was identified with optimal clustering stability (Figure 2A and B). Then, 139 patients in training sets were clustered into two subtypes, namely, cluster A (n = 82) and cluster B (n = 57) (Figure 2C). Consistent with analysis in training sets, the validation in validation sets displayed the similar results (Figure 2D and E). Then, 93 patients in validation sets were clustered into two subtypes, including cluster A (n = 30) and cluster B (n = 63) (Figure 2F). Consensus clustering revealed significant differences in molecular features between the two MI subtype. A total of 211 DEGs, including 180 up- and 31 down-regulated mRNAs, between two subtypes were identified in training sets (Figure 3A and B). GSVA analysis indicated that several pathways, including ECM receptor interaction, phenylalanine, metabolism, and complement and coagulation cascades, were activated in cluster A, and several pathways, including mismatch repair, DNA replication, aminoacyl tRNA, and biosynthesis, were activated in cluster B (Figure 3C).
The Difference of Immune Characteristics Between Two Subtypes
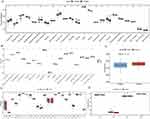
The results of ssGSEA analysis indicated that cluster A group has a higher level of infiltrated macrophage, activated dendritic cell, MDSC, eosinophil, mast cell, and monocyte, while activated CD4 T cell, activated B cell, and activated CD8 T cell are enriched in cluster B (Figure 4A). Meanwhile, more immune response activity was increased in cluster A, while significantly higher immunoscore in cluster B was detected (Figure 4B and C). Similarly, the expression of several HLA-related genes, such as HLA-A, HLA-C, HLA-DRB1 and HLA-DRB, were increased in cluster A (Figure 4D). As for the hypoxia and EMT status, we found that the enrichment scores of hypoxia and EMT2 were significantly higher in cluster A, while EMT1 and EMT3 were statistically nonsignificant between the two groups (Figure 4E). The same analysis for infiltrating immunocytes, activity of specific immune responses, immunoscore, HLA gene expression, hypoxia and EMT status were performed in validation sets. Similar trends were observed in validation sets (Figure S1A–E).
WGCNA and Identification of Hub Genes
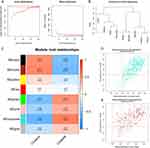
A co-expression network analysis was performed using the WGCNA R package. The power β = 13 was screened to ensure a scale-free network (Figure 5A). A total of 8 modules were determined, including a red module, green module, pink module, turquoise module, grey module, yellow module, brown module, and black module (Figure 5B). The correlation between module eigengenes and MI subtypes was analyzed. Compared with the other modules, the turquoise module and brown module had higher correlations with MI (Figure 5C). The results indicated that the turquoise module, including 880 genes, was positively associated with cluster B (r = 0.62, p = 3e-16) and the brown module, including 414 genes was negatively associated with cluster B (r = −0.58, p = 8e-14) (Figure 5D and E). Thus, the turquoise module and brown module were selected for further analysis. With |GS| > 0.3 and |MM| > 0.5, 1085 genes were identified as MI subtype-associated genes. Then, 211 hub genes were obtained by overlapping MI subtype-associated genes and DEGs between two subtypes. GO analysis indicated that these 211 hub genes were enriched in transcription factor activity, sequence-specific DNA binding, RNA processing, regulation of cholesterol efflux, and positive regulation of transcription from RNA polymerase II promoter (Figure S2A). KEGG analysis revealed that these 211 hub genes were enriched in Herpes simplex virus 1 infection and NF-kappa B signaling pathway (Figure S2B and C).
Drug Prediction
The potential drugs for MI were analyzed with the DGIbd database by overlapping the DEGs between the MI group and the control group with the DEGs between two subtypes. The results indicated that 11 genes were observed as targets of the 60 predicted drugs, such as testosterone, pinocembrin and cilostazol (Figure S3).
Construction of Diagnostic Model for MI Subtype
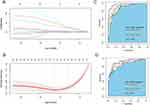
A total of 9 genes with AUC > 0.85 in both two MI subtypes were obtained. Then, 5 genes, ANKRD36, HLTF, KIF3A, OXCT1 and VPS13A, were further identified as potential diagnostic markers (Figure 6A and B). Based on these 5 genes, we established logistic regression model for the diagnosis of MI subtypes. The ROC analysis revealed that the AUC of the diagnostic model is 0.975 in training sets, and the AUC is 0.920 in validation sets, proving that the diagnostic model has high credibility (Figure 6C and D).
Correlation of Candidate Genes and Immune
The expression levels of 5 hub genes in training sets and validation sets were displayed in Figure S4A and B. The results exhibited that compared with control group, these 5 genes were significantly lowly expressed in cluster A, VPS13A, OXCT1 and HLTF were significantly decreased in cluster B in training sets; while compared with cluster B, these 5 gene expression levels were decreased in cluster A. In the validation sets, a similar situation exists. Compared with the control group, they were also significantly lower expressed in cluster A, but no significant difference was found in cluster B. Compared with cluster B, these 5 genes were also significantly lower expressed in cluster A. Correlation analysis of 5 hub genes was performed, suggesting that there was a strong positive correlation between the five genes (Figure S5). VPS13A had the strongest correlation with OXCT1 (0.88). The correlation between ANKRD36 and HLTF was the smallest, but also 0.65. Furthermore, correlation analysis of 5 hub genes and immune cells and immune score was performed (Figure 7). The results indicated that all five genes had strong positive correlations with immune scores and various immune cells, such as Activated B cell, Activated CD4 T cell, Activated CD8 T cell, Immature B cell, and Type 2 T helper cell, and strong negative correlations with other immune cells, such as Monocyte, Macrophage, Activated dendritic cell, Regulatory T cell, Neutrophil, Mast cell, Plasmacytoid dendritic cell, MDSC, and CD56bright natural killer cell. Among them, VPS13A had the strongest positive correlation with Activated CD4 T cell and the strongest negative correlation with Monocyte.
 |
Figure 7 Correlation of candidate genes and immune cells and immune score. *Indicates p < 0.05; **Indicates p < 0.01; ***Indicates p < 0.001. |
RT-qPCR Validation
The expression of ANKRD36, HLTF, KIF3A, OXCT1 and VPS13A were validated by RT-qPCR. As shown in Figure S3A, compared with control group, the expression of ANKRD36, HLTF, KIF3A, OXCT1 and VPS13A were reduced in cluster A and cluster B. Consistent with the results in Figure S3A, all five genes were down-regulated in the MI group compared with the control group (Figure 8).
 |
Figure 8 Expression validations of ANKRD36, HLTF, KIF3A, OXCT1 and VPS13A by RT-qPCR. (A) ANKRD36, (B) HLTF, (C) KIF3A, (D) OXCT1, (E) VPS13A. *p < 0.05. |
Discussion
The underlying pathological mechanism of MI remains unclear, and needs to be clarified urgently. In this study, we identified two different subtypes of MI, and the two subtypes showed different expression patterns and hypoxic-immune status. The diagnostic model, which can well distinguish the two subtypes of MI, was developed and validated.
Consensus clustering divided MI samples into two subtypes, each with its own unique immune characteristics. The results of ssGSEA analysis showed that more immune cell infiltration and more active immune responses were detected in cluster A, while pronouncedly higher immunoscore in cluster B was detected. In addition, the expression levels of several HLA-related genes were increased in cluster A. Hypoxia is a central pathophysiological component in MI, which can promote the activation of epithelial-to-mesenchymal transition (EMT) regulatory genes.6 The epicardium is a potential source of cardiac progenitors to support reparative angiogenesis after MI through EMT.10 Hence, we compared the differences of hypoxia and EMT status between two subtypes and found that the enrichment scores of hypoxia and EMT2 were significantly higher in cluster A. All the above results indicated that compared with cluster B, cluster A was characterized by high hypoxia status and low immunity status.
As for potential drugs, 11 genes were observed as targets of the 60 predicted drugs, such as testosterone, pinocembrin and cilostazol. Previous studies had explored the relationship between testosterone and cardiovascular disease. A review suggested that testosterone may perform a critical function in the treatment of angina, heart failure, and myocardial ischemia.11 Low endogenous bioavailable testosterone levels had been associated with higher rates of cardiovascular-related mortality.12 A Mendelian randomisation study indicated that endogenous testosterone was positively associated with thromboembolism, heart failure, and MI in men.13 Lungkaphin et al reported that pinocembrin can reduce cardiac arrhythmia and infarct size in acute myocardial ischemia/reperfusion rats.14 Similarly, Zhang et al indicated that pinocembrin can decrease cardiac infarction area.15 Ye et al suggested that pinocembrin can ameliorate atrial electrical remodeling, attenuate autonomic dysfunction, and suppress MI-induced inflammatory responses in a MI rat model.16 Tanaka et al suggested that cilostazol might be used for temporary adjunctive treatment of ST-segment elevation MI.17 Lee et al reported that cilostazol has protective effects on myocardial function and myocardial remodeling in MI with restrained stress rat model.18 The above findings may suggest a potential novel strategy for MI treatment.
A total of five genes, including ANKRD36, HLTF, KIF3A, OXCT1 and VPS13A, were included in the diagnostic model, and showed good diagnostic effect in distinguishing the two subtypes. Yan et al found that Ankyrin repeat domain 36 (ANKRD36) was significantly lower expressed in hypertension.19 An integrated genomic analysis indicated that ANKRD36 was a novel biomarker of early chronic myeloid leukemia progression.20 Helicase-like transcription factor (HLTF) encodes a member of the SWI/SNF family, which has helicase and ATPase activities. Liu et al indicated that HLTF is associated with the migration and invasion of colorectal cancer.21 Kinesin family member 3A (KIF3A) overexpression was related to tumor recurrence, lymph node metastasis and chemoresistance.22 The gene, 3-oxoacid CoA-transferase 1 (OXCT1) has been associated with tumor proliferation and metastasis. A review showed that the elevation of OXCT1 expression was detected in different categories of cancer cells and considered OXCT1 as a novel target for cancer therapy.23 A bioinformatics analysis on pan-cancer suggested that VPS13A is associated with the tumor development.24 Elevated VPS13A might contribute to increased risk of stroke in current smokers.25 In addition, the VPS13A and OXCT1 are the most correlated hub genes, indicating that they may function together in MI. Our findings indicated that the model that included five genes had a better diagnostic effect than each individual gene.
The results of correlation analysis of hub genes and immune cells showed that VPS13A had the strongest positive correlation with activated CD4 T cell and strongest negative correlation with monocyte, indicating that the expression of VPS13A was associated with activated CD4 T cell and monocyte. Inflammation has been reported to be involved in the initiation and progression of numerous diseases, including MI.26 Regulatory T cells (Tregs) can prevent the accumulation of proinflammatory cells and the secretion of proinflammatory cytokines, and Tregs cell activity might be pivotal for the maintenance of cardiovascular homeostasis.27 In addition, Zhao et al indicated that activated CD4+ T cells promote cardiac remodeling following MI.28 Monocytes play an integral role in the innate immune system in human and participate in inflammation.29 Previous study suggested that monocytes are involved in both initiation and resolution of inflammation and are critical mediators of the inflammatory response following MI and ischemia-reperfusion injury.30
Conclusion
In conclusion, we divided MI samples into two subtypes, cluster A and cluster B, based on the expression levels of HRGs. Among them, cluster A was characterized by high hypoxia status and low immunity status. In addition, some drugs (testosterone, pinomicin, cilostazol, etc.) have been found to be effective in the treatment of MI but may produce different results in the two different subtypes. Finally, a diagnostic model, including ANKRD36, HLTF, KIF3A, OXCT1 and VPS13A, was established, which can distinguish the two subtypes well.
Abbreviations
MI, Myocardial infarction; HRG, Hypoxia-related genes; IME, Immune microenvironment; WGCNA, Weighted gene co-expression network analysis; GS, Gene significance; MM, module membership; AUC, area under the ROC curve; RT-qPCR, Real-time qPCR; EMT, epithelial-to-mesenchymal transition; ANKRD36, Ankyrin repeat domain 36; HLTF, Helicase like transcription factor; KIF3A, kinesin family member 3A; OXCT1, 3-oxoacid CoA-transferase 1.
Data Sharing Statement
The data supporting the conclusions of this article are included within the article.
Ethics Approval and Informed Consent
Approval was obtained from the ethics committee of The Second Affiliated Hospital of Shandong First Medical University. The procedures used in this study adhere to the tenets of the Declaration of Helsinki. All methods were carried out in accordance with relevant guidelines and regulations.
Consent for Publication
The subjects gave written informed consent for the publication of any associated data and accompanying images.
Author Contributions
All authors made a significant contribution to the work reported, whether that is in the conception, study design, execution, acquisition of data, analysis and interpretation, or in all these areas; took part in drafting, revising or critically reviewing the article; gave final approval of the version to be published; have agreed on the journal to which the article has been submitted; and agree to be accountable for all aspects of the work.
Funding
There is no funding to report.
Disclosure
All authors declare that they have no conflicts of interest in this work.
References
1. Reed GW, Rossi JE, Cannon CP. Acute myocardial infarction. Lancet. 2017;389(10065):197–210. doi:10.1016/s0140-6736(16)30677-8
2. Ong SB, Hernández-Reséndiz S, Crespo-Avilan GE, et al. Inflammation following acute myocardial infarction: multiple players, dynamic roles, and novel therapeutic opportunities. Pharmacol Ther. 2018;186:(73–87. doi:10.1016/j.pharmthera.2018.01.001
3. Frangogiannis NG. Regulation of the inflammatory response in cardiac repair. Circ Res. 2012;110(1):159–173. doi:10.1161/circresaha.111.243162
4. Castro-Dominguez Y, Dharmarajan K, McNamara RL. Predicting death after acute myocardial infarction. Trends Cardiovasc Med. 2018;28(2):102–109. doi:10.1016/j.tcm.2017.07.011
5. Zhang Q, Wang L, Wang S, et al. Signaling pathways and targeted therapy for myocardial infarction. Signal Transduct Target Ther. 2022;7(1):78. doi:10.1038/s41392-022-00925-z
6. Dergilev KV, Tsokolaeva ZI, Vasilets YD, et al. Hypoxia - as a possible regulator of the activity of epicardial mesothelial cells after myocardial infarction. Kardiologiia. 2021;61(6):59–68. doi:10.18087/cardio.2021.6.n1476
7. Dölling M, Eckstein M, Singh J, et al. Hypoxia promotes neutrophil survival after acute myocardial infarction. Front Immunol. 2022;13:
8. Kologrivova I, Shtatolkina M, Suslova T, et al. Cells of the immune system in cardiac remodeling: main players in resolution of inflammation and repair after myocardial infarction. Front Immunol. 2021;12:
9. Charoentong P, Finotello F, Angelova M, et al. Pan-cancer immunogenomic analyses reveal genotype-immunophenotype relationships and predictors of response to checkpoint blockade. Cell Rep. 2017;18(1):248–262. doi:10.1016/j.celrep.2016.12.019
10. Blom JN, Wang X, Lu X, et al. Inhibition of intraflagellar transport protein-88 promotes epithelial-to-mesenchymal transition and reduces cardiac remodeling post-myocardial infarction. Eur J Pharmacol. 2022;933:
11. Kloner RA, Carson C
12. Oskui PM, French WJ, Herring MJ, et al. Testosterone and the cardiovascular system: a comprehensive review of the clinical literature. J Am Heart Assoc. 2013;2(6):e000272. doi:10.1161/jaha.113.000272
13. Luo S, Au Yeung SL, Zhao JV, et al. Association of genetically predicted testosterone with thromboembolism, heart failure, and myocardial infarction: Mendelian randomisation study in UK Biobank. BMJ. 2019;364:
14. Lungkaphin A, Pongchaidecha A, Palee S, et al. Pinocembrin reduces cardiac arrhythmia and infarct size in rats subjected to acute myocardial ischemia/reperfusion. Appl Physiol Nutr Metab. 2015;40(10):1031–1037. doi:10.1139/apnm-2015-0108
15. Zhang P, Xu J, Hu W, et al. Effects of pinocembrin pretreatment on connexin 43 (Cx43) protein expression after rat myocardial ischemia-reperfusion and cardiac arrhythmia. Med Sci Monit. 2018;24:(5008–5014. doi:10.12659/msm.909162
16. Ye T, Zhang C, Wu G, et al. Pinocembrin attenuates autonomic dysfunction and atrial fibrillation susceptibility via inhibition of the NF-κB/TNF-α pathway in a rat model of myocardial infarction. Int Immunopharmacol. 2019;77:
17. Tanaka A, Ishii H, Sakakibara M, et al. Temporary adjunctive cilostazol vs clopidogrel loading for ST-segment elevation acute myocardial infarction. Am J Cardiovasc Drugs. 2014;14(2):131–136. doi:10.1007/s40256-013-0059-7
18. Lee MY, Kim NH, Ko JS. Protective effect of cilostazol against restraint stress induced heart failure in post-myocardial infarction rat model. Chonnam Med J. 2020;56(3):180–185. doi:10.4068/cmj.2020.56.3.180
19. Yan Y, Wang J, Yu L, et al. ANKRD36 is involved in hypertension by altering expression of ENaC Genes. Circ Res. 2021;129(11):1067–1081. doi:10.1161/circresaha.121.319883
20. Iqbal Z, Absar M, Akhtar T, et al. Integrated genomic analysis identifies ANKRD36 gene as a novel and common biomarker of disease progression in chronic myeloid leukemia. Biology. 2021;10(11). doi:10.3390/biology10111182
21. Liu L, Liu H, Zhou Y, et al. HLTF suppresses the migration and invasion of colorectal cancer cells via TGF‑β/SMAD signaling in vitro. Int J Oncol. 2018;53(6):2780–2788. doi:10.3892/ijo.2018.4591
22. Wang W, Zhang R, Wang X, et al. Suppression of KIF3A inhibits triple negative breast cancer growth and metastasis by repressing Rb-E2F signaling and epithelial-mesenchymal transition. Cancer Sci. 2020;111(4):1422–1434. doi:10.1111/cas.14324
23. Zhang S, Xie C. The role of OXCT1 in the pathogenesis of cancer as a rate-limiting enzyme of ketone body metabolism. Life Sci. 2017;183:110–115. doi:10.1016/j.lfs.2017.07.003
24. Zhang XQ, Li L. Biological function and clinical value of VPS13A in pan-cancer based on bioinformatics analysis. Int J Gen Med. 2021;14:(6825–6838. doi:10.2147/ijgm.s330256
25. Cheng X, Ferino E, Hull H, et al. Smoking affects gene expression in blood of patients with ischemic stroke. Ann Clin Transl Neurol. 2019;6(9):1748–1756. doi:10.1002/acn3.50876
26. Deloukas P, Kanoni S, Willenborg C, et al. Large-scale association analysis identifies new risk loci for coronary artery disease. Nat Genet. 2013;45(1):25–33. doi:10.1038/ng.2480
27. Meng X, Yang J, Dong M, et al. Regulatory T cells in cardiovascular diseases. Nat Rev Cardiol. 2016;13(3):167–179. doi:10.1038/nrcardio.2015.169
28. Zhao X, Wang J, He J, et al. 致敏性CD4+ T细胞来源的外泌体介导心肌梗死后心肌重构的机制研究 [Effects of activated CD4(+) T cell-derived exosomes on cardiac remodeling after myocardial infarction]. Zhonghua Wei Zhong Bing Ji Jiu Yi Xue. 2021;33(11):1332–1336. Chinese. doi:10.3760/cma.j.cn121430-20210709-01038
29. Arfvidsson J, Ahlin F, Vargas KG, et al. Monocyte subsets in myocardial infarction: a review. Int J Cardiol. 2017;231:47–53. doi:10.1016/j.ijcard.2016.12.182
30. Mentkowski KI, Euscher LM, Patel A, et al. Monocyte recruitment and fate specification after myocardial infarction. Am J Physiol Cell Physiol. 2020;319(5):C797–c806. doi:10.1152/ajpcell.00330.2020
 © 2023 The Author(s). This work is published and licensed by Dove Medical Press Limited. The full terms of this license are available at https://www.dovepress.com/terms.php and incorporate the Creative Commons Attribution - Non Commercial (unported, v3.0) License.
By accessing the work you hereby accept the Terms. Non-commercial uses of the work are permitted without any further permission from Dove Medical Press Limited, provided the work is properly attributed. For permission for commercial use of this work, please see paragraphs 4.2 and 5 of our Terms.

