Back to Journals » Risk Management and Healthcare Policy » Volume 16
Development and Validation Nomogram for Predicting the Survival of Patients with Thrombocytopenia in Intensive Care Units
Authors Jiang ZH, Zhang GH, Xia JM, Lv SJ
Received 17 April 2023
Accepted for publication 29 June 2023
Published 17 July 2023 Volume 2023:16 Pages 1287—1295
DOI https://doi.org/10.2147/RMHP.S417553
Checked for plagiarism Yes
Review by Single anonymous peer review
Peer reviewer comments 2
Editor who approved publication: Professor Mecit Can Emre Simsekler
Zhen-Hong Jiang, Guo-Hu Zhang, Jin-Ming Xia, Shi-Jin Lv
Emergency Department, Affiliated Hospital of Hangzhou Normal University, Hangzhou, 310015, People’s Republic of China
Correspondence: Shi-Jin Lv, Email [email protected]
Background: The number of patients with thrombocytopenia (TCP) is relatively high in intensive care units (ICUs). It is therefore necessary to evaluate the prognostic risk of such patients.
Aim: This study investigated the risk factors affecting the survival of patients with TCP in the ICU. Using the findings of this investigation, we developed and validated a risk prediction model.
Methods: We evaluated patients admitted to the ICU who presented with TCP. We used LASSO regression to identify important clinical indicators. Based on these indicators, we developed a prediction model complete with a nomogram for the development cohort set. We then evaluated the mode’s accuracy using a receiver operating characteristic (ROC) curve, calibration curves, and decision curve analysis (DCA) in a validation cohort.
Results: A total of 141 cases of ICU TCP were included in the sample, of which 47 involved death of the patient. Clinical results were as follows: N (HR 0.91, 95% CI 0.86– 0.97, P=0.003); TBIL (HR 1.98, 95% CI 1.02– 1.99, P=0.048); APACHE II (HR 1.94, 95% CI 1.39, 2.48, P=0.045); WPRN (HR 6.22, 95% CI 2.86– 13.53, P< 0.001); WTOST (HR 0.56, 95% CI 0.21– 1.46, P< 0.001); and DMV [HR1.87, 95% CI 1.12– 2.33]. The prediction model yielded an area under the curve (AUC) of 0.918 (95% CI 0.863– 0.974) in the development cohort and 0.926 (95% CI 0.849– 0.994) in the validation cohort. Application of the nomogram in the validation cohort gave good discrimination (C-index 0.853, 95% CI 0.810– 0.922) and good calibration. DCA indicated that the nomogram was clinically useful.
Conclusion: The individualized nomogram developed through our analysis demonstrated effective prognostic prediction for patients with TCP in ICUs. Use of this prediction metric may reduce TCP-related morbidity and mortality in ICUs.
Keywords: thrombocytopenia, intensive care unit, nomogram, prediction model
Introduction
Platelets, which are cytoplasmic components shed by megakaryocytes, are one of the main cellular products of the blood and play an important role in hemostasis and coagulation.1 In healthy individuals, platelets adhere closely to the inner wall of capillaries in order to maintain their structural integrity. Under normal physiological conditions, vascular endothelial cells or blood cells do not interact with each other. However, when the blood vessel wall is damaged, platelets exert their biochemical aggregation and adhesion characteristics.2 Most platelets exist in the blood and participate in various metabolic processes of the body. A small part of platelets exist in extravascular organs or tissues, such as the spleen. Under certain circumstances, platelets can enter and exit blood vessels and participate in various physiological and pathological metabolic processes of the body.3
Relevant studies have found that a certain subset of platelets can participate in the inflammatory response through a variety of means.4 Currently, it is generally believed that platelets can directly participate in the coagulation process and the regulation of inflammation.5 Abnormal platelet count (PLT) is an observation index related to the occurrence and prognosis of cardiovascular disease, respiratory system, sepsis and cancer.6–8
Thrombocytopenia (TCP), the insufficiency of platelet levels within the blood, is one of the most common complications in intensive care unit (ICU) patients. Multiple pathophysiological mechanisms can contribute to the development of TCP, including thrombin mediated platelet activation, dilution, hemophagocytosis, extracellular histones, ADAMTSL3 deficiency, and complement activation.9 TCP is more common in critically ill patients, and the occurrence of TCP strongly correlates with longer hospital stays and worse survival.10 The incidence of TCP in critically ill adult patients can range from 8.3–67.6% upon admission to the ICU, and 14–44% during ICU treatment.11 Naturally, critically ill patients who develop TCP have significantly higher rates of bleeding, transfusion, and death,12,13 with TCP being considered an independent risk factor for mortality in ICU patients14 and for poor prognosis.15
The causes of thrombocytopenia are legion, and include: systemic infection, immune-mediated platelet destruction, disseminated intravascular coagulation, bone marrow suppression, hemodilution caused by massive blood transfusion and plasma, increased platelet consumption due to trauma or hemorrhage, separation or storage of platelets in lung or reticuloendothelial system due to acute respiratory distress syndrome, and drug factors such as heparin.16,17 A sharp drop in PLT predicts poor prognosis in adult ICU patients.18
Early prediction of possible abnormalities and effective intervention in their early stages can reduce mortality and improve prognosis. To the best of our knowledge, there is no established clinical prediction model based on ICU patients that precisely predicts patient survival rate. Therefore, the aim of this study was to develop and validate a nomogram incorporating clinical risk factors for predicting survival in patients with TCP in the ICU.
Materials and Methods
Study Population
Clinical data from 270 patients admitted to the ICU of the Affiliated Hospital of Hangzhou Normal University from January 2020 to December 2021 were collected. Data encompassed the patient’s stay from admittance to the ICU all the way up to the 28th day following admission. Patients were divided into two groups depending on whether or not they died during the 28-day period. Patients meeting the following criteria were excluded: (1) having received immunotherapy or chemoradiotherapy in the last three months; (2) having primary myelodysplastic disorders such as aplastic anemia; (3) having experienced thrombosis or similar disease within one month prior to their admittance to the ICU; (4) having systemic lupus erythematosus or other immune-related diseases; (5) patients with lower-than-normal PLT (>100×109/L) at review after admission.
Following these screening criteria, we were left with 141 suitable candidates, aged 18–75. Among this cohort, there were 67 cases of sepsis, 33 cases of trauma, 19 cases of cerebral hemorrhage, and 22 cases of gastrointestinal hemorrhage. This study met the standards of medical ethics and was approved by the Ethics Committee of the Affiliated Hospital of Hangzhou Normal University (approval number: 202211211559000157124). Informed consent was obtained from each patient or from their family, and this study complies with the Declaration of Helsinki.
Statistical Analysis
Continuous variables were summarized as means ± standard deviation (SD), whereas categorical variables were expressed as frequencies and percentages. Continuous variables were compared using Student’s t-test, while categorical variables were compared using the chi squared test.
We evaluated twenty-four different clinical indicators as candidate prognostic factors. Least absolute shrinkage and selection operator (LASSO) regression was applied to minimize the potential collinearity of variables measured from the same patient and over-fitting of variables.19 We used L1-penalized LASSO regression for multivariable analyses, augmented with 10-fold cross validation. This is a logistic regression model that penalizes the absolute size of the coefficients of a regression model based on the value of λ. The larger the penalty, the stronger the weak factors shrink toward zero, so that only the strongest predictors remain in the model. The most predictive covariates were selected by the minimum λ. The R package “glmnet” was used to perform the LASSO regression.
Following predictor selection, multivariate logistic regression analysis was used to develop the risk prediction models for TCP in the ICU. The results of this analysis are described as hazard ratio (HR) ± 95% confidence interval (CI), along with the corresponding P values. The data were randomly divided into development and validation cohorts at a ratio of 7:3, respectively. Receiver operating characteristic (ROC) curves and the area under the curve (AUC) values were used to evaluate the classification of the model in both the development and validation cohorts, with an AUC close to 1 indicating good predictive ability.20 A calibration slope with point-wise 95% confidence limits was used to estimate the calibration of the model, with a reference line of 45° indicating perfect calibration.21 Decision curve analysis (DCA) was conducted to determine the clinical usefulness of the radiomics nomogram by quantifying the net benefits at different threshold probabilities in the validation dataset.22
In this paper, all tests were two-tailed, with a P value threshold of 0.05 for statistical significance. Statistical analysis was conducted in R statistical software (version 3.6.1; http://www.Rproject.org).
Results
Clinical Data
Patient demographics and baseline stats are shown in Table 1. Among 141 patients, 47 (34.1%) died and 94 (65.9%) survived. There were no significant differences in age, sex, diabetes, hypertension, chronic obstructive pulmonary disease (COPD), coronary heart disease, malignant tumor, renal insufficiency, or other diseases between the two groups (P > 0.05).
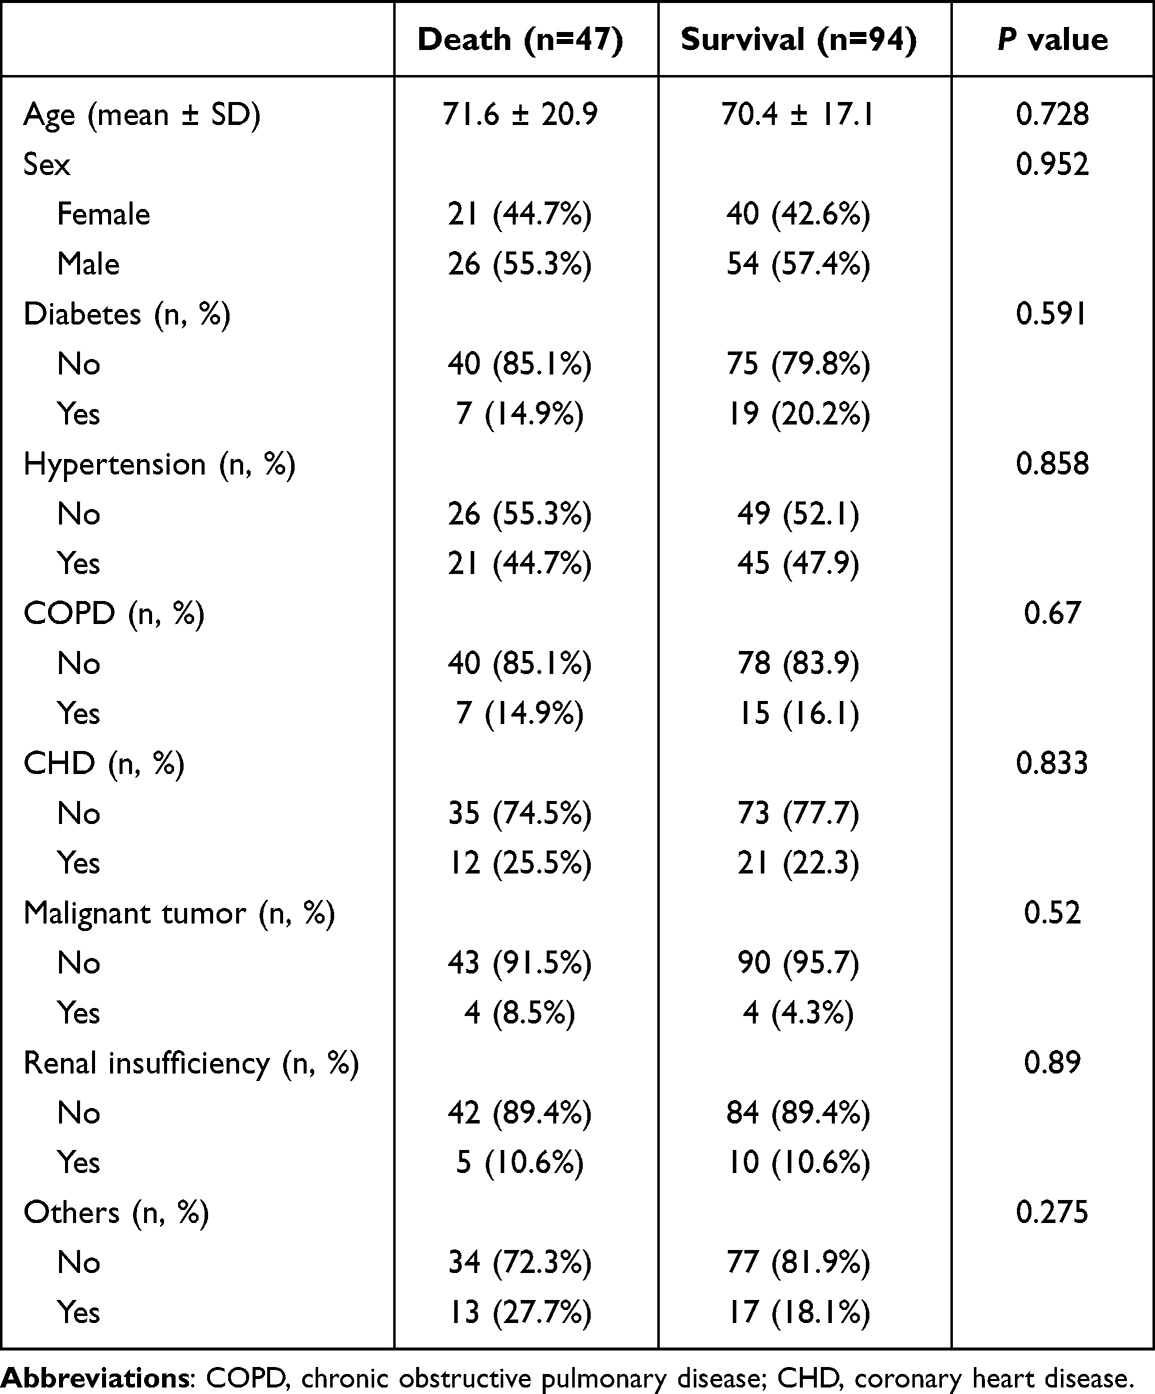 |
Table 1 Basic Data and Clinical Characteristics of Patients |
Comparison of clinical baseline indicators between the two groups is shown in Table 2. The differences between the two groups were observed in PLTmin, WBC, N, TBIL, aspartate aminotransferase (AST), APACHE II, number of days with TCP (NDTH), WPRN, WTOST, and DMV (all P<0.05).
 |
Table 2 Clinical Indicators of Patients in the Two Groups |
Optimal Clinical Indicators Selected
To identify potentially significant clinical indicators associated with prognostic survival in patients with TCP, we conducted univariate regression analysis for each of the 24 clinical indicators, looking for those with nonzero coefficients (Figure 1A and B). This narrowed our search to six potential predictive factors: N, TBIL, APACHE II, WPRN, WTOST, and DMV (Figure 1C).
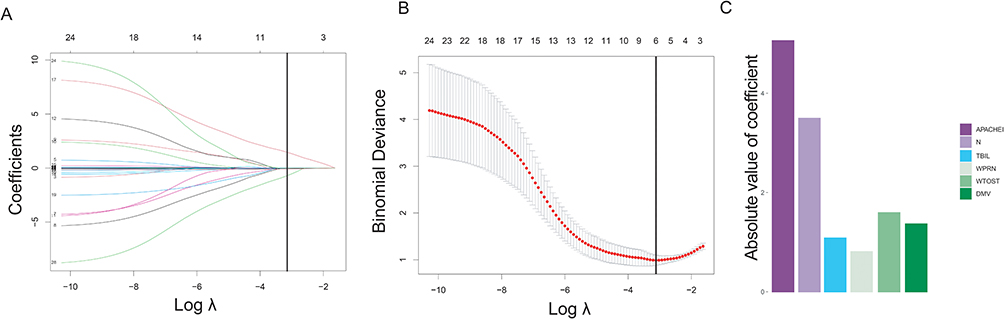 |
Figure 1 Clinical feature selection using LASSO binary logistic regression model. (A) Tuning parameter (λ) selection in the LASSO model used 10-fold cross-validation via minimum criteria. The AUC curve was plotted against log λ. Dotted vertical lines were drawn at the optimal values by using the minimum criteria ± 1 standard error (the 1-SE criteria). A λ value of 0.042, with log (λ) of −3.170 was chosen according to 10-fold cross-validation. (B) LASSO coefficient profiles of the 24 clinical indicators. A coefficient profile plot was produced against the log (λ) sequence. A vertical line was drawn at the value selected using 10-fold cross-validation, where optimal λ resulted in six nonzero coefficients. (C) The six selected indicators with the most discriminative value according to the best penalty parameter λ. |
To further investigate the relationship between the above six clinical features and survival, we conducted multivariable logistic regression analysis (Table 3). The results of this analysis for each of these clinical features were as follows:, N (HR 0.91, 95% CI 0.86–0.97, P=0.003), TBIL (HR 1.08, 95% CI: 1.02–1.99, P=0.048), APACHE II (HR 1.94, 95% CI:1.39–2.48, P=0.045), WPRN (HR 6.22, 95% CI: 2.86–13.53, P<0.001), WTOST (HR 0.56, 95% CI: 0.21–1.46, P<0.001) and DMV (HR 1.87, 95% CI:1.12–2.33, P<0.001). We further verified that there was no statistically significant difference in those features between the development cohort set and validation cohort set (all P>0.05) (Supplementary Table 1).
 |
Table 3 Multivariate Logistic Regression Analysis of Clinical Indicators |
Nomogram Establishment
From these results, we constructed a nomogram for predicting survival risk (Figure 2A). This prediction model yielded an AUC of 0.918 (95% CI 0.863–0.974) in the development cohort and 0.926 (95% CI 0.849–0.994) in the validation cohort (Figure 2B). The calibration curves of the combined nomogram showed good calibration performance in both the development and validation cohort. We observed high agreement between the ideal curves and the calibration curves, with a C-index value of 0.853 (95% CI, 0.810–0.922) in the development cohort (Figure 2C–D).
 |
Figure 2 Establishment and validation of clinical prediction model. (A) Nomogram lists of the prediction model; (B) ROC curves of the prediction model; (C) Calibration curves of the nomogram in the development cohort; (D) Calibration curves of the nomogram in the validation cohort. |
Clinical Use
The DCA curve revealed a more extensive range of cutoff probabilities shown by the nomogram. The threshold probabilities of the model had excellent net benefits and enhanced performance for predicting survival risk in the development cohort and validation cohort with TCP patients (Figure 3).
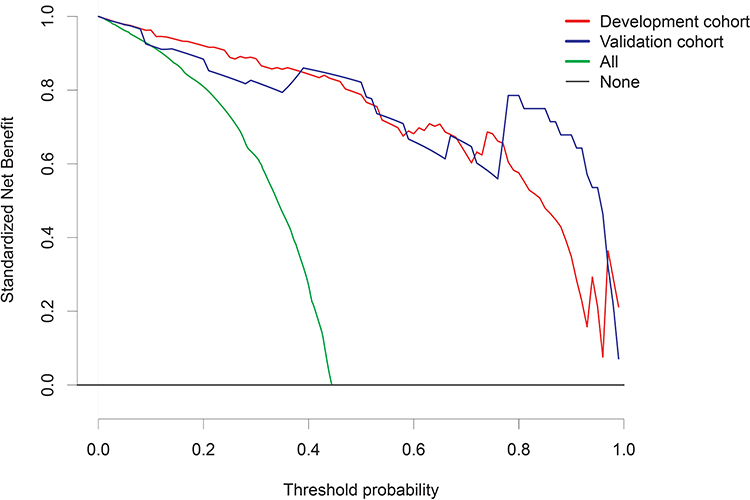 |
Figure 3 Nomogram decision curve analysis; y-axis measures = net benefit. |
Discussion
ICU patients are often characterized by high morbidity and mortality. In clinical practice, ICU patients are usually transferred thereto from different departments, such as cardiovascular disease, respiratory disease, neurological disease, gastroenterological disease, etc., in all of which the incidence of thrombocytopenia has been rising year after year.23,24 In this study, we have established a clinical prediction model based on clinically important indicators. This model accurately reflects the survival probability and prognosis of critically ill patients with TCP, which can aid in important clinical decision making.
We found that patients who died had higher APACHE II scores and longer DMV than those who survived, which is consistent with the findings of other studies.25 The APACHE II score in the death group was higher than that in the survival group, suggesting that the condition in the death group was critically ill. The proportion of patients for whom platelets did not return to normal was 59.6% among those who eventually died and 40.4% in those in whom thrombocytopenia recurred. PLT changes, also found in more than 1400 ICU patients, have been associated with increased mortality, and they suggest that PLT is as good a predictor as APACHE II score in judging the prognosis of critically ill patients.26
The onset, rate, and duration of platelet decline vary among critically ill patients, and their clinical significance varies. A rapid or sustained decrease in PLT within a short period of time often suggests that patients may develop acute platelet dysfunction with poor prognosis, urgently necessitating identification of the etiology of the decrease and prompt intervention therefor.26 Previous studies have shown that case fatality and complication rates are significantly higher if PLT in critically ill patients takes longer than four days to recover.27 For example, Akca et al28 reported that critically ill patients with reduced PLT persisting for up to 14 d after admission to the ICU have a case fatality rate as high as 66%, whereas those with normalized or elevated PLT have a case fatality rate of only 16%. In addition, the recovery speed of platelets also helps to inform prognosis. Statistically, after the development of TCP in critically ill patients, those whose PLT increases by an average of about 30 × 109/L per day tend to survive, whereas those whose counts do not increase by more than 6 × 10⁹/L typically die.29 Therefore, the survival prognosis indicators found in this article that affect TCP critically ill patients can provide reference for clinical judgment.
Patients with thrombocytopenia in the ICU are often caused by many factors. First, the cause of thrombocytopenia is determined from the aspects of reduced platelet production, increased consumption, increased destruction, and reduced platelet dilution. Inflammatory mediators, immune factors, drug action, and special treatment can all lead to thrombocytopenia. It is necessary to identify the main causes of this change and take clinical treatment measures according to the causes.
To summarize, this study developed a prediction of survival probability for thrombocytopenic patients in the ICU based on six important clinical indicators identified by the LASSO algorithm. The nomogram prediction model was developed and validated in the validation set based on the prediction model, with an area under the ROC curve (AUC) of 0.926 (95% CI 0.849–0.994), and the model also achieved satisfactory performance in model evaluation methods such as calibration curve and clinical decision curve, indicating high accuracy. In recent years, the design and interpretability of clinical prediction models based on artificial intelligence methods have also been greatly developed.30–32 We believe that, as awareness of AI technology in critical care medicine increases and other disciplines continue to develop, critically ill patients with TCP will receive more individualized, refined treatment and prognostic management.
Data Sharing Statement
The original data are available on request to Shi-Jin Lv, or at the Affiliated Hospital of Hangzhou Normal University, Hangzhou, 310014, China.
Consent for Publication
Not applicable. All data were supplied and analyzed anonymously, without access to personal identifying information.
Author Contributions
All authors made a significant contribution to the work reported, whether that is in the conception, study design, execution, acquisition of data, analysis and interpretation, or in all these areas; took part in drafting, revising or critically reviewing the article; gave final approval of the version to be published; have agreed on the journal to which the article has been submitted; and agree to be accountable for all aspects of the work.
Funding
The presented study was supported by Hangzhou science and Technology Bureau fund (No.2021WJCY286).
Disclosure
The authors declare that there is no conflict of interests regarding the publication of this paper.
References
1. Birocchi S, Podda GM, Manzoni M, Casazza G, Cattaneo M. Thrombopoietin receptor agonists for the treatment of primary immune thrombocytopenia: a meta-analysis and systematic review. Platelets. 2021;32(2):216–226. doi:10.1080/09537104.2020.1745168
2. Arnold DM, Lim W. A rational approach to the diagnosis and management of thrombocytopenia in the hospitalized patient. Semin Hematol. 2011;48(4):251–258. doi:10.1053/j.seminhematol.2011.08.002
3. Zhang S, Cui YL, Diao MY, Chen DC, Lin ZF. Use of platelet indices for determining illness severity and predicting prognosis in critically ill patients. Chin Med J. 2015;128(15):2012–2018. doi:10.4103/0366-6999.161346
4. Dewitte A, Lepreux S, Villeneuve J, et al. Blood platelets and sepsis pathophysiology: a new therapeutic prospect in critically [corrected] ill patients? Ann Intensive Care. 2017;7(1):115. doi:10.1186/s13613-017-0337-7
5. Flora GD, Nayak MK. A brief review of cardiovascular diseases, associated risk factors and current treatment regimes. Curr Pharm Des. 2019;25(38):4063–4084. doi:10.2174/1381612825666190925163827
6. Washington AV, Esponda O, Gibson A. Platelet biology of the rapidly failing lung. Br J Haematol. 2020;188(5):641–651. doi:10.1111/bjh.16315
7. Cornelius DC, Baik CH, Travis OK, et al. NLRP3 inflammasome activation in platelets in response to sepsis. Physiol Rep. 2019;7(9):e14073. doi:10.14814/phy2.14073
8. Martini C, Thompson EJ, Hyslop SR, et al. Platelets disrupt vasculogenic mimicry by cancer cells. Sci Rep. 2020;10(1):5869. doi:10.1038/s41598-020-62648-x
9. Thachil J, Warkentin TE. How do we approach thrombocytopenia in critically ill patients? Br J Haematol. 2017;177(1):27–38. doi:10.1111/bjh.14482
10. Jonsson AB, Rygård SL, Hildebrandt T, Perner A, Møller MH, Russell L. Thrombocytopenia in intensive care unit patients: a scoping review. Acta Anaesthesiol Scand. 2021;65(1):2–14. doi:10.1111/aas.13699
11. Williamson DR, Lesur O, Tétrault JP, Nault V, Pilon D. Thrombocytopenia in the critically ill: prevalence, incidence, risk factors, and clinical outcomes. Can J Anaesthes. 2013;60(7):641–651. doi:10.1007/s12630-013-9933-7
12. Lauzier F, Arnold DM, Rabbat C, et al. Risk factors and impact of major bleeding in critically ill patients receiving heparin thromboprophylaxis. Intensive Care Med. 2013;39(12):2135–2143. doi:10.1007/s00134-013-3044-3
13. Strauss R, Wehler M, Mehler K, Kreutzer D, Koebnick C, Hahn EG. Thrombocytopenia in patients in the medical intensive care unit: bleeding prevalence, transfusion requirements, and outcome. Crit Care Med. 2002;30(8):1765–1771. doi:10.1097/00003246-200208000-00015
14. Harada MY, Hoang DM, Zaw AA, et al. Overtreatment of heparin-induced thrombocytopenia in the surgical ICU. Crit Care Med. 2017;45(1):28–34. doi:10.1097/CCM.0000000000002002
15. Shi Y, Zhao J, Jiang H, et al. Thrombocytopenia in primary antiphospholipid syndrome: association with prognosis and clinical implications. Rheumatology. 2022;62(1):256–263. doi:10.1093/rheumatology/keac264
16. Shalansky SJ, Verma AK, Levine M, Spinelli JJ, Dodek PM. Risk markers for thrombocytopenia in critically ill patients: a prospective analysis. Pharmacotherapy. 2002;22(7):803–813. doi:10.1592/phco.22.11.803.33634
17. De Blasi RA, Cardelli P, Costante A, Sandri M, Mercieri M, Arcioni R. Immature platelet fraction in predicting sepsis in critically ill patients. Intensive Care Med. 2013;39(4):636–643. doi:10.1007/s00134-012-2725-7
18. Vanderschueren S, De Weerdt A, Malbrain M, et al. Thrombocytopenia and prognosis in intensive care. Crit Care Med. 2000;28(6):1871–1876. doi:10.1097/00003246-200006000-00031
19. Sauerbrei W, Royston P, Binder H. Selection of important variables and determination of functional form for continuous predictors in multivariable model building. Stat Med. 2007;26(30):5512–5528. doi:10.1002/sim.3148
20. Chu R, Chen W, Song G, et al. Predicting the risk of adverse events in pregnant women with congenital heart disease. J Am Heart Assoc. 2020;9(14):e016371. doi:10.1161/JAHA.120.016371
21. Van Calster B, Nieboer D, Vergouwe Y, De Cock B, Pencina MJ, Steyerberg EW. A calibration hierarchy for risk models was defined: from utopia to empirical data. J Clin Epidemiol. 2016;74:167–176. doi:10.1016/j.jclinepi.2015.12.005
22. Vickers AJ, Cronin AM, Elkin EB, Gonen M. Extensions to decision curve analysis, a novel method for evaluating diagnostic tests, prediction models and molecular markers. BMC Med Inform Decis Mak. 2008;8:53. doi:10.1186/1472-6947-8-53
23. Sekeres MA, Taylor J. Diagnosis and treatment of myelodysplastic syndromes: a review. JAMA. 2022;328(9):872–880. doi:10.1001/jama.2022.14578
24. Danese E, Montagnana M, Favaloro EJ, Lippi G. Drug-induced thrombocytopenia: mechanisms and laboratory diagnostics. Semin Thromb Hemost. 2020;46(3):264–274. doi:10.1055/s-0039-1697930
25. Cawley MJ, Wittbrodt ET, Boyce EG, Skaar DJ. Potential risk factors associated with thrombocytopenia in a surgical intensive care unit. Pharmacotherapy. 1999;19(1):108–113. doi:10.1592/phco.19.1.108.30518
26. Nijsten MW, ten Duis HJ, Zijlstra JG, et al. Blunted rise in platelet count in critically ill patients is associated with worse outcome. Crit Care Med. 2000;28(12):3843–3846. doi:10.1097/00003246-200012000-00017
27. Vandijck DM, Blot SI, De Waele JJ, Hoste EA, Vandewoude KH, Decruyenaere JM. Thrombocytopenia and outcome in critically ill patients with bloodstream infection. Heart Lung. 2010;39(1):21–26. doi:10.1016/j.hrtlng.2009.07.005
28. Akca S, Haji-Michael P, de Mendonça A, Suter P, Levi M, Vincent JL. Time course of platelet counts in critically ill patients. Crit Care Med. 2002;30(4):753–756. doi:10.1097/00003246-200204000-00005
29. Moreau D, Timsit JF, Vesin A, et al. Platelet count decline: an early prognostic marker in critically ill patients with prolonged ICU stays. Chest. 2007;131(6):1735–1741. doi:10.1378/chest.06-2233
30. Zhang Z, Navarese EP, Zheng B, et al. Analytics with artificial intelligence to advance the treatment of acute respiratory distress syndrome. J Evid Based Med. 2020;13(4):301–312. doi:10.1111/jebm.12418
31. Xie F, Chakraborty B, Ong MEH, Goldstein BA, Liu N. AutoScore: a machine learning-based automatic clinical score generator and its application to mortality prediction using electronic health records. JMIR Med Inform. 2020;8(10):e21798. doi:10.2196/21798
32. Hui P, Cook DJ, Lim W, Fraser GA, Arnold DM. The frequency and clinical significance of thrombocytopenia complicating critical illness: a systematic review. Chest. 2011;139(2):271–278. doi:10.1378/chest.10-2243
 © 2023 The Author(s). This work is published and licensed by Dove Medical Press Limited. The
full terms of this license are available at https://www.dovepress.com/terms
and incorporate the Creative Commons Attribution
- Non Commercial (unported, 3.0) License.
By accessing the work you hereby accept the Terms. Non-commercial uses of the work are permitted
without any further permission from Dove Medical Press Limited, provided the work is properly
attributed. For permission for commercial use of this work, please see paragraphs 4.2 and 5 of our Terms.
© 2023 The Author(s). This work is published and licensed by Dove Medical Press Limited. The
full terms of this license are available at https://www.dovepress.com/terms
and incorporate the Creative Commons Attribution
- Non Commercial (unported, 3.0) License.
By accessing the work you hereby accept the Terms. Non-commercial uses of the work are permitted
without any further permission from Dove Medical Press Limited, provided the work is properly
attributed. For permission for commercial use of this work, please see paragraphs 4.2 and 5 of our Terms.
Recommended articles
Development and Validation of a Nomogram for Predicting 28-Day Mortality on Admission in Elderly Patients with Severe Community-Acquired Pneumonia
Song Y, Wang X, Lang K, Wei T, Luo J, Song Y, Yang D
Journal of Inflammation Research 2022, 15:4149-4158
Published Date: 21 July 2022
Tracking Epidemiological Characteristics and Risk Factors of Multi-Drug Resistant Bacteria in Intensive Care Units
Wu C, Lu J, Ruan L, Yao J
Infection and Drug Resistance 2023, 16:1499-1509
Published Date: 15 March 2023
Dynamic Nomogram for Subsyndromal Delirium in Adult Intensive Care Unit: A Prospective Cohort Study
Cheng J, Lao Y, Chen X, Qiao X, Sui W, Gong X, Zhuang Y
Neuropsychiatric Disease and Treatment 2023, 19:2535-2548
Published Date: 22 November 2023
Analysis of Risk Factors and Development of a Predictive Model for Delirium in ICU Patients: Construction, Validation, and Clinical Implications
Li X, Zhang W, Wang T, Qiu Z, Sun X, Qu W, Zhang G
International Journal of General Medicine 2025, 18:3727-3737
Published Date: 5 July 2025
Development and Validation of a Prediction Model for Intensive Care Unit-Acquired Weakness in Adult Patients with Sepsis: A Prospective, Observational, Single-Center Study
Wang B, Liu Y, He G, Sun S, Han J, Zhang M, He L, Meng S
International Journal of General Medicine 2026, 19:569937
Published Date: 14 April 2026