Back to Journals » Drug Design, Development and Therapy » Volume 17
Development and Validation a UPLC-MS/MS Method for Quantification of Pentoxifylline in Beagle Plasma: Application for Pharmacokinetic Study of Food Effect
Authors Xu Y ![]() , Gao X
, Gao X ![]() , Zhu Y, Zhang Q, Qie H, Zhao H, Gao J
, Zhu Y, Zhang Q, Qie H, Zhao H, Gao J ![]() , Wang M
, Wang M
Received 6 September 2023
Accepted for publication 18 November 2023
Published 28 November 2023 Volume 2023:17 Pages 3551—3561
DOI https://doi.org/10.2147/DDDT.S434492
Checked for plagiarism Yes
Review by Single anonymous peer review
Peer reviewer comments 3
Editor who approved publication: Dr Tuo Deng
Yuxiang Xu, Xiaonan Gao, Yunfang Zhu, Qi Zhang, Hongxin Qie, Haopeng Zhao, Jinglin Gao, Mingxia Wang
Department of Clinical Pharmacology, The Fourth Hospital of Hebei Medical University, Shijiazhuang, 050011, People’s Republic of China
Correspondence: Mingxia Wang, Department of Clinical Pharmacology, The Fourth Hospital of Hebei Medical University, 12 Jiankang Road, Shijiazhuang, 050011, People’s Republic of China, Tel +86-311-66696233, Email [email protected]
Purpose: To develop an UPLC-MS/MS method for the quantitative analysis of pentoxifylline in beagle dog plasma and apply it to a pharmacokinetic study of food effect.
Methods: Sample separation was achieved using a Kinetex Phenyl-Hexyl column (50 × 2.1 mm, 1.7 μm) with a gradient elution program in 5.5 min after a simple protein precipitation with methanol. Using the mobile phase that made up by 0.2% formic acid and 5mM ammonium formate water (A) and methanol (B). Quantitation was carried out using the positive ionization mode with multiple reaction monitoring (MRM). A randomized, single-dose, two-period crossover study was conducted in six fasted or fed beagles that received 400 mg pentoxifylline sustained-release tablets (Brand name: Shuanling™, CSPC Pharmaceutical Group). WinNonlin® software was used to calculate pharmacokinetic parameters.
Results: The linear calibration range was 2– 1000 ng/mL (r2> 0.99). Both intra- and inter-batch precision were less than 6.27%, and the accuracy ranged from 88.65% to 97.18%. Pentoxifylline was readily absorbed in fasted and fed dogs administered a dose of 400 mg (tmax:1.54h vs 1.83h). Compared to the fasted group, the AUC0→t and Cmax in the fed group increased by 1.71-fold and 1.30-fold, respectively. In the fasted group, the AUC0→t and Cmax values were 4684.08 h•ng/mL and 2402.33 ng/mL, respectively. In the fed group, these values were 8027.75 h•ng/mL and 3119.67 ng/mL. The difference in AUC0-t between the fed and fasted group was statistically significant.
Conclusion: The novel optimized UPLC-MS/MS assay is an effective tool for the determination of pentoxifylline and has been successfully applied in pharmacokinetic studies of pentoxifylline in beagle dogs. The administration of pentoxifylline sustained-release tablets with food significantly increased the area under the time curve, and it is recommended that they should be administered during or shortly after feeding.
Keywords: pentoxifylline, sustained-release tablets, food effect, UPLC-MS/MS, pharmacokinetics
Graphical Abstract:

Introduction
Pentoxifylline (PTX) is a methylxanthine derivative with potent hemorheological properties that has been used for several decades in the symptomatic management of intermittent claudication. A large body of research suggests that this drug may play a broad role in promoting cardiovascular health.1 Human and animal studies have shown that PTX therapy results in various physiological changes at the cellular level, which may be important for treating a diverse group of human afflictions.2 This drug benefits blood rheology in several complementary ways, including decreasing blood and plasma viscosity, lowering plasma fibrinogen while promoting fibrinolysis, and improving blood filterability by enhancing erythrocyte distensibility and lessening neutrophil activation.1
PTX is highly metabolized in humans and animals and is converted into its many metabolites. In humans, PTX is metabolized into at least seven metabolites, including active 5-hydroxyhexyl metabolite (M-I, lisofylline). One of the major metabolites of PTX in plasma is M-I, which is formed by reduction in RBCs and the liver. The pharmacological activity of M-I is similar to that of PTX, and the metabolism of M-I is rapid and reversible.2 PTX is extensively metabolized by the liver, resulting in a reduction of therapeutic levels within a short duration.3 Therefore, a sustained-release (SR) dosage form of PTX was formulated to avoid frequent dosing.4 A more comprehensive understanding of pharmacokinetic properties and factors contributing to inter- and intra-individual variability is critical for optimizing the clinical use of SR formulations. At present, for different indications, including peripheral vascular and cerebrovascular diseases, PTX is recommended at 400–800 mg orally every day.5 However, there is a lack of relevant studies on the influence of food on the pharmacokinetic parameters of sustained-release pentoxifylline formulations. Furthermore, we found that for theophylline, which is also a methylxanthine derivative, especially in SR formulations, food intake has a certain influence on its pharmacokinetics.6 In addition, feeding affects gastrointestinal physiology and may therefore influence the pharmacokinetics of concurrently administered drugs through reduced, delayed, increased, or accelerated absorption.7,8 Altered pharmacokinetics may have an impact on the clinical activity of PTX; however, a drug-food effect cannot be predicted on a scientific basis, and specific studies are required to investigate its possible effects.8 Thus, this study was performed to evaluate the effect of food on the pharmacokinetic profile of PTX sustained-release tablets.
Few methods have been reported in literature, which are based on either a complex sample preparation procedure or use instrument with lower sensitivity like HPLC-UV. Uney et al9 developed a HPLC-UV method with a high lower limit of quantification (0.04–40 μg/mL). In addition to a narrow linear range, other HPLC-UV concentration determination methods of PTX also suffer from long running time, a cumbersome pre-treatment process and large injection volume.10–13 The literature reports LC-MS/MS methods for determining the concentration of PTX. However, this method is relatively cumbersome due to pre-treatment methods such as solid-phase extraction (SPE) and liquid-liquid extraction (LLE). Additionally, the protein precipitation process involves the use of the SeraPrep reagent precipitating agent, which is not accessible.14,15 Vlase et al reported a LC-MS/MS method that utilizes perchloric acid as a precipitant. The pretreatment process is relatively straightforward; however, in comparison to our determination method, it requires a larger volume of plasma and has a higher lower limit of quantification (5 ng/mL).16 A summary of methods for determination of PTX concentration in blood in Table 1. Considering the limitations of the published methods, we aimed to develop a rapid, simple, sensitive, and economical UPLC-MS/MS method for determination, and this method can be further applicated for pharmacokinetic studies.
 |
Table 1 Summary of Methods for Determination of PTX Concentration in Blood |
Materials and Method
Chemicals Materials
PTX (purity >99%; E0024848) was gifted by the CSPC Pharmaceutical Group (Shijiazhuang, China). Phenacetin (purity > 99%; 2000601-6012111035-B22052108) was purchased from Bepure Co. Ltd. (Beijing, China). HPLC-grade methanol and acetonitrile were purchased from Fisher Scientific (Waltham, MA, USA). Formic acid and ammonium acetate were obtained from Mreda Technology Inc. (Dallas, TX, USA). Ultrapure water was provided by the Watson and Company (Guangzhou, China).
Instruments
LC was performed using an ExionLC™ analytical (UPLC) system (AB Sciex, USA), including a AD controller, binary pump, and degasser. MS analysis was performed on an AB Sciex Triple Quad 5500 mass spectrometer (5500 Q-trap; Applied Biosystems Inc., USA) equipped with an electrospray ionization (ESI) source operating in the positive ion mode.
Solutions Preparation
PTX (10 mg of PTX in a volumetric flask, dissolved in methanol, and fixed to obtain a 1 mg/mL standard stock solution). Phenacetin (internal standard, IS) stock solution (1 mg/mL) was prepared using the same method. A stock solution of 1 mg/mL PTX was diluted with methanol/water (1:1, v/v) to obtain working solutions of 20, 50, 200, 500, 1000, 2000, 5000 ng/mL, and 10 μg/mL for PTX. Calibration standard samples were prepared by spiking 10 μL PTX working solutions into 90 μL dog drug-free plasma to final PTX concentrations of 2, 5, 20, 50, 100, 200, 500, and 1000 ng/mL. The lower limit of quantitation (LLOQ; 2 ng/mL), low quality control (LQC; 4 ng/mL), middle quality control (MQC; 80 ng/mL), and high quality control (HQC; 800 ng/mL) were prepared in the same way. An IS working solution with a concentration of 5 ng/mL was obtained by diluting the stock solution with methanol.
Plasma Sample Treatment
The IS working solution (600 μL) and 100 μL beagle dog plasma were mixed in a 1.5 mL centrifuge tubes, vortexed for 3 min, and centrifuged at 13,000 × g for 5 min. Then, 50 μL of the supernatant was transferred to 450 μL of water, vortexed for 1 min, and centrifuged at 13,000×g for 3 min. Finally, 5 μL of the supernatant was injected into the UPLC-MS/MS system for the analysis.
Analytical Conditions
Chromatographic analysis was performed on a Kinetex Phenyl-Hexyl column (50 × 2.1 mm, 1.7 μm; Phenomenex, USA), and the temperature was maintained at 40°C during the analysis. The mobile phase consisted of 0.2% formic acid and 5mM ammonium formate water (A) and methanol (B), with a gradient elution procedure:0–1.0 min A 70→20%, 1.0–3.0 min A 20%, 3.0–3.5 min A 20→70%, and 3.5–5.5 min A 70%. The autosampler was set at 4°C, and a 5 μL sample was injected into the UPLC-MS/MS system at a flow rate of 0.2 mL/min.
PTX and IS were monitored by multiple reaction monitoring (MRM) as the following mass transition pairs: m/z 279.1 → 181.0 for PTX and m/z 180.1 →110.0 for IS. The collision energies of PTX and IS were 25 eV and 27 eV, respectively, and the declustering potentials of PTX and IS were 110V and 90V respectively. The secondary mass spectrograms of PTX and the IS are shown in Figure 1.
 |
Figure 1 The product ion plots of pentoxifylline (A) and IS (B), the red boxes represent quantitative ion pairs. |
Method Validation
The proposed UPLC-MS/MS method for the determination of PTX in beagle dog plasma was validated according to the guidelines of the US Food and Drug Administration and the Chinese Pharmacopoeia.17–19
Specificity and Selectivity
The specificity of the UPLC-MS/MS method was evaluated by comparing the chromatograms of blank beagle dog plasma samples from different sources, beagle dog blank plasma spiked with PTX and IS, and beagle dog plasma samples after PTX administration. The corresponding response should be less than 20% for the analytes at the LLOQ and 5% for the IS.
Calibration Curve, Linearity and Lower Limit of Quantitation
The calibration curves were prepared by plotting the peak area ratio of PTX (2, 5, 20, 50, 100, 200, 500, and 1000 ng/mL) to the IS against the nominal concentrations using linear least squares and 1/x2 weighted regression. The regression coefficient (r2) of the standard curve must be greater than 0.99. The back-calculated concentrations should not deviate by more than 15% from the nominal values but should be within ± 20% at the LLOQ. The LLOQ was defined as the lowest concentration of the calibration curve with S/N ≥ 10.
Precision and Accuracy
Intra- and inter-batch precision and accuracy were evaluated by determining the QC samples of PTX at four concentration levels in five replicates on the same day and on more than two days, respectively. Precision was expressed as the relative standard deviation (RSD, %), and accuracy was calculated as the percentage of the measured concentration to the theoretical concentration.
Carryover and Dilution Integrity
Carryover was evaluated by analyzing a blank sample after the highest calibration standard sample was injected. The peak area of the analyte in the blank sample should not exceed 20% of the LLOQ or 5% of the internal standard. Dilution integrity was evaluated in plasma samples when the actual PTX concentration exceeded the upper quantitative limit (1000 ng/mL). This proves that the accuracy and precision of this method were not affected by plasma samples diluted with a blank matrix. Blank plasma was used as a diluting agent to perform 10, 20 and 50-fold dilutions with five replicates each. The precision for QC samples should be <15% RSD, and the accuracy should not exceed ±15% from the nominal concentrations at each QC concentration.
Matrix Effect and Recovery
The matrix effect, the differential ionization of analyte(s) due to matrix components present in the biological samples, was evaluated as the IS-normalized matrix factor (MF) at the LQC and HQC concentration levels. MF was calculated as the ratio of the peak area in the presence of the matrix (blank matrix spiked after extraction) to the peak area in the absence of the matrix (neat aqueous samples). The IS-normalized MF was calculated by dividing the MF of PTX by that of IS. Finally, RSDs (%) of the IS-normalized MF were compared. Recovery was calculated as the ratio of the peak area extracted with the matrix (blank matrix spiked before extraction) to the peak area in the presence of the matrix (blank matrix spiked after extraction).
Stability
At LQC and HQC, the stability of plasma samples was investigated under four different storage conditions: room temperature for 4 h, processed samples at 4°C in an auto-sampler tray for 24 h, three freeze-thaw cycles (−80°C), and −80°C for 4 weeks.
Reanalysis of Test Samples
In order to assess the reproducibility of the method and the accuracy of determining samples that exceed the upper limit of quantification, we conducted reanalysis of test samples. The accuracy of the actual sample measurements was assessed by reanalyzing the test samples in a separate analytical batch on different days. To obtain results for samples near the maximum concentration (Cmax) and during the elimination phase, 10% of the samples were reanalyzed. In at least 67% of the replicate tests, the difference between the concentration measured by the original analysis and the concentration measured by the reanalysis should be within ±20% of the mean of the two.
Animals
Six male beagle dogs (male, weight 10.25–12.60 kg) were purchased from Beijing Keyu Animal Breeding Center Co., Ltd. (Beijing, China). The animal license number was SCXK (Jing) 2018–0010. Six beagles were raised in the Laboratory Animal Center of the Fourth Hospital of Hebei Medical University (Shijiazhuang, China). All experimental procedures were approved by the Institutional Ethics Committee of the Fourth Hospital of Hebei Medical University (Shijiazhuang, China), the approval number was IACUC-4th Hos Hebmu-2,023,201. The experimental procedure was performed in accordance with the Laboratory Animal Guidelines for Ethical Review of Welfare (GB/T 35,892–2018).
Study Design
Beagle dogs were individually kept indoors in pens for 1 month to avoid potential cross-contamination between animals and to adapt to the environment. The dogs had access to water ad libitum throughout the study period and were fed a standard diet. Each animal was uniquely identified and acclimatized to the study conditions for at least 1 week. Dogs were housed indoors in climate-controlled facilities in accordance with accepted laboratory animal care and use guidelines. Dogs were allowed daily opportunities for outdoor exercise and social interaction. They were fed once daily with an appropriate ratio of commercial canine feed and water was available ad libitum. The dogs were observed for general health, behavior, and appetite at least once daily throughout the study.
A randomized, single-dose, two-period, two-group, crossover study design was used in this study. Six beagles were enrolled and randomly divided into two groups, a fed group and a fasted group, with three subjects in each group, with a 5-day washout period. All dogs were dosed once orally with 400 mg PTX sustained-release tablets on Day 0. Tablets were placed on the back of the tongue and swallowing was stimulated with a small amount of tap water. Both groups were fasted for 12 h prior to PTX administration. Dogs in the fed group were offered a 50 g food ration 15 min prior to PTX administration. Dogs in the fasted group received orally administered PTX sustained-release tablets without fed and remained unfed for an additional 4 h. After completing the first cycle of the experiment and the subsequent washout period, the experimental beagle dogs exchanged the group. The experimental protocol for the second cycle remained the same as that of the first cycle.
Blood samples were collected within 30 min (0 min) prior to tablet administration, and then 0.25, 0.5, 0.75, 1, 1.5, 2, 2.5, 3, 4, 6, 8, 10, and 12h after PTX tablet administration in the fasted group. Blood samples were collected 0, 0.25, 0.5, 0.75, 1, 1.5, 2, 2.5, 3, 4, 6, 8, 10, 12 and 14h after PTX tablet administration in the fed group. Whole blood (2 mL) was collected into chilled polypropylene tubes containing K2-EDTA. Plasma was separated by centrifugation for 10 min at 2000 rpm, and the plasma was collected and stored at −80°C until analysis.
Pharmacokinetic Analysis
The pharmacokinetic (PK) parameters were analyzed based on a noncompartmental analysis (NCA) using WinNonlin® software (version 8.3.1, Pharsight, USA). PTX concentrations were obtained from the participants, plasma drug concentration-time data were fitted to determine the area under the curve (AUC0→t and AUC0→∞), the elimination half-life (T1/2), the clearance (CL/F), the mean residence time (MRT0→tand MRT0→∞) and the apparent volume of distribution (Vd/F). The values for the highest plasma drug concentration (Cmax) of PTX and the time to reach Cmax (Tmax) were obtained from the observed data using the concentration–time curve.
Statistical Analysis
The Analyst software (1.4.0 version) was used for data acquisition and quantification. Origin 2021® was used to draw plasma concentration-time curves. Analysis of variance (ANOVA) was performed on log-transformed AUC0→t, AUC0→∞, Cmax, CL/F, and Vd/F PK parameters. A non-parametric Mann–Whitney U-test was used to assess treatment differences for the Tmax, T1/2, MRT0→tand MRT0→∞ data. The PK evaluation of PTX sustained-release tablets was based on the plasma concentration of the parent compound for the area under the curve from time 0 to the last sampling time point, associated with a quantifiable concentration (AUC0→t), maximum plasma concentration (Cmax), and time to Cmax (tmax). The effect of food on PTX pharmacokinetics was calculated by comparing the mean AUC0→t and Cmax of both groups according to the following ratios: AUC0→t (fed) /AUC0→t (fasted) or Cmax (fed) /Cmax (fasted).
Results
Specificity and Selectivity
Under the above experimental conditions, PTX and IS were completely separated, and the endogenous substances did not interfere with detection. Representative chromatograms are shown in Figure 2. The retention times of PTX and the IS were 2.10 and 2.03 min, respectively. No significant interferences were observed at the retention times of PTX and the IS, implying that this method was sufficiently specific.
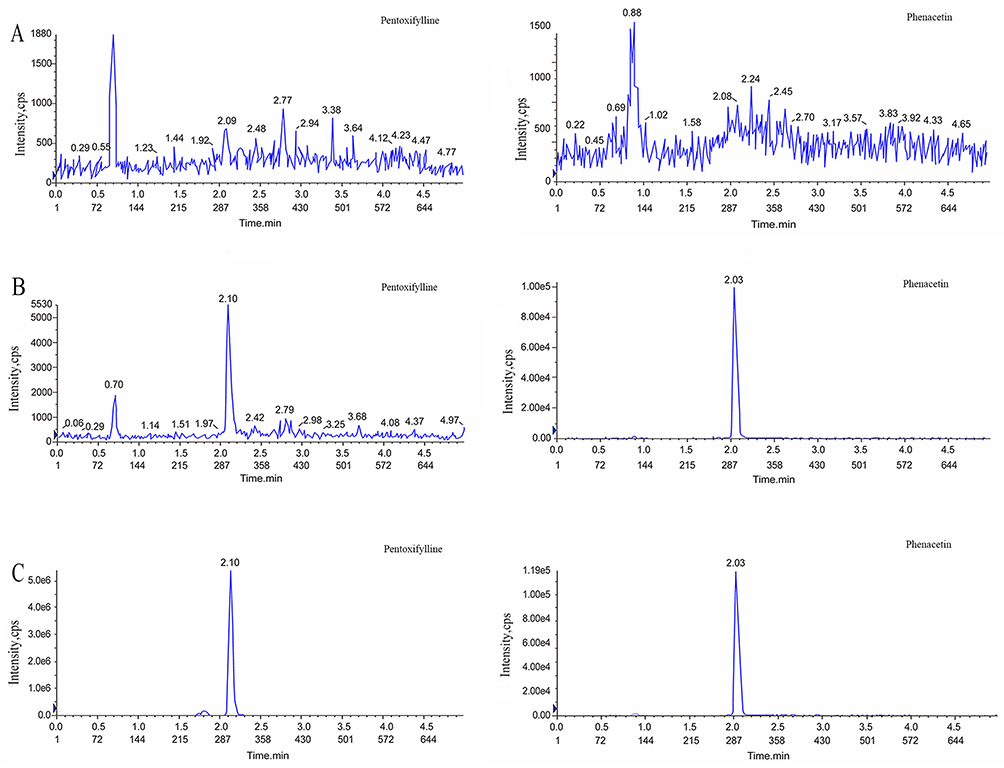 |
Figure 2 Typical MRM chromatograms of pentoxifylline (left) and IS (right): (A) blank plasma sample; (B) blank plasma sample spiked with pentoxifylline at 2 ng/mL and IS at 5 ng/mL; and (C) real sample in beagle dog. |
Calibration Curve, Linearity and Lower Limit of Quantitation
In the PTX concentration range of 2–1000 ng/mL, the typical regression equation of PTX was y = 0.02592 x + 0.0908 (r2 = 0.9992), which exhibited excellent linearity. The LLOQ was 2 ng/mL with an accuracy of 80–120%, and the RSD values representing precision were less than 20%.
Precision and Accuracy
Compared with the theoretical concentration, the accuracy of the LLOQ and QC samples for intra- and inter-batch complied with the FDA and Chinese Pharmacopoeia requirements, which were all acceptable (Table 2). The intra-batch precision and accuracy for PTX in five samples at each QC level, were 0.68–4.24% and 88.65%-96.41%, respectively. The inter-batch precision and accuracy, tested in triplicate for each QC level, were 2.50–6.27% and 92.70%-97.18%, respectively.
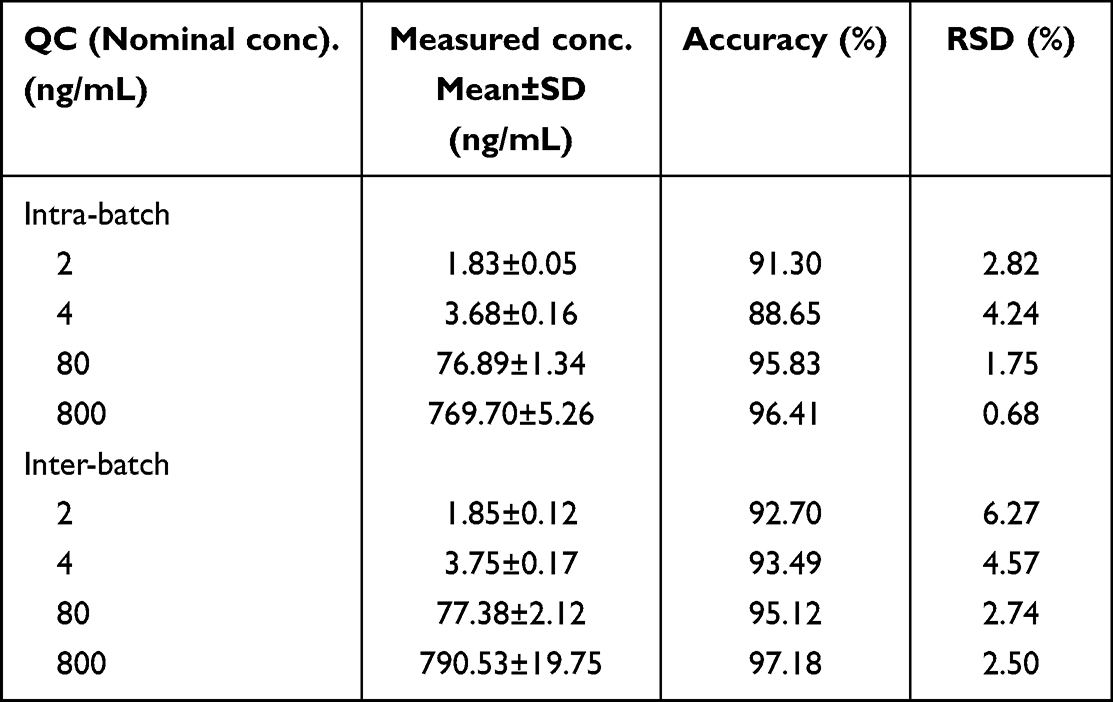 |
Table 2 Intra- and Inter-Batch Precision and Accuracy for PTX (n = 5) |
Carryover and Dilution Integrity
The peak area of the analyte in the blank sample was 2.60% of the LLOQ and 0.15% of the IS in each valid batch, meeting the requirements of clinical sample determination. The mean accuracy values were 89.38%, 91.43% and 95.56% for the 10-, 20-, and 50-fold dilutions, respectively. The RSD% values for the precision attained were <7.58%. The clinical samples were diluted with blank plasma without affecting the accuracy and precision of this method.
Matrix Effect and Recovery
Our results showed that the IS-normalized MFs (RSD%) at PTX concentrations of LQC (4 ng/mL), and HQC (800 ng/mL) were 0.99 (2.84%), and 1.03 (3.27%), respectively. The recovery of PTX at LQC (4 ng/mL), MQC (80 ng/mL), and HQC (800 ng/mL), were observed as 83.50%, 90.10% and 88.44%, respectively. The recovery rate of the IS was 94.97%.
Stability
All stability results are summarized in Table 3, and PTX in beagle dog plasma was found to be stable under the conditions described above.
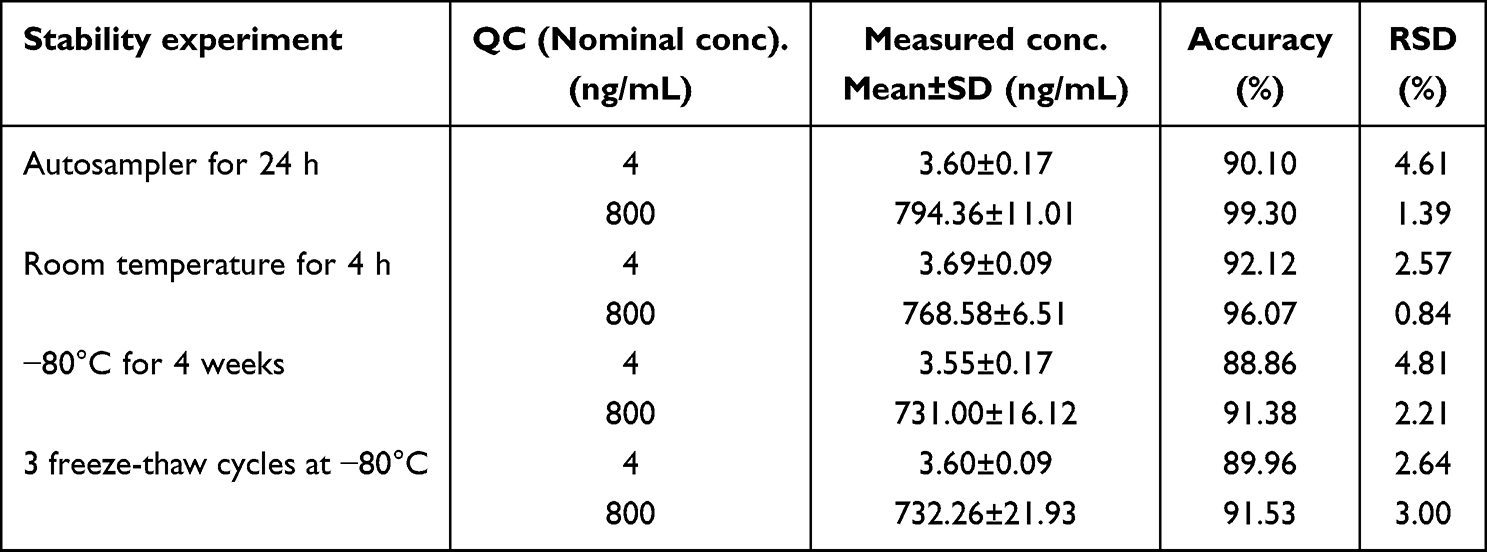 |
Table 3 Stability of PTX in Dog Plasma (n=5) |
Reanalysis of Test Samples
The results indicated that in over 67% of the repeated tests, the difference between the concentration measured in the original analysis and the concentration measured in the reanalysis fell within ±20% of the mean of the two measurements.
Pharmacokinetic Parameters of PTX in Beagle Dogs
This study successfully developed a novel analytical method and applied it to investigate the pharmacokinetics of PTX sustained-release tablets in Beagle dogs. The major pharmacokinetic parameters of PTX are listed in Table 4. Plasma samples were collected from six beagle dogs weighing between 10.25–12.60 kg. Samples were collected at 0–12h (fasted) and 0–14h (fed) to measure the PTX plasma concentrations. The data obtained were used to plot the drug duration curve for beagles under both feeding and fasting conditions. Figure 3 illustrates the trend in the plasma concentration over time. Pharmacokinetic analyses revealed that PTX was rapidly absorbed with a tmax of 1.54h and 1.83h in the fasted and fed group. The T1/2, CL/F, and Vd/F were significantly higher in the fasted group than in the fed group. In contrast, the fed group exhibited higher Cmax, AUC0→t and AUC0→∞ values compared to the fasted group, and AUC0→t and AUC0→∞ were statistically significant (p=0.022, 0.023<0.05), respectively. The AUC0→t (fed) /AUC0→t (fasted) and Cmax (fed) /Cmax (fasted) were 1.71 and 1.30, respectively. Throughout the experiment, no significant adverse events were observed when oral PTX sustained-release tablets were administered to the fasted or fed dogs.
 |
Table 4 PTX Pharmacokinetic Parameter Following Oral Administration (400 mg) in Fasted or Fed Dogs |
 |
Figure 3 Curve of pentoxifylline plasma concentration (Mean± SD) following oral administration (400 mg) in fasted or fed dogs. |
Discussion
For the organic phase in the UPLC-MS/MS analysis, methanol functioned well for both the peak response and peak shape. The addition of formic acid and ammonium acetate to the water phase can adjust the pH of the mobile phase and further enhance the ionization efficiency and peak shape in positive ion mode. In this study, 0.1% and 0.2% formic acid, and 5 mM and 10 mM ammonium acetate were tested separately. Finally, 0.2% formic acid and 5 mM ammonium acetate in water and methanol were found to be the optimal mobile phases for PTX and IS separations. In addition, we used a high percentage of methanol (from 10% to 30%) and the common needle washing solutions, methanol and water (1:1, v/v), to eliminate the carryover of PTX and found that carryover can be significantly improved by increasing the initial organic phase ratio. Consequently, the peak area in the blank for the peak area of the LLOQ was 2.6%.
Orally administered PTX was readily absorbed in fasted and fed dogs, and was quantifiable in both groups throughout the study period. Similar peak plasma concentrations of PTX have been observed in dogs and humans after oral administration (approximately 1 µg/mL).11 Previous studies have shown that PTX is rapidly absorbed and metabolized in dogs after oral administration and that a regimen of 15 mg/kg (q 8h, common tablet) produces plasma concentrations comparable to human therapeutic doses, with no drug accumulation observed. In this study, beagle dogs were administered a single dose of 400 mg sustained-release tablets. At similar dosage levels, blood concentrations in the fasted group were similar to those reported in previous studies,11 whereas blood concentrations in the fed group were significantly higher than the average treatment concentrations. Therefore, we believe that 400 mg of PTX sustained-release tablets could be an effective therapeutic dose, and it is worth considering that administering the tablets after a meal might lead to a more favorable therapeutic response.
In both groups, PTX exhibited variations in pharmacokinetic parameters. The calculated AUC0→t ratio was 1.71 and the Cmax ratio was 1.30 between the two groups. AUC0→t was significantly higher in the fed group, indicating that oral administration of PTX sustained-release tablets after meals could enhance its exposure in vivo. For most sustained-release formulations, slow release of the drug acts as a rate-limiting factor in the absorption process.20 The absorption of sustained-release preparations may be influenced by effective intestinal transit time and various factors that directly or indirectly affect the release rate. This includes the rate of gastric emptying and intestinal motility as well as the nature of gastrointestinal contents, such as pH, ionic strength, viscosity, and splanchnic blood flow.21 Food can affect drug bioavailability through various mechanisms such as delaying gastric emptying time, stimulating bile flow, and altering gastrointestinal pH.20 The AUC0-t in fed group was significantly higher than that in the fasted group, possibly because of the above reasons. Additionally, significant differences were observed between two groups in T1/2, CL/F, and Vd/F, suggesting that these differences may be attributed to an increased liver uptake rate caused by food. Co-administration of a drug with food may affect inter-individual variability in drug plasma concentrations.8 In this study, both the AUC and Cmax exhibited similar standard deviations in the fed and fasted groups, indicating less significant variation among individuals for this particular formulation. These findings further support the recommendation of PTX administration in food.
In placebo-controlled studies of patients with peripheral vascular disease, gastrointestinal irritation was the most common adverse reaction.5 Furthermore, studies have indicated that the occurrence of drug-related adverse reactions to PTX may be associated with its Cmax.5 In this study, although Cmax was significantly increased in the fed group, no adverse events were observed in the fasted and fed dogs. Therefore, increased PTX exposure in the fed group was not associated with a higher risk of toxicity. This finding could be attributed to the potential reduction in gastrointestinal irritation caused by the food. In the fed group, the increased AUC may indicate better efficacy; administering the PTX sustained-release tablet without food intake would result in a decreased exposure to PTX. Our study suggests that newly developed PTX sustained-release tablets should be administered after meals.
Conclusions
A robust, quick, and reliable UPLC-MS/MS assay was fully optimized and developed to investigate the effect of food on the pharmacokinetic parameters of PTX sustained-release tablets in Beagle dogs. Food affects the pharmacokinetic properties and increases the bioavailability of PTX sustained-release tablets after a single oral dose. Oral administration of PTX to the fed dogs resulted in a total exposure was 1.71 times greater than that in the fasted group. Similarly, the Cmax was 1.30 times higher in the fed group than in the fasted group.To enhance the effectiveness of PTX sustained-release tablets, they should be administered during or immediately after feeding.
Acknowledgments
This work was supported by the National Science and Technology Major Project for Major New Drugs Innovation and Development 2020 in China (No. 2020ZX09201006) and Hebei Medical Science Research Project (No. 20200105). We would like to express our gratitude to Ms. Jianli Liu and CSPC Pharmaceutical Group for their support in conducting this experiment.
Disclosure
The authors report no conflicts of interest in this work.
References
1. McCarty MF, O’Keefe JH, DiNicolantonio JJ. pentoxifylline for vascular health: a brief review of the literature. Open Heart. 2016;3(1):e000365. doi:10.1136/openhrt-2015-000365
2. Samlaska CP, Winfield EA. pentoxifylline. J Am Acad Dermatol. 1994;30(4):603–621. doi:10.1016/S0190-9622(94)70069-9
3. Shailendrakumar AM, Ghate VM, Kinra M, et al. Improved oral pharmacokinetics of pentoxifylline with palm oil and capmul® MCM containing self-nano-emulsifying drug delivery system. AAPS Pharm Sci Tech. 2020;21(4):118. doi:10.1208/s12249-020-01644-w
4. Yuen KH, Wong JW, Peh KK, et al. Comparative bioavailability study of two controlled-release pentoxifylline tablet preparations. Drug Dev Ind Pharm. 2000;26(7):803–807. doi:10.1081/DDC-100101303
5. Ward A, Clissold SP. A review of its pharmacodynamic and pharmacokinetic properties, and its therapeutic efficacy. Drugs. 1987;34(1):50–97. doi:10.2165/00003495-198734010-00003
6. González MA, Straughan AB. Effect of meals and dosage-form modification on theophylline bioavailability from a 24-hour sustained-release delivery system. Clin Ther. 1994;16(5):804–814.
7. Welling PG. Effects of food on drug absorption. Annu Rev Nutr. 1996;16(1):383–415. doi:10.1146/annurev.nu.16.070196.002123
8. Singh BN. Effects of food on clinical pharmacokinetics. Clin Pharmacokinet. 1999;37(3):213–255. doi:10.2165/00003088-199937030-00003
9. Uney K, Tras B, Corum O, et al. Pharmacokinetics of pentoxifylline and its 5-hydroxyhexyl metabolite following intravenous administration in cattle. Trop Anim Health Prod. 2019;51(2):435–441. doi:10.1007/s11250-018-1710-8
10. Mancinelli A, Pace S, Marzo A, et al. Determination of pentoxifylline and its metabolites in human plasma by high-performance liquid chromatography with solid-phase extraction. J Chromatogr. 1992;575(1):101–107. doi:10.1016/0378-4347(92)80509-O
11. Marsella R, Nicklin CF, Munson JW, et al. Pharmacokinetics of pentoxifylline in dogs after oral and intravenous administration. Am J Vet Res. 2000;61(6):631–637. doi:10.2460/ajvr.2000.61.631
12. Italiya KS, Sharma S, Kothari I, et al. Simultaneous estimation of lisofylline and pentoxifylline in rat plasma by high performance liquid chromatography-photodiode array detector and its application to pharmacokinetics in rat. J Chromatogr B Analyt Technol Biomed Life Sci. 2017;1061–1062:49–56. doi:10.1016/j.jchromb.2017.06.043
13. Dodda S, Makula A, Polagani SR, et al. Development and validation of bioanalytical liquid chromatography-tandem mass spectrometry method for the estimation of pentoxifylline in human plasma: application for a comparative pharmacokinetic study. Eur J Mass Spectrom. 2019;25(4):372–380. doi:10.1177/1469066718817929
14. Sripalakit P, Saraphanchotiwitthaya A. Validation of an HPLC method for determination of pentoxifylline in human plasma and its application to pharmacokinetic study. J AOAC Int. 2009;92(3):837–845. doi:10.1093/jaoac/92.3.837
15. Kyle PB, Adcock KG, Kramer RE, et al. Use of liquid chromatography-tandem mass spectrometry for the analysis of pentoxifylline and lisofylline in plasma. Biomed Chromatogr. 2005;19(3):231–236. doi:10.1002/bmc.441
16. Vlase L, Kiss B, Muntean D, et al. Rapid high-performance liquid chromatography-tandem mass spectrometry method for determination of pentoxifylline and its active metabolites M1 and M5 in human plasma and its application in bioavailability study. Talanta. 2010;82(3):945–951. doi:10.1016/j.talanta.2010.05.064
17. FDA. Guidance for industry: bioanalytical method validation; 2018. Available from: https://www.fda.gov/downloads/drugs/guidances/ucm070107.Pdf.
18. Xu RA, Lin Q, Qiu X, et al. UPLC-MS/MS method for the simultaneous determination of imatinib, voriconazole and their metabolites concentrations in rat plasma. J Pharm Biomed Anal. 2019;166:6–12. doi:10.1016/j.jpba.2018.12.036
19. Tang C, Niu X, Shi L, et al. In vivo pharmacokinetic drug-drug interaction studies between fedratinib and antifungal agents based on a newly developed and validated UPLC/MS-MS method. Front Pharmacol. 2021;11:626897. doi:10.3389/fphar.2020.626897
20. US Food & Drug Administration. Guidance for industry Food-Effect Bioavailability and Fed Bioequivalence Studies; 2002. Available from: https://www.fda.gov/regulatory-information/search-fda-guidance-documents/food-effect-bioavailability-and-fed-bioequivalence-studies.
21. Le Liboux A, Teule M, Frydman A, et al. Effect of diet on the single- and multiple-dose pharmacokinetics of sustained-release ketoprofen. Eur J Clin Pharmacol. 1994;47(4):361–366.
 © 2023 The Author(s). This work is published and licensed by Dove Medical Press Limited. The
full terms of this license are available at https://www.dovepress.com/terms
and incorporate the Creative Commons Attribution
- Non Commercial (unported, 3.0) License.
By accessing the work you hereby accept the Terms. Non-commercial uses of the work are permitted
without any further permission from Dove Medical Press Limited, provided the work is properly
attributed. For permission for commercial use of this work, please see paragraphs 4.2 and 5 of our Terms.
© 2023 The Author(s). This work is published and licensed by Dove Medical Press Limited. The
full terms of this license are available at https://www.dovepress.com/terms
and incorporate the Creative Commons Attribution
- Non Commercial (unported, 3.0) License.
By accessing the work you hereby accept the Terms. Non-commercial uses of the work are permitted
without any further permission from Dove Medical Press Limited, provided the work is properly
attributed. For permission for commercial use of this work, please see paragraphs 4.2 and 5 of our Terms.