Back to Journals » International Journal of Nanomedicine » Volume 18
Development and Optimization of Imiquimod-Loaded Nanostructured Lipid Carriers Using a Hybrid Design of Experiments Approach
Authors Kim S ![]() , Abdella S, Abid F, Afinjuomo F, Youssef SH
, Abdella S, Abid F, Afinjuomo F, Youssef SH ![]() , Holmes A, Song Y
, Holmes A, Song Y ![]() , Vaidya S, Garg S
, Vaidya S, Garg S ![]()
Received 16 December 2022
Accepted for publication 14 February 2023
Published 22 February 2023 Volume 2023:18 Pages 1007—1029
DOI https://doi.org/10.2147/IJN.S400610
Checked for plagiarism Yes
Review by Single anonymous peer review
Peer reviewer comments 2
Editor who approved publication: Prof. Dr. Anderson Oliveira Lobo
Sangseo Kim,1 Sadikalmahdi Abdella,1 Fatima Abid,1 Franklin Afinjuomo,1 Souha H Youssef,1 Amy Holmes,1 Yunmei Song,1 Sachin Vaidya,2 Sanjay Garg1
1Centre for Pharmaceutical Innovation, Clinical and Health Sciences, University of South Australia, Adelaide, SA, 5000, Australia; 2Central Adelaide Local Health Network, The Queen Elizabeth Hospital, Woodville, SA, 5011, Australia
Correspondence: Sanjay Garg, Tel +61 8 8302 1575, Email [email protected]
Background: Imiquimod (IMQ) is an immunomodulating drug that is approved for the treatment of superficial basal cell carcinoma, actinic keratosis, external genital warts and perianal warts. However, IMQ cream (Aldara®) has several drawbacks including poor skin permeation, local toxicity, and compromised patient compliance as a topical pharmacological option.
Methods: Our research aimed to develop and optimize nanostructured lipid carriers (NLCs) containing IMQ for the first time using a hybrid design of experiments approach. The optimized formulation was then incorporated into a matrix-type topical patch as an alternative dosage form for topical application and evaluated for IMQ deposition across different skin layers in comparison to the performance of the commercial product. Additionally, our work also attempted to highlight the possibility of implementing environment-friendly practices in our IMQ-NLCs formulation development by reviewing our analytical methods and experimental designs and reducing energy and solvent consumption where possible.
Results: In this study, stearyl alcohol, oleic acid, Tween® 80 (polysorbate 80), and Gelucire® 50/13 (Stearoyl polyoxyl-32 glycerides) were selected for formulation development. The formulation was optimized using a 2k factorial design and a central composite design. The optimized formulation achieved the average particle size, polydispersity index, and zeta potential of 75.6 nm, 0.235, and – 30.9 mV, respectively. Subsequently, a matrix-type patch containing IMQ-NLCs was developed and achieved a statistically significant improvement in IMQ deposition in the deeper skin layers. The IMQ deposition from the patch into the dermis layer and receptor chamber was 3.3 ± 0.9 μg/cm2 and 12.3 ± 2.2 μg/cm2, while the commercial cream only deposited 1.0 ± 0.8 μg/cm2 and 1.5 ± 0.5 μg/cm2 of IMQ, respectively.
Conclusion: In summary, IMQ-NLC-loaded patches represent great potential as a topical treatment option for skin cancer with improved patient compliance.
Keywords: imiquimod, nanostructured lipid carrier, design of experiments, topical patches, skin cancer, greenness evaluation
Introduction
Imiquimod (1-(2-methyl propyl)-1H-imidazo[4,5-c]quinolin-4-amine) (IMQ) is an immunomodulating drug that is approved by the United States Food and Drug Administration (FDA) for the treatment of superficial basal cell carcinoma, actinic keratosis, external genital warts and perianal warts.1 It is known to activate innate and acquired immunity by mainly engaging the toll-like receptor-7 and 8 on dendritic cells. When bound to these receptors, IMQ induces the release of nuclear factor-kappa B and pro-inflammatory cytokines to activate cell-mediated immunity with antitumoral activities.2
IMQ is commercially available as a topical cream (Aldara®); however, topically applied IMQ often suffers from a few drawbacks including poor skin permeation which may contribute to its limited therapeutic efficacy against many other types of skin cancer.3 Stratum corneum is the outermost layer of skin that plays a fundamental role as the main physical barrier to many drugs. In particular, the physicochemical characteristics of IMQ where potential chemical interactions between 4 amine groups present in IMQ and polar components of the stratum corneum such as keratinocytes can significantly increase its accumulation within the stratum corneum forming a drug depot.3 The poor aqueous solubility of IMQ (18 µg/mL) could further contribute to the preclusion of IMQ from the aqueous environment of the dermal layer where more invasive skin cancer generally grows.3,4 Additionally, the excess superficial accumulation of IMQ within the cutaneous layers can ultimately trigger undesired local toxicities including psoriasis.5 From a clinical perspective, other limitations associated with commercial cream also include special handling requirements such as the use of an applicator and gloves as well as high dosing frequencies, which may reduce patient compliance.6
Lipid-based nanocarriers have demonstrated significant potential in topical delivery to improve drug permeation across the skin barrier.7 Various imiquimod-loaded lipid-based systems were previously developed for topical application including nanoemulsions,8 microemulsions,6 nano-lipidic capsules,9 and solid lipid nanoparticles (SLNs).10 Generally, SLNs and nano/microemulsions share a lot of similarities in their structure except that the liquid lipid in emulsions is substituted by solid lipid in SLNs.11 SLNs as a drug delivery system have many advantages for topical application including simple production methods, drug solubility improvement, controlled drug release, biocompatibility, minimal skin irritation, and good stability, among others.12 The solid lipid core of SLNs also provides good skin occlusion leading to increased skin hydration, in turn, promoting drug permeation and deposition into the deeper skin layers.13 However, SLNs often suffer from limited drug loading (DL) efficiency and a high risk of drug expulsion during storage.14 Nanostructured lipid carriers (NLCs) are a newer generation of SLNs that contain a binary mixture of solid and liquid lipids. Incorporating liquid lipids into the lipid core matrix of NLCs leads to distortion of the solid lipid crystallinity, providing higher drug payloads, less drug leakage, and better colloidal stability compared to SLNs. On the other hand, matrix-type patches containing NLCs have been considered as an alternative dosage form for topical application as they can offer several clinical advantages where they can be cut to any size while significantly reducing dosing frequencies and providing good protection of the formulation from the external environment.15,16
Preparation of NLCs involves many experimental components, each with a potentially significant contribution to the quality of the final product. The design of experiments (DoE) has gained significant attention as a systematic approach to understanding the technical process and variables that can significantly affect the output of a pharmaceutical product.19 DoE allows the identification of critical experimental factors and the effects on the critical quality attributes (CQAs) of a final product with a minimum number of experiments. It includes a range of different designs from Plackett–Burman design and the fractional factorial design as screening tools to the response surface methodology (RSM) such as central composite design (CCD) and Box–Behnken design (BBD) for optimization of pharmaceutical formulations.20 However, when there are high numbers of experimental factors to consider, a hybrid DoE approach utilizing a screening design followed by an RSM design can be useful to reduce the required number of experimental runs significantly. In a recent study, the total number of trials was largely reduced to 49 using a hybrid DoE approach from 120 proposed runs if the BBD was only utilized exclusively.21
On the other hand, despite pharmaceutical products playing an important role in curing diseases and enhancing human longevity and quality of life, the pharmaceutical industry is a high-intensity emitter of greenhouse gases aggravating the global issue of carbon footprint.22 A pharmaceutical product goes through a number of stages involving compound synthesis, analysis and formulation development. Synthesis of pharmaceutical compounds requires a series of reactions that could generate hazardous by-products and consumes solvents and significant levels of energy. The concept of green chemistry (GC) has been debated since the 1970s and the term was officially coined in 1991.23 The 12 principles of GC were defined by Anastas and Warner in 1998, which serve as the main reference of green practices to date.24 Similarly, green analytical chemistry (GAC) was introduced in the early 2000s and 12 principles of GAC were defined.25 Several metrics were developed, namely, national environmental methods index (NEMI),26 Raynie and Driver’s assessment tool,27 eco-scale assessment (ESA),28 green analytical procedure index (GAPI),29 and Analytical GREEnness Metric Approach and Software (AGREE).30 However, unlike GC and GAC, the assessment of the environmental impact of formulation processes is not extensively discussed in the literature.
To the best of our knowledge, IMQ-loaded NLCs (IMQ-NLCs) have never been reported in the literature and, therefore, our research aimed to develop and optimize IMQ-NLCs for the first time using a hybrid DoE approach including the 2k factorial design and CCD. The optimized IMQ-NLC formulation was then characterized for particle size (PS), polydispersity index (PDI), zeta potential (ZP), entrapment efficiency (EE), DL and colloidal stability. Afterwards, the optimized IMQ-NLCs were incorporated into a matrix-type patch as a suitable dosage form for topical application, in which its ex vivo permeation and deposition were investigated using porcine ear skin and compared with the commercial product. Furthermore, we attempted to highlight the possibility of implementing environment-friendly practices in our IMQ-NLCs formulation development by reviewing our analytical methods and experimental designs and reducing energy and solvent consumption where possible.
Materials and Methods
Materials
IMQ (>99%) was obtained from Hubei Vanz Pharm co. Ltd (Wuhan, China). Tween® 20 and Tween® 80 were purchased from Sigma-Aldrich (NSW, Australia). Precirol® ATO 5 (Glyceryl distearate), Compritol® 888 ATO (Glyceryl dibehenate), Gelucire® 48/16 (Polyoxyl-32 stearate), Gelucire® 50/13 (Stearoyl polyoxyl-32 glycerides), and Apifil® were kindly gifted by Gattefossé (St Priest, France). Peceol™, Captex® 300 Low C6, Captex® 500, Capmul® PG-8, and Capmul® PG-12 were kindly gifted by Abitec Corporation (OH, USA). Stearyl alcohol (STA), propylene glycol (PG) and oleic acid (OA) were procured from PCCA (NSW, Australia). Almond oil and sesame oil were purchased from Medisca (NSW, Australia). Isopropyl myristate and Miglyol® 812 were obtained from Acros organics (New Jersey, USA) and Bova compounding (NSW, Australia), respectively. Benecel™ K4M was received as a gift from Ashland (KY, USA). D100 D-Squame® sampling discs and D500 D-Squame® pressure instrument were purchased from Clinical & Derm (TX, USA).
HPLC Method for Quantification of IMQ
Quantification of IMQ was performed based on a reported validated HPLC method.31 A Shimadzu® LC system (Shimadzu Corporation, Kyoto, Japan) was used throughout this study. The machine was equipped with a pump (LC-20ADXR), an autosampler (SIL-20A HT), a degasser (DGU-20A3) and a photodiode array detector (SPD-M20A). PhenoSphere-Next™ C18 column (250 × 4.6 mm, 5 µm) was used, while the mobile phase consists of 0.1 M sodium acetate buffer adjusted to pH 4 and acetonitrile at a ratio of 60:40 (v/v). The volume of injection was 10 µL and a flow rate of 1.0 mL/min was applied. The total runtime was 5.5 minutes at which the peak was detected at 4.5 minutes using the wavelength of 244 nm.
Selection of Excipients
Solid Lipid Screening
The selection of solid lipids was based on their capacity to solubilize IMQ. The solubility of IMQ in various solid lipids available in our laboratory was determined by continuously adding an increment of each solid lipid to 10 mg of IMQ at 80 °C until there were no visible drug particles present after 24 hours.
Liquid Lipid Screening
Various liquid lipids were also screened for IMQ solubility. After an excess amount of IMQ was added to 1 mL of each oil, the mixture was subject to vortexing for 5 minutes and continuously mixed for 48 hours at 25 °C in an orbital mixer incubator (Ratek Instruments Pty Ltd, Victoria, Australia). The mixture was centrifuged at 5000 rpm for 15 minutes at 25 °C using a high-speed centrifuge (Eppendorf 5415R, San Diego, USA). The supernatant was diluted further using the mobile phase to determine the IMQ solubility according to the HPLC method.
Determination of the Binary Mixture Ratio
A series of binary mixtures (BMs) containing various ratios of solid and liquid lipids (90:10, 80:20, 70:30, 60:40, and 50:50) were prepared by melting and mixing the lipids for 1 hour at 75 °C in an orbital mixer incubator. Differential scanning calorimetry (DSC) analysis was carried out using a DSC250 (TA Instruments, DE, USA) to determine onset temperature, melting point, width of melting events (WME), enthalpy and crystallinity index (CI) of the solid lipid and BM. Briefly, 5 mg of each sample was sealed in an aluminum pan and analyzed from 25 to 90 °C at a ramp rate of 10 °C/min. The purge gas (nitrogen) was applied at a flow rate of 50 mL/min. The width of melting events and crystallinity index were obtained by substituting in the following equations:15


where ΔHBM and ΔHSL are the enthalpy of the BM and solid lipid, respectively.
In addition, a smear of the cooled BM was placed on a filter paper for 1 hour and the appearance of any oil droplets was determined by visual examination as previously described.32–34
Surfactant Screening
Various surfactants were screened to determine their emulsifying capacity for the BM. Briefly, preliminary NLCs were prepared by combining 1% (w/v) of the BM and various 3% (w/v) surfactant or surfactant mixtures that were separately prepared and heated to 70 °C prior to mixing. The mixtures were then subjected to ultrasonication (QSonica Q500, CT, USA) for 5 minutes at 35% amplitude. The emulsification capacity of the surfactants or surfactant mixtures was determined by measuring PS and PDI of the NLCs using a Zetasizer nano ZS (Malvern Instruments, Worcestershire, UK). The short-term colloidal stability of the preliminary NLCs was also visually examined for any signs of phase separation, precipitation or changes in transparency after 1 week of storage at room temperature (22 ± 2 °C).
Preparation and Optimization of IMQ-NLCs
Based on the excipient screening results, the IMQ-NLCs were prepared using STA, OA, polysorbate 80, and stearoyl polyoxyl-32 glycerides based on a hot melt homogenization followed by an ultrasonication method.35 The BM of lipids consisting of STA and OA was melted at 75 °C followed by the addition of IMQ (3.5% of the BM, w/w) under continuous stirring. Polysorbate 80 and stearoyl polyoxyl-32 glycerides at a 50:50 ratio were dispersed in water and heated separately to 75 °C and added to the BM phase under continuous stirring. The mixture was then subjected to high shear homogenization (Ultra Turrax® T25 basic, IKA Labortechnik, Germany) followed by ultrasonication (QSonica Q500, CT, USA). The mixture was then rapidly cooled in an ice bath to allow the formation of NLCs. Lyophilized NLCs were prepared for characterizations using a freeze dryer (Lyph-Lock® 6, Labconco, Kansas, USA) at 0.06 mbar and – 45 °C for 48 hours and stored in the refrigerator until further use. The principle of DoE was adopted in the screening and optimization of the concentration of various ingredients and processing parameters.
Design of Experiments for the Development and Optimization of NLCs
In this study, design matrices for statistical analysis of data obtained from DoE studies were generated and randomized using Design Expert® software (version 13, Stat-Ease Inc., Minneapolis, USA). Briefly, a hybrid approach including 2k factorial design and CCD was utilized for the initial identification of critical experimental parameters that most significantly affect the CQAs of the formulation and subsequent formulation optimization based on RSM, respectively.
2k Factorial Design for Screening
A 2k factorial design with IV resolution was employed for a screening of the most relevant experimental factors in the preparation of NLCs. Six experimental factors – BM concentration (X1), total surfactant concentration (X2), homogenization speed (X3), homogenization time (X4), sonication amplitude (X5), and sonication time (X6) – were screened using two levels for their effects on two dependent variables including PS (Y1) and PDI (Y2) (Table 1). Design Expert software was used to generate Pareto charts and perform analysis of variance (ANOVA) for each dependent variable to identify the most statistically significant experimental factors.
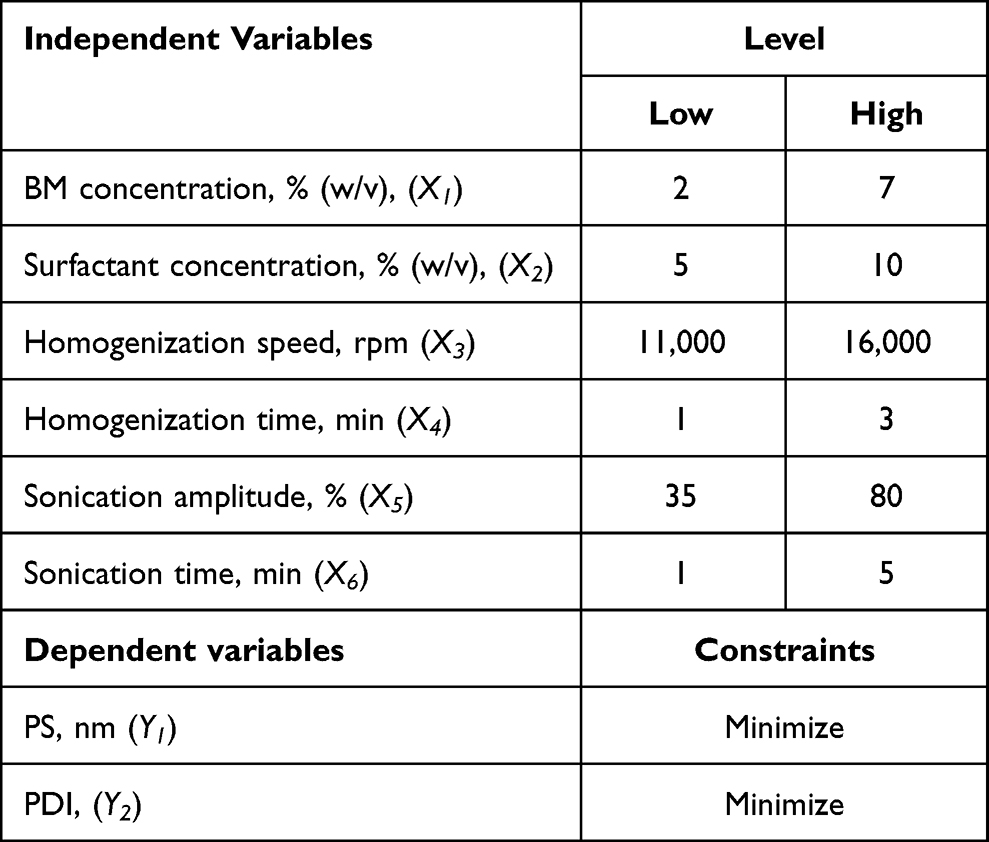 |
Table 1 Type and Level of Experimental Parameters and the Critical Quality Attribute Used in 2k Factorial Design |
Central Composite Design for Formulation Optimization
Based on the 2k factorial design results, three experimental factors including BM concentration (X1), total surfactant concentration (X2), and sonication time (X3) were used in a CCD at five levels to determine their effects on the PS (Y1), PDI (Y2) and ZP (Y3) (Table 2). For each dependent variable, the best-fit model from linear, two-factor interaction, quadratic or cubic models was determined based on ANOVA, R2, adjusted R2, predicted R2, adequate precision and lack-of-fit. The design space was navigated using the polynomial equation for the respective dependent variable, and 3D response surface plots were presented for visual evaluation. After the model fitting, the optimal experimental conditions were obtained by selecting criteria for each variable and the solution with the highest desirability was chosen. The model was validated at a 95% confidence interval by statistically comparing the predicted value with the observed value of optimized IMQ-NLCs for each dependent variable.
 |
Table 2 Type and Level of Experimental Parameters and the Critical Quality Attributes Used in Central Composite Design |
Characterization of IMQ-NLCs
Particle Size, Polydispersity Index, and Zeta Potential Determination
Dynamic light scattering using the Zetasizer was used to determine the PS, PDI, and ZP of NLCs. The formulations were diluted in 1:200 with MilliQ water to obtain uniform dispersion, and the refractive index of 1.439 at 25 °C was used for the measurements.
Entrapment Efficiency and Drug Loading Determination
The centrifugation procedure as previously described was used to determine EL and DL of the optimized IMQ-NLCs.36 Briefly, samples were centrifuged at 13,200 rpm at 4 °C for 60 minutes. The supernatant was collected, filtered using a syringe filter (0.22 µm pore size), diluted and analyzed using the HPLC method. EE (%) and DL (%) of the IMQ-NLCs were determined using the following equations:34


Differential Scanning Calorimetry
Thermal behaviors of IMQ, STA, a physical mixture of IMQ and STA, lyophilized blank NLCs, and lyophilized IMQ-NLCs were determined using a DSC 250 machine. Approximately 5 mg of each sample was prepared in an aluminum pan and crimp-sealed. The samples were analyzed between 25 °C and 350 °C at a heating rate of 10 °C/min. Nitrogen was used as a purge gas at a flow rate of 50 mL/min.
Fourier Transform-Infrared Spectroscopy
Spectra of IMQ, STA, physical mixture of IMQ and STA, lyophilized blank NLCs and lyophilized IMQ-NLCs were measured using a Spectrum Two Fourier transform-infrared (FTIR) spectroscopy spectrometer with UATR accessory (Perkin Elmer Inc, MA, USA) from 400 to 4000 cm−1 at a screening rate of 12 and resolution of 4 cm−1. Background correction was performed before each measurement.
Stability Studies
The colloidal stability of the optimized IMQ-NLCs was measured for 14 days under the refrigeration condition at 4 °C based on any changes in PS, PDI, and ZP of the IMQ-NLCs.
Preparation of IMQ-NLC-Loaded Topical Patches
IMQ-NLCs containing topical patch (IMQ-NLC-Patch) was prepared using hydroxypropyl methylcellulose (HPMC) K4M as a film-forming polymer by a solvent evaporation method. Briefly, 300 mg of HPMC K4M was mixed with 8 mL of water containing 200 µL of PG until fully dissolved. Seven milliliters of IMQ-NLC solution was then slowly incorporated into the polymer mixture and homogeneously mixed using a magnetic stirrer. The mixture was then cast on a Petri dish with a 70 mm diameter and left for drying for 24 hours at 37 °C. The patch was stored in the dark in an airtight container until further use.
Patch Thickness and Dry Weight
Six random points on the patch were measured using a digital micrometer (ID-S1012, Mitutoyo, Japan) for thickness. Six pieces (0.64 cm2) were randomly cut using a 9 mm hole punch, and their weight was measured using a digital balance.
Surface pH
Each patch (n = 6) was cut (0.64 cm2) and placed in 1 mL of MilliQ water and left for reaching equilibrium for 1 hour. The surface pH of the patches was measured using a digital pH meter (Orion Star A121, Thermo Scientific, USA).17
Folding Endurance
Each randomly cut patch (0.64 cm2) was continually folded at the same spot until broken. The total number of folds before breakage was recorded.
Drug Contents
The patch was randomly cut into small pieces (0.64 cm2) using a 9 mm hole punch and completely dissolved in the mobile phase (10 mL) for 24 hours. The mixture was then filtered using a syringe filter (0.45 µm) to remove debris and analyzed according to the HPLC method.
In vitro Release Studies of IMQ-NLC-Patch
In vitro release of IMQ-NLC-Patch was performed using Franz diffusion cells (0.64 cm2 effective area and 5.2 mL receptor compartment volume).17 The receptor compartment was filled with 0.1 M sodium acetate buffer (pH 3.7) which was continuously stirred and its temperature was maintained at 32 °C. A cellulose acetate membrane (0.45 µm pore size) was placed between the donor and receptor compartments. The IMQ-NLC-Patch was cut using a hole punch with a 9 mm diameter and added to the donor compartment. At a predetermined time, 200 µL of the sample was withdrawn from the receptor compartment and an equal aliquot of the fresh-release medium was added. The samples were quantified according to the HPLC method. A commercial cream was also used as a positive control.
Ex vivo Permeation and Deposition Studies of IMQ-NLC-Patch
Skin Preparation
Skin samples were prepared as previously described.37 Prior to tissue collection, “notification of use of scavenged tissues” was made to and received by an Animal Ethics Committee at the University of South Australia. Briefly, pig ear skin was collected from a local slaughterhouse and cleaned with MilliQ water. Hair was gently trimmed using an electric hair clipper. The skin on the dorsal side was carefully removed from the cartilage and dermatomed at 500 µm thickness using a 75 mm electric dermatome (Zimmer Inc, Ohio, USA). The dermatomed skin was then wrapped in aluminum foil and placed in a sealed plastic bag. The skin samples were stored at – 20 °C until further use. The dermatomed skin was then cut into smaller pieces using a hole punch with a 25 mm diameter for each ex vivo permeation and deposition study.
Skin Integrity Evaluation
Before each experiment, the skin barrier integrity of the skin samples was checked by taking measurements of transepithelial electrical resistance (TEER) of the dermatomed pig skin using a digital multimeter (MM400, Klein Tools, Australia). Briefly, the dermatomed skin was placed on the Franz diffusion cell facing the stratum corneum side upwards. The donor and receptor compartments were filled with 0.1M sodium acetate buffer (pH 3.7) and allowed for reaching an equilibration for 15 minutes. The skin barrier integrity was then measured by TEER, and only skin membrane with TEER greater than 10 kΏ was used for further studies.38
Ex vivo Permeation and Deposition
The protocol discussed in the in vitro release studies of IMQ-NLC-Patch was followed with a modification replacing the cellulose acetate membrane with the dermatomed pig ear skin. Upon the completion of the permeation studies, the excess formulation was gently wiped from the skin surface using a cotton tip and rinsed with 10 mL of MilliQ water. The skin was then allowed for air-drying at room temperature for 2 hours and fixed on a flat surface facing the stratum corneum upwards using double-sided tape. A tape-stripping method as previously described was used to remove the stratum corneum.39 D100 D-Squame sampling discs were placed over the skin and pressed firmly using a D500 D-Squame pressure instrument for 5 seconds and removed using forceps. The procedure was repeated 15 times. After tape-stripping, the epidermis layer was gently removed from the rest of the skin using forceps. Extraction of IMQ from the skin samples was performed overnight using an extraction medium consisting of 70% (v/v) methanol and 30% (v/v) acetate buffer (0.1 M, pH 3.7) as previously described.39 The sample extracts were then filtered using a syringe filter (0.45 µm pore size) and analyzed as per the HPLC method.
Statistical Analysis
All experimental results were presented as the mean ± standard deviation (SD) from three independent experiments unless otherwise described. Statistical differences in IMQ deposition and permeation between IMQ-NLC-Patch and commercial cream were evaluated using multiple unpaired t-tests. GraphPad Prism software (version 9.4.1, CA, USA) was used for statistical analysis with statistical significance at P < 0.05.
Results and Discussion
Selection of Excipients
Solid and Liquid Lipid Screening
The selection of lipids was made based on the solubility of IMQ in various solid lipids and liquid lipids as the solubility of drugs can directly affect the EE and DL of the NLCs.40 The solubility of IMQ was screened in various solid lipids of which glyceryl dibehenate, glyceryl distearate, and STA showed similar solubility around 1.4 mg/g (Figure 1A). In this study, STA with the lowest reported melting point (50–60 °C) was selected for formulation development as it requires a relatively lower manufacturing temperature to achieve low viscosity of the lipid phase that helps to lower the PS of NLCs.41
 |
Figure 1 Imiquimod solubility in various (A) solid lipids and (B) liquid lipids. |
Figure 1B shows the saturation IMQ solubility in various liquid lipids where the maximum solubility was obtained in OA (108 ± 0.31 mg/mL). OA is a naturally-occurring 18 carbon mono-unsaturated omega-9 fatty acid found in various vegetable and animal oils and fats. The lipophilic characteristic of OA with the possibility of hydrogen bonding formation with IMQ, while the weak basic nature of IMQ allowing its salt formation may all have contributed to the high solubility of IMQ in OA.8,42
Optimization of Binary Mixture of Solid Lipid and Liquid Lipid
Determining the ratio of solid and liquid lipids in the BM is important as it can affect the occlusive effect, EE, DL, and stability of NLCs.15 There are a few criteria used for the screening of BM composition including the crystallinity index (%), melting point of the BM > 40 °C, and absence of oil droplets in the BM using a filter paper technique.34,40,43 Firstly, STA and OA were mixed in various ratios and their thermal behaviour was determined using DSC. The DSC results demonstrated that as the ratio of OA increased up to 50%, the onset of the melting temperature and melting point decreased to 36.31 °C and 49.80 °C, respectively (Table 3). Figure 2 shows that the melting peaks also broadened and decreased in height which could be attributed to the dispersion of OA in STA leading to the formation of imperfect lattices and distortion of crystallinity of the BM. It allows the matrix of the NLCs to accommodate a greater amount of API, compared with SLNs alone.44 Similarly, with an increase in OA concentration in the BM up to 50%, the enthalpy and crystallinity index also gradually decreased to 111.79 J/g and 40.33%, respectively. While a reduced concentration of liquid lipid in BM leads to the formulation of an imperfect type of NLCs, a high percentage of oil can form separate oil nanoparticles, which may lead to phase separation during or after the formulation preparation.15 Additionally, a complementary filter paper method was used to visually assess any presence of oil droplets in the BM as an indication of phase separation.34 The results demonstrated that no oil droplets on the filter paper were visually observed when the OA concentration was used up to 30% in BM. Therefore, BM consisting of 70% STA and 30% OA was selected for the development of IMQ-NLCs.
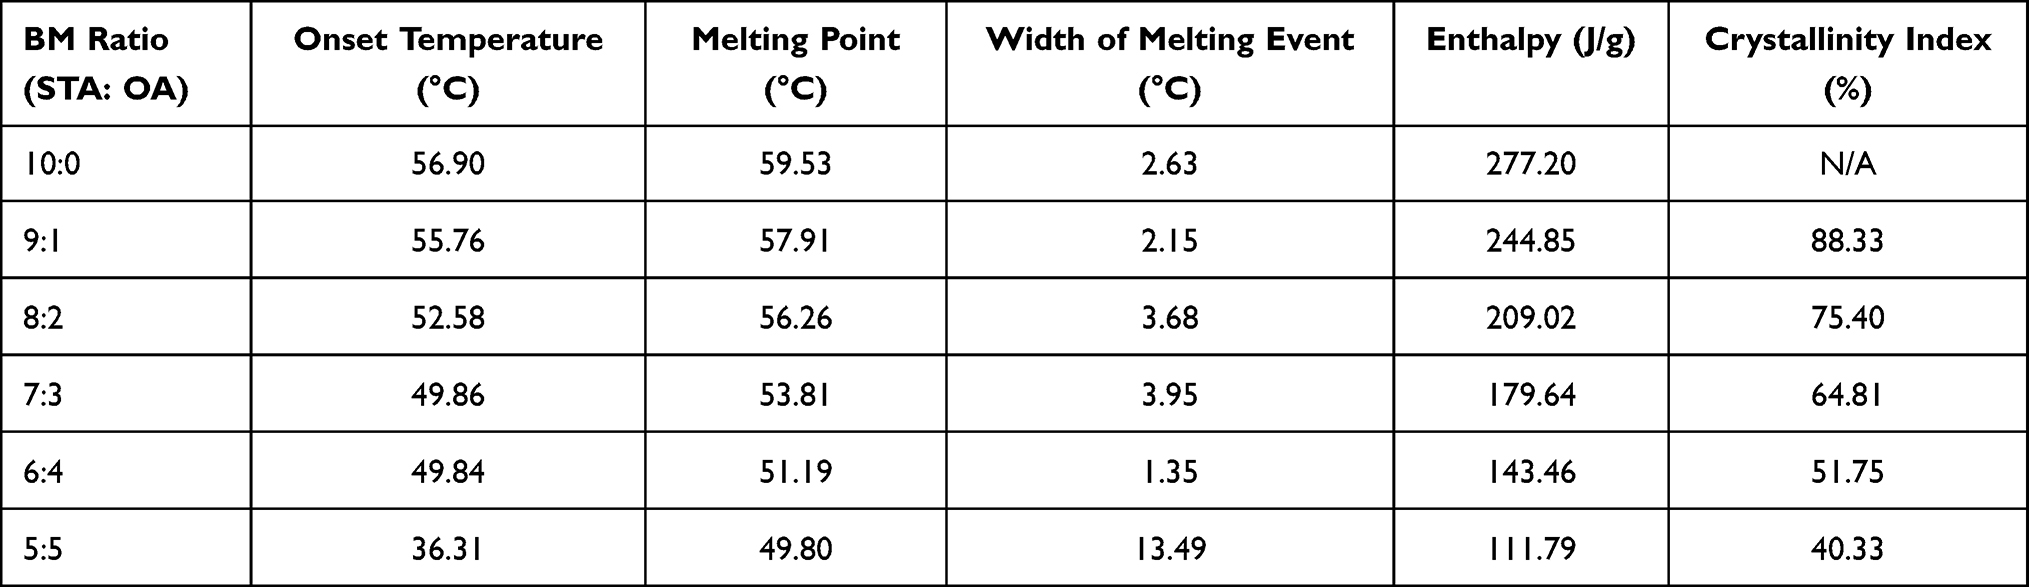 |
Table 3 Effects of Oleic Acid on the Onset Temperature, Melting Point, Enthalpy, and Crystallinity Index of Binary Mixtures |
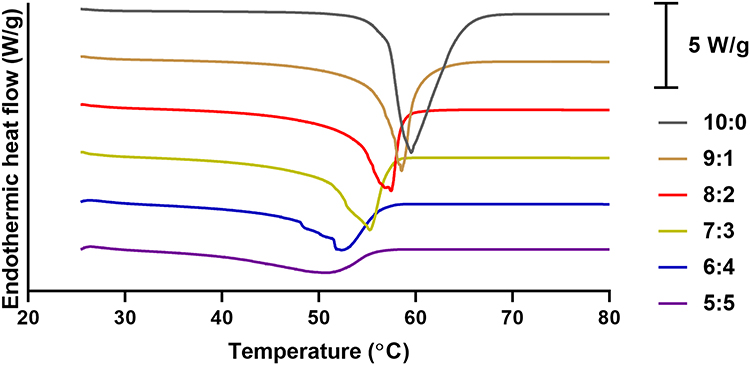 |
Figure 2 DSC thermograms of stearyl alcohol and binary mixtures containing different ratios of stearyl alcohol and oleic acid. |
Selection of Surfactants
Screening of surfactants was performed based on their emulsification capacities for the selected BM. The preliminary NLCs prepared from the BM and the mixture of polysorbate 80 and stearoyl polyoxyl-32 glycerides (50:50 v/v) showed the smallest PS of 49.05 nm and PDI of 0.195 among other surfactants and surfactant mixtures (Figure 3). The NLCs with the surfactant mixture also did not show any changes in the physical appearance while stored at room temperature for 7 days. Polysorbate 80 as a non-ionic surfactant has been used extensively in the preparation of topical formulations with minimal issues of irritation reported, while it can also help to increase membrane permeability to poorly soluble drugs by altering membrane fluidity.15,45 Similarly, Stearoyl polyoxyl-32 glycerides is a non-ionic poly ethylene glycol ester surfactant with an excellent emulsification capacity, which has also been used to prepare various NLCs.46
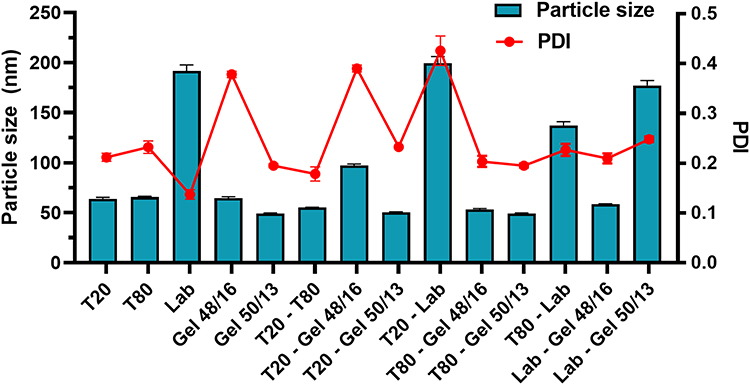 |
Figure 3 Particle size and polydispersity index of the preliminary nanostructured lipid carriers prepared from various surfactants and surfactant mixtures. T20; Tween 20, T80; Tween 80, Lab; Labrasol, Gel 48/16; Gelucire 48/16, and Gel 50/13; Gelucire 50/13. |
Formulation Development and Optimization Using a Hybrid Design Approach
2k Factorial Design for Screening of Relevant Experimental Factors
PS is one of the most important CQAs of nanoparticles in determining the release profile of the drug and its permeation through the skin.47,48 On the other hand, PDI measures the droplet size distribution in which the higher the PDI value the more polydisperse nature of nanoparticles would be. PDI values range from 0 to 1 indicative of a completely mono-dispersed and poly-dispersed system, respectively. Table 4 shows a total of 16 experiments utilizing six independent variables at two levels as well as the results for each dependent variable that were subject to ANOVA.
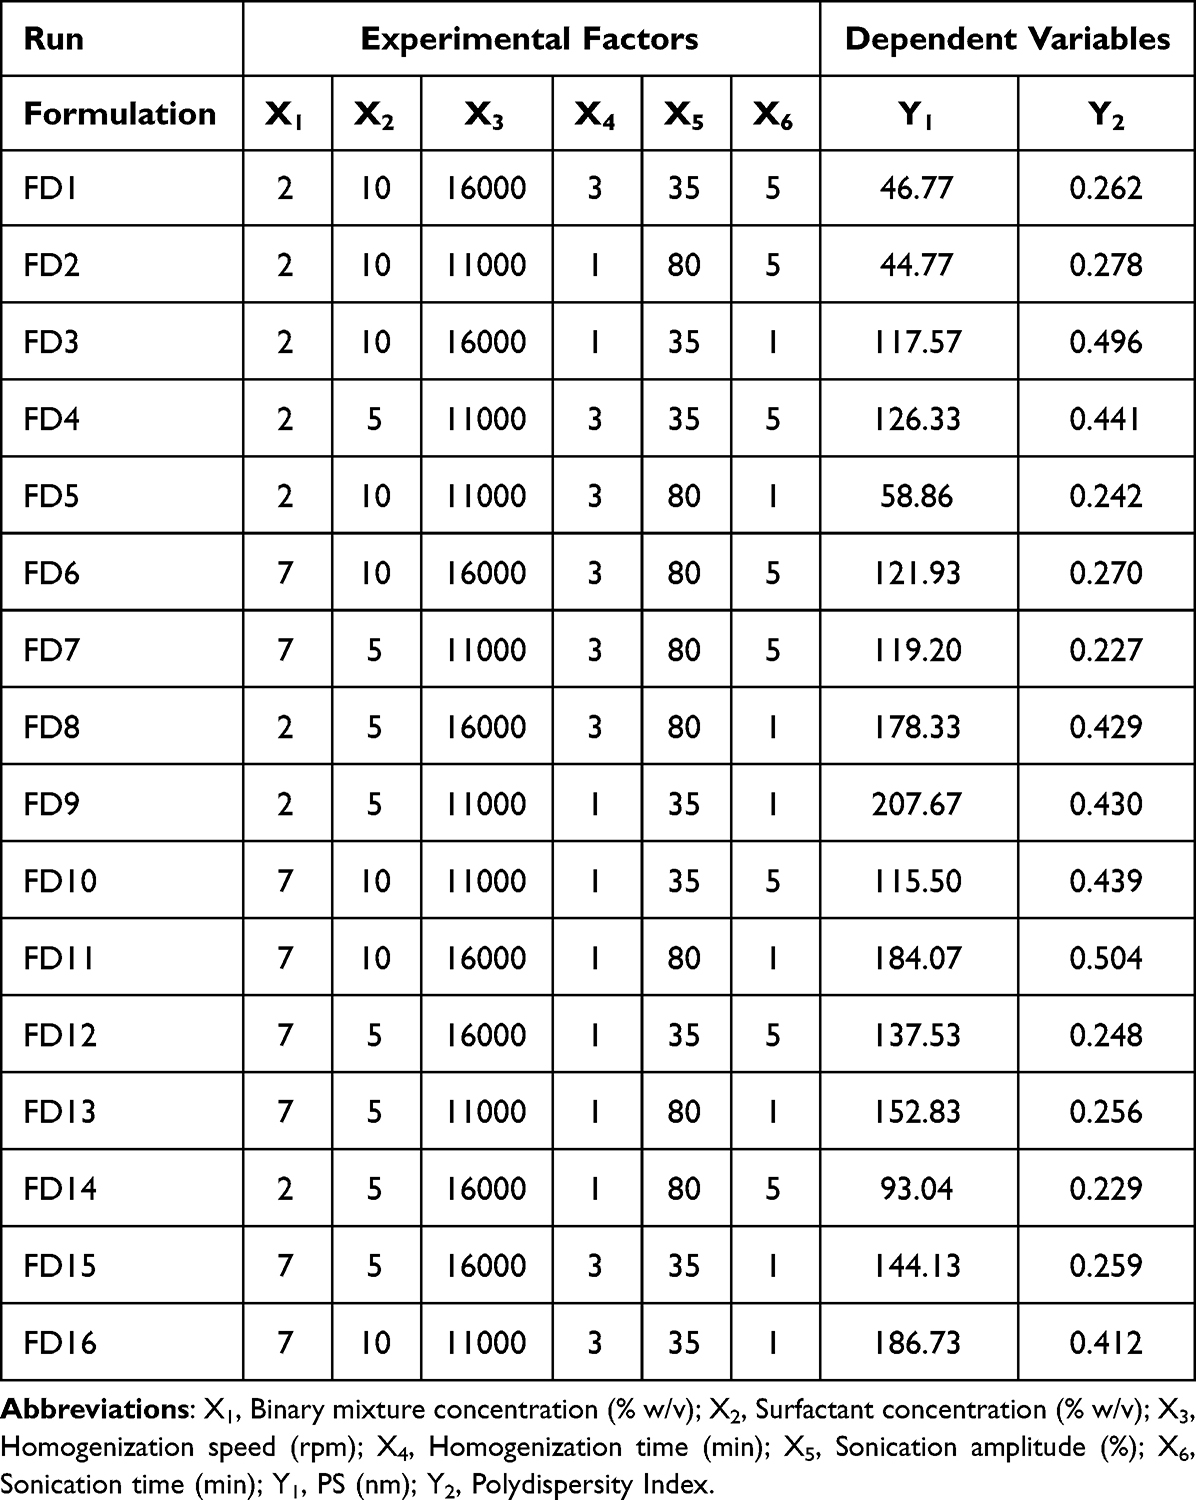 |
Table 4 Proposed Experiments by 2k Factorial Design and Their Responses for 16 Formulations of Nanostructured Lipid Carriers |
The ANOVA results demonstrated the statistical significance (p = 0.0008) of the factorial model for PS with the following mathematical equation at 95% confidence intervals.

The PS (Y1) of fabricated NLCs ranged from 44.77 nm to 207.67 nm mostly affected by the BM concentration (p = 0.0032), total surfactant concentration (p = 0.0036) and sonication time (p = 0.0003). The interaction between the BM concentration and the total surfactant concentration was also found to affect the PS of NLCs (p = 0.0006). Additionally, the experimental factors in determining the PS are shown in the Pareto chart in the order of their contributions (Figure 4A).
 |
Figure 4 Pareto charts showing the experimental parameters with significant effects on (A) particle size and (B) polydispersity index. Factor A, BM concentration (% w/v); B, Surfactant concentration (% w/v); D, Homogenization time (min); E, Sonication amplitude (%) and F, Sonication time (min). |
Similarly, the mathematical model for PDI was also significant with a p value of 0.0036 at 95% confidence intervals. The following mathematical equation is derived from the factorial model.

The PDI values were between 0.227 and 0.504 where sonication time (p = 0.0230), sonication amplitude (p = 0.0230), and the interaction between the BM concentration and the total surfactant concentration (p = 0.0062) were the statistically significant factors in terms of affecting the PDI of NLCs. Similarly, Figure 4B shows a Pareto chart of different factors with their impacts on PDI.
Central Composite Design for Formulation Optimization
From the 2k factorial design results, the three most significant experimental parameters were determined to be BM concentration (X1), surfactant concentration (X2), and sonication time (X3). These factors were further studied for their effects on PS (Y1), PDI (Y2) and zeta-potential (Y3) and optimized using CCD. One of the main advantages of CCD is that the responses can be characterized across the whole design space without confounding terms up to the quadratic level. It also allows the experimental factors to be screened beyond their factorial limits to improve the understanding of their effects on dependent variables.35 In this study, a total of 20 experiments were generated and their responses are summarized in Table 5. The results showed that the variations in PS, PDI, and ZP were all best explained by a quadratic model, and the quadratic models for PS, PDI, and ZP were all statistically significant (p < 0.0001). Following ANOVA, the statistical parameters including p value, R2, adjusted R2, predicted R2, adequate precision and lack of fit are listed in Table 6. It was also demonstrated that the R2 values of all three models were greater than 0.9 being indicative of a good correlation between the observed and predicted values. Moreover, the difference between the adjusted and predicted R2 values was less than 0.2, while the insignificant lack of fit with p > 0.05 and an adequate precision value greater than 4 were obtained for all three dependent variables confirming the suitability of the statistical models.49
 |
Table 5 Proposed Experiments by Central Composite Design and Their Responses for 20 Formulations of Imiquimod-Loaded Nanostructured Lipid Carriers |
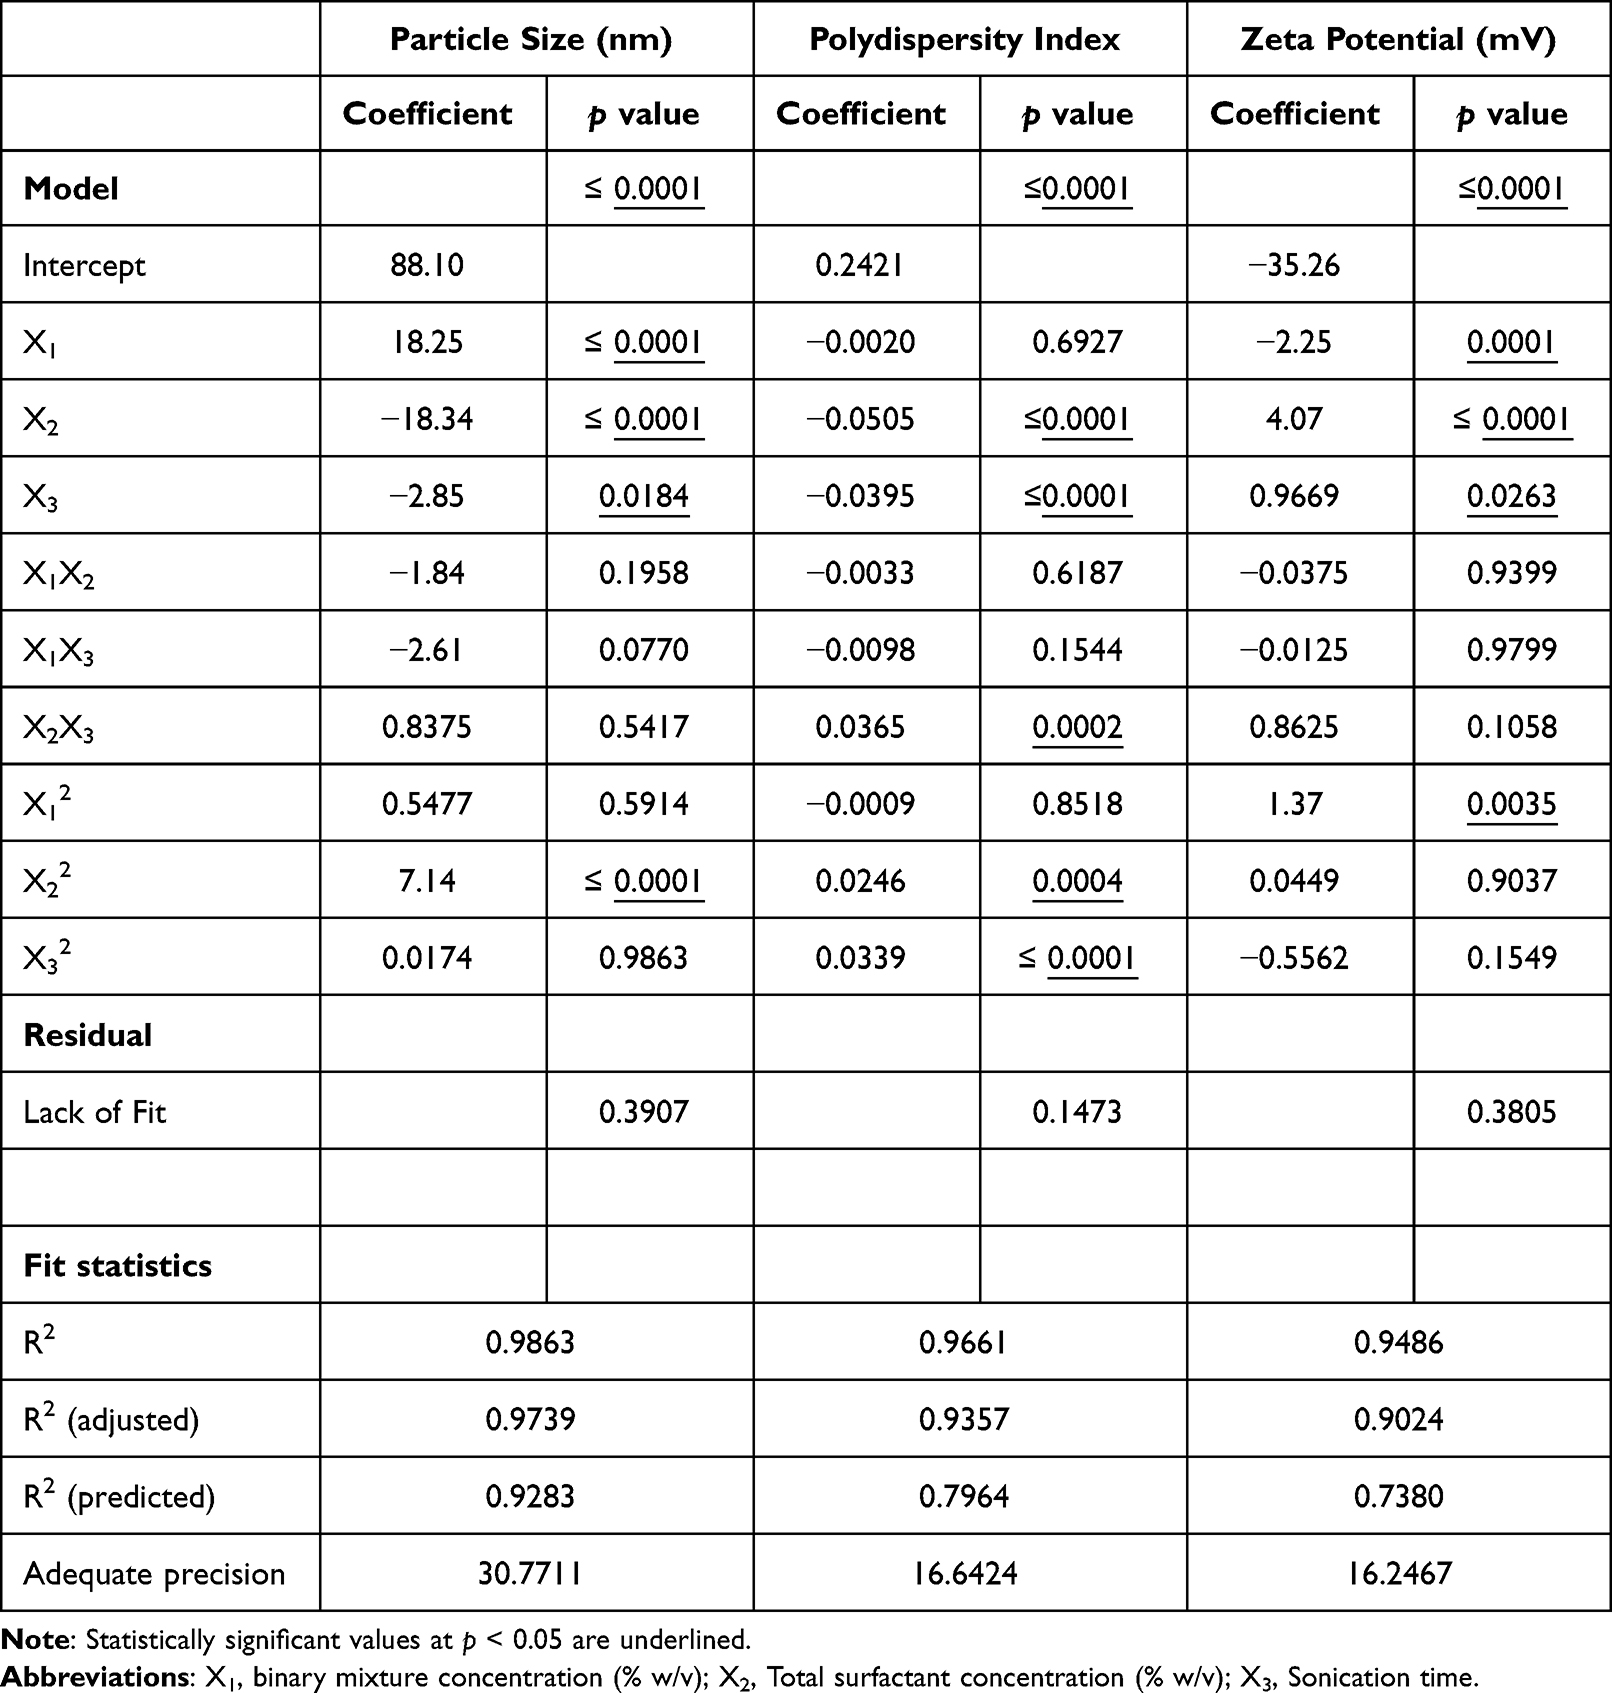 |
Table 6 A Summary of ANOVA Results for the Quadratic Models for the Dependent Variables |
Effect of Experimental Factors on Particle Size
The PS (Y1) of IMQ-NLCs ranged from 59.5 nm to 144.8 nm which was significantly affected by the BM concentration (X1), total surfactant concentration (X2), sonication time (X3), and the square effect of total surfactant concentration (X22) (Table 6). The coefficient of each variable also allowed a direct comparison of their effect on the PS reflected in the sign and magnitude of their coefficients. The negative coefficient of – 18.34 and – 2.85 for the total surfactant concentration and sonication time suggested an inverse relationship with the PS of IMQ-NLCs, while the higher coefficient value of the total surfactant concentration indicated that it had a more significant effect than the sonication time on determining the PS. It is also apparent in the 3D response surface plot that increasing sonication time and the total surfactant concentration significantly reduced the PS (Figure 5A). Increasing the surfactant concentration helps to form a dense network around the binary lipid mixture and reduces interfacial tension between lipid particles and the water phase, which helps to produce small particles and prevents particle aggregation.50 Moreover, a longer ultrasonication time allows adequate exposure of NLCs to a high-energy ultrasonic wave that creates shear forces by cavitation resulting in the breakage of particles in smaller monodisperse globules.21 On the other hand, the PS significantly increased with increasing the BM concentration in the formulation as indicated by a coefficient of +18.25. This may be attributed to several reasons including relatively insufficient surfactant contents to cover the lipid particle surface, increased chances of collision and aggregation between lipid particles, and a higher sample viscosity leading to a reduction in sonification efficiency.47
 |
Figure 5 3D response surface plots representing the effects of binary mixture concentration, surfactant concentration and sonication time on (A) particle size, (B) polydispersity index, and (C) zeta potential. |
Effect of Experimental Factors on Polydispersity Index of IMQ-NLCs
The IMQ-NLC formulations were determined to have various PDI (Y2) values ranging from 0.222 to 0.431 (Table 5). The ANOVA results suggested that PDI was significantly affected by the surfactant concentration (X2), sonication time (X3), the interaction between the surfactant concentration and sonication time (X2X3), the square effect of surfactant concentration (X22) and sonication time (X32) (Table 6). The negative coefficients of surfactant concentration and sonication time also indicate that an increase in these factors resulted in the reduction of PDI of the IMQ-NLCs as also shown in Figure 5B. It may be attributed to the presence of sufficient amounts of surfactant in the system allowing the stabilization of smaller NLCs by producing steric hindrance, which helps to prevent the coalescence and aggregation of NLCs.51 Moreover, an increased sonication time can help break down droplets uniformly leading to lower PDI. Such an inverse relationship between surfactant concentration, sonication time, and PDI has also been reported previously.34,52 By contrast, the total BM concentration did not show a statistically significant effect on the PDI of the IMQ-NLC formulations.
Effect of Experimental Factors on Zeta Potential of IMQ-NLCs
ZP (Y3) is the overall surface charge of nanoparticles, which is correlated to their colloidal stability in the dispersion. Particles with high ZP values (either positive or negative) are less likely to aggregate due to electric repulsion between them. Generally, nanoparticles with a ZP value other than −30 mV to 30 mV suggest sufficient repulsive force to assure physical stability in the dispersion.53 All IMQ-NLC formulations were negatively charged from – 41.3 to – 26.0 mV, indicating that the formulations may have good colloidal stability. It has previously been suggested that the preferential adsorption of OH− at the interface of oil and water results in the negative ZP of the formulations.54 In addition, the presence of negatively charged OA in the BM may also have led to a negative electrical charge of the IMQ-NLCs. According to the ANOVA results (Table 6), all three factors had a statistically significant effect on the ZP of IMQ-NLCs. While the BM concentration (X1) had a negative effect on the ZP, the total surfactant concentration (X2) and sonication time (X3) showed a positive effect (Figure 5C). Increasing the concentration of negatively charged BM leads to decreasing the ZP while an increase in polysorbate 80 and stearoyl polyoxyl-32 glyceride concentrations as a non-ionic surfactant can cause displacement of OH− or endogenous negatively charged ingredients in the formulation from the particle surface resulting in the net charge reduction.50 Besides, the effect of sonication time on ZP was not as significant as the other two factors as indicated by its coefficient of 0.9669.
Optimization and Validation of the IMQ-NLC Formulation
The IMQ-NLCs were optimized using the criteria aiming to achieve the smallest PS (lower and upper limits between 59.5 and 100 nm) and PDI (lower and upper limits between 0.222 and 0.3), while the maximum ZP was desired (lower and upper limit between – 41.3 and – 26.0 mV). The formulation comprising 4.379% of the BM and 8.890% of the total surfactant mixture with a sonication time of 5.099 minutes was suggested as the sole optimal solution with desirability of 0.540 (Table 7). Other experimental parameters used for the preparation of the optimized formulation as determined by the 2k factorial screening design include the homogenization speed, homogenization time and sonication amplitude of 11,000 rpm, 1 minute and 35%, respectively. The optimized IMQ-NLCs were translucent with a slightly blue tinge and free from any solid particles (Figure 6). The PS, PDI, and ZP of the optimized formulation were 75.6 ± 1.3 nm, 0.235 ± 0.005, and – 30.9 ± 1.4 mV, respectively. The PS, PDI, and ZP of the optimized IMQ-NLCs are also graphically shown in Figure 7A and B. The model was then validated by comparing the experimental values with the predicted values of each variable at the 95% confidence interval. The results demonstrated that the experimental values for the responses fit within their predicted values with insignificant percentage error (%) of 2.49%, 5.86%, and 4.04% for the PS, PDI, and ZP, respectively (Table 7). In addition, the optimized formulation had EE and DL of 84.5 ± 1.8% and 2.96 ± 0.06%, respectively. This translates to the final IMQ concentration of 0.13% (w/v) in the optimized IMQ-NLCs.
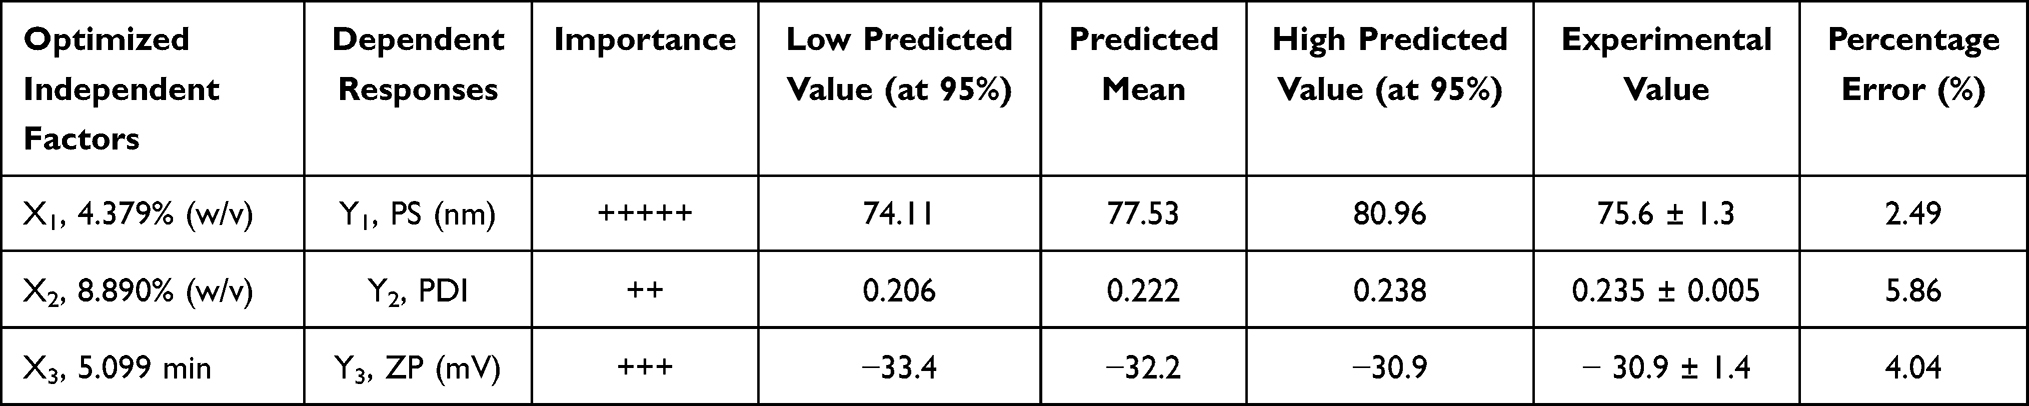 |
Table 7 Predicted versus the Actual Value of Responses for Optimized IMQ-NLCs |
 |
Figure 6 The appearance of the optimized formulation of IMQ-NLCs. |
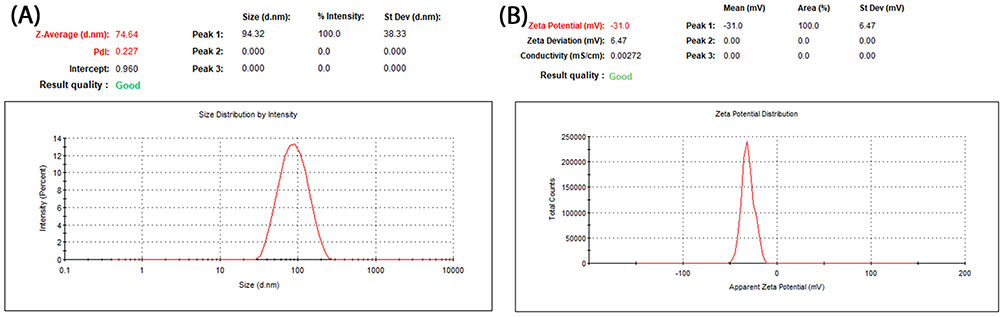 |
Figure 7 (A) particle size distribution, polydispersity index, and (B) zeta potential of the optimized IMQ-NLCs. |
Characterization of IMQ-NLCs
Fourier Transform Infrared Spectroscopy
The FTIR analysis was performed on pure IMQ, drug-free NLCs, IMQ-NLCs, and a physical mixture to evaluate potential chemical interactions between IMQ and the NLCs. Firstly, the FTIR spectra of pure IMQ (Figure 8A) showed its characteristic peaks at (1) 760 cm−1, (2) 1450–1370 cm−1, (3) 1465 cm−1, (4) 1640–1550 cm−1, (5) 3000–2850 cm−1 and (6) 3400–3100 cm−1 corresponding to C–H out-of-plane bending vibrations of the aromatic ring, –CH3 bending, –CH2– bending, N–H bending of amines, –CH3 stretches and N–H stretches of amines, respectively.55 The spectra of IMQ-NLCs were highly similar to those exhibited by drug-free NLCs without the presence of new peaks. All characteristic peaks of IMQ were not visible in the spectra of IMQ-NLCs, which may indicate that IMQ may have been encapsulated in the NLCs. On the other hand, the presence of the peaks in the physical mixture spectra with low intensity due to its low concentration in the formulation indicated that IMQ did not reveal significant chemical interactions with the NLCs.56
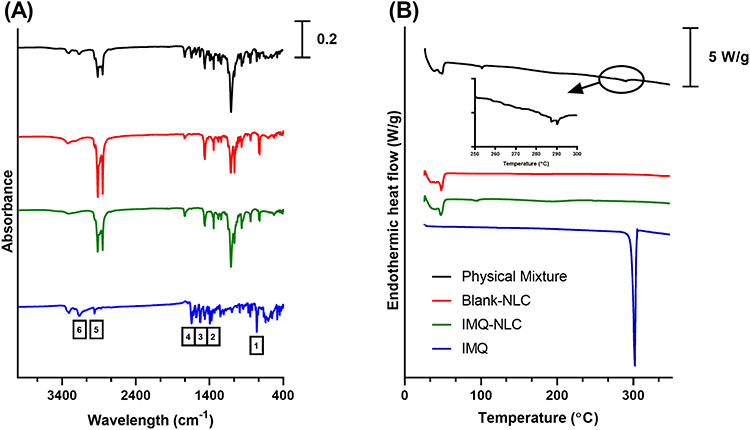 |
Figure 8 (A) FTIR spectra and (B) DSC thermograms of the physical mixture, drug-free NLC, IMQ-NLC, and pure IMQ. |
Differential Scanning Calorimetry
The thermal analysis using a DSC technique was also performed on pure IMQ, drug-free NLCs, IMQ-NLCs, and physical mixture to determine the thermodynamic characteristics and changes in the physical states of IMQ during the analysis. A sharp endothermic peak (Figure 8B) was observed at 299.6 °C in the DSC thermogram of IMQ corresponding to its melting point as previously reported.55,57 The thermograms of drug-free NLCs and IMQ-NLCs also exhibited an endothermic peak representing a melting point of the NLC matrix at 47.8 °C and 47.5 °C, respectively. However, the endothermic peak of IMQ did not present in the thermogram of IMQ-NLCs suggesting that IMQ was encapsulated into the NLC matrix and was presented as an amorphous state.56 On the other hand, the thermogram of the physical mixture revealed a small endothermic peak at a slightly lower temperature (289.5 °C), indicating that there may have been potential interactions between NLCs and IMQ as the temperature increased. Similarly, a slight shift in its melting peak has also previously been reported in other IMQ nano-formulations.57,58
Stability Studies
The colloidal stability of the IMQ-NLCs kept at 4 °C was determined based on changes in the PS, PDI, and ZP. The optimized IMQ-NLC formulation showed good colloidal stability for 14 days in the refrigerated condition without statistically significant changes in these parameters (Table 8).
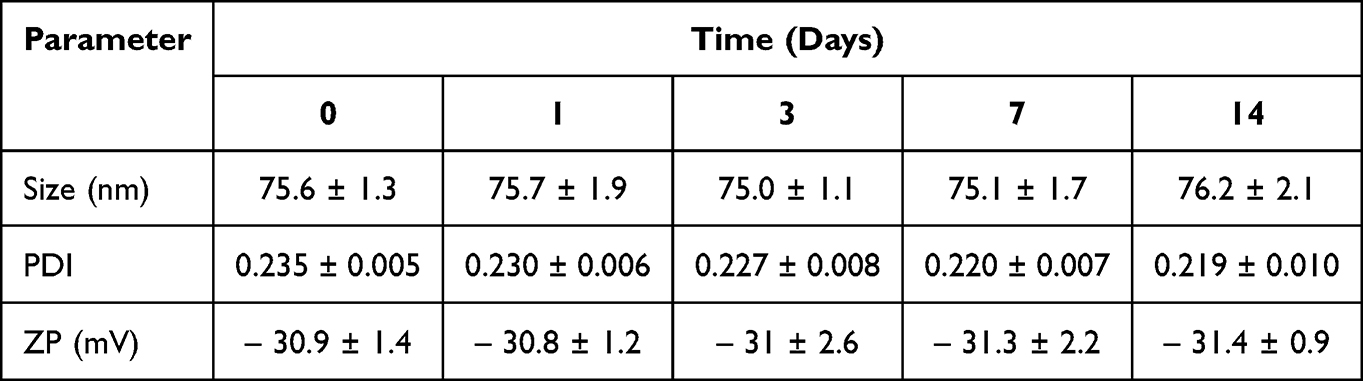 |
Table 8 Stability Data of the Optimized IMQ-NLCs at 4 °C |
Preparation of IMQ-NLC-Patch
Matrix-type patches containing the optimized IMQ-NLCs were prepared as an alternative dosage form suitable for topical application using HPMC K4M as a polymer matrix. The prepared IMQ-NLC-Patches showed a good uniform physical appearance. The patches also had a good uniformity in thickness (382 ± 13 µm), dry weight (24.9 ± 0.6 mg/cm2), and drug contents (231.1 ± 13.9 µg/cm2) (Table 9). While the patches were flexible with a folding endurance of more than 100 folds before breakage, the surface pH of the patches (5.73 ± 0.28) was also within the normal skin pH range, suggesting that the patches may not cause significant skin irritation.31
 |
Table 9 Average Thickness, Dry Weight, Folding Endurance, Surface pH, and Drug Content of the IMQ-NLC-Patches (n = 6) |
In vitro Release Studies of IMQ-NLC-Patch
In vitro IMQ release from IMQ-NLC-Patch was investigated using Franz diffusion cells in the release medium (0.1M acetate buffer, pH 3.7). Although the acidic acetate buffer (pH 3.7) does not simulate the physiological conditions of the skin, it has previously been used in several studies to increase the aqueous solubility of IMQ and maintain sink conditions during the studies.3,58 The IMQ release from the patch consisting of HPMC K4M exhibited a burst release reaching its cumulative release of 64% for the first 2 hours, followed by a slow release for up to 12 hours (Figure 9). On the other hand, 50% of IMQ was released from the commercial cream within the first 4 hours, followed by a slow release for 24 hours. The presence of several excipients including fatty alcohols, oil and xanthan gum in the commercial formulation may have contributed to slowing the in vitro release of IMQ.59,60
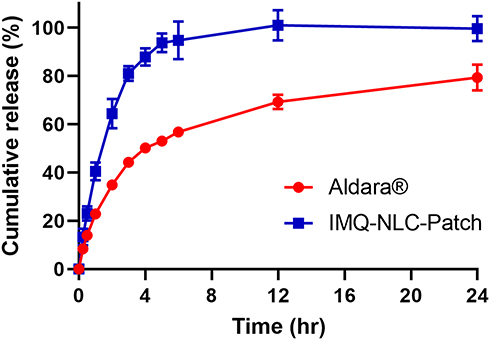 |
Figure 9 In vitro release profile of IMQ-NLC-Patch. |
The in vitro release data of IMQ-NLC-Patch was also fitted into several mathematical models to better understand the mechanism underlying its release. Mathematical models help optimize the design and development of innovative dosage forms and are used to illustrate the mechanisms of drug release from drug delivery platforms which are central to the improvement of the safety of formulations.61 In this study, DDsolver®, a Microsoft® Excel® add-in program was used to perform the model fitting and compare IMQ release profiles. The result showed that the IMQ release from the IMQ-NLC-Patch was best fitted with the Hopfenberg model (adjusted R2 = 0.9921) (Figure 10). The Hopfenberg model is given by:

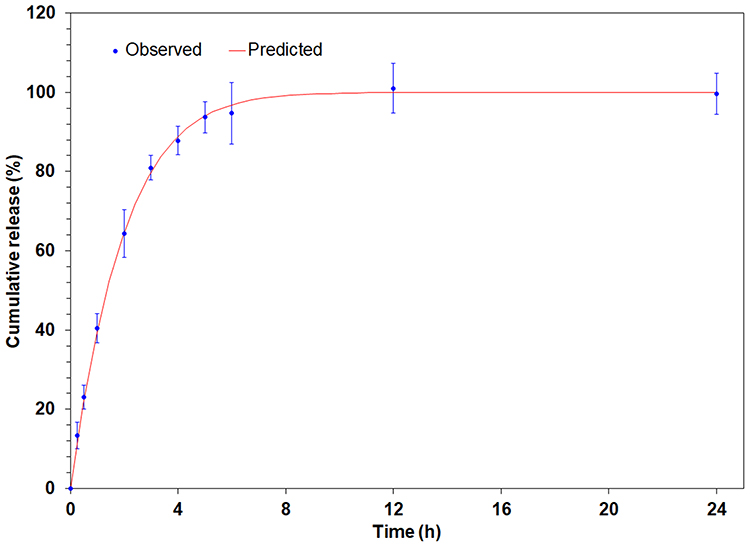 |
Figure 10 In vitro release model of IMQ-NLC-Patch following Hopfenberg model. |
where kHB is the Hopfenberg model constant which corresponds to k0/(C0 × α0) where k0 is erosion rate constant, C0 is initial drug concentration in the matrix, α0 is initial radius for a slab/cylinder/sphere structure, while n corresponds to 1, 2, and 3 for the slab, cylinder, and sphere structure, respectively.61
The Hopfenberg model is an empirical mathematical model driven by erosion that assumes the drug release rate from the formulation is proportional to the surface area of the system that is changing with time.62 As shown in Figure 10, such a release pattern could be regarded as potentially advantageous for topical application as it can help to initiate a high drug concentration gradient to increase the diffusion force for drug permeation through the stratum corneum.17,63 It has also been reported in the literature that the release mechanism of other formulations including NLCs containing curcumin64 and estradiol-loaded polymeric films65 was also best described using the Hopfenberg model.
Ex vivo Drug Permeation and Deposition Studies of IMQ-NLC-Patch
IMQ permeation and deposition from the IMQ-NLC-Patch were evaluated for deeper skin penetration, and its performance was compared to the commercial cream. Ex vivo permeation and deposition studies of IMQ-NLC-Patches were conducted for 24 hours using dermatomed pig ear skin (500 µm) mounted on Franz diffusion cells. When compared to full-thickness skin, dermatomed skin can offer several advantages where it can avoid the significant portion of the dermis (1–2 mm) layer present in the full-thickness skin from acting as an artificial barrier to some lipophilic drugs. It also provides standardization of the skin thickness for each experiment to minimize variations between each replicate.66 In addition, a tape-stripping technique was used to separate the epidermis from the dermis layer by which towards the end of the 15th tape-stripping a slight lifting of the epidermis from the rest of the skin was observed. From that point, the epidermis layer was gently pulled up and separated using forceps, which did not require additional techniques such as a heat separation method in our study.
Figure 11A represents the amount of IMQ retrieved from the skin surface, stratum corneum, epidermis, dermis, and receptor compartment. The results demonstrated that a significantly less amount of IMQ from the IMQ-NLC-Patch was found on the skin surface (5.7 ± 2.8 µg/cm2 versus 22.4 ± 1.6 µg/cm2) and stratum corneum (6.1 ± 2.6 µg/cm2 versus 52.8 ± 27.5 µg/cm2) in comparison to the commercial cream. While the amount of IMQ found in the epidermis was similar between them, the IMQ-NLC-Patch achieved statistically significant improvement (p < 0.05) in drug permeation into deeper skin layers, where the IMQ deposition at the dermis layer and receptor chamber was 3.3 ± 0.9 µg/cm2 and 12.3 ± 2.2 µg/cm2, respectively. By contrast, the IMQ deposition from commercial cream was only 1.0 ± 0.8 µg/cm2 and 1.5 ± 0.5 µg/cm2. Several studies suggested that the nanosize of NLCs plays an important role in allowing the nanocarriers to closely interact with the outer membrane of the skin, which leads to increasing the membrane fluidity, in turn, driving the drug into the deeper skin layers.18 Moreover, the occlusivity of NLCs may also contribute to enhancing drug permeation by interfering with the corneocyte arrangement and inter-corneocyte gaps.67 From a clinical perspective, targeting the IMQ deposition in the dermis layer is important as basal cell carcinoma generally originates from the basal layer of the epidermis, which then invades into the deeper dermis layer.10 By contrast, such a high degree of superficial IMQ accumulation from the commercial cream may be due to its formulation having a high solubilizing capacity for IMQ where there may not be enough thermodynamic forces to create rapid partitioning of IMQ into the stratum corneum.4
 |
Figure 11 (A) Ex vivo IMQ skin deposition and permeation after 24 hours from the IMQ-NLC-Patches using dermatomed porcine ear skin. (B) IMQ delivery efficiency of IMQ-NLC-Patch as a percentage of the applied dose. p value is indicated when there is a significant difference. |
On the other hand, the IMQ-NLC-Patch showed significantly higher IMQ delivery efficiency than the commercial cream, as calculated as a percentage of the applied dose. In this study, a significantly less IMQ dose (148 µg of IMQ over 0.64 cm2) from the IMQ-NLC-Patch was used in comparison to 10 mg (500 µg of IMQ over 0.64 cm2) of the commercial cream applied according to the FDA guidelines.68 Figure 11B shows that the delivery efficiency of the IMQ-NLC-Patch to the dermis layer and receptor chamber was 1.43 ± 0.39% and 5.27 ± 0.96%, which were 7.6-fold and 24.3-fold higher than that of the commercial cream, respectively. Furthermore, considering topical patches also have a great advantage over other semi-solid formulations in achieving significantly extended dosing intervals generally up to 3–7 days, future studies should evaluate their performance beyond 24 hours, ideally both in vitro and in vivo settings.
Sustainable Pharmaceutical Approaches
Unlike synthetic chemistry and analysis, attempts to evaluate the environmental impacts on the formulation process are lacking. Although the complete elimination of non-green procedures without compromising the quality of the final product is difficult, attempts to apply greener practices would definitely contribute to addressing some of the associated concerns. In this work, we have been mindful of green practices and considered adopting greener approaches where possible in our experiments as highlighted below.
Firstly, our analytical method for the quantification of IMQ was developed in such a way that it complied with the principle of GAC where possible.31 Briefly, according to the ESA tool, the method was considered an excellent green analytical method scoring 87%. The method was further assessed using the novel AGREE tool which considered other aspects of the procedure such as sample preparation, positioning of the analytical device, and sample throughput. Commendable aspects of the procedure included the use of 60% non-hazardous aqueous buffer solution in the mobile phase, extraction that utilized the same mobile phase without the need for additional hazardous solvents or high energy consuming steps, high throughput, intermediate generation of the solvent containing waste and no derivatization. The analytical method was also found to comply with the guidelines of sustainable chemistry; from environmental, economic, and societal perspectives.
Secondly, the selection of STA as the lipid of choice in this formulation as opposed to glyceryl dibehenate or glyceryl distearate was favored, despite their similar solubilizing capacity towards IMQ. This was attributed to the fact that STA has a lower melting point and thus requires a lower temperature during the formulation process, reducing energy consumption and complying with the concepts of sustainable practices.
Finally, applying a hybrid DoE approach to our formulation development helped to reduce the experimental runs by 57%, compared to the exclusive use of a single design, thus significantly decreasing waste and chemical consumption. Briefly, the 2k factorial design was initially performed for the screening of the most influential experimental factors on the CQAs of NLCs including PS, and PDI prior to the optimization of multiple factors using a CCD. This screening design has significantly reduced the number of total experimental runs to 36 – made up of 16 runs from the 2k factorial design and 20 runs from the CCD – in comparison to a total of 84 proposed runs if CCD was exclusively used for the six independent factors. Adopting the hybrid DoE model in our work not only saved time and resources but also potentially reduced waste generation due to possibly unnecessary attempts. Despite our best effort to discuss the potential environmental impacts of NLC formulation processes, future studies should aim to develop a quantitative assessment tool that encompasses wider aspects of the formulation process towards a greener and more sustainable practice of NLC development.
Conclusion
IMQ-NLCs were formulated and optimized using a 2k factorial design followed by CCD. The CQAs of NLCs were affected by the BM concentration, surfactant concentration, and sonication time. The optimized IMQ-NLCs with small PS, narrow PDI, and high ZP were developed and incorporated into a matrix-type patch as a dosage form suitable for topical application. The IMQ-NLC-Patch demonstrated significantly improved drug deposition into the deeper skin layers compared to the commercial cream, representing its great potential to treat other skin cancer types with a deeper invasion while providing patients with improved compliance.
Acknowledgments
We would like to thank the Australian government for awarding Sangseo Kim, Sadikalmahdi Abdella, Fatima Abid and Souha H. Youssef with the Research Training Program scholarships.
Disclosure
The authors report no conflicts of interest in this work.
References
1. Hanna E, Abadi R, Abbas O. Imiquimod in dermatology: an overview. Int J Dermatol. 2016;55(8):831–844. doi:10.1111/ijd.13235
2. Ghezzi M, Pescina S, Delledonne A, et al. Improvement of imiquimod solubilization and skin retention via TPGS micelles: exploiting the co-solubilizing effect of oleic acid. Pharmaceutics. 2021;13(9):1476. doi:10.3390/pharmaceutics13091476
3. Sabri AH, Cater Z, Gurnani P, et al. Intradermal delivery of imiquimod using polymeric microneedles for basal cell carcinoma. Int J Pharm. 2020;589:119808. doi:10.1016/j.ijpharm.2020.119808
4. Lapteva M, Mignot M, Mondon K, Moller M, Gurny R, Kalia YN. Self-assembled mPEG-hexPLA polymeric nanocarriers for the targeted cutaneous delivery of imiquimod. Eur J Pharm Biopharm. 2019;142:553–562. doi:10.1016/j.ejpb.2019.01.008
5. Jamshaid H, Din F, Malik M, et al. A cutback in Imiquimod cutaneous toxicity; comparative cutaneous toxicity analysis of Imiquimod nanotransethosomal gel with 5% marketed cream on the BALB/c mice. Sci Rep. 2022;12(1):14244. doi:10.1038/s41598-022-18671-1
6. Telo I, Favero ED, Cantu L, et al. Gel-like TPGS-based microemulsions for imiquimod dermal delivery: role of mesostructure on the uptake and distribution into the skin. Mol Pharm. 2017;14(10):3281–3289. doi:10.1021/acs.molpharmaceut.7b00348
7. Hua S. Lipid-based nano-delivery systems for skin delivery of drugs and bioactives. Front Pharmacol. 2015;6:219. doi:10.3389/fphar.2015.00219
8. Algahtani MS, Ahmad MZ, Nourein IH, Ahmad J. Co-delivery of imiquimod and curcumin by nanoemugel for improved topical delivery and reduced psoriasis-like skin lesions. Biomolecules. 2020;10(7):968. doi:10.3390/biom10070968
9. Venturini CG, Bruinsmann FA, Contri RV, et al. Co-encapsulation of imiquimod and copaiba oil in novel nanostructured systems: promising formulations against skin carcinoma. Eur J Pharm Sci. 2015;79:36–43. doi:10.1016/j.ejps.2015.08.016
10. Zhou HF, Ma Q-H, Xia Q, et al. Preparation and characteristics of imiquimod-loaded solid lipid nanoparticles. Chin Pharm J. 2006;41:1084–1088,1120.
11. Elsewedy HS, Shehata TM, Soliman WE. Shea butter potentiates the anti-bacterial activity of fusidic acid incorporated into solid lipid nanoparticle. Polymers. 2022;14(12):2436. doi:10.3390/polym14122436
12. Stefanov SR, Andonova VY. Lipid nanoparticulate drug delivery systems: recent advances in the treatment of skin disorders. Pharmaceuticals. 2021;14(11):1083. doi:10.3390/ph14111083
13. Iqubal MK, Iqubal A, Imtiyaz K, et al. Combinatorial lipid-nanosystem for dermal delivery of 5-fluorouracil and resveratrol against skin cancer: delineation of improved dermatokinetics and epidermal drug deposition enhancement analysis. Eur J Pharm Biopharm. 2021;163:223–239. doi:10.1016/j.ejpb.2021.04.007
14. Haider M, Abdin SM, Kamal L, Orive G. Nanostructured lipid carriers for delivery of chemotherapeutics: a review. Pharmaceutics. 2020;12(3):288. doi:10.3390/pharmaceutics12030288
15. Kim S, Fouladian P, Afinjuomo F, et al. Effect of plasticizers on drug-in-adhesive patches containing 5-fluorouracil. Int J Pharm. 2022;611:121316. doi:10.1016/j.ijpharm.2021.121316
16. Arunprasert K, Pornpitchanarong C, Piemvuthi C, et al. Nanostructured lipid carrier-embedded polyacrylic acid transdermal patches for improved transdermal delivery of capsaicin. Eur J Pharma Sci. 2022;173:106169. doi:10.1016/j.ejps.2022.106169
17. Kumar R, Mittal A, Kulkarni MP. Quality by design in pharmaceutical development. In: Saharan VA, editor. Computer Aided Pharmaceutics and Drug Delivery: An Application Guide for Students and Researchers of Pharmaceutical Sciences. Singapore: Springer Nature; 2022:99–127. doi:10.1007/978-981-16-5180-9_4
18. Subramaniam B, Siddik ZH, Nagoor NH. Optimization of nanostructured lipid carriers: understanding the types, designs, and parameters in the process of formulations. J Nanopart Res. 2020;22(6):141. doi:10.1007/s11051-020-04848-0
19. Alam T, Khan S, Gaba B, Haider MF, Baboota S, Ali J. Adaptation of quality by design-based development of isradipine nanostructured-lipid carrier and its evaluation for in vitro gut permeation and in vivo solubilization fate. J Pharm Sci. 2018;107(11):2914–2926. doi:10.1016/j.xphs.2018.07.021
20. Belkhir L, Elmeligi A. Carbon footprint of the global pharmaceutical industry and relative impact of its major players. J Clean Prod. 2019;214:185–194. doi:10.1016/j.jclepro.2018.11.204
21. Anastas PT. Origins and early history of green chemistry. In: Horváth I, editor. Advanced Green Chemistry. World Scientific; 2018:1–17. Available from: https://www.worldscientific.com/doi/abs/10.1142/9789813228115_0001.
22. Anastas P, Eghbali N. Green chemistry: principles and practice. Chem Soc Rev. 2010;39(1):301–312. doi:10.1039/B918763B
23. Gałuszka A, Migaszewski Z, Namieśnik J. The 12 principles of green analytical chemistry and the SIGNIFICANCE mnemonic of green analytical practices. Trends Anal Chem. 2013;50:78–84. doi:10.1016/j.trac.2013.04.010
24. Keith LH, Gron LU, Young JL. Green analytical methodologies. Chem Rev. 2007;107(6):2695–2708. doi:10.1021/cr068359e
25. Raynie D, Driver J. Green assessment of chemical methods.
26. Gałuszka A, Migaszewski ZM, Konieczka P, Namieśnik J. Analytical eco-scale for assessing the greenness of analytical procedures. Trends Anal Chem. 2012;37:61–72. doi:10.1016/j.trac.2012.03.013
27. Płotka-Wasylka J, Mohamed HM, Kurowska-Susdorf A, Dewani R, Fares MY, Andruch V. Green analytical chemistry as an integral part of sustainable education development. Curr Opin Green Sustain Chem. 2021;31:100508. doi:10.1016/j.cogsc.2021.100508
28. Pena-Pereira F, Wojnowski W, Tobiszewski M. AGREE—Analytical GREEnness metric approach and software. Anal Chem. 2020;92(14):10076–10082. doi:10.1021/acs.analchem.0c01887
29. Kim S, Youssef SH, Song Y, Garg S. Development and application of a chromatographic method for simultaneous quantification of 5-fluorouracil and imiquimod in drug-in-adhesive topical patches. Sustain Chem Pharm. 2022;27:100711. doi:10.1016/j.scp.2022.100711
30. Gaba B, Fazil M, Khan S, Ali A, Baboota S, Ali J. Nanostructured lipid carrier system for topical delivery of terbinafine hydrochloride. Bull Fac Pharm. 2015;53(2):147–159. doi:10.1016/j.bfopcu.2015.10.001
31. Singh S, Singh M, Tripathi CB, Arya M, Saraf SA. Development and evaluation of ultra-small nanostructured lipid carriers: novel topical delivery system for athlete’s foot. Drug Deliv Transl Res. 2016;6(1):38–47. doi:10.1007/s13346-015-0263-x
32. Imran M, Iqubal MK, Imtiyaz K, et al. Topical nanostructured lipid carrier gel of quercetin and resveratrol: formulation, optimization, in vitro and ex vivo study for the treatment of skin cancer. Int J Pharm. 2020;587:119705. doi:10.1016/j.ijpharm.2020.119705
33. Uppuluri CT, Ravi PR, Dalvi AV. Design, optimization and pharmacokinetic evaluation of Piribedil loaded solid lipid nanoparticles dispersed in nasal in situ gelling system for effective management of Parkinson’s disease. Int J Pharm. 2021;606:120881. doi:10.1016/j.ijpharm.2021.120881
34. Sivadasan D, Sultan MH, Madkhali OA, Alsabei SH, Alessa AA. Stealth liposomes (PEGylated) containing an anticancer drug camptothecin: in vitro characterization and in vivo pharmacokinetic and tissue distribution study. Molecules. 2022;27(3):1086. doi:10.3390/molecules27031086
35. Vlaia L, Olariu I, Muţ AM, et al. New, biocompatible, chitosan-gelled microemulsions based on essential oils and sucrose esters as nanocarriers for topical delivery of fluconazole. Pharmaceutics. 2022;14(1):75. doi:10.3390/pharmaceutics14010075
36. Al-Mayahy MH, Sabri AH, Rutland CS, et al. Insight into imiquimod skin permeation and increased delivery using microneedle pre-treatment. Eur J Pharm Biopharm. 2019;139:33–43. doi:10.1016/j.ejpb.2019.02.006
37. Sabri A, Ogilvie J, McKenna J, Segal J, Scurr D, Marlow M. Intradermal delivery of an immunomodulator for basal cell carcinoma; expanding the mechanistic insight into solid microneedle-enhanced delivery of hydrophobic molecules. Mol Pharm. 2020;17(8):2925–2937. doi:10.1021/acs.molpharmaceut.0c00347
38. Kaithwas V, Dora CP, Kushwah V, Jain S. Nanostructured lipid carriers of olmesartan medoxomil with enhanced oral bioavailability. Colloids Surf B Biointerfaces. 2017;154:10–20. doi:10.1016/j.colsurfb.2017.03.006
39. Mukherjee S, Ray S, Thakur RS. Solid lipid nanoparticles: a modern formulation approach in drug delivery system. Indian J Pharm Sci. 2009;71(4):349–358. doi:10.4103/0250-474x.57282
40. Telo I, Pescina S, Padula C, Santi P, Nicoli S. Mechanisms of imiquimod skin penetration. Int J Pharm. 2016;511(1):516–523. doi:10.1016/j.ijpharm.2016.07.043
41. Rathod VR, Shah DA, Dave RH. Systematic implementation of quality-by-design (QbD) to develop NSAID-loaded nanostructured lipid carriers for ocular application: preformulation screening studies and statistical hybrid-design for optimization of variables. Drug Dev Ind Pharm. 2020;46(3):443–455. doi:10.1080/03639045.2020.1724135
42. Mahant S, Rao R, Souto EB, Nanda S. Analytical tools and evaluation strategies for nanostructured lipid carrier-based topical delivery systems. Expert Opin Drug Deliv. 2020;17(7):963–992. doi:10.1080/17425247.2020.1772750
43. Pandey SS, Patel MA, Desai DT, et al. Bioavailability enhancement of repaglinide from transdermally applied nanostructured lipid carrier gel: optimization, in vitro and in vivo studies. J Drug Deliv Sci Technol. 2020;57:101731. doi:10.1016/j.jddst.2020.101731
44. Baig MS, Owida H, Njoroge W, Siddiqui AR, Yang Y. Development and evaluation of cationic nanostructured lipid carriers for ophthalmic drug delivery of besifloxacin. J Drug Deliv Sci Technol. 2020;55:101496. doi:10.1016/j.jddst.2019.101496
45. Badawi N, El-Say K, Attia D, El-Nabarawi M, Elmazar M, Teaima M. Development of pomegranate extract-loaded solid lipid nanoparticles: quality by design approach to screen the variables affecting the quality attributes and characterization. ACS Omega. 2020;5(34):21712–21721. doi:10.1021/acsomega.0c02618
46. Yokota J, Kyotani S. Influence of nanoparticle size on the skin penetration, skin retention and anti-inflammatory activity of non-steroidal anti-inflammatory drugs. J Chin Med Assoc. 2018;81(6):511–519. doi:10.1016/j.jcma.2018.01.008
47. Jung M, Jin M, Jeon W-J, et al. Development of a long-acting tablet with ticagrelor high-loaded nanostructured lipid carriers. Drug Deliv Transl Res. 2022. doi:10.1007/s13346-022-01205-7
48. Witayaudom P, Klinkesorn U. Effect of surfactant concentration and solidification temperature on the characteristics and stability of nanostructured lipid carrier (NLC) prepared from rambutan (Nephelium lappaceum L.) kernel fat. J Colloid Interface Sci. 2017;505:1082–1092. doi:10.1016/j.jcis.2017.07.008
49. Shah B, Khunt D, Bhatt H, Misra M, Padh H. Application of quality by design approach for intranasal delivery of rivastigmine loaded solid lipid nanoparticles: effect on formulation and characterization parameters. Eur J Pharm Sci. 2015;78:54–66. doi:10.1016/j.ejps.2015.07.002
50. Yang Z, He Q, Ismail BB, Hu Y, Guo M. Ultrasonication induced nano-emulsification of thyme essential oil: optimization and antibacterial mechanism against Escherichia coli. Food Control. 2022;133:108609. doi:10.1016/j.foodcont.2021.108609
51. Rahman Z, Zidan AS, Habib MJ, Khan MA. Understanding the quality of protein loaded PLGA nanoparticles variability by Plackett–Burman design. Int J Pharm. 2010;389(1):186–194. doi:10.1016/j.ijpharm.2009.12.040
52. Klinkesorn U, Namatsila Y. Influence of chitosan and NaCl on physicochemical properties of low-acid tuna oil-in-water emulsions stabilized by non-ionic surfactant. Food Hydrocoll. 2009;23(5):1374–1380. doi:10.1016/j.foodhyd.2008.11.002
53. Remiro PR, Rosa PT, Moraes ÂM. Effect of process variables on imiquimod micronization using a supercritical antisolvent (SAS) precipitation technique. J Supercrit Fluids. 2022;181:105500. doi:10.1016/j.supflu.2021.105500
54. Guilherme VA, Ribeiro LNM, Alcântara ACS, et al. Improved efficacy of naproxen-loaded NLC for temporomandibular joint administration. Sci Rep. 2019;9(1):11160. doi:10.1038/s41598-019-47486-w
55. Gupta V, Dhote V, Paul BN, Trivedi P. Development of novel topical drug delivery system containing cisplatin and imiquimod for dual therapy in cutaneous epithelial malignancy. J Liposome Res. 2014;24(2):150–162. doi:10.3109/08982104.2013.865216
56. Argenziano M, Haimhoffer A, Bastiancich C, et al. In vitro enhanced skin permeation and retention of imiquimod loaded in beta-cyclodextrin nanosponge hydrogel. Pharmaceutics. 2019;11(3):138. doi:10.3390/pharmaceutics11030138
57. Ramineni SK, Cunningham LL, Dziubla TD, Puleo DA. Development of imiquimod-loaded mucoadhesive films for oral dysplasia. J Pharm Sci. 2013;102(2):593–603. doi:10.1002/jps.23386
58. Gazzi RP, Frank LA, Onzi G, Pohlmann AR, Guterres SS. New pectin-based hydrogel containing imiquimod-loaded polymeric nanocapsules for melanoma treatment. Drug Deliv Transl Res. 2020;10(6):1829–1840. doi:10.1007/s13346-020-00805-5
59. Harrison LI, Stoesz JD, Battiste JL, Nelson RJ, Zarraga IE. A pharmaceutical comparison of different commercially available imiquimod 5% cream products. J Dermatol Treat. 2009;20(3):160–164. doi:10.1080/09546630802513693
60. Chollet JL, Jozwiakowski MJ, Phares KR, et al. Development of a topically active imiquimod formulation. Pharm Dev Technol. 1999;4(1):35–43. doi:10.1080/10837459908984222
61. Costa P, Sousa Lobo JM. Modeling and comparison of dissolution profiles. Eur J Pharm Sci. 2001;13(2):123–133. doi:10.1016/S0928-0987(01)00095-1
62. Hopfenberg HB. Controlled release from erodible slabs, cylinders, and spheres. In: Paul DR, Harris FW editors. Controlled Release Polymeric Formulations. American Chemical Society; 1976:26–32. doi:10.1021/bk-1976-0033.ch003
63. Ruela ALM, Perissinato AG, Lino ME, Mudrik PS, Pereira GR. Evaluation of skin absorption of drugs from topical and transdermal formulations. Braz J Pharm Sci. 2016;52(3):527–544. doi:10.1590/s1984-82502016000300018
64. Lertpairod J, Tiyaboonchai W. pH-sensitive beads containing curcumin loaded nanostructured lipid carriers for a colon targeted oral delivery system. J Pharm Investig. 2022;52(3):387–396. doi:10.1007/s40005-022-00572-0
65. Abdella S, Afinjuomo F, Song Y, Upton R, Garg S. Mucoadhesive buccal film of estradiol for hormonal replacement therapy: development and in-vivo performance prediction. Pharmaceutics. 2022;14(3):542. doi:10.3390/pharmaceutics14030542
66. Finnin B, Walters KA, Franz TJ. In vitro skin permeation methodology. In: Benson HA, Watkinson AC editors. Topical and Transdermal Drug Delivery. John Wiley & Sons; 2011:85–108. doi:10.1002/9781118140505.ch5
67. Anantaworasakul P, Chaiyana W, Michniak-Kohn BB, Rungseevijitprapa W, Ampasavate C. Enhanced transdermal delivery of concentrated capsaicin from chili extract-loaded lipid nanoparticles with reduced skin irritation. Pharmaceutics. 2020;12(5):463. doi:10.3390/pharmaceutics12050463
68. The United States Food and Drug Administration. Aldara (imiquimod) cream; 2010. Available from: https://www.accessdata.fda.gov/drugsatfda_docs/label/2010/020723s022lbl.pdf.
 © 2023 The Author(s). This work is published and licensed by Dove Medical Press Limited. The
full terms of this license are available at https://www.dovepress.com/terms
and incorporate the Creative Commons Attribution
- Non Commercial (unported, 3.0) License.
By accessing the work you hereby accept the Terms. Non-commercial uses of the work are permitted
without any further permission from Dove Medical Press Limited, provided the work is properly
attributed. For permission for commercial use of this work, please see paragraphs 4.2 and 5 of our Terms.
© 2023 The Author(s). This work is published and licensed by Dove Medical Press Limited. The
full terms of this license are available at https://www.dovepress.com/terms
and incorporate the Creative Commons Attribution
- Non Commercial (unported, 3.0) License.
By accessing the work you hereby accept the Terms. Non-commercial uses of the work are permitted
without any further permission from Dove Medical Press Limited, provided the work is properly
attributed. For permission for commercial use of this work, please see paragraphs 4.2 and 5 of our Terms.