Back to Journals » Cancer Management and Research » Volume 13
Development and External Validation of a Nomogram to Predict Cancer-Specific Survival in Patients with Primary Intestinal Non-Hodgkin Lymphomas
Authors Zhang C, Liu Z, Tao J, Lin L, Zhai L ![]()
Received 19 September 2021
Accepted for publication 8 December 2021
Published 20 December 2021 Volume 2021:13 Pages 9271—9285
DOI https://doi.org/10.2147/CMAR.S339907
Checked for plagiarism Yes
Review by Single anonymous peer review
Peer reviewer comments 2
Editor who approved publication: Professor Seema Singh
Cuifen Zhang,1 Zeyu Liu,1 Jiahao Tao,1 Lizhu Lin,2 Linzhu Zhai2
1The First Clinical Medical College, Guangzhou University of Chinese Medicine, Guangzhou, People’s Republic of China; 2Cancer Center, The First Affiliated Hospital of Guangzhou University of Chinese Medicine, Guangzhou, People’s Republic of China
Correspondence: Linzhu Zhai
Cancer Center, The First Affiliated Hospital of Guangzhou University of Chinese Medicine, Guangzhou, People’s Republic of China
Tel/Fax +86-20-36596360
Email [email protected]
Purpose: Primary intestinal non-Hodgkin lymphoma (PINHL) is a biologically and clinically heterogeneous disease. Few individual prediction models are available to establish prognoses for PINHL patients. Herein, a novel nomogram was developed and verified to predict long-term cancer-specific survival (CSS) rates in PINHL patients, and a convenient online risk calculator was created using the nomogram.
Materials and Methods: Data on PINHL patients from January 1, 2004, to December 31, 2015, obtained from the Surveillance, Epidemiology, and End Results (SEER) database (n = 2372; training cohort), were analyzed by Cox regression to identify independent prognostic parameters for CSS. The nomogram was internally and externally validated in a SEER cohort (n = 1014) and a First Affiliated Hospital of Guangzhou University of Chinese Medicine (FAHGUCM) cohort (n = 37), respectively. Area under the receiver operating characteristic curve (AUC), calibration curves, and decision curve analysis (DCA) were used to evaluate nomogram performance.
Results: Five independent predictors were identified, namely, age, marital status, Ann Arbor Stage, B symptoms, and histologic type. The nomogram showed good performance in discrimination and calibration, with C-indices of 0.772 (95% CI: 0.754– 0.790), 0.763 (95% CI: 0.734– 0.792), and 0.851 (95% CI: 0.755– 0.947) in the training, internal validation, and external validation cohorts, respectively. The calibration curve indicated that the nomogram was accurate, and DCA showed that the nomogram had a high clinical application value. AUC values indicated that the prediction accuracy of the nomogram was higher than that of Ann Arbor Stage (training cohort: 0.804 vs 0.630; internal validation cohort: 0.800 vs 0.637; external validation cohort: 0.811 vs 0.598), and Kaplan–Meier curves indicated the same.
Conclusion: A nomogram was developed to assist clinicians in predicting the survival of PINHL patients and in making optimal treatment decisions. An online calculator based on the nomogram was made available at https://cuifenzhang.shinyapps.io/DynNomapp/.
Keywords: SEER, survival prognosis, nomogram, risk stratification, Ann Arbor Stage
Graphical Abstract:

Introduction
The percentage of non-Hodgkin lymphoma (NHL) patients with extranodal lymphoma is currently at approximately 30–50% and rising.1,2 The intestinal tract is the second most common site of extranodal invasion involving NHL. The clinical features, pathological subtypes, therapies, and prognoses of primary intestinal non-Hodgkin lymphoma (PINHL) differ from those of gastric lymphoma.3–5 Separate analysis of intestinal lymphoma may improve the pertinence of research and reliability of results.3,4 However, most studies on the construction of predictive models have focused on a specific pathological type or site in the gastrointestinal tract.6–13 Therefore, in this study, PINHL was designated as a separate entity.14
Today, the Ann Arbor and Lugano stages are used to evaluate the progression of lymphoma. Typically only the status and clinical symptoms of lymph node involvement and organ involvement are considered to predict survival and prognosis11 However, various other factors, such as patient age, sex, and race, pathological type, and treatment modality, may affect the overall survival (OS) of patients with lymphoma, where OS is the length of time from diagnosis to death from any cause. Therefore, the Ann Arbor and Lugano stages may not be ideal methods for predicting the prognosis of patients with PINHL.13 To improve treatment strategies and prognosis, it is necessary to develop a straightforward, highly accurate predictive model. Thus far, few studies have systematically evaluated PINHL patients, and there are currently no ideal methods for predicting the survival of inpatients or outpatients with PINHL. Nomograms—quick prediction tools in which numerous independent factors are assigned prediction weights and combined—are crucial in clinical decision-making and risk stratification in oncology.15–18 Therefore, the present study was aimed at constructing and verifying a nomogram to predict the CSS of PINHL patients based on multicenter data.
Materials and Methods
Data Sources
The Surveillance, Epidemiology, and End Results (SEER) Program, an authoritative resource on cancer data in the United States, is a vast source of cancer statistics. In this study, detailed data were extracted from SEER using SEER*Stat software version 8.3.5 (http://seer.cancer.gov/) and from the First Affiliated Hospital of Guangzhou University of Chinese Medicine (FAHGUCM) using the hospital’s medical record system. Patient consent and institutional review board approval for the SEER database were not required. A data-use agreement was submitted in order to gain access to research data, and the username 17,496-Nov2019 was obtained for data analysis. The Ethics Committee of FAHGUCM approved this study, and the requirement for informed consent was waived because patient information was anonymized at every step of the study, including during data cleaning and statistical analysis.
Patient Selection
In this study, PINHL patients who had undergone treatment from January 1, 2004, to December 31, 2015, were extracted from the SEER database. Additionally, PINHL patients diagnosed by pathology at FAHGUCM from January 1, 2010, to December 31, 2020, were extracted from FAHGUCM’s medical record system. These patients were screened with respect to meeting the selection criteria for the study. Details on patient-selection criteria are provided in Figure 1. Patients with an unknown diagnosis, unknown cancer-specific death, survival of less than one month, or autopsy or death certificate were excluded. Patients with a single primary intestinal lymphoma tumor were included in the study. The information collected included age, sex, race, marital status, Ann Arbor Stage, B symptoms, tumor site, histologic characteristics, stage, and treatment methods. Patients were excluded from the study if any of this information was unavailable. Demographic and clinical-pathologic factors were as follows. (1) Marital status of the patient: married or non-married (widowed, divorced, separated, unmarried, or living with a domestic partner). (2) B symptoms: In the SEER cohort, B symptoms were defined as “CS site-specific Factor 2,” where “Code 010” referred to “night sweats, unexplained fever (above 38°C), and unexplained weight loss (generally greater than 10% of body weight in 6 months before admission)”; “Code 020” referred to “pruritis (recurrent and unexplained)”; and “Code 030” referred to “pruritis plus any B symptom(s).” The above codes were used to determine the existing B symptoms. Additionally, “Code 000” referred to “No B symptoms (asymptomatic).” “Code 988, 999” referred to no applicable information or documentation available in the patient’s record. In the FAHGUCM cohort, B symptoms were defined using the same standard. (3) Tumor site. “Small intestine” referred to tumors in the duodenum, jejunum, and/or ileum, overlapping lesion of the small intestine, those in the small intestine, or those not otherwise specified (NOS). “Ileocecum” referred to tumors in the cecum or appendix. “Colon” referred to tumors in the ascending colon, hepatic flexure of the colon, transverse colon, splenic flexure of the colon, descending colon, sigmoid colon, overlapping lesion of the colon, or colon (NOS). “Other” referred to tumors in the rectosigmoid junction, rectum (NOS), anus (NOS), anal canal, and overlapping lesion of rectum, anus, or anal canal. (4) Histological type of PINHL in patients was ascertained based on the International Classification of Diseases for Oncology, 3rd Edition (ICD-O-3). According to ICD-O-3 oncology codes, six histological subtypes of PINHL were classified as follows: diffuse large B-cell lymphoma (DLBCL) (9680), follicular lymphoma (9690, 9691, 9695, 9698), mantle cell lymphoma (9673), Burkitt lymphoma (9687), T-cell lymphoma (9702, 9705, 9714, 9717, 9719), and other lymphomas (9591, 9670, 9671, 9675, 9684, 9688, 9699, 9727, 9728, 9735, 9738, 9811, 9823). (5) Stage: Localized lesions were designated as Ann Arbor Stage I, regional lesions as Ann Arbor Stage II, and distant metastases as Ann Arbor Stages III and IV. (6) Description of treatment: surgery, radiotherapy, and chemotherapy were set as binary variables. Patient-survival information was quantified using OS and CSS. Data on 8398 patients diagnosed with PINHL from 1983 to 2015 were extracted from the SEER 3database. However, information on B symptoms and Ann Arbor Stage were available only from 2004 to 2015. After screening the data, a total of 3386 patients were enrolled in the present study. In the external cohort, 37 out of 49 PINHL patients met the inclusion criteria for the study.
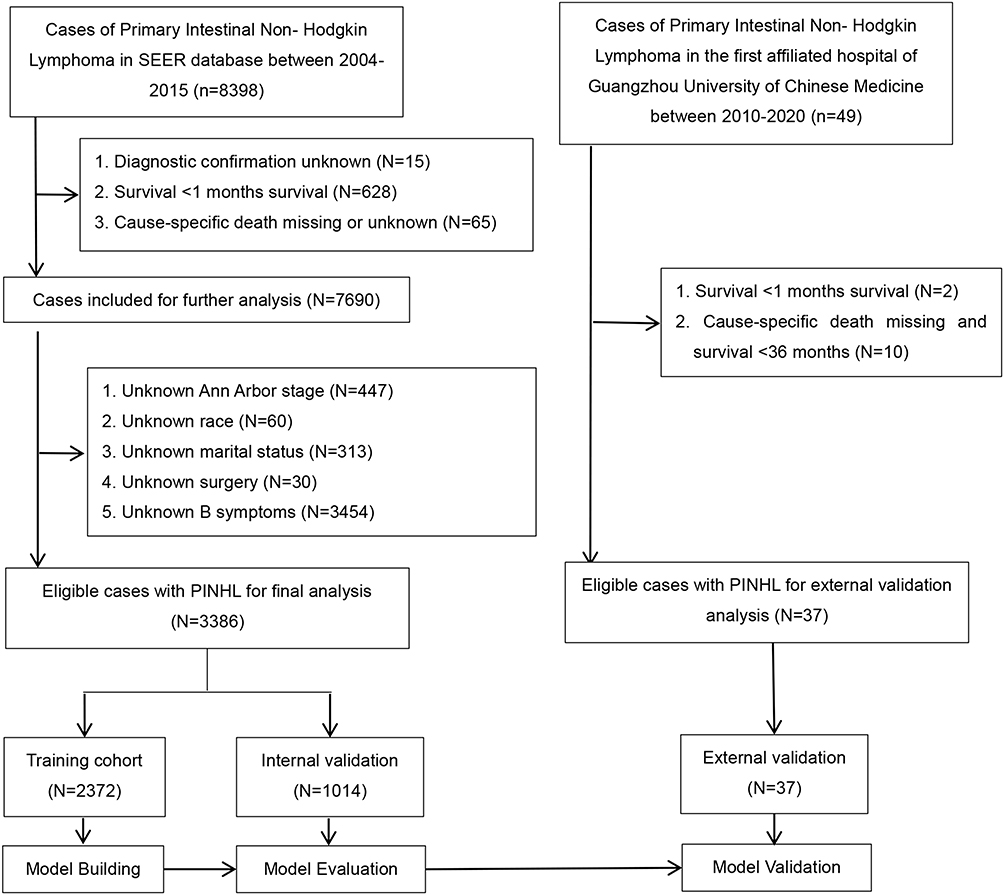 |
Figure 1 Recruitment criteria for eligible PINHL patients examined in our present study. |
Outcomes
The primary outcome was CSS, defined as the time from diagnosis of PINHL to cancer-specific death, and the secondary outcome was OS, defined as the time from the first diagnosis to death from any cause.
Construction and Validation of the Nomogram
Eligible PINHL patients from the SEER database were randomly divided into two cohorts, the training cohort and the internal validation cohort, at a ratio of 7:3. PINHL patients from FAHGUCM were designated as the external validation cohort. The training cohort was used for nomogram construction, and the internal and external cohorts were utilized for nomogram validation. The effects of variables in the training cohorts were calculated using univariable and multivariable Cox regression analyses. Each variable’s impact on CSS was presented as a hazard ratio (HR) (and corresponding 95% confidence interval [CI]) to identify independent risk factors. Based on results of the Cox regression analysis, a nomogram was established for predicting the probability of 1-, 3-, and 5-year CSS. Bootstrapping was used to assess the robustness of this prediction model.19 The effectiveness of the nomogram was validated using 1000 bootstrap resamples based on the internal and external validation cohorts. The validity of the nomogram was evaluated by detecting the discrimination and calibration characteristics of the model. A receiver operating characteristic (ROC) curve was plotted, and area under the ROC curve (AUC) was measured. AUC, also called the C statistic, is an accurate and comprehensive measure of sensitivity and specificity.19,20 The accuracy of 1-, 3-, and 5-year predictions of CSS was assessed using AUC. Calibration curves of the nomogram were used to determine the agreement between anticipated and detected survival in order to further assess the prognostic accuracy of the model. Decision curve analysis (DCA) was also carried out. It is a new method for evaluating the potential clinical value of risk-prediction models21 and is widely used in studies on predictive models.22
Nomogram Performance in Risk Stratification
The survival of each patient in the study was estimated based on a total nomogram score. X-tile plots were constructed to divide the training cohort into four groups based on nomogram scores. The most effective cutoff points were determined following correction for the use of minimum P statistics by Miller-Siegmund P-value correction.23 After the best cutoff values for the training groups were selected, they were applied to the validation cohorts. The cohorts were divided into low, low-intermediate, high-intermediate, and high-risk subgroups based on total nomogram scores of the patients. ROC and Kaplan–Meier survival curves were used to compare the discriminative ability of the nomogram in predicting survival with that of the Ann Arbor Stage.
The net reclassification index (NRI) and integrated discrimination improvement (IDI) of the nomogram were also calculated and used to evaluate the degree of improvement in the sensitivity and specificity of the nomogram compared with those of the Ann Arbor Stage system. NRI was used to assess differences in the number of PINHL patients correctly classified by the nomogram and the Ann Arbor Stage at a given cut-off point, thereby comparing the predictive power of the two models.24 IDI reflects differences in the prediction probability gap between the two models, which is based on prediction probability for each individual patient in the disease model. The criteria for IDI are the same as those for NRI.
Statistical Analysis
Statistical analysis was performed using EmpowerStats (http://www.empowerstats.com, X & Y Solutions, Inc., Boston, MA) and R software (version x64 4.0.1, www.r-project.org). Demographic and clinical variables were contrasted between the training and validation cohorts, using Fisher’s exact test or the Pearson Chi-square test for categorical variables, and independent t-test for continuous variables, as appropriate. The categorical and continuous variables were reported as frequency and percentage, mean ± standard deviation (SD), or median [interquartile range (IQR)], respectively. Survival curves were constructed using the Kaplan–Meier method, and differences among the groups were compared using the Log rank test. Univariate and multivariate analyses were conducted using the Cox regression model. Nomogram construction and validation were performed using the Iasonos guide.25 The R statistical packages “caret,” “rms,” “survival,” and “pROC” were used to randomize the groups, plot the distribution of risk scores, construct the calibration plot and ROC curves, and build the nomogram; “rmda” was used to draw the DCA curves. The “shiny” and “DynNom” packages were used to develop a web-based survival-rate calculator (https://www.shinyapps.io/) for predicting patient survival rates. All statistical tests were two-sided, and P-values of <0.05 were regarded as statistically significant.
Results
Clinicopathological Characteristics and Patient Prognosis in Training, Internal Validation, and External Validation Cohorts
A total of 3423 PINHL patients were retrospectively enrolled from SEER (n = 3386) and FAHGUCM (n = 37). Details on the demographics, clinical-pathologic characteristics, and treatment of patients in the training, internal validation, and external validation cohorts are listed in Table 1. The median ages of PINHL patients in the SEER and FAHGUCM cohorts were 62.0 years old (IQR, 50.0–74.0) and 56.0 years old (IQR, 48.0–65.0), respectively. Baseline characteristics showed no substantive differences between the training and internal validation cohorts. In the SEER cohort, the median follow-up period was 49 months (ranging from 1 to 155 months). During the follow-up period, 769 patients died of cancer, and 363 patients died from other causes. The 5-year CSS rate was 77.1% and the 5-year OS rate 70.7%. In the FAHGUCM cohort, at the last follow-up, 16 patients died of a cancer-specific cause, and 21 patients died from other causes; the median follow-up time was 28 months (ranging from 1 to 124 months). The 5-year CSS rate was 48.4% (Figure 2).
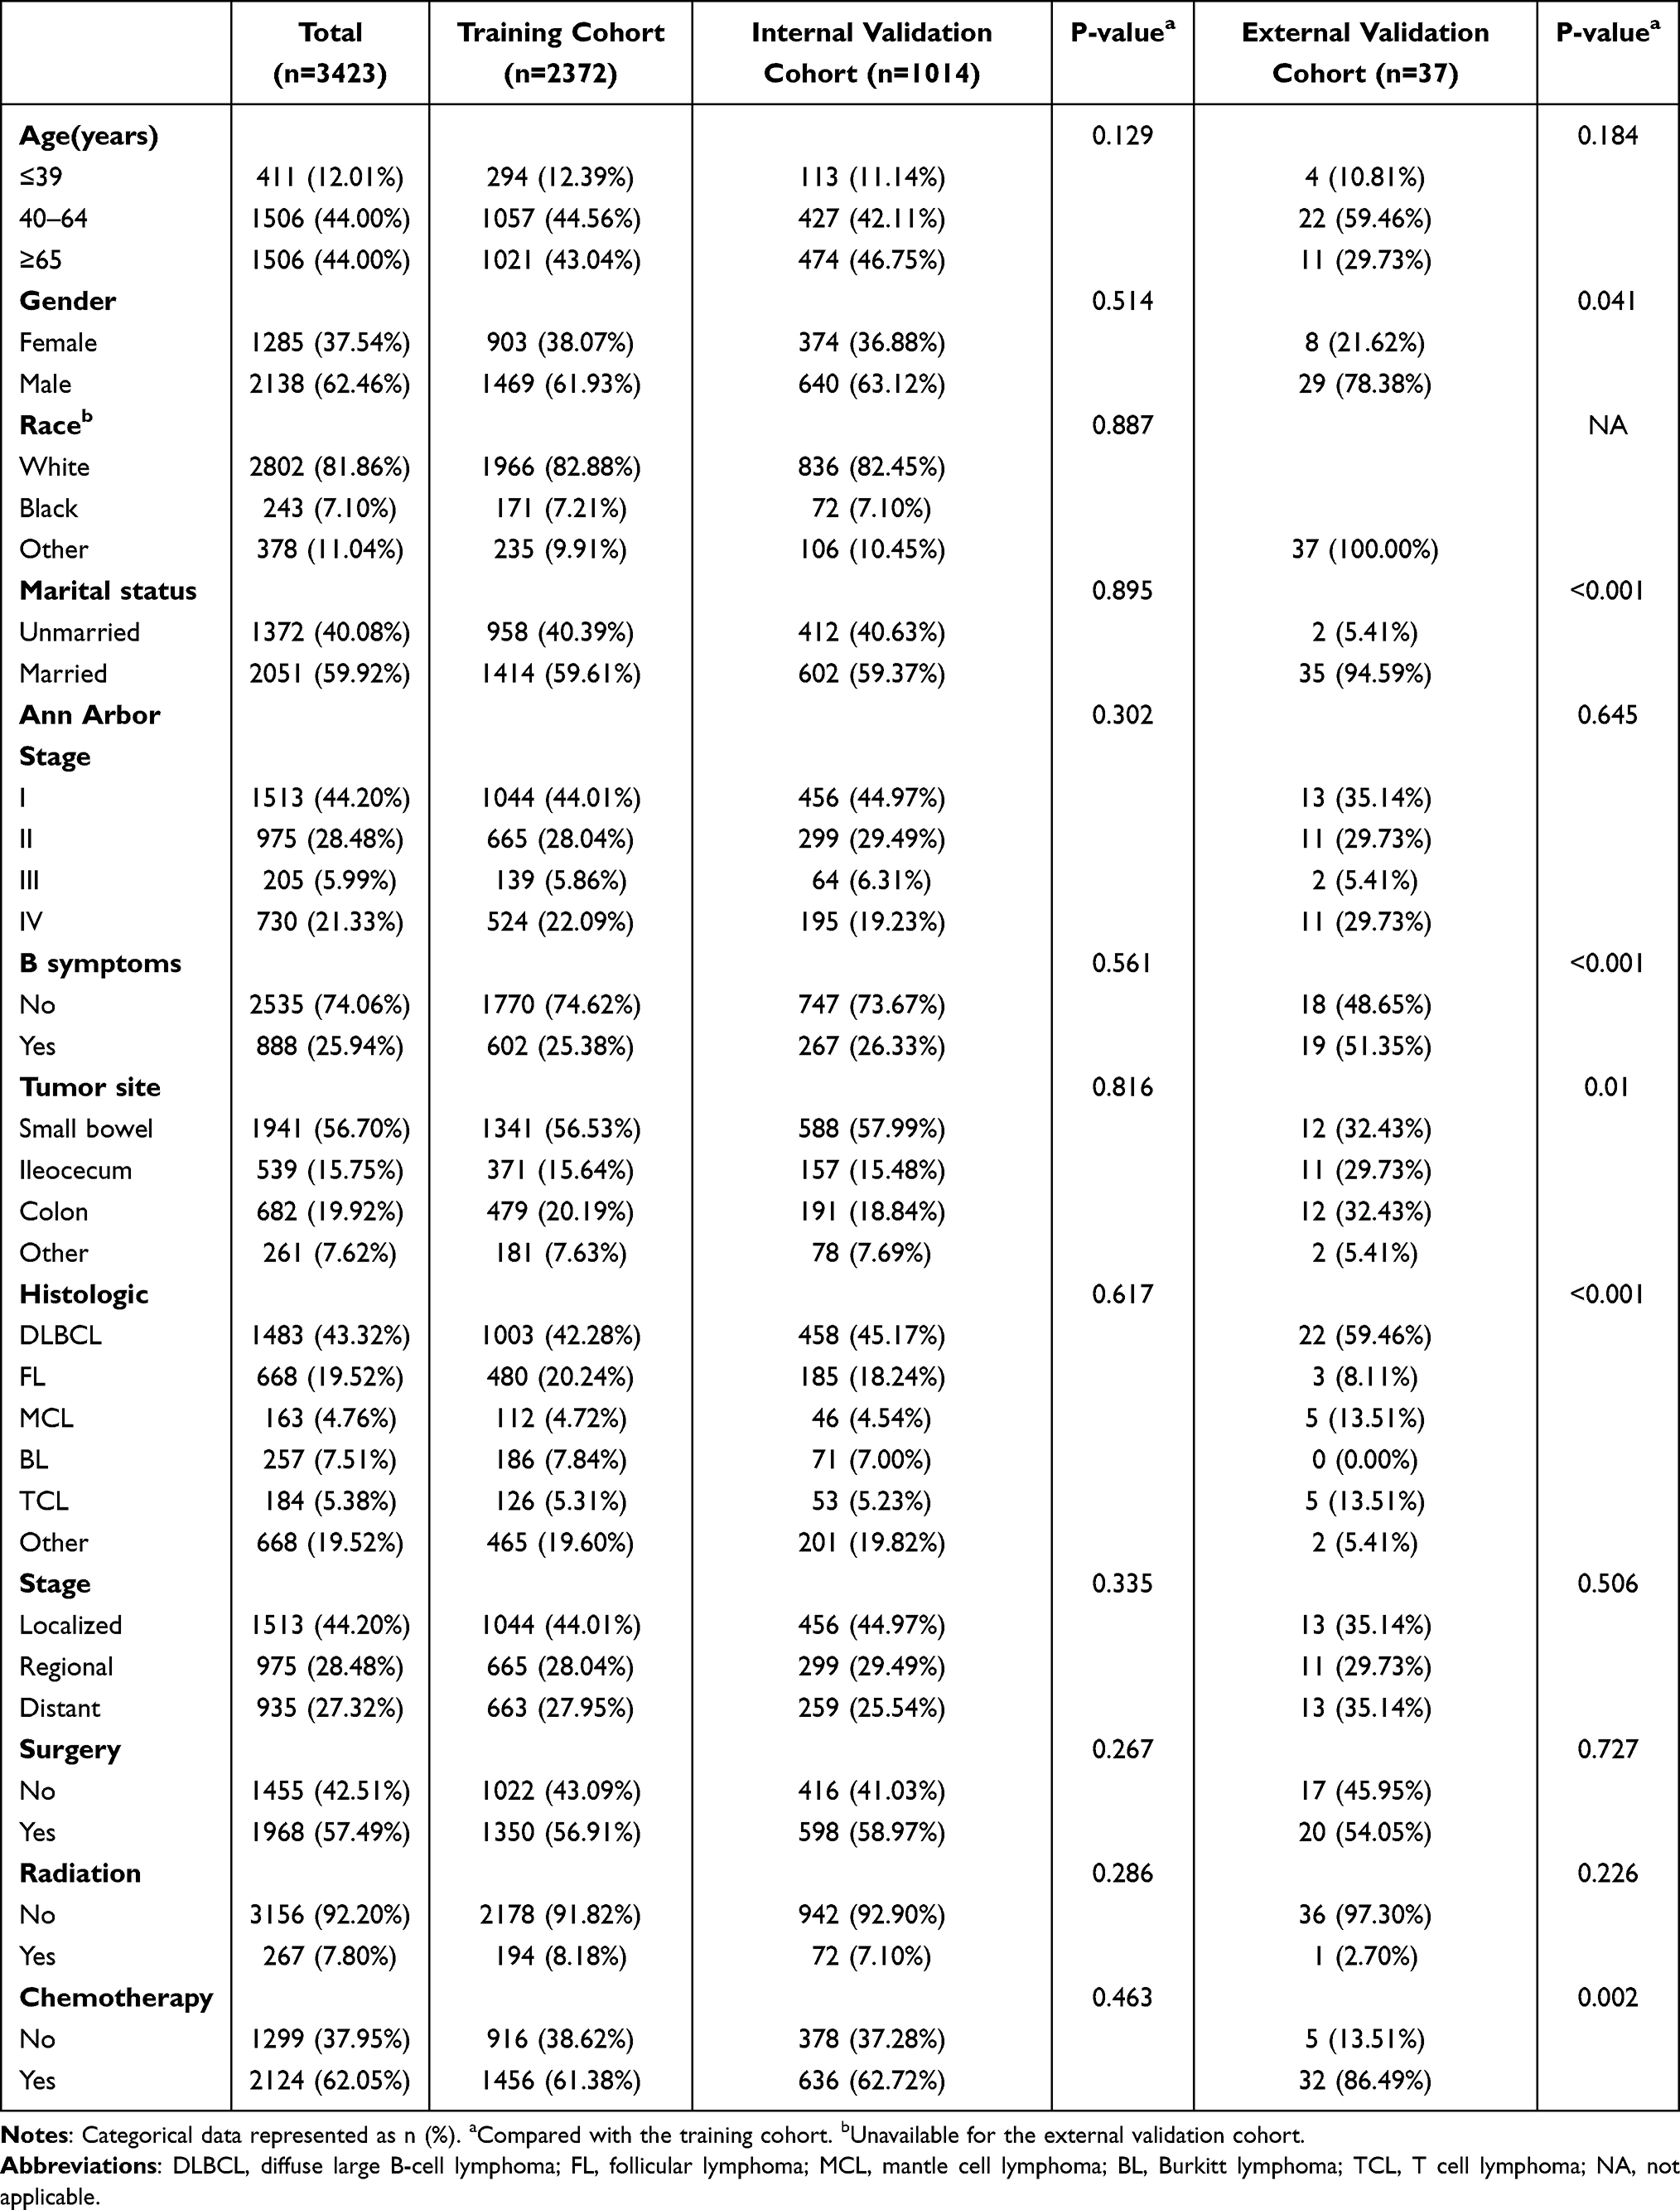 |
Table 1 Clinicopathological Characteristics of Patients in the Training, Internal and External Validation Cohorts (N(%)) |
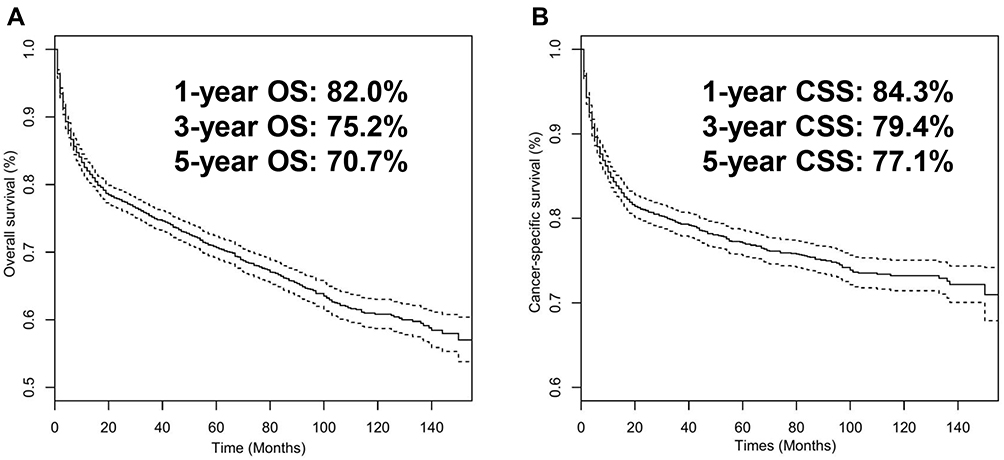 |
Figure 2 Kaplan–Meier survival curves for OS (A) and CSS (B) in all the 3386 patients from the SEER database. |
Univariate and Multivariate Analyses of CSS, and Construction of Nomogram in Training Cohort
Based on results of the univariate analysis in the training cohort, six factors (age, marital status, Ann Arbor Stage, B symptoms, histologic type, and stage) were linked to the primary outcome CSS. In multivariate Cox regression analysis, five variables (age, marital status, Ann Arbor Stage, B symptoms, and histologic type) were determined as independent predictive parameters of CSS in PINHL patients (Table 2). Multivariable Cox regression analysis was used to identify the parameters significantly associated with CSS, after which a nomogram for CSS was developed and is shown in Figure 3. The nomogram indicated that CSS was higher in patients characterized as younger, married, in Ann Arbor Stage I, without B symptoms, or with follicular lymphoma. Moreover, histologic type had the most significant impact on survival, followed by age, Ann Arbor Stage, marital status, and B symptoms. In the nomogram, the risk score for each variable can be obtained from the above ruler and superimposed on the ruler below to calculate 1-, 3-, and 5-year CSS. Detailed scores for each variable in the nomogram are listed in Table 2.
 |
Table 2 Univariable and Multivariable Analyses of Cancer-Specific Survival in the Training Cohort |
 |
Figure 3 Newly developed nomogram for predicting 1-, 3-, and 5-year CSS in PINHL patients. |
Evaluation and External Validation of Nomogram
Cox ROC analyses were used to assess the discriminative ability of the nomogram in predicting 1-, 3-, and 5-year CSS in PINHL patients. C-indices of the nomogram for predicting the survival of PINHL patients were 0.772 (95% CI, 0.754–0.790), 0.763 (95% CI, 0.734–0.792), and 0.851 (95% CI, 0.755–0.947) in the training, internal validation, and external validation cohorts, respectively. For PINHL patients, the 1-, 3-, and 5-year CSS of the nomogram yielded AUC values of 0.809, 0.802, and 0.804 in the training cohort (Figure 4A), 0.793, 0.794, 0.800 in the internal validation cohort (Figure 4B), and 0.938, 0.798, and 0.754 in the external validation cohort (Figure 4C), indicating that the nomogram showed favorable discrimination. The calibration curve of the nomogram was highly consistent with the standard curve, indicating that the nomogram showed high reliability in predicting 1-, 3-, and 5-year CSS in the training (Figure 5A–C) and internal validation cohorts (Figure 5D–F). The external validation cohort (Figure 5G–I) also showed consistency between the predicted and observed 1- and 3-year CSS. DCA curves for the performance of the nomogram and Ann Arbor Stage in predicting 5-year CSS in the training, internal validation, and external validation cohorts are shown in Figure 6. The red dotted line indicates the performance of the Ann Arbor Stage, and the black dotted line indicates the performance of the nomogram. DCA of the nomogram showed higher net benefits and demonstrated better clinical outcome values than those obtained using Ann Arbor Stage in the training (Figure 6A), internal validation (Figure 6B), and external validation cohorts (Figure 6C). Total NRI and IDI for the 1-, 3-, and 5-year CSS were assessed when the nomogram was compared with the Ann Arbor Stage model. The NRI and IDI of 5-year CSS predicted using the nomogram were 0.791 and 0.162 in the training cohort, 0.74 and 0.172 in the internal validation cohort, and 0.568 and 0.226 in the external validation cohort; these results indicate that the nomogram showed considerable improvement in predicting 5-year survival. The same results were obtained in predicting 1- and 3-year CSS (Supplementary Table 1).
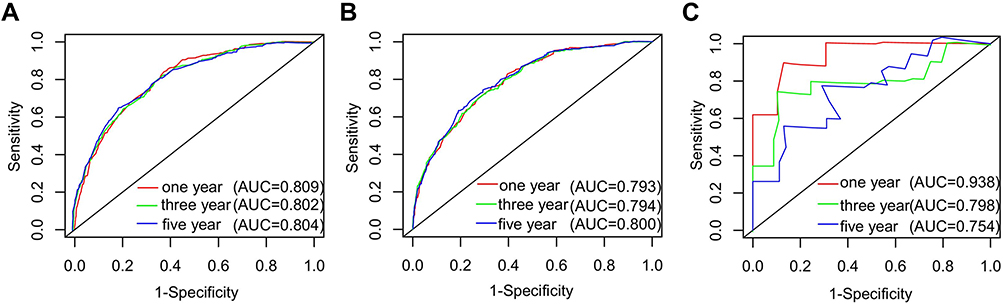 |
Figure 4 ROC curves for the nomogram’s prediction of 1-, 3-, and 5-year CSS in the training cohort (A), internal validation cohort (B), and external validation cohort (C). |
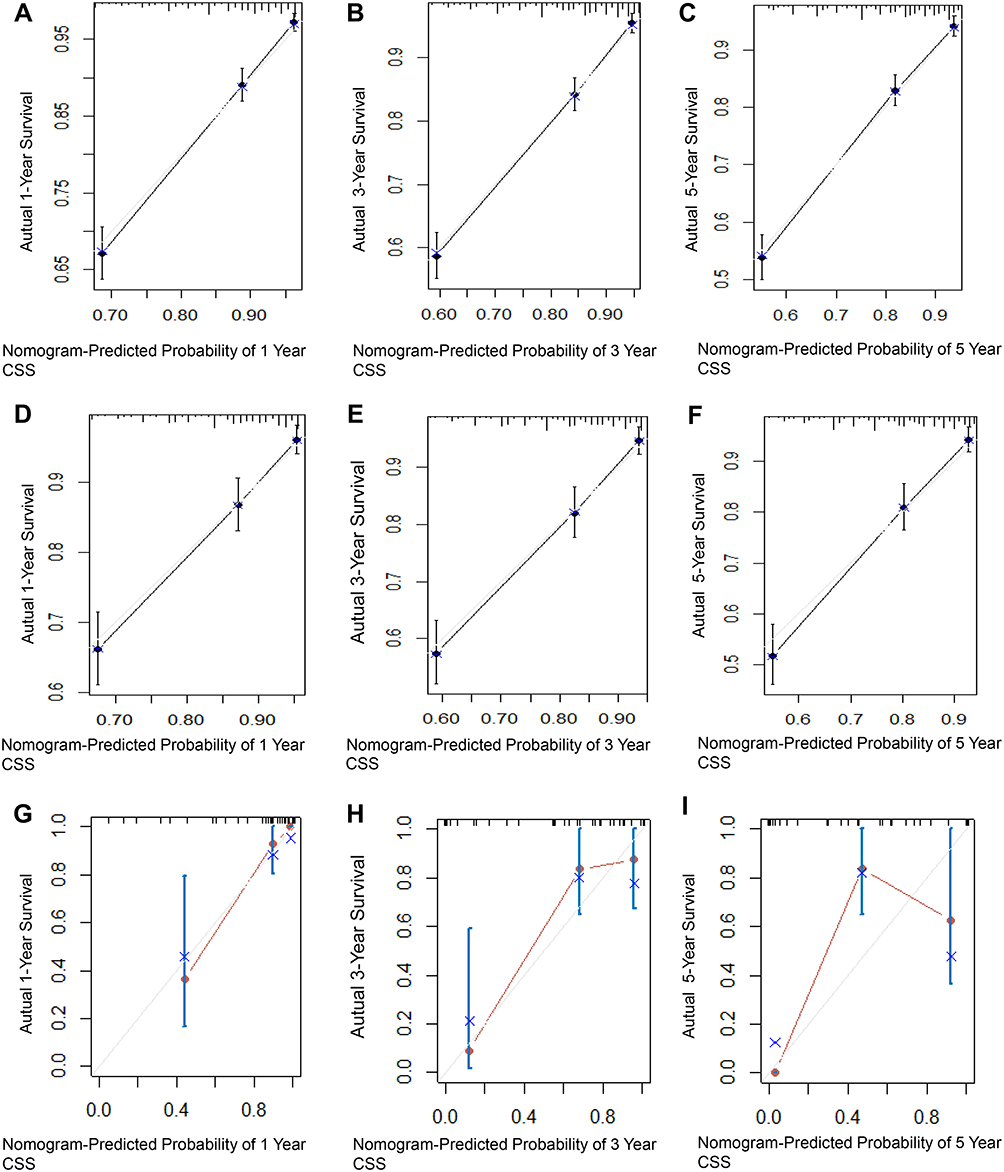 |
Figure 5 Calibration curve for predicting 1-, 3-, and 5-year CSS of PINHL patients in the training (A–C), internal validation (D–F), and external validation cohorts (G–I). |
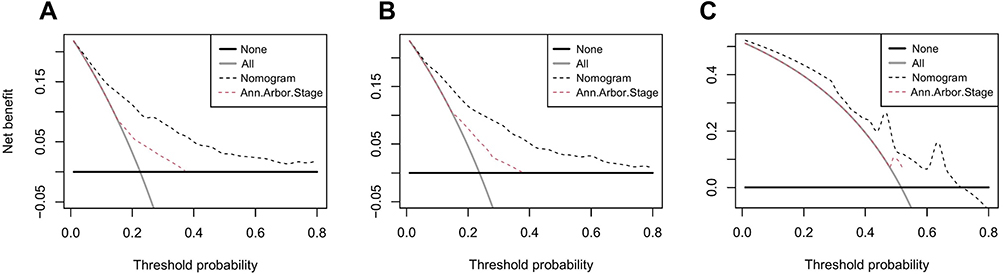 |
Figure 6 Decision curve analysis of the nomogram’s ability to predict 5-year CSS in PINHL patients in the training (A), internal validation (B), and external validation cohorts (C). The gray and black lines represent the assumption for all the patients with and without CSS, respectively. The black dotted line represents the nomogram, and the red dotted line represents the Ann Arbor Stage. |
Dynamic Web-Based Survival Rate Calculator
Based on the nomogram model, a dynamic web-based survival-rate calculator was built (https://cuifenzhang.shinyapps.io/DynNomapp/) to predict long-term CSS in PINHL patients (Figure 7). For example, for a 68-year-old (42 points) married man (0 points), diagnosed with DLBCL (55 points), having Ann Arbor Stage IV (25 points), and presenting with B symptoms (10 points), the total score was 132, and the 5-year CSS rate was approximately 40% (95% CI: 33–49%). This calculated value can be used by clinicians when making decisions regarding treatment plans and patient counseling.
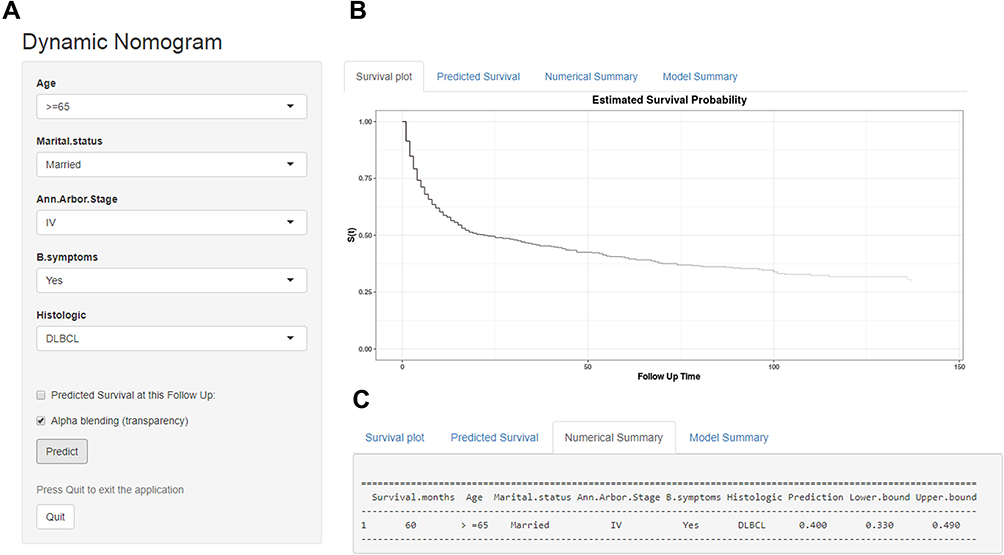 |
Figure 7 An example used to illustrate usage of the web-based survival-rate calculator. A 68-year-old married man with PINHL was diagnosed as DLBCL with Ann Arbor Stage IV and presenting with B symptoms (A). The patient’s survival plot according to the web survival-rate calculator (B). The patient’s 5-year CSS rate is approximately 40.0 (95% CI 33.0–49.0) (C). |
Nomogram Performance in Risk Stratification
Using the acquired optimal cutoff values based on X-tile plots for the training cohort, patients in the training, internal validation, and external validation cohorts were divided into four groups to assess risk stratification with respect to CSS. According to the cut-off point values, nomogram scores of the patients were divided into low risk (n = 604, 25.46%; score: 0–59), low-intermediate risk (n = 613, 25.84%; score: 60–82), high-intermediate risk (n = 581, 24.49%; score: 83–106), and high risk (n = 574, 24.20%; score: 107–188).
Comparing the Predictive Accuracy of Novel Risk Stratification Model and Conventional Prognostic Scoring Systems
The ROC and Kaplan–Meier survival curves were used to compare the accuracy of the proposed nomogram against that of traditional Ann Arbor staging in predicting CSS. In the training, internal validation, and external validation cohorts, the AUC values of 5-year CSS rate in PINHL patients obtained using the nomogram with its novel risk-stratification model were higher than those obtained using the Ann Arbor Stage system (0.804, 0.800, and 0811 versus 0.630, 0.637, and 0.598) (Figure 8). These results indicate that the proposed nomogram achieved better accuracy than the Ann Arbor Stage system in these cohorts (Figure 9).
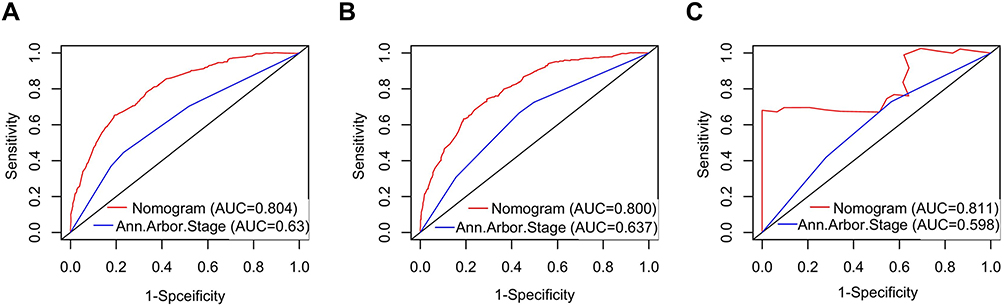 |
Figure 8 ROC curves used to assess the performance of the nomogram and Ann Arbor Stage prognostic systems in predicting 5-year CSS in the training (A), internal validation (B), and external validation cohorts (C). |
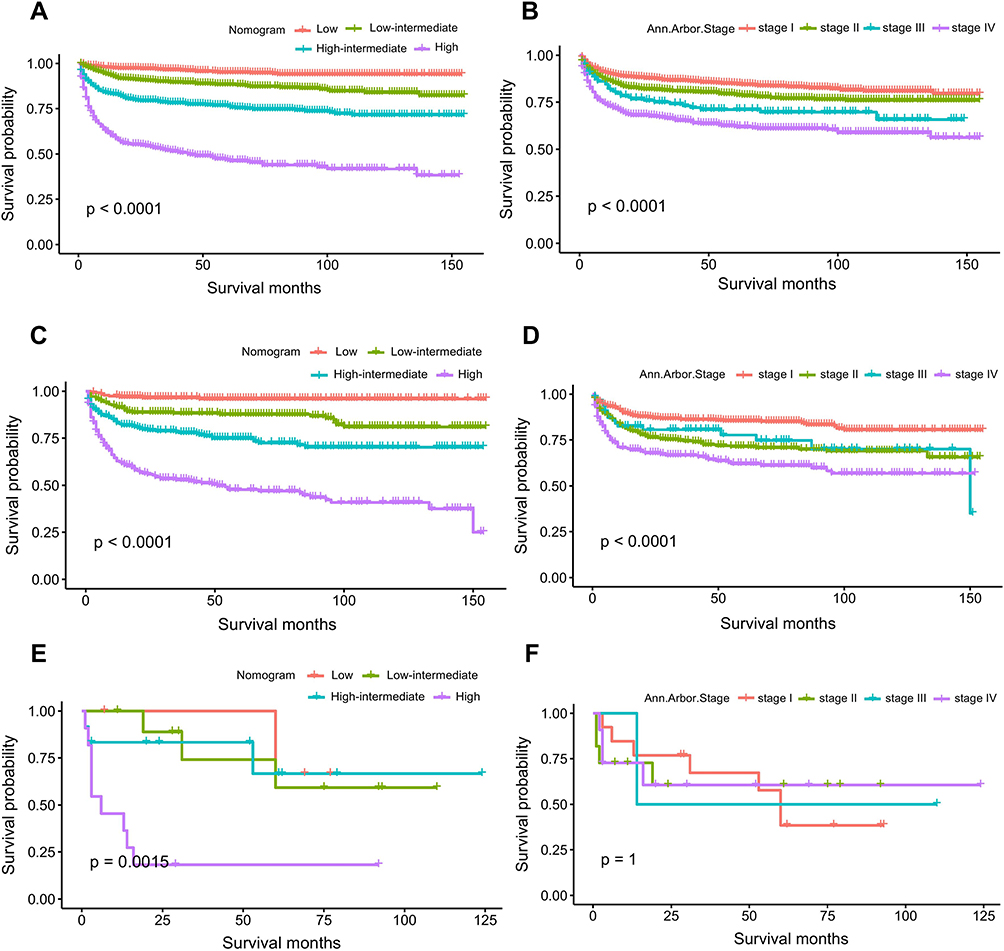 |
Figure 9 Kaplan–Meier survival curves showing the risk levels determined using the nomogram and Ann Arbor Stage system in the training (A and B), internal validation (C and D), and external validation cohort (E and F). |
Discussion
Clinicians need to predict patient survival in order to optimize treatment strategies. Herein, simple clinicopathological factors were used to develop a novel nomogram for predicting the 1-, 3-, and 5-year CSS of PINHL patients more accurately than the existing Ann Arbor Stage. The variables used in the nomogram can be collected and calculated directly by clinicians, which improves the practicability of this model. The nomogram model developed by Sun et al showed good predictive value for OS and CSS in primary gastrointestinal non-Hodgkin lymphoma patients.11 However, the population examined in that study differed from the population examined in our study. A nomogram developed by Wang et al for predicting OS in adult patients with primary gastrointestinal diffuse large B-cell lymphoma was only verified internally.12 In our study, a SEER cohort was used for the training and internal validation of the proposed nomogram, and another patient population was used for external validation to further assess the accuracy, applicability, and credibility of the nomogram in a broad population of patients with PINHL. Using the new nomogram model, a C-statistic of 85.1% was obtained in the external cohort, which was higher than the C-statistic of 77.2% obtained in the training cohort, and the C-statistic of 76.3% obtained in the internal validation cohort. These results indicate that the proposed nomogram showed high discriminative ability. The calibration characteristics of the nomogram were also confirmed. The DCA curve and NRI and IDI values demonstrated that the proposed nomogram could potentially be more beneficial than the Ann Arbor Stage system for predicting the CSS rate of PINHL patients.
In our study, five clinical variables were used to construct the nomogram for the prognosis of patient survival: age, marital status, Ann Arbor Stage, B symptoms, and histologic type.
Currently, age is used as a common predictive parameter for various cancers,26,27 including PINHL. Patients of advanced age tend to have decreased immunity, increased numbers of comorbidities, and increased therapy-related toxicity, contributing to worsened outcomes and prognoses in these patients.11,12
Marital status is a risk parameter for developing cancers and a significant prognostic indicator in cancer patients,28,29 as shown by numerous studies discussing this occurrence.30–33 A systematic review of 18 studies confirmed that unmarried patients with malignancies were more likely to be diagnosed with advanced cancer at the time of diagnosis.34 Le Guyader-Peyrou et al have shown that marital status is independently associated with survival prognosis.35 The findings of our study also indicated that the prognosis of married PINHL patients was better than that of non-married patients. This may be because married patients possibly have better economic resources than unmarried patients, enabling married patients to obtain improved treatment options with the potential improve their prognosis. Additionally, married patients may also receive extra care from their spouses. Furthermore, widowed patients tend to be older, which may increase cancer-related mortality.13 Physiologic studies have shown that marriage quality plays a role in improving cardiovascular, endocrine, and immune function.36,37
Ann Arbor Stage is a clinically recognized classification standard of lymphoma.38 In our study, Cox regression analysis revealed that the Ann Arbor Stage was a separate prognostic index in PINHL patients. This observation, which is similar to those made in several previous studies,13 is consistent with an advanced stage being indicative of disseminated disease.
B symptoms, which are often associated with higher histologic grade or distantly disseminated disease, also showed predictive significance39 and were found to be an independent risk factor for poor survival in our study.
In addition to age, marital status, Ann Arbor Stage, and B symptoms, our study showed that histologic type was an independent risk factor in PINHL patients, which agrees with the results obtained by Wang et al.5 In our study, histologic type was defined as a significant factor that can be used to design treatment strategies and evaluate prognosis in PINHL patients. The proposed nomogram verified that certain histologic types, such as T-cell lymphoma, were correlated with worsened survival status, necessitating prompt individualized treatment strategies.40,41 According to Kim,42 T-cell lymphoma might have more negative characteristics, such as advanced stage at diagnosis, and its 5-year OS rate was significantly lower than that of B-cell lymphoma.
In our study, no treatments were found to be independent prognostic factors. This may be because the study was retrospective, so the consistency of treatment measures and indications could not be controlled, or because the lack of patient compliance or treatment side effects affected treatment outcomes.43 However, the proposed nomogram can be utilized in patients prior to treatment to obtain a rapid assessment of survival and prognosis. The nomogram integrates the effects of five clinical variables and provides a personalized risk assessment for each patient. The predictive power of parameters and overall clinical performance of the patients are considered in the scoring system of the nomogram. Therefore, the nomogram can provide greater reliability than that of the Ann Arbor Stage criteria in predicting the survival of PINHL patients and in helping to guide treatment decisions. In this nomogram, a high total score indicates a need for increased vigilance on the part of the clinician and appropriate individualized treatment as soon as possible to obtain an improved survival prognosis.
To our knowledge, our model is the first PINHL-specific prognostic nomogram validated internally in a large SEER cohort and validated externally in other patient populations. The number of patients was relatively high in our study, and the use of prognostic factors was similar to that described in other studies.5,11 The consistency of results obtained in our study with those obtained in previous studies indicates the high feasibility, stability, and performance of the proposed nomogram. This nomogram will help determine the prognosis of PINHL patients in different populations and provide practical guidance to the clinicians treating these patients. In this study, an online tool based on the nomogram was also designed to aid with clinical calculations. Using this tool, clinicians simply need to enter the relevant patient information on the web page, and then the CSS probabilities for PINHL patients are automatically calculated.
Our study had several limitations. First, information on therapies used in patients and some specific indicators, such as specific types of radio or chemotherapy, IPI scores, LDH levels, and performance status, were not available for the SEER cohort. Second, it was not possible to obtain a high number of patients for external validation. Although the ROC, DCA, NRI, and IDI values were satisfactory, the 5-year calibration consistency and discriminative ability of the Kaplan–Meier survival curve were insufficient for the validation of the proposed nomogram. Third, this was a retrospective study based on limited clinical data, and it was not free from potential selection bias. Therefore, the proposed nomogram needs further assessment in prospective multicenter clinical studies to prove its clinical effectiveness.
Conclusion
In conclusion, a novel nomogram for predicting the 1-, 3-, and 5-year CSS probability in PINHL patients was developed and validated. Compared with the Ann Arbor Stage, the proposed nomogram showed superior performance in identification, calibration, and clinical guidance. Moreover, a convenient dynamic web-based survival rate calculator based on the nomogram was constructed for use by clinicians.
Abbreviations
AUC, area under the ROC curve; CI, confidence interval; CSS, cancer-specific survival; DCA, decision curve analysis; DLBCL, diffuse large B-cell lymphoma; FAHGUCM, First Affiliated Hospital of Guangzhou University of Chinese Medicine; HR, hazard ratio; ICD-O-3, International Classification of Diseases for Oncology, third edition; NOS, not otherwise specified; PINHL, primary intestinal non-Hodgkin lymphoma; OS, overall survival; ROC, receiver operating characteristic; SEER, Surveillance, Epidemiology, and End Results.
Ethics Approval and Informed Consent
This study was reviewed and approved by the Ethics Committee of the First Affiliated Hospital of Guangzhou University of Chinese Medicine, and patient informed consent was waived.
Acknowledgments
We would like to express our gratitude to the senior fellow apprentice Pinliang Chen for his help in designing and collecting hospital data, and for providing critical amendments to the manuscript. We also thank the staff members of the National Cancer Institute for their contribution to the SEER Program. We thank LetPub (www.letpub.com) for its linguistic assistance during the preparation of this manuscript.
Funding
This work was supported by grants from the Beijing Xisike Clinical Oncology Research Foundation (grant no. Y-2020Sciclone/zb/qn-0005), the National Natural Science Foundation of China (grant no. 81873147) and the Natural Science Foundation of Guangdong Province (grant no. 2020A1515011177).
Disclosure
The authors report no conflicts of interest in this work.
References
1. Gou HF, Zang J, Jiang M, et al. Clinical prognostic analysis of 116 patients with primary intestinal non-Hodgkin lymphoma. Med Oncol. 2012;29(1):227–234. doi:10.1007/s12032-010-9783-x
2. Tian C, Li Y, Chen Z. A retrospective analysis of primary gastrointestinal non-Hodgkin lymphomas: clinical features, prognostic factors and treatment outcomes. Onco Targets Ther. 2020;13:5345–5352. doi:10.2147/OTT.S248381
3. Aviles A, Neri N, Nambo MJ, et al. Surgery and chemotherapy versus chemotherapy as treatment of high-grade MALT gastric lymphoma. Med Oncol. 2006;23(2):295–300. doi:10.1385/MO:23:2:295
4. Ikoma N, Badgwell BD, Mansfield PF. Multimodality treatment of gastric lymphoma. Surg Clin North Am. 2017;97(2):405–420. doi:10.1016/j.suc.2016.11.012
5. Wang W, Lin P, Yao H, et al. Clinical analysis of primary gastrointestinal non-Hodgkin’s lymphoma. Pak J Med Sci. 2017;33(6):1406–1411. doi:10.12669/pjms.336.13631
6. Lu J, Tan H, Li B, et al. Status and prognostic nomogram of patients with Burkitt lymphoma. Oncol Lett. 2020;19(1):972–984. doi:10.3892/ol.2019.11155
7. Jiang S, Qin Y, Liu P, et al. Prognostic nomogram and predictive factors in refractory or relapsed diffuse Large B-cell lymphoma patients failing front-line R-CHOP regimens. J Cancer. 2020;11(6):1516–1524. doi:10.7150/jca.36997
8. Han Y, Yang J, Liu P, et al. Prognostic nomogram for overall survival in patients with diffuse Large B-Cell lymphoma. Oncologist. 2019;24(11):e1251–e1261. doi:10.1634/theoncologist.2018-0361
9. Li K, Wang R, Huang S, et al. Prognostic nomogram for overall survival in extranodal natural Killer/T-Cell Lymphoma patients. Clin Lymphoma Myeloma Leuk. 2018;18(12):e537–e543. doi:10.1016/j.clml.2018.08.011
10. Zhu Y, Xu W, Zheng X, et al. Nomogram incorporating clinicopathological parameters to predict the survival of patients with mantle cell lymphoma. J Investig Med. 2019;67(2):331–337. doi:10.1136/jim-2018-000837
11. Sun B, Xia Y, Guo Y, et al. Development and validation of prognostic nomograms for patients with primary gastrointestinal Non-Hodgkin Lymphomas. Dig Dis Sci. 2020;65(12):3570–3582. doi:10.1007/s10620-020-06078-9
12. Wang J, Zhou M, Zhou R, et al. Nomogram for predicting the overall survival of adult patients with primary gastrointestinal diffuse Large B Cell Lymphoma: a SEER- Based Study. Front Oncol. 2020;10:
13. Zhong Q, Shi Y. Development and validation of a novel risk stratification model for cancer-specific survival in diffuse Large B-Cell Lymphoma. Front Oncol. 2020;10:
14. Lightner AL, Shannon E, Gibbons MM, et al. Primary gastrointestinal non-Hodgkin’s lymphoma of the small and large intestines: a Systematic Review. J Gastrointest Surg. 2016;20(4):827–839. doi:10.1007/s11605-015-3052-4
15. Touijer K, Scardino PT. Nomograms for staging, prognosis, and predicting treatment outcomes. Cancer. 2009;115(13 Suppl):3107–3111. doi:10.1002/cncr.24352
16. Fang C, Wang W, Feng X, et al. Nomogram individually predicts the overall survival of patients with gastroenteropancreatic neuroendocrine neoplasms. Br J Cancer. 2017;117(10):1544–1550. doi:10.1038/bjc.2017.315
17. Dong F, Shen Y, Gao F, et al. Nomograms to predict individual prognosis of patients with primary small cell carcinoma of the bladder. J Cancer. 2018;9(7):1152–1164. doi:10.7150/jca.23344
18. Balachandran VP, Gonen M, Smith JJ, et al. Nomograms in oncology: more than meets the eye. Lancet Oncol. 2015;16(4):e173–80. doi:10.1016/S1470-2045(14)71116-7
19. Harrell FE
20. Kumar R, Indrayan A. Receiver operating characteristic (ROC) curve for medical researchers. Indian Pediatr. 2011;48(4):277–287. doi:10.1007/s13312-011-0055-4
21. Vickers AJ, Elkin EB. Decision curve analysis: a novel method for evaluating prediction models. Med Decis Making. 2006;26(6):565–574. doi:10.1177/0272989X06295361
22. Vickers AJ, Cronin AM, Elkin EB, et al. Extensions to decision curve analysis, a novel method for evaluating diagnostic tests, prediction models and molecular markers. BMC Med Inform Decis Mak. 2008;8:53. doi:10.1186/1472-6947-8-53
23. Camp RL, Dolled-Filhart M, Rimm DL. X-tile: a new bio-informatics tool for biomarker assessment and outcome-based cut-point optimization. Clin Cancer Res. 2004;10(21):7252–7259. doi:10.1158/1078-0432.CCR-04-0713
24. Pencina MJ, D’agostino RB
25. Iasonos A, Schrag D, Raj GV, et al. How to build and interpret a nomogram for cancer prognosis. J Clin Oncol. 2008;26(8):1364–1370. doi:10.1200/JCO.2007.12.9791
26. International Non-Hodgkin’s Lymphoma Prognostic Factors P. A predictive model for aggressive non-Hodgkin’s lymphoma. N Engl J Med. 1993;329(14):987–994. doi:10.1056/NEJM199309303291402
27. Lugtenburg PJ, Lyon AR, Marks R, et al. Treatment of aggressive non-Hodgkin’s lymphoma in frail patients: cardiac comorbidities and advanced age. Future Oncol. 2019;15(11):1197–1205. doi:10.2217/fon-2019-0019
28. Li M, Han M, Chen Z, et al. Does marital status correlate with the female breast cancer risk? A systematic review and meta-analysis of observational studies. PLoS One. 2020;15(3):e0229899. doi:10.1371/journal.pone.0229899
29. Trudel-Fitzgerald C, Poole EM, Sood AK, et al. Social integration, marital status, and ovarian cancer risk: a 20-year prospective Cohort Study. Psychosom Med. 2019;81(9):833–840. doi:10.1097/PSY.0000000000000747
30. Lau SKM, Gannavarapu BS, Carter K, et al. Impact of socioeconomic status on pretreatment weight loss and survival in non-small-cell lung cancer. J Oncol Pract. 2018;14(4):e211–e220. doi:10.1200/JOP.2017.025239
31. Osazuwa-Peters N, Christopher KM, Cass LM, et al. What’s Love Got to do with it? Marital status and survival of head and neck cancer. Eur J Cancer Care (Engl). 2019;28(4):e13022. doi:10.1111/ecc.13022
32. Celeng C, Takx R, Lessmann N, et al. The association between marital status, coronary computed tomography imaging biomarkers, and mortality in a lung cancer screening population. J Thorac Imaging. 2020;35(3):204–209. doi:10.1097/RTI.0000000000000457
33. Yang CC, Cheng LC, Lin YW, et al. The impact of marital status on survival in patients with surgically treated colon cancer. Medicine. 2019;98(11):e14856. doi:10.1097/MD.0000000000014856
34. Buja A, Lago L, Lago S, et al. Marital status and stage of cancer at diagnosis: a systematic review. Eur J Cancer Care (Engl). 2018;27(1):e12755. doi:10.1111/ecc.12755
35. Le Guyader-peyrou S, Orazio S, Dejardin O, et al. Factors related to the relative survival of patients with diffuse large B-cell lymphoma in a population-based study in France: does socio-economic status have a role? Haematologica. 2017;102(3):584–592. doi:10.3324/haematol.2016.152918
36. Aizer AA, Chen MH, Mccarthy EP, et al. Marital status and survival in patients with cancer. J Clin Oncol. 2013;31(31):3869–3876. doi:10.1200/JCO.2013.49.6489
37. Gallo LC, Troxel WM, Matthews KA, et al. Marital status and quality in middle-aged women: associations with levels and trajectories of cardiovascular risk factors. Health Psychol. 2003;22(5):453–463. doi:10.1037/0278-6133.22.5.453
38. Olszewska-Szopa M, Wrobel T. Gastrointestinal non-Hodgkin lymphomas. Adv Clin Exp Med. 2019;28(8):1119–1124. doi:10.17219/acem/94068
39. Anderson T, Chabner BA, Young RC, et al. Malignant lymphoma. 1. The histology and staging of 473 patients at the National Cancer Institute. Cancer. 1982;50(12):2699–2707. doi:10.1002/1097-0142(19821215)50:12<2699::aid-cncr2820501202>3.0.co;2-A
40. Azab MB, Henry-Amar M, Rougier P, et al. Prognostic factors in primary gastrointestinal non-Hodgkin’s lymphoma. A multivariate analysis, report of 106 cases, and review of the literature. Cancer. 1989;64(6):1208–1217. doi:10.1002/1097-0142(19890915)64:6<1208::aid-cncr2820640608>3.0.co;2-z
41. Coffey J, Hodgson DC, Gospodarowicz MK. Therapy of non-Hodgkin’s lymphoma. Eur J Nucl Med Mol Imaging. 2003;30 Suppl 1:S28–S36. doi:10.1007/s00259-003-1157-6
42. Kim SJ, Choi CW, Mun YC, et al. Multicenter retrospective analysis of 581 patients with primary intestinal non-Hodgkin lymphoma from the Consortium for Improving Survival of Lymphoma (CISL). BMC Cancer. 2011;11:321. doi:10.1186/1471-2407-11-321
43. Eom BW, Ryu KW, Nam BH, et al. Survival nomogram for curatively resected Korean gastric cancer patients: multicenter retrospective analysis with external validation. PLoS One. 2015;10(2):e0119671. doi:10.1371/journal.pone.0119671
 © 2021 The Author(s). This work is published and licensed by Dove Medical Press Limited. The
full terms of this license are available at https://www.dovepress.com/terms
and incorporate the Creative Commons Attribution
- Non Commercial (unported, 3.0) License.
By accessing the work you hereby accept the Terms. Non-commercial uses of the work are permitted
without any further permission from Dove Medical Press Limited, provided the work is properly
attributed. For permission for commercial use of this work, please see paragraphs 4.2 and 5 of our Terms.
© 2021 The Author(s). This work is published and licensed by Dove Medical Press Limited. The
full terms of this license are available at https://www.dovepress.com/terms
and incorporate the Creative Commons Attribution
- Non Commercial (unported, 3.0) License.
By accessing the work you hereby accept the Terms. Non-commercial uses of the work are permitted
without any further permission from Dove Medical Press Limited, provided the work is properly
attributed. For permission for commercial use of this work, please see paragraphs 4.2 and 5 of our Terms.