Back to Journals » Clinical Epidemiology » Volume 12
Development and Evaluation of a Prediction Model for Ascertaining Rheumatic Heart Disease Status in Administrative Data
Authors Bond-Smith D ![]() , Seth R
, Seth R ![]() , de Klerk N
, de Klerk N ![]() , Nedkoff L
, Nedkoff L ![]() , Anderson M, Hung J
, Anderson M, Hung J ![]() , Cannon J, Griffiths K, Katzenellenbogen JM
, Cannon J, Griffiths K, Katzenellenbogen JM ![]()
Received 9 December 2019
Accepted for publication 16 May 2020
Published 9 July 2020 Volume 2020:12 Pages 717—730
DOI https://doi.org/10.2147/CLEP.S241588
Checked for plagiarism Yes
Review by Single anonymous peer review
Peer reviewer comments 2
Editor who approved publication: Professor Vera Ehrenstein
D Bond-Smith,1 R Seth,1 N de Klerk,1,2 L Nedkoff,1 M Anderson,3 J Hung,1 J Cannon,1,2 K Griffiths,4,5 JM Katzenellenbogen1,2
1School of Population and Global Health, The University of Western Australia, Perth, Australia; 2Telethon Kids Institute, Perth, Australia; 3Queensland Health, Brisbane, Australia; 4Centre for Big Data Research, The University of New South Wales, Sydney, Australia; 5Menzies School of Health Research, Charles Darwin University, Darwin, Australia
Correspondence: D Bond-Smith Email [email protected]
Background: Previous research has raised substantial concerns regarding the validity of the International Statistical Classification of Diseases and Related Health Problems (ICD) codes (ICD-10 I05–I09) for rheumatic heart disease (RHD) due to likely misclassification of non-rheumatic valvular disease (non-rheumatic VHD) as RHD. There is currently no validated, quantitative approach for reliable case ascertainment of RHD in administrative hospital data.
Methods: A comprehensive dataset of validated Australian RHD cases was compiled and linked to inpatient hospital records with an RHD ICD code (2000– 2018, n=7555). A prediction model was developed based on a generalized linear mixed model structure considering an extensive range of demographic and clinical variables. It was validated internally using randomly selected cross-validation samples and externally. Conditional optimal probability cutpoints were calculated, maximising discrimination separately for high-risk versus low-risk populations.
Results: The proposed model reduced the false-positive rate (FPR) from acute rheumatic fever (ARF) cases misclassified as RHD from 0.59 to 0.27; similarly for non-rheumatic VHD from 0.77 to 0.22. Overall, the model achieved strong discriminant capacity (AUC: 0.93) and maintained a similar robust performance during external validation (AUC: 0.88). It can also be used when only basic demographic and diagnosis data are available.
Conclusion: This paper is the first to show that not only misclassification of non-rheumatic VHD but also of ARF as RHD yields substantial FPRs. Both sources of bias can be successfully addressed with the proposed model which provides an effective solution for reliable RHD case ascertainment from hospital data for epidemiological disease monitoring and policy evaluation.
Keywords: rheumatic heart disease, international classification of diseases, prediction, case ascertainment, acute rheumatic fever, non-rheumatic valvular heart disease, administrative data, validation, discrimination, receiver operating curve, Australia
Background
Rheumatic heart disease (RHD) is a preventable yet severe disease estimated to affect around 30 million people globally.1,2 It is triggered by acute rheumatic fever (ARF), itself an autoimmune reaction to a Group A streptococcus infection in the throat or skin.3 Recurrent ARF can cause chronic RHD involving permanent heart valve damage. Due to its significant environmental aetiology linked to poverty, RHD is endemic in low-income countries as well as in lower socio-economic status (SES) populations in some high-income countries. Aboriginal and Torres Strait Islander Australians (hereafter respectfully referred to as Indigenous) are reported to have one of the highest prevalence of RHD in the world.4
Retrospective identification of RHD patients in administrative hospital data is an important tool for disease monitoring and control programs, research and policy development and evaluation. Diagnosis coding is based on the International Statistical Classification of Diseases and Related Health Problems (10th revision, ICD-10).5 Our data were coded using the Australian Modification (ICD-10-AM), but relevant codes correspond to versions used internationally. However, there are substantial concerns regarding the validity of using the ICD codes (I05–I09) for identifying RHD cases. Previous studies have discussed the potential for substantial misclassification6 because these codes include valvular heart disease (VHD) of unspecified origin in any or multiple valves (Supplementary Material).
However, the classification issues in the coding of RHD are in fact more complex and can also arise from misclassifying ARF cases as RHD and vice versa. This may occur if the patient’s state of disease progression is unclear from the medical notes, terminology is used interchangeably in discharge summaries or due to the clinical complexity of the diagnosis for ARF and RHD. Both sources of misclassification, relative to non-rheumatic VHD and ARF, raise serious doubt about the uncritical using the ICD codes for RHD for case ascertainment.
The existing literature proposes simple ad hoc rules using only a subset of RHD ICD codes, without further investigating their validity and robustness.7 We have previously6 developed a qualitative algorithm that categorises RHD ICD codes into “probable”, “possible” and “unlikely” RHD, but validation was restricted to a small, selected sample and its discriminant capacity showed limited improvement for some population groups. There is currently no quantitative modelling approach for RHD case ascertainment.
This paper proposes a quantitative approach to the identification of RHD cases in administrative data based on a large dataset of validated Australian RHD cases. The primary aim of the study was to develop a data-driven prediction model for RHD ICD codes to maximize performance, achieve robustness of the proposed algorithm and ensure broader generalizability.
Methods
Data
The End RHD in Australia: Study of Epidemiology (ERASE) Project has established a linked administrative database on ARF/RHD in five Australian jurisdictions: New South Wales (NSW), Northern Territory (NT), Queensland (QLD), South Australia (SA), and Western Australia (WA). It includes information from ARF/RHD registers, hospital data, death records and detailed surgical registry data. The data have been harmonised across data collections and jurisdictions and is described in detail elsewhere.8 For the current study, we used the ERASE data for NT, QLD, SA and WA (NSW ARF/RHD register too recent for meaningful analysis) and generated a dataset of all linked inpatient records (2000–2018) for patients aged <60 years who had been validated as RHD or non-RHD cases (see details about sources of validation below) and had been admitted to hospital at least once with an ICD-10 discharge code of RHD (I05–I09) in any diagnosis field during the study period.
Sources of Data for Validation
Validation information which confirmed or refuted the RHD diagnosis was based on retrospectively collected clinical information from i) ARF/RHD registers, ii) surveillance data and iii) surgical registry data. The ARF/RHD registers (i) in Australia contain records of people who have a clinically validated RHD diagnosis and severity. Surveillance data (ii) were obtained from ad hoc validation studies in QLD and WA. The QLD RHD control program undertook a large case finding program to identify patients missed by the register based on detailed chart reviews for hospital admissions between 2009 and 2014 covering all QLD public hospitals. In WA, a separate chart review validated RHD-coded diagnoses for randomly selected patients in three tertiary settings.9 Finally, the Cardiac Surgery Database of the Australian & New Zealand Society of Cardiac & Thoracic Surgeons (ANZSCTS, iii) explicitly records surgically validated rheumatic valve lesions covering all public and selected private hospitals.10
Data from the QLD and NT ARF/RHD registers and surveillance data were used for model development. It is plausible that selection bias for validated cases is minimal for these two jurisdictions given the representative coverage of the QLD surveillance dataset and the NT ARF/RHD register being Australia’s most mature and complete register. Validated cases from SA and WA were used for external validation of the model. Table 1 summarises the contribution of the different sources to the final dataset.
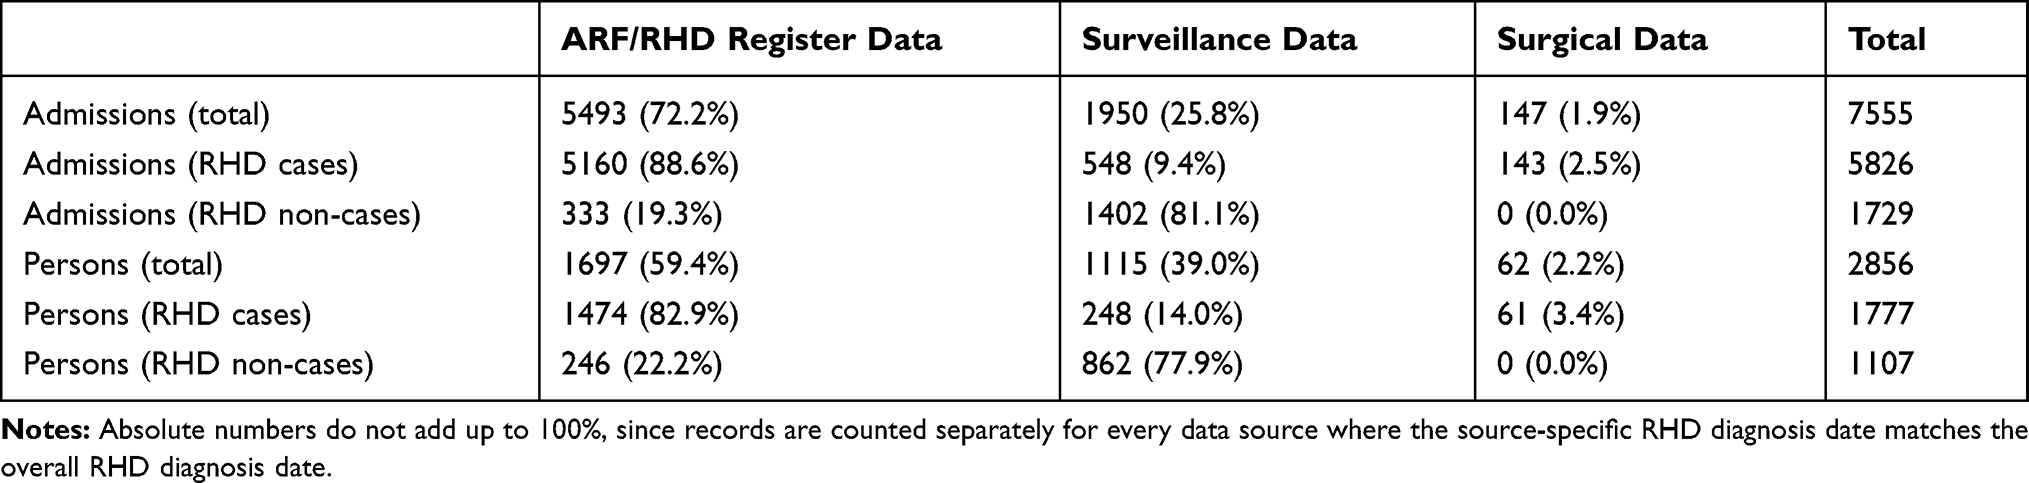 |
Table 1 Sources of Case Validation for RHD Cases and Non-Cases (for RHD Coded Sample), by Hospital Admissions and Persons, n (%) |
Identification of RHD Sample
RHD status was categorised not only as a time-invariant person characteristic (RHD ever) but also as a time-variant variable, since a person can be both an RHD case and an RHD non-case at different points in time (Figure 1). We defined a person as an RHD case from the earliest date they were recorded with RHD on either of the three validation data sources. Similarly, a person was defined as an RHD non-case for the period preceding the latest available date where they were recorded as an RHD non-case across any of the data sources.
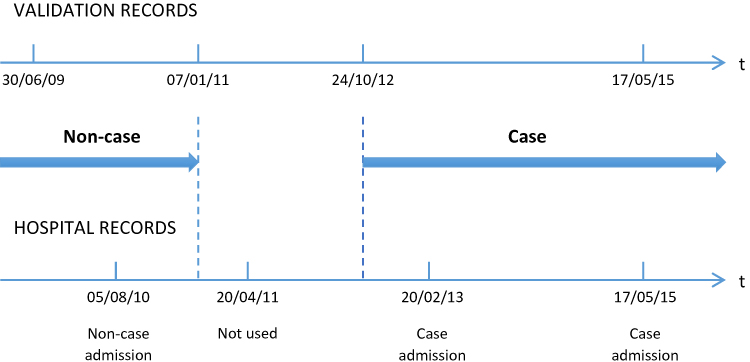 |
Figure 1 Visual overview of time-variant nature of RHD case status. |
The QLD surveillance data were supplied as a separate dataset where diagnosis dates and hospital information were partially incomplete (81.0% of records). To ensure RHD status information was correctly assigned to individuals’ hospital records, a matching hierarchy was devised (Supplementary Figure S1). Overall, 2323 persons (97.1%) could be matched.
For 45 persons (<0.1%), there was an inconsistency between their RHD status across data sources; 20 were excluded because their RHD onset date was prior to their latest RHD-free record. Records coded as I06.8, I06.9, I07.9, I09.0 and I09.2 were not considered (n=36 total), because they were too rare. Finally, admissions for people with a validated RHD onset at 60 years or older were excluded (n=1377 records), because it is likely that the true onset of RHD occurred prior to data availability. Moreover, this cohort is very different across many characteristics from the contemporary RHD patient population which is of primary interest.8 Given these exclusions, the final sample comprised any record with an RHD ICD code and a validated RHD status (at the time of hospital admission). In total, 7555 validated RHD-associated hospitalisations for 2856 persons were identified (Table 1 and Figure 2). The external validation sample contains 1160 hospitalisations for 522 persons (Supplementary Material). The variables considered for model development and their definitions are shown in Table 2.
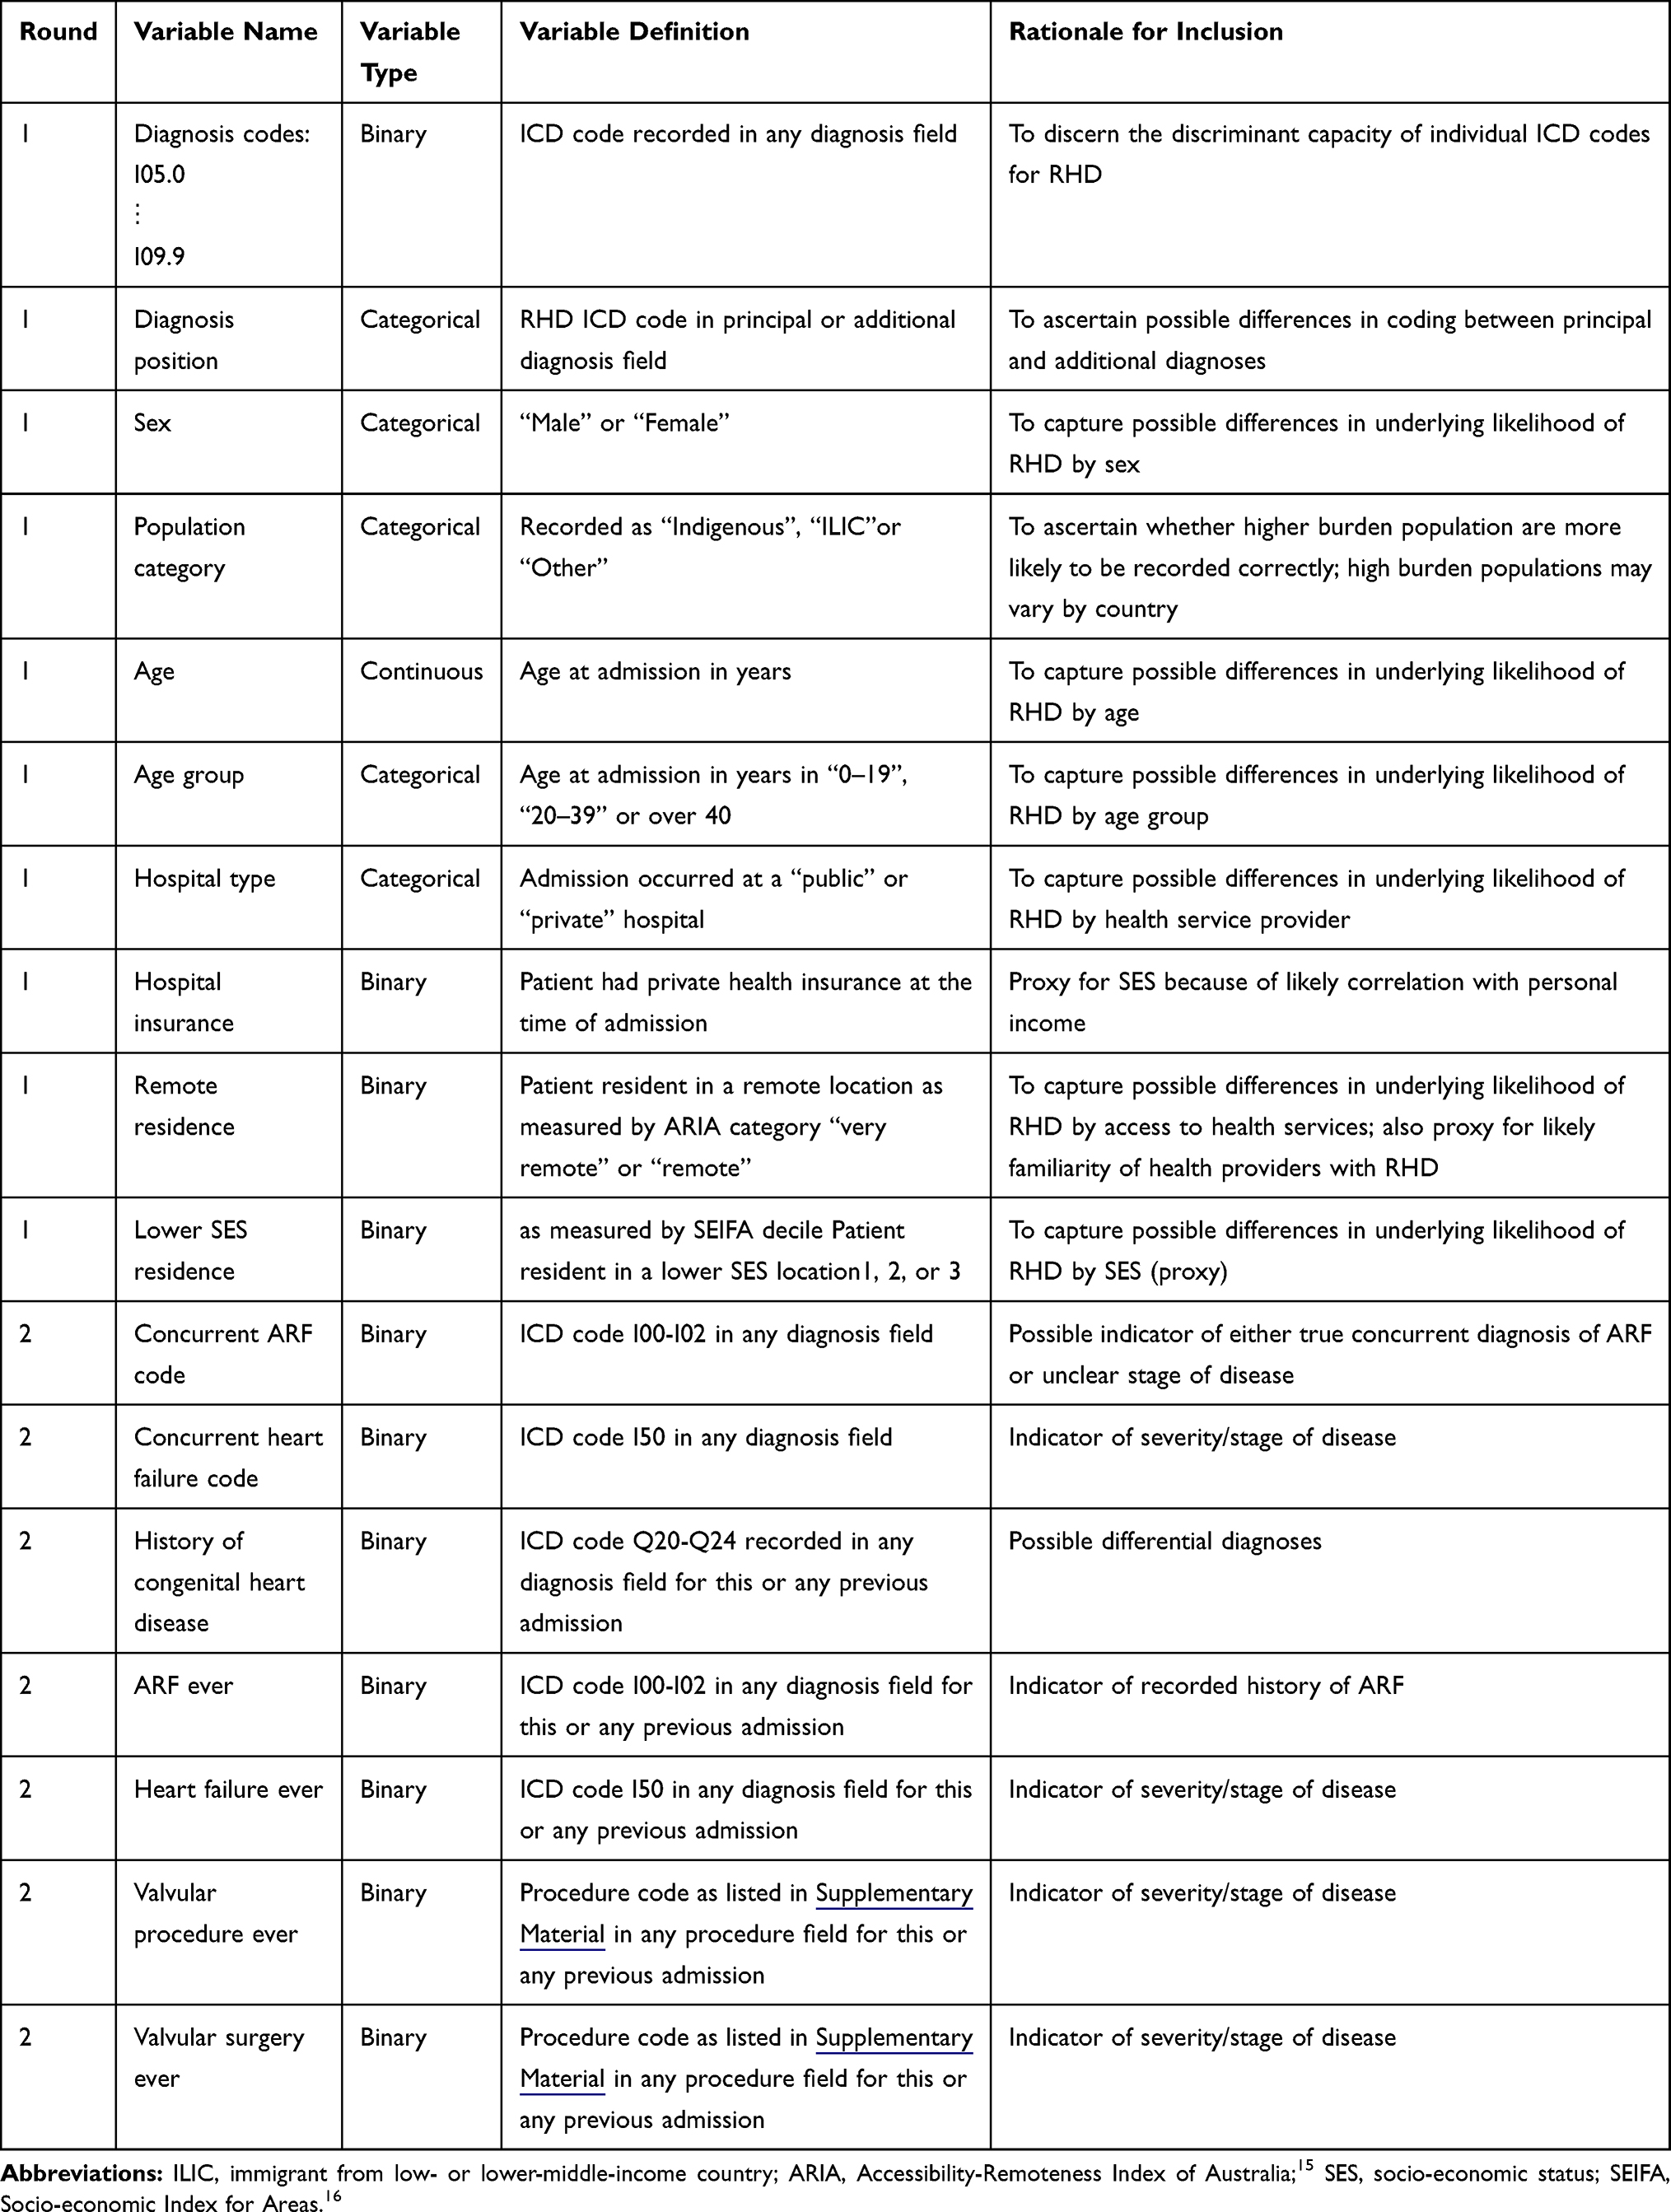 |
Table 2 Definitions of Variable Considered for Model Development |
For benchmarking purposes, we also consider two extended samples:1 includes the RHD coded and case status validated sample above plus all admissions for ARF (I00 – I02) for validated RHD cases and non-cases, and2 includes the RHD coded and case status validated sample above plus all admissions plus all admissions for non-rheumatic VHD (I34 – I37) for validated RHD cases and non-cases.
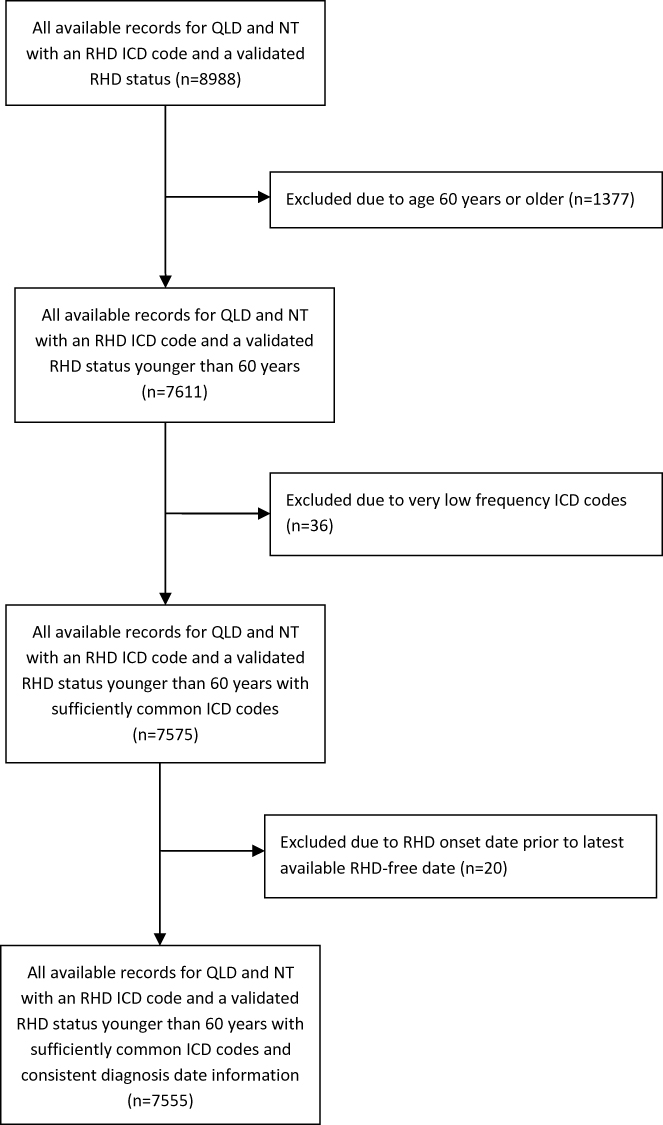 |
Figure 2 Cohort flowchart. |
Statistical Methods
A standard prediction modelling approach was implemented based on evaluating each possible candidate model using randomly selected cross-validation samples. Based on the total sample size (n=7555), k=3 was chosen for the number of cross-validation iterations (k). The area under the receiver operating curve (AUC) was used as the model selection criterion as we were primarily interested in discriminating between RHD cases and non-cases. Sensitivity, specificity, positive predictive value (PPV), negative predictive value (NPV) and Akaike’s Information Criterion (AIC) were also measured.
We used a generalized linear mixed model (GLMM) for data modelling as the data are longitudinal with a binary outcome (RHD case yes/no at time t). Automated machine learning algorithms (GLMM classification trees) were tested, but did not provide additional benefits. The unit of analysis are hospitalisations, not persons, because the intended application involves being able to predict RHD case status for hospital episode records without the need to gather previous hospitalisation records (and associated ICD codes) for a specific person, especially since previous admissions may have occurred at different facilities. Three key challenges were encountered and addressed in implementing the model. Firstly, the set of candidate variables was split into two modelling rounds to substantially reduce the number of the candidate models considered in each round and increase computational efficiency (see Table 2 and8 for further details). Variables considered were selected to balance parsimony (for computational efficiency) and pertinence to the prediction problem. For round 1, we also included all RHD ICD codes, diagnosis position, sex and population category in each candidate model. This allowed us to obtain coefficients for these variables. While modelling round 1 relied on basic diagnosis and demographic information, modelling round 2 used clinical variables based on all available historical administrative data for each person. While this longitudinal information may not be available to all future users of the prediction equation, we show in Section 3 that these variables are not critical to obtaining good predictive performance. We refrained from using interactions between variables to keep the model simple, as initial trials did not seem to warrant the added complexity.
Secondly, appropriately modelling the hierarchical nature of the data was important. Given the unspecific coding definitions for RHD, it is plausible that the specificity of RHD coding varies substantially between hospitals and over time. Accounting for this variability by including two levels of (crossed) random effects (REs), for hospital and year, is critical for improving predictive power. We tested the effect of adding an additional person-based hierarchy level to the analysis and found that it did not further improve model fit. Predicting REs is challenging because the testing dataset may not include all the REs found in the training data. We tested two approaches that marginalized the REs11,12 as well as one approach that simulated the REs13 and found similar results. We therefore used the analytical (approximate) solution proposed by Diggle et al11 in our modelling:
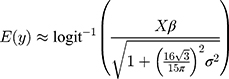
where  is the outcome variable,
  is the matrix of explanatory variable,
  is a vector of coefficients and
  is the predicted variance.
Thirdly, the available data were subject to sampling limitations with regard to the population category variable that describes people’s background as either indigenous Australian, immigrants from a low- or lower-middle-income country (ILIC) or other non-Indigenous.8 RHD cases in our data were primarily from Indigenous and ILIC populations (n=5385, 92.4%) while non-cases were primarily non-Indigenous (n=1166, 67.4%). The Indigenous/ILIC versus other non-Indigenous sub-populations are heterogeneous across many covariates, including some that could not be considered due to data not being available. This heterogeneity was relevant for our model’s performance, in particular since in initial trial runs we obtained an unsatisfactory specificity for Indigenous people. Stratification was not an attractive option for our purposes, since the dataset was not large for prediction modelling, especially given the number of variables to be considered. Instead, conditional optimal probability cutpoints were calculated, maximising the AUC separately for observations from high-risk versus low-risk populations. The large differences between optimal cutpoints found for high-risk versus low-risk groups (see Section 3) confirmed the pertinence of this approach.
Results
Table 3 provides an overview of key demographic characteristics by RHD status. Most of the RHD cases were female (72.9%), Indigenous (86.7%), between 20 and 39 years old (45.7%) and residents in remote (67.3%) and lower SES areas (67.5%). Non-cases were typically non-Indigenous (67.4%), older (55.8% over 40) and living in non-remote (79.8%) and higher SES areas (52.4%). The differences in clinical characteristics between cases and non-cases are more nuanced such that many possible risk factors for RHD are also prevalent among non-cases.
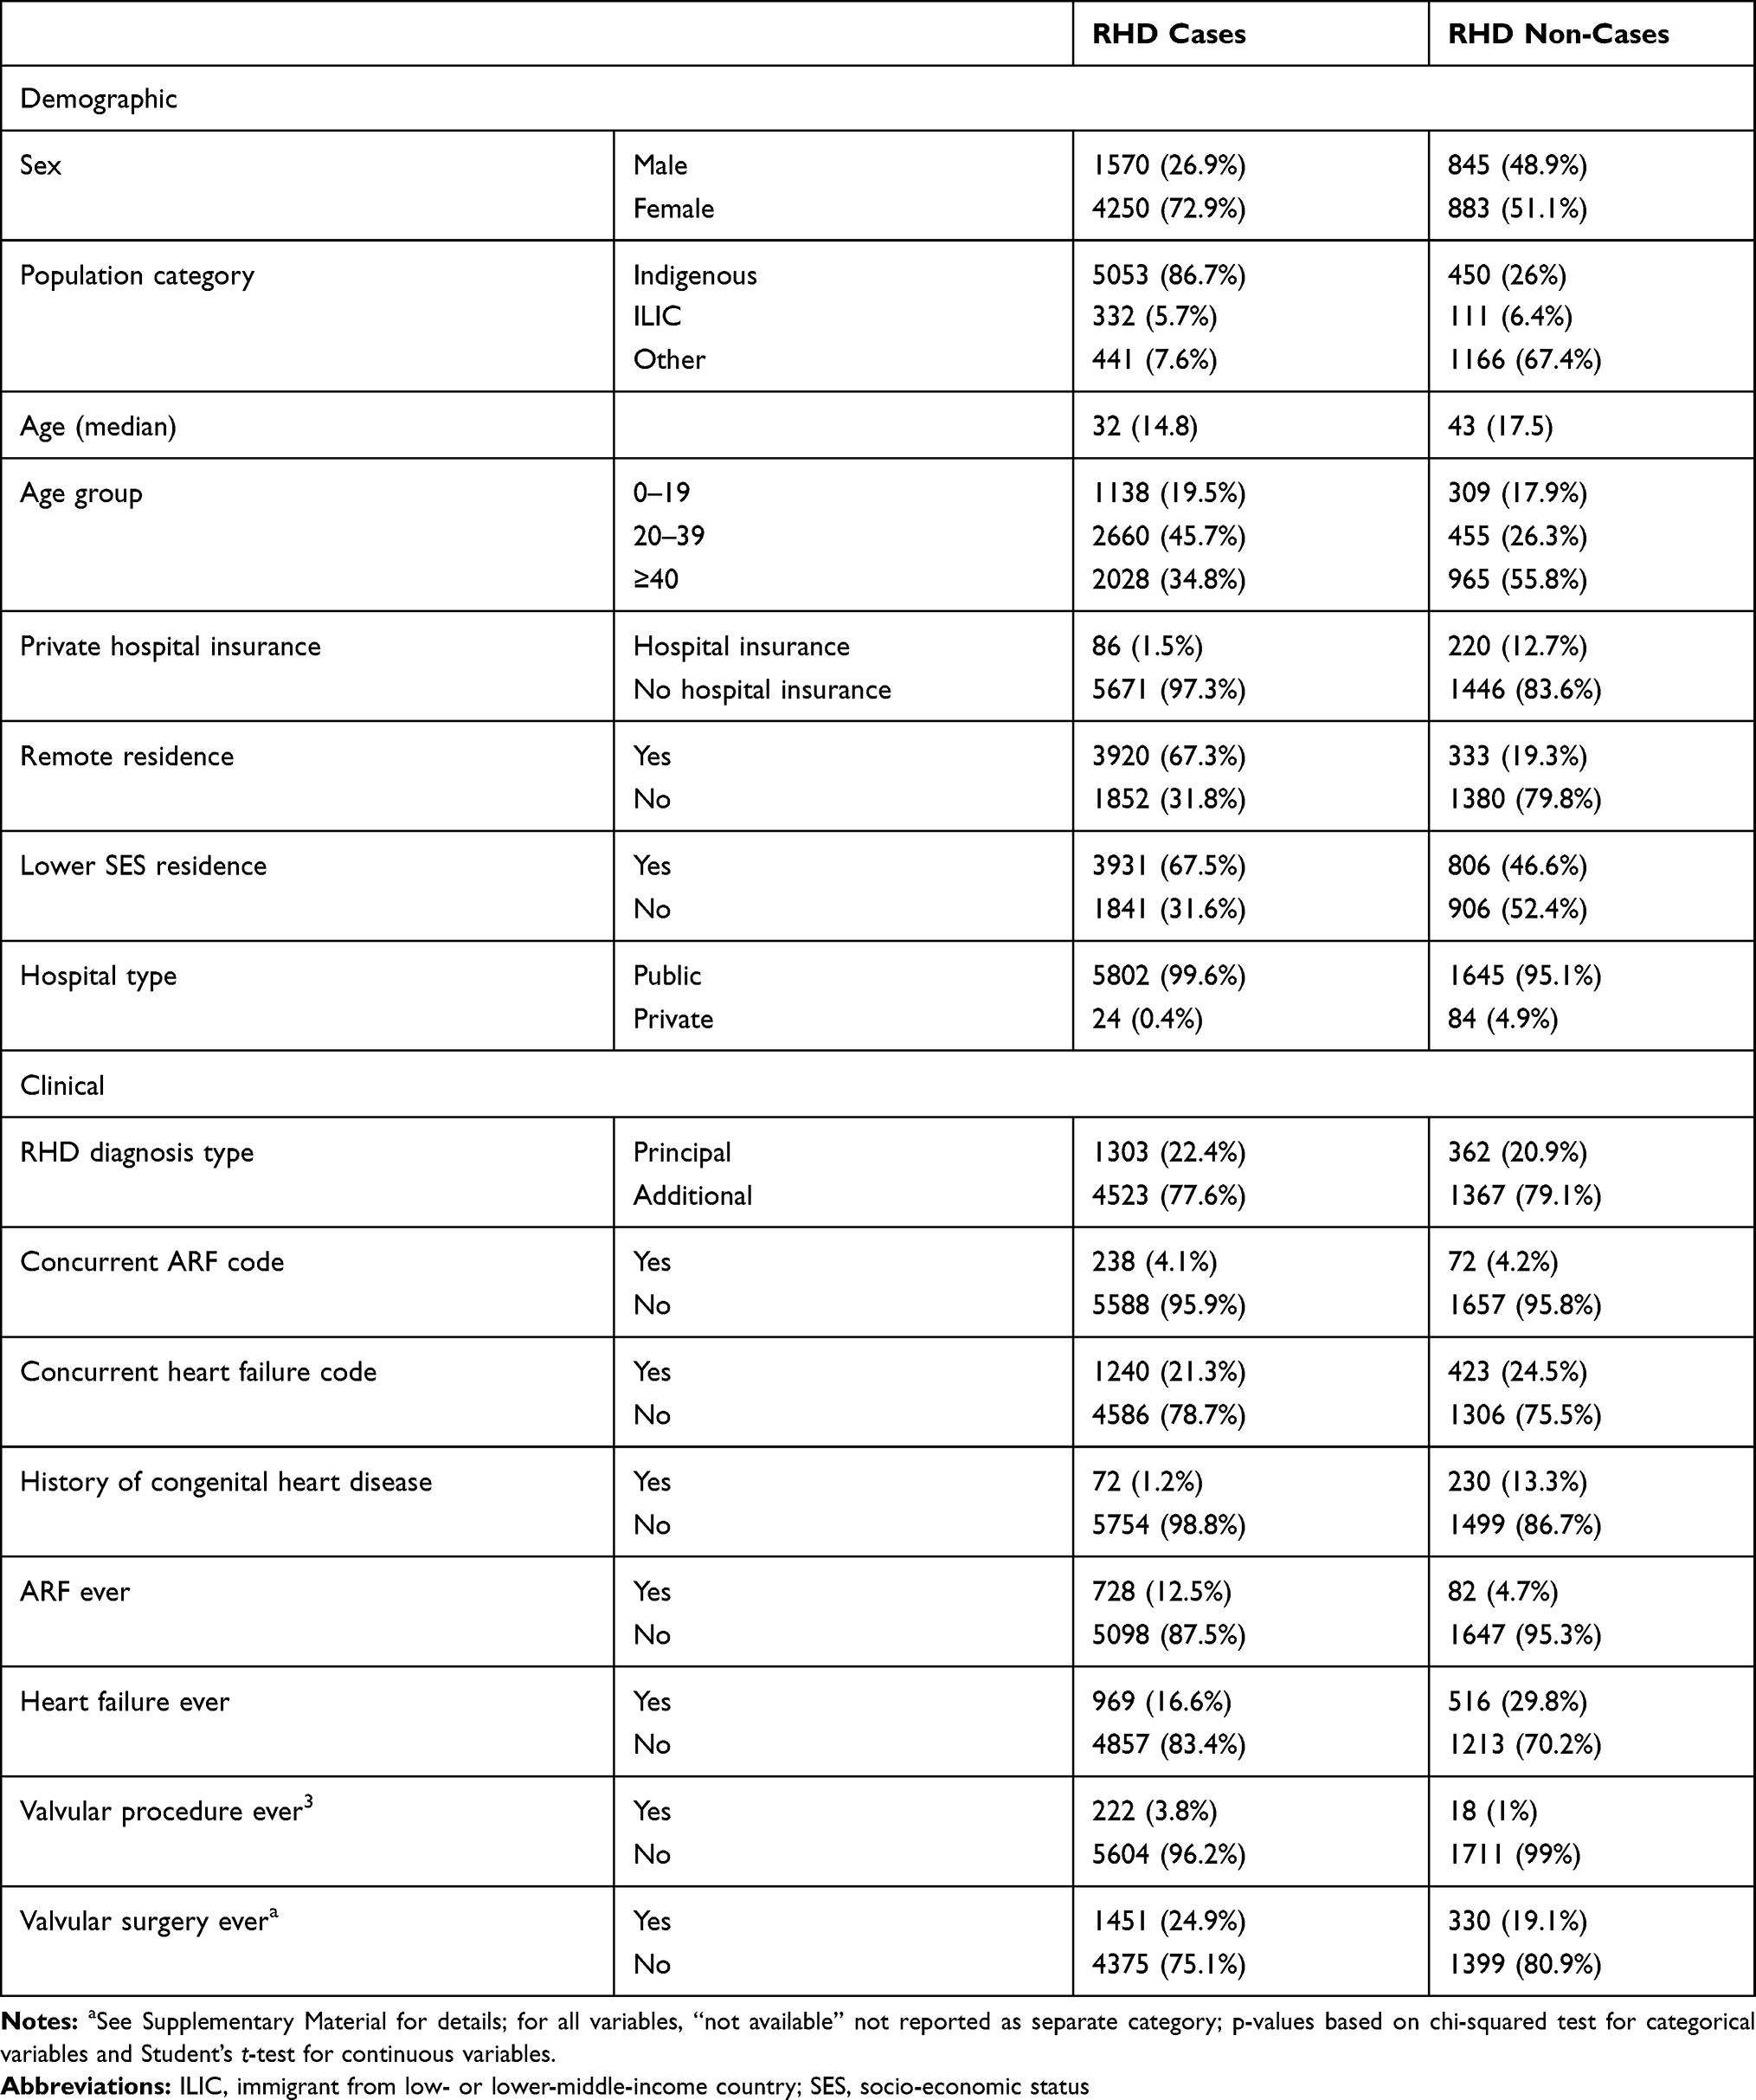 |
Table 3 Descriptive Statistics for Variables Considered for Model Development, n (%) |
Table 4 shows key performance measures for using the RHD codes deterministically for case ascertainment for the two potential sources of misclassification: ARF and non-rheumatic VHD (Supplementary Material provides breakdown by population category). Two separate samples were derived including, respectively, all RHD and ARF (ICD codes I00-I02) cases (ARF sample) and all RHD and non-rheumatic VHD (ICD codes I34-I37) cases (VHD sample). For both the ARF and VHD samples, specificity was low.
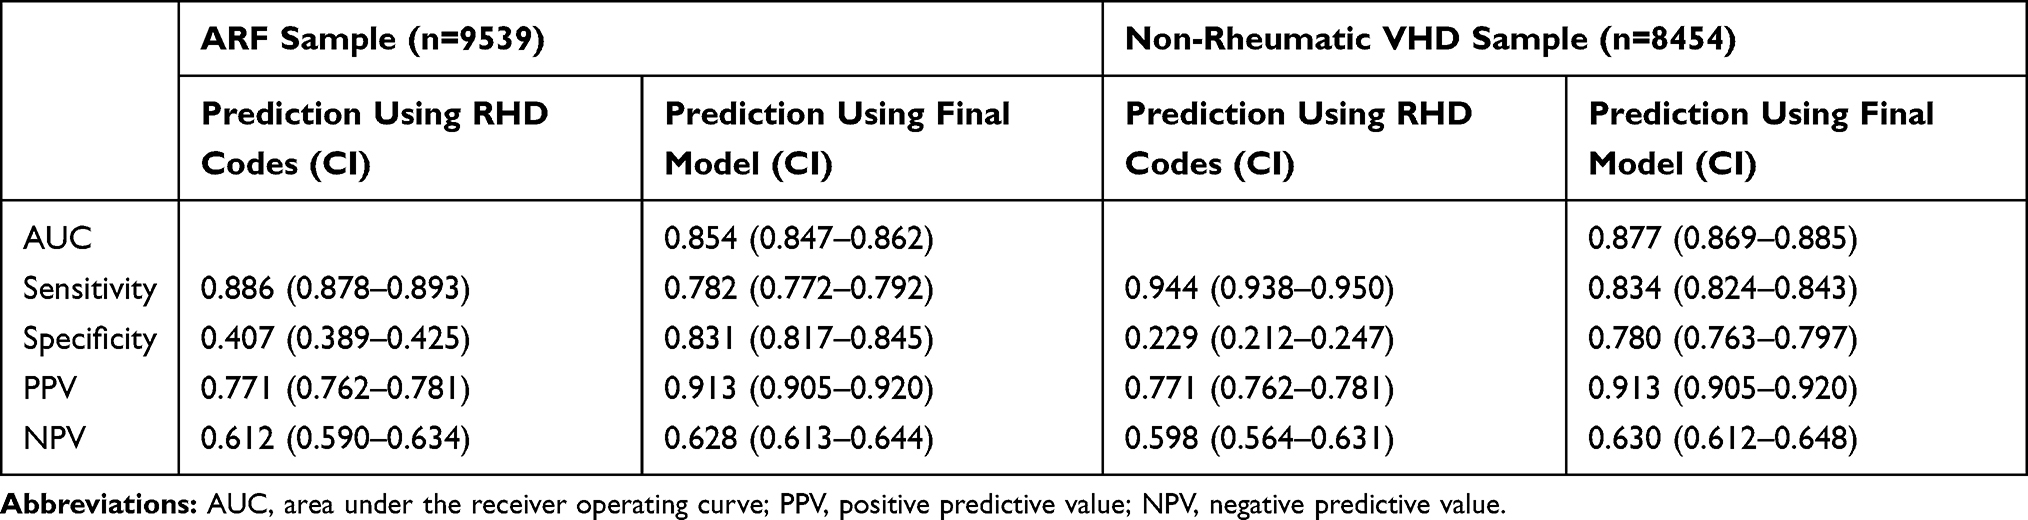 |
Table 4 Comparison of Performance Metrics for the Two Benchmark Samples, Using RHD Codes versus Final Model for Case Ascertainment |
Table 5 describes the model’s performance (RHD codes only) during cross-validation for the two modelling rounds. The statistics in Table 5 are not directly comparable to those for the two benchmark samples in Table 4 because they are based on different samples. Given the ICD codes defaulting unspecified VHD to RHD and our findings of a substantial FPR from misclassifying ARF cases as RHD (1-specificity=0.59), the model needed to achieve a good level of specificity while maintaining high sensitivity. The AUC was above 0.9 for both modelling rounds and for the entire dataset and maintained a similar robust performance during external validation. Specificity for Indigenous and ILIC populations was somewhat lower, especially for the entire dataset, but given the elevated risk profile of this cohort prioritising sensitivity seems appropriate for this subgroup. The reduction in specificity for the external validation sample was driven by the non-indigenous population and thus also less concerning.
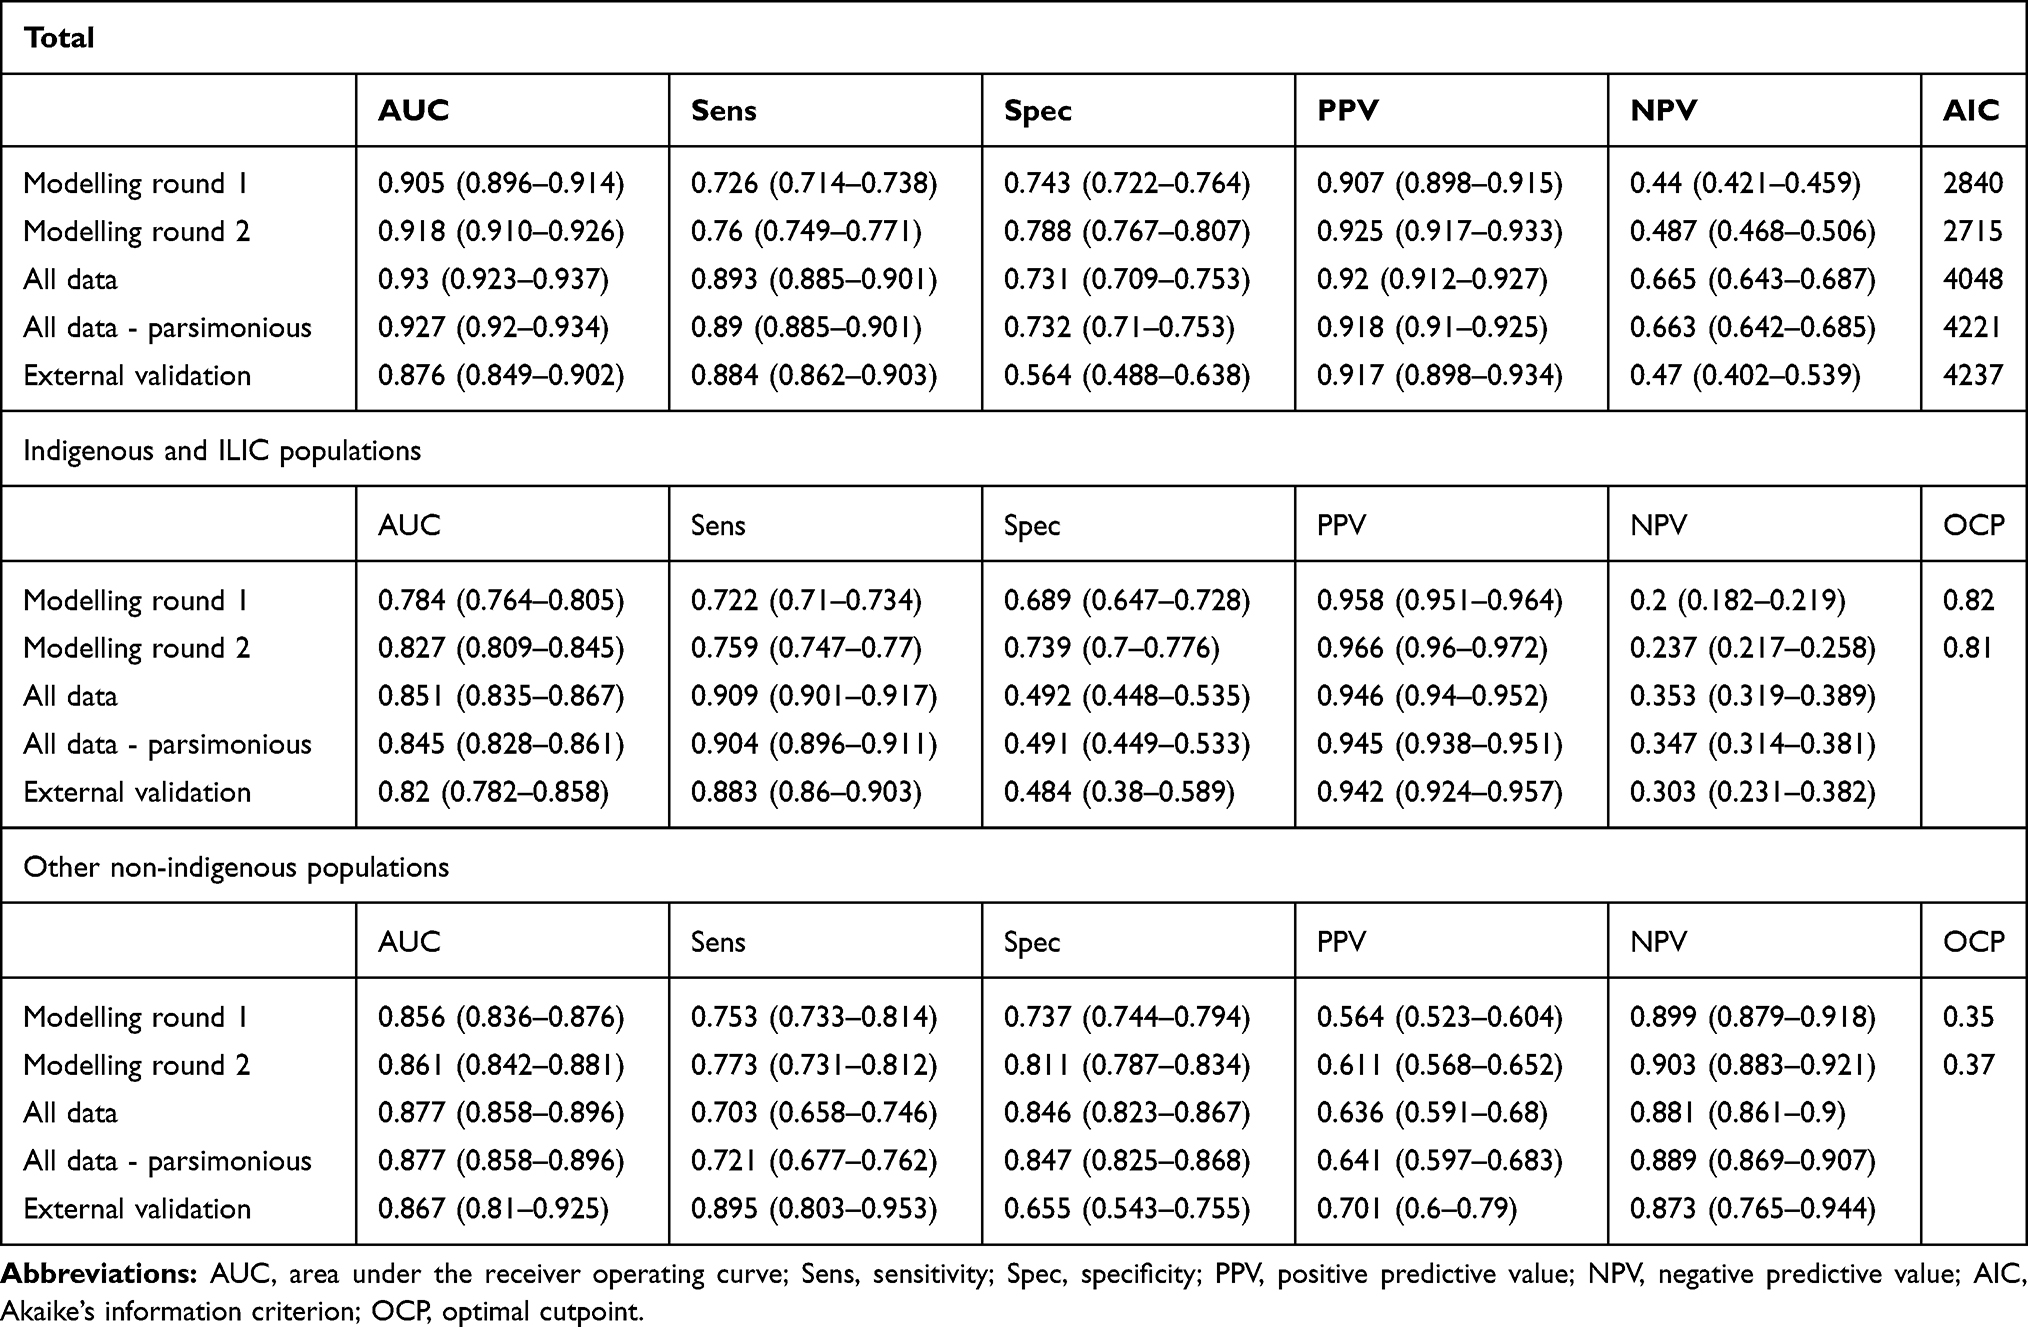 |
Table 5 Performance Metrics for RHD Codes Only Data for Cross-Validation, Using All Data and External Validation Sample, by Population Category and Total |
Adding the clinical variables in round 2 improved the results marginally (Table 5). The variables considered in round 1 were sufficient for achieving high predictive performance. The difference in the optimal cutpoints between modelling rounds was also very small. The optimal cutpoint for Indigenous/ILIC cases was greater than 0.8 whereas the cutpoint for non-Indigenous cases was below 0.4. The results were similar when the final model was applied to the entire dataset (training plus testing data). A parsimonious set of variables using only those variables with a p-value below 0.05 applied to all of the data also gives very similar results and may, while less rigorous from a modelling standpoint, be an alternative for applied purposes. Figure 3 shows these results graphically. We also tested whether there is a difference when the model is applied separately to sub-datasets before 2012 and 2013 onwards, since in 2012 the World Heart Federation issued an ultrasound-based classification of “Borderline” and “Definite” RHD (leaving a clearance period for the year 2012 for the changes to be implemented consistently).14 The model performed very similarly for the two sub-samples (see Supplementary Material).
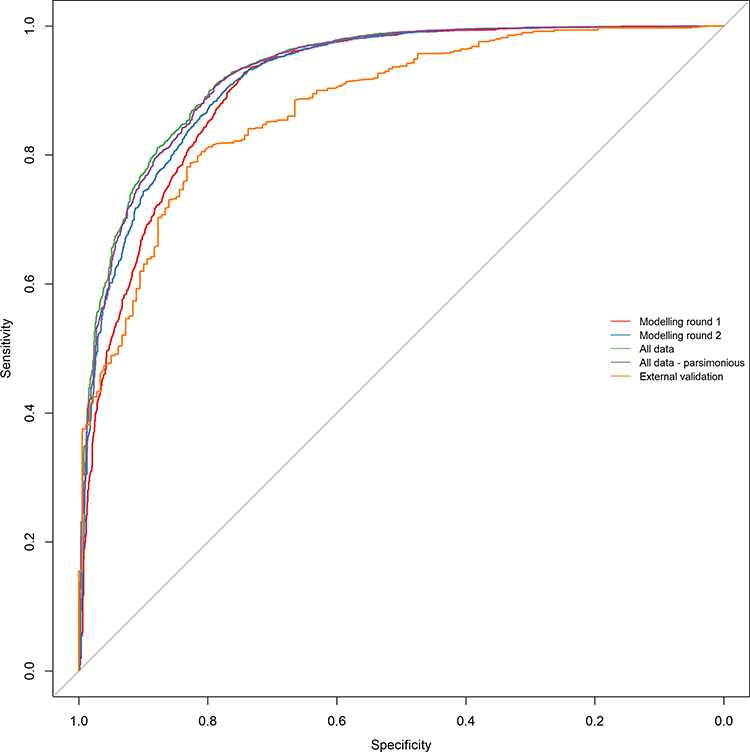 |
Figure 3 ROC curves for models based on RHD codes only data for cross-validation, using all data and external validation sample. |
Table 6 reports the estimation results for the final models using all data. The ICD codes with the largest coefficients were I062, I060 and I089. Principal diagnosis and female sex raised the predictive probability. Both Indigenous and ILIC populations were more predictive of RHD than other, non-indigenous backgrounds. Although the continuous age effect was positive, the categorical age variable showed a decrease in the probability of being a true RHD case for persons older than 40 years. A concurrent ARF code reduced the likelihood of a record belonging to a true RHD case, while there was a converse effect of history of ARF. Patients in heart failure at the time of the admission for RHD or having a history of either valvular surgeries or procedures were more likely to be true RHD cases.
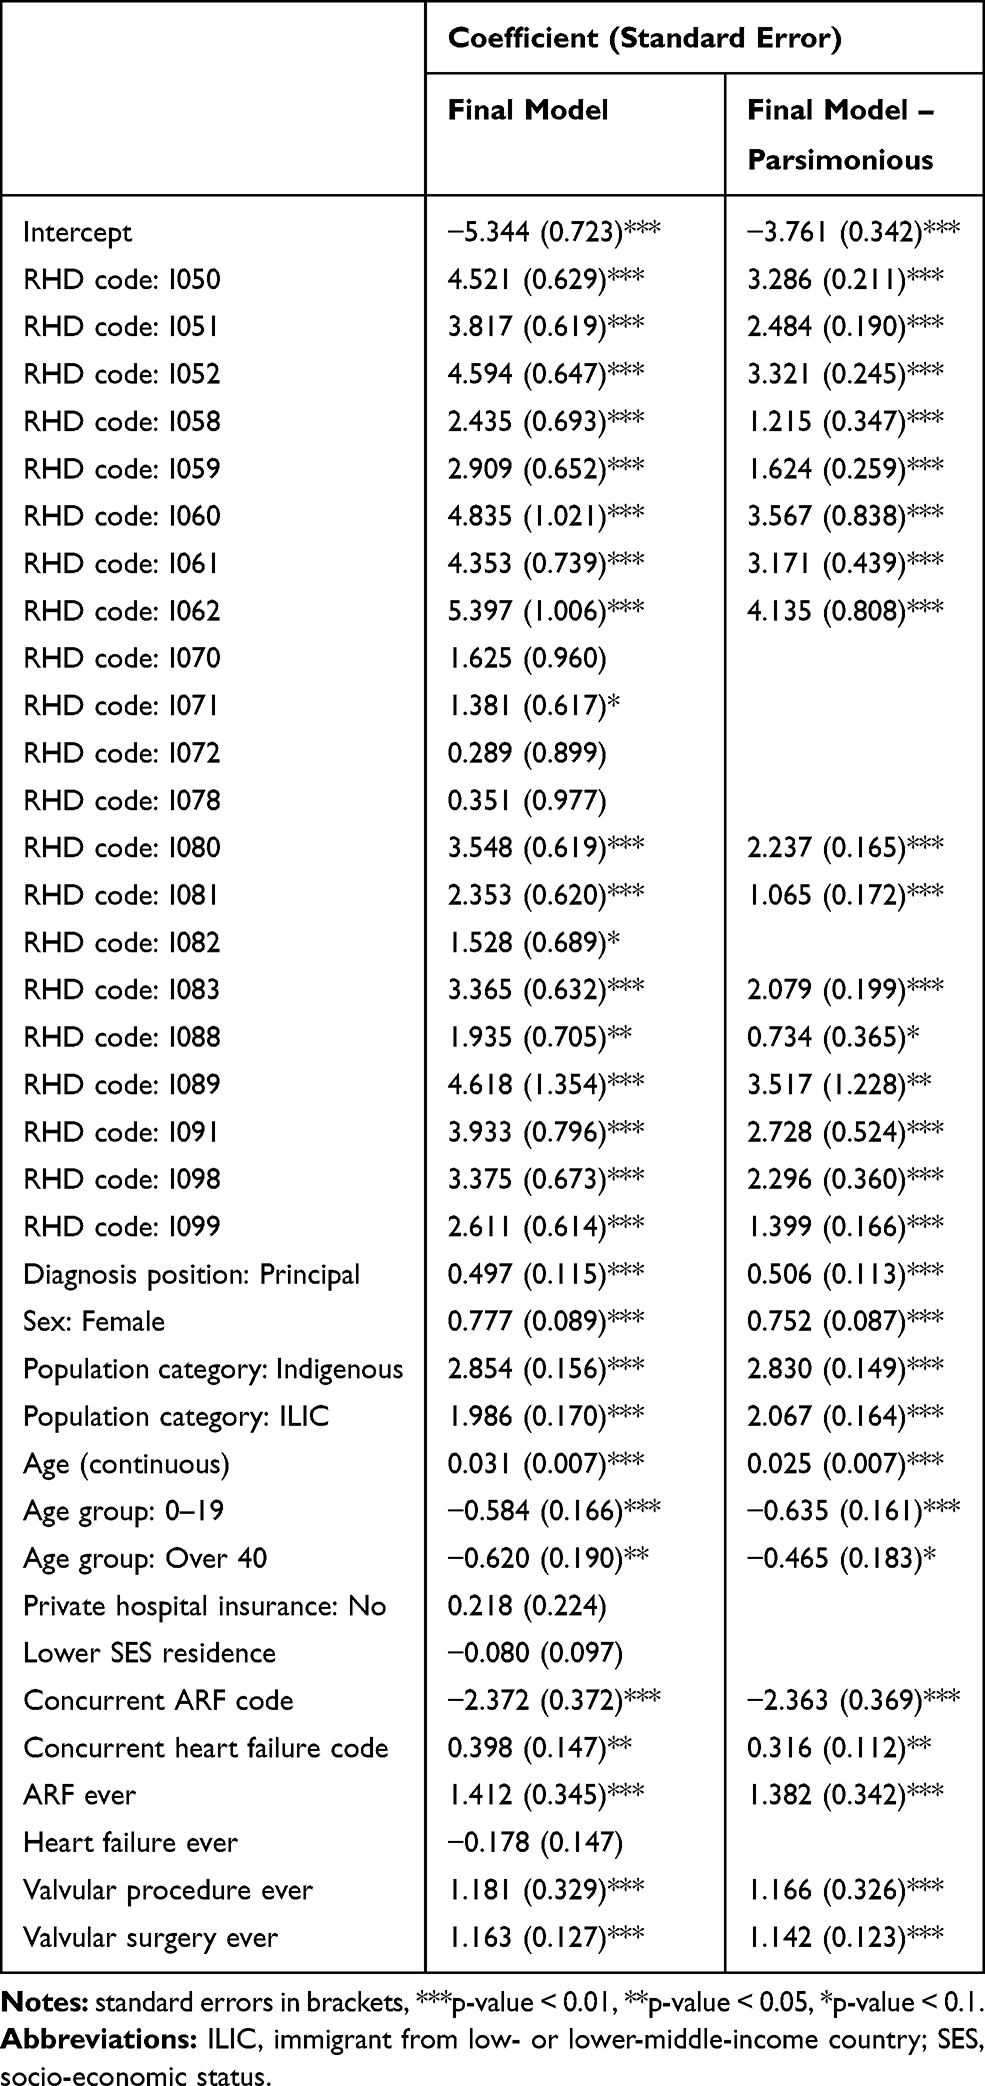 |
Table 6 Estimated Coefficients for Final Models |
Finally, the model (all data parsimonious, see Table 5) was applied to the benchmark datasets including ARF and non-rheumatic VHD coded cases (see Table 4). As desired, the model achieved a good improvement in specificity for both the ARF and VHD samples while sensitivity remained at a high level and PPV and NPV improved further.
Discussion
The ability to correctly infer diagnosis status from ICD codes is critical to epidemiological disease monitoring. The accuracy of ICD codes alone for identifying RHD is poor, although literature discussing this issue is sparse. This paper proposed a quantitative approach, developing a prediction model for RHD ICD codes using a large dataset of validated cases. We show that reliable case identification through the RHD codes is more complex than previously assumed, demonstrating that misclassification of non-rheumatic VHD and of ARF is present and affects the predictive power of the RHD codes substantially (see Table 4). The reported FPRs are important information for epidemiologists and clinicians interested in this problem. The proposed model achieved a substantial improvement in predictive power and maintains a similar robust performance during external validation. We recommend avoiding the uncritical use of the ICD codes for RHD and instead apply our prediction equation to reliably ascertain cases of RHD from hospital data. Suitable areas of application for the prediction model developed in this paper include: research, advocacy, and policy development and evaluation.
In order to use our model, Table 2 describes the definition of the variables used and the rationale for including them to help mapping our variables to data available in other countries. Table 6 provides the coefficients for calculating the predicted probabilities, along with the optimal cutpoints provided in Table 5. Given the small difference in performance, the parsimonious version of the model can be used to reduce the need for additional variables. A modification to the decision rule suggested by the model that the ERASE group has decided to make ex post is that we do not count hospital admissions with an RHD ICD code for any person with a history of congenital heart disease as RHD, even though this variable has not been selected by the prediction algorithm. We feel that the clinical evidence in favour of using ICD codes for congenital heart disease as evidence of misclassification is convincing. The authors are happy to provide assistance with applying the model. Questions should be directed to the corresponding author.
Appropriately modelling the error structure of the model using a GLMM was important. By including REs for hospital and year, we effectively adjust for, as best as we can, recording variability related to clinicians and medical coders and separate the variability from this noise in the data from the substantive predictive contribution of relevant variables such as the ICD codes.
Even though the model was developed for longitudinal linked data, modelling round 1 does not use any variables requiring such data. Since we only observe a marginal improvement when adding the more complex variables in modelling round 2, the simpler model is sufficient if only basic demographic and diagnosis information is available. While the model has been developed for ICD-10 codes, the RHD codes in the previous ICD-9 map directly to ICD-10. It is therefore plausible that the model would also perform well for older data.
Figures 4 and 5 demonstrate the practical difference that using the proposed prediction model can make for epidemiological estimates. The proposed prediction model reduces RHD prevalence by half. The magnitude of the effect strongly emphasizes the importance of avoiding uncritical use of hospital data for studying the epidemiology of RHD. The overestimation of RHD cases is greatest for areas with mixed populations of high- and low-risk backgrounds such as NSW, QLD and WA.
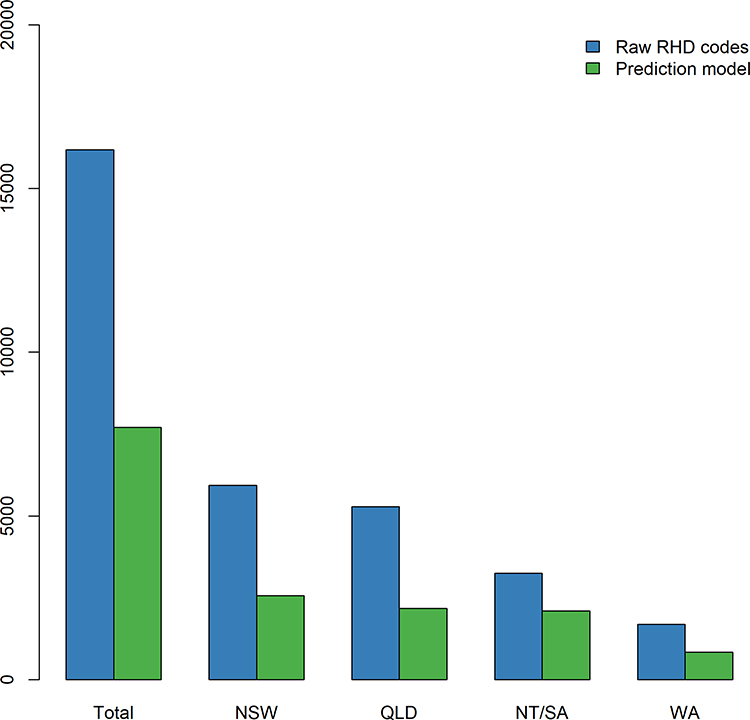 |
Figure 4 Prevalence of RHD at 30 June 2017 as predicted by RHD ICD codes and by the final model, total and by jurisdiction. |
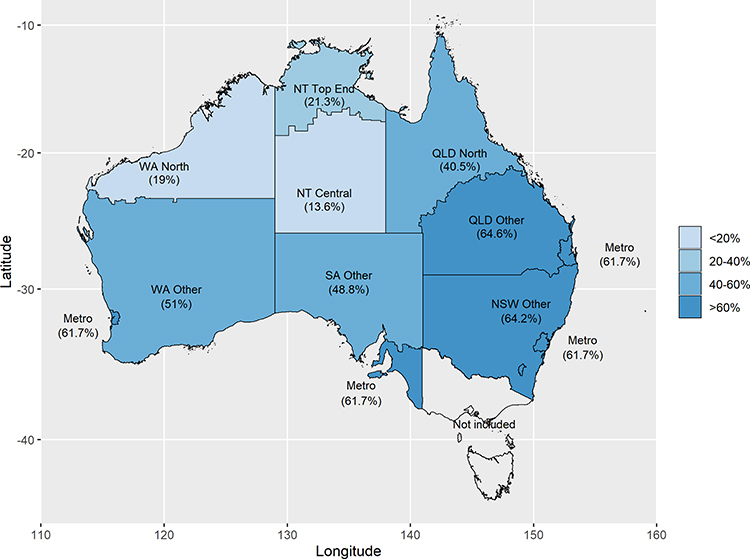 |
Figure 5 Proportional difference in predicted RHD prevalence between RHD codes and final model by region. |
The results in this paper are limited by the quality of the available data. While we took great care in assembling the dataset, especially to avoid selection bias, we are relying on retrospectively reviewed clinical records where the validation of diagnoses relies on third parties. For the non-rheumatic VHD benchmark sample, there is undercounting of test (RHD code) negatives, because linked data for patients who had only ever been recorded as non-rheumatic VHD was not available. Hence, true specificity is likely underestimated for the non-rheumatic VHD sample. However, even given this limitation, it is plausible that the true specificity for this cohort is subpar because of the explicit inclusion of unspecified VHD in some RHD ICD codes.
Since our primary purpose was to evaluate the predictive power of the ICD codes for RHD, we cannot predict RHD case status in the absence of an RHD code. This would be an interesting avenue for future research, but it may be difficult to achieve good results without detailed clinical information. We are also exploring opportunities for further external validation of our model with international data and invite interest in establishing such collaborations.
Conclusions
The ICD codes for RHD are known to provide inaccurate classification, although literature addressing this problem is sparse. We show that misclassification of RHD is more complex than previously assumed, demonstrating that not only misclassification of non-rheumatic valvular heart disease but also of acute rheumatic fever yields substantial false-positive rates. The prediction model proposed in this paper is based on a large Australian dataset of validated cases and achieves a substantial improvement in predictive power relative to using the ICD codes for RHD deterministically. The model has been externally validated, maintaining a similar robust performance. The large improvement in discrimination power using the proposed prediction model strongly emphasizes the importance of avoiding uncritical use of hospital data for studying the epidemiology of RHD.
Abbreviations
AIC, Akaike’s Information Criterion; ANZSCTS, Australian & New Zealand Society of Cardiac & Thoracic Surgeons; ARF, acute rheumatic fever; ARIA, Accessibility-Remoteness Index of Australia; AUC, area under the receiver operating curve; ERASE, End RHD in Australia: Study of Epidemiology; FPR, false-positive rate; GLMM, generalised linear mixed model; ICD, International Statistical Classification of Diseases and Related Health Problems; ICD-10-AM, International Statistical Classification of Diseases and Related Health Problems, 10th revision, Australian Modification; ILIC, Immigrant from low- or lower-middle-income country; NPV, negative predictive value; NSW, New South Wales; NT, Northern Territory; OCP, optimal cutpoint; PPV, positive predictive value; QLD, Queensland; RE, random effect; RHD, rheumatic heart disease; SA, South Australia; SEIFA, socio-economic Index for Areas; SES, socio-economic status; WA, Western Australia.
Consent for Publication
Appropriate waivers of consent have been obtained from the relevant organisations listed above.
Data Sharing Statement
The data that support the findings of this study are available from the data linkage units of the State and Territory governments (WA, SA-NT, QLD) but restrictions apply to the availability of these data, which were used under license for the current study, and so are not publicly available. Data are however available from the authors upon reasonable request (to Australian researchers only) and with permission of the Human Research Ethics Committees of the Health Departments (and for NT: Menzies School of Health Research) and Aboriginal Ethics Committees of WA, SA, NT and QLD.
Ethics Approval and Consent to Participate
Human Research Ethics Committees of the Health Departments (and for NT: Menzies School of Health Research) of WA, SA, NT and QLD provided approval for the ERASE Project. Aboriginal Ethics Committees from WA, SA and NT also approved the study, after support letters from peak bodies of the Aboriginal Community Controlled Health Services. The following committees and (Indigenous) organisations provided support: Aboriginal Medical Services Alliance Northern Territory; Top End HREC (Northern Territory), Menzies School of Health Research; Kimberley Aboriginal Medical Service, including Kimberley Aboriginal Health Planning Forum Research Sub-Committee; Western Australia Aboriginal Health Directorate; Western Australian Human Research Ethics Committee (Department of Health); Western Australian Aboriginal Health Ethics Committee; Aboriginal and Torres Strait Islander Health Branch, Queensland Health; Prince Charles Hospital Human Ethics Committee; Aboriginal Health Council of South Australia; South Australia Department of Health and Ageing HREC; South Australian Aboriginal Health Research Ethics Committee. Appropriate waivers of consent have been obtained from the relevant organisations listed above.
Acknowledgments
We acknowledge the insights provided by Professor Matthew Knuiman and other participants at the University of Western Australia Cardiovascular Methods Forum and the Australasian Epidemiological Association Annual Scientific Meeting 2018 on earlier versions of this analysis. We further acknowledge that figures and other statistics represent the loss of health and human life with profound impact and sadness for people, families, community and culture. We hope that the ‘numbers story’ emanating from this project can augment the ‘lived stories’ that reflect the voices of people with RHD and their families, thus jointly contributing to evidence to erase suffering from ARF and RHD in Australia and elsewhere.
The authors also wish to thank the staff of the data linkage units of the State and Territory governments (WA, SA-NT, NSW, QLD) for the linkage of the data. We thank the State and Territory Registries of Births, Deaths and Marriages, the State and Territory Coroners, and the National Coronial Information System for enabling Cause of Death Unit Record File data to be used for this project.
Further, we thank the data custodians and data managers for the provision of the following data:
- Inpatient hospital data (5 States and Territories)
- Emergency Department data (5 States and Territories)
- RHD registers (5 States and Territories)
- ANZ Society of Cardiac & Thoracic Surgeons database (single data source from 5 States and Territories)
- Royal Melbourne Children’s Hospital Paediatric Cardiac Surgery database (single data source for RHD paediatric patients from SA and NT receiving surgery in Melbourne)
- Primary health care data from NT Department of Health
Author Contributions
All authors contributed to data analysis, drafting or revising the article, gave final approval of the version to be published, and agree to be accountable for all aspects of the work.
Disclosure
Dr Judith M Katzenellenbogen reports grants from National Health and Medical Research Council, during the conduct of the study. The authors declare that they have no other competing interests.
References
1. World Health Organization. Seventy-First World Health Assembly A71/25. Resolution Adopted on 25 May 2018 for Provisional Agenda 12.8 By Director General on 12 April 2018. Geneva: World Health Organization; 2018.
2. Watkins DA, Johnson CO, Colquhoun SM, et al. Global, regional and national burden of rheumatic heart disease, 1990–2015. N Engl J Med. 2017;377(8):713–722. doi:10.1056/NEJMoa1603693
3. Carapetis JR, Beaton A, Cunningham MW, et al. Acute rheumatic fever and rheumatic heart disease. Nat Rev Dis Primers. 2016;2(1):15084. doi:10.1038/nrdp.2015.84
4. Carapetis JR, Steer AC, Mulholland EK, Weber M. The global burden of group A streptococcal diseases. Lancet Infect Dis. 2005;5(11):685–694. doi:10.1016/S1473-3099(05)70267-X
5. World Health Organization. International Statistical Classification of Diseases and Health Related Problems, Tenth Revision.
6. Katzenellenbogen JM, Nedkoff L, Canon J, et al. Low positive predictive value of ICD-10 codes in relation to rheumatic heart disease: a challenge for global surveillance. Int Med J. 2019;49(3):400–403. doi:10.1111/imj.14221
7. Murdoch J, Davis S, Forrester J, Masuda L, Reeve C. Acute rheumatic fever and rheumatic heart disease in the kimberley: using hospitalisation data to find cases and describe trends. Aust N Z J Public Health. 2015;39(1):38–43. doi:10.1111/1753-6405.12240
8. Katzenellenbogen JM, Bond-Smith D, Cunneen R, et al. The End Rheumatic Heart Disease in Australia Study of Epidemiology (ERASE) project: data sources, case ascertainment and cohort profile. Clin Epidemiol. 2019;11:997.
9. Fitz-Gerald JA, Ng A, Ongzalima CO, et al.editors. International Classification of Diseases (ICD) coding for rheumatic heart disease: a validation study.
10. Australian and New Zealand Society of Cardiac and Thoracic Surgeons (ANZSCTS). National cardiac surgery database melbourne: CCRE, Monash University; 2010. Available from: https://anzscts.org/national-database/.
11. Diggle PHP, Liang K‐Y, Zeger S. Analysis of Longitudinal Data.
12. Searle SR, McCulloch CE. Generalized, Linear, and Mixed Models. John Wiley & Sons, Inc.; 2001.
13. Colby E, Bair E. Cross-validation for nonlinear mixed effects models. J Pharmacokinet Pharmacodyn. 2013;40(2):243–252. doi:10.1007/s10928-013-9313-5
14. Reményi B, Wilson N, Steer A, et al. World heart federation criteria for echocardiographic diagnosis of rheumatic heart disease–an evidence-based guideline. Nat Rev Cardiol. 2012;9(5):297–309. doi:10.1038/nrcardio.2012.7
15. Australia Bureau of Statistics. Australian Statistical Geography Standard (ASGS): Volume 5 - Remoteness Structure, July 2016. Canberra; 2018.
16. Adhikari P. Socio-economic indexes for areas: introduction, use and future directions. Australian Bureau of Statistics Research Paper 1351.0.55.015. Canberra;2006.
 © 2020 The Author(s). This work is published and licensed by Dove Medical Press Limited. The
full terms of this license are available at https://www.dovepress.com/terms
and incorporate the Creative Commons Attribution
- Non Commercial (unported, 3.0) License.
By accessing the work you hereby accept the Terms. Non-commercial uses of the work are permitted
without any further permission from Dove Medical Press Limited, provided the work is properly
attributed. For permission for commercial use of this work, please see paragraphs 4.2 and 5 of our Terms.
© 2020 The Author(s). This work is published and licensed by Dove Medical Press Limited. The
full terms of this license are available at https://www.dovepress.com/terms
and incorporate the Creative Commons Attribution
- Non Commercial (unported, 3.0) License.
By accessing the work you hereby accept the Terms. Non-commercial uses of the work are permitted
without any further permission from Dove Medical Press Limited, provided the work is properly
attributed. For permission for commercial use of this work, please see paragraphs 4.2 and 5 of our Terms.