Back to Journals » Neuropsychiatric Disease and Treatment » Volume 10
Determining a diagnostic cut-off on the Teate Depression Inventory
Received 21 October 2013
Accepted for publication 12 December 2013
Published 3 June 2014 Volume 2014:10 Pages 987—995
DOI https://doi.org/10.2147/NDT.S55706
Checked for plagiarism Yes
Review by Single anonymous peer review
Peer reviewer comments 2
Michela Balsamo, Aristide Saggino
Department of Psychological Sciences, Humanities and Territory, G. d’Annunzio University of Chieti-Pescara, Chieti, Italy
Abstract: A small but growing body of literature suggests that the Teate Depression Inventory (TDI) may be an “objective” measure of depression compared with other commonly used scales. Furthermore, the TDI has strong psychometric properties in both clinical and nonclinical samples. The present study aimed to extend the use of TDI by identifying cut-off scores that could differentiate varying levels of depression severity in a group of clinically diagnosed depression disorder patients (N=125). Three receiver operating characteristic curve analyses indicated cut-off scores of 21 (sensitivity =0.86, specificity =0.94, and classification accuracy =0.90); 36 (sensitivity =0.84, specificity =0.96, and classification accuracy =0.92); and 50 (sensitivity =0.81, specificity =0.93, and classification accuracy =0.90), for minimal, mild, moderate, and severe depression, respectively. Results suggest that the TDI measures depression severity across a broad range with high test accuracy and may be appropriately used to screen for depression.
Keywords: major depression, ROC curve, self-report scales, Rasch analysis, depression screening
Introduction
Depression is a prevalent mental health issue around the world and it is responsible for a wide range of problems in many aspects of a person’s functioning. Therefore, it is critical to screen depressive symptoms in both clinical and nonclinical populations. While depression is commonly measured on a dimensional basis, many research and clinical decisions are based on categorical classifications1 (eg, whom to include in which group; and whom to treat and with what intervention). Widiger and Samuel state that “clinical decisions are categorical”.2 Because of the general necessity of categorical decisions, the identification of cut-off scores differentiating probable cases from probable non-cases is often advantageous. However, different opinions about dimensional and categorical assessments have kindled a long-lasting scientific debate, with some authors arguing that dimensional assessment more precisely reflects the nature of mental disorders.2,3 Other authors suggest that it is not so much a matter of an “either-or” approach, but more a question of when it is appropriate to rely on categorical versus (vs) dimensional assessments.4,5 While there is no single test that can define mental disorders (a situation also known as the “cut-off point dilemma”),6 there is no doubt about the pragmatic clinical utility of cut-off scores on scales that measure mental disorders.5–8 Researchers are frequently required to decide who to include in patient and control samples in empirical studies, similar to clinicians who must formulate decisions about whom to treat and which treatment to provide.6 The either-or debate precludes the consideration of utilizing both categorical and dimensional assessments, resulting in the primary decision being which type of assessment to use first.5,6,8,9 Furthermore, cut-off scores are not optimal for instruments constructed applying Rasch measurement models,10 because they were developed using traditional scoring methods. In both clinical and research settings, cut-off scores that identify cases of clinical depression and depression severity levels can be of great utility in the quick identification of patients with a high likelihood of a Diagnostic and Statistical Manual of Mental Disorders 4th Edition Text Revision (DSM-IV-TR)11 condition. However, it would be difficult to convince users to switch to an assessment scale that does not appear to be as clinically informative. Still, clinicians who attempt to identify syndromal depression in primary care continue to have considerable difficulty, with only one in three people correctly diagnosed,12 and clinicians’ ability to recognize mild depression is significantly lower than their ability to recognize moderate–severe depression.13
Although understanding of depression has increased dramatically in recent years with the development of cognitive theories of emotional disorders,14–16 the most commonly used assessment scales are approximately 25 years old. Developed according to the classical test theory, several established measures have shown some psychometric limitations, many of which are due to theoretical assumptions.17,18 To address most of their flaws, a new Rasch-based self-report instrument for depression, the Teate Depression Inventory (TDI),19 was recently developed. Its development process has been illustrated previously.18 Emerging evidence suggests that the TDI is a more accurate measure of depression than other commonly used tools. Recently, the TDI was administered to large clinical and nonclinical samples in three studies (Balsamo et al, unpublished data, 2014).20,21 In the first study, internal consistency was found to be high (Cronbach’s alpha =0.92) in a sample of 857 young adults. In addition, significant correlations with the subfactor of high standards/self-criticism (r =0.26, P<0.01) in the Attitudes toward Self-Revised, and only moderate correlation with the Beck Depression Inventory II (BDI-II) (r =0.65, P<0.01), probably due to the lack of unidimensionality for the latter,22–27 were found.20 In the second study, Cronbach’s alphas were 0.94 and 0.92 (P<0.01) for the clinical (1,124 psychiatric outpatients) and nonclinical (877 healthy subjects) samples, respectively.21 Correlation with the BDI-II was 0.73 (P<0.01) in both samples. Correlation with the Beck Anxiety Inventory28 was 0.46 (P<0.01) in a clinical subsample of 102 outpatients, and 0.54 (P<0.01) in a nonclinical subsample composed of 151 subjects.21
In the third study, the TDI was administered to a sample of 396 middle-aged (50–64 years of age) and older (≥65 years of age) adults, recruited from the general population (Balsamo et al, unpublished data, 2014). Cronbach’s alpha was found to be 0.88. Significant correlation (r =0.56, P<0.01) with the Geriatric Depression Scale (GDS),29 a questionnaire designed to measure depression in a geriatric population, was found (Balsamo et al, unpublished data, 2014). Correlations between the TDI and the anxiety trait, as measured by the Trait Scale of the State–Trait Inventory for Cognitive and Somatic Anxiety (STICSA),30 and between the TDI and the anxiety state, as measured by the State Scale of the STICSA, were 0.51 and 0.49, respectively (probability [ps]<0.01). These correlations were weaker than those between the GDS and the STICSA scales (r =0.63 and r =0.57, respectively; ps<0.01), showing the better discriminant validity of the TDI over the GDS. Negative and significant correlations were found with both the scales of the Short-Form-12 Health Survey (SF-12),31 the Physical Composite Score (r =-0.39; P<0.01) and the Mental Composite Score (r =-0.54; P<0.01), which assesses health-related quality of life for both physical and mental health dimensions (Balsamo et al, unpublished data, 2014).
Purpose of the study
The current study aimed to determine a cut-off score for the TDI that could differentiate between varying levels of depression in a group of clinically diagnosed individuals with depression disorders. The identification of a cut-off score that is indicative of a probable case of clinical depression can be used as a guide in the making of important decisions with regards to the treatment and study of depression. We expected that this self-report measure would provide sensitive and specific cut-off scores, reliably distinguishing between varying severities of depression.
Methods
Participants
Participants were 125 psychiatric outpatients with a current DSM-IV-TR diagnosis, of whom 89 were females (71.2%) and 71 were males (28.8%). The average age was 42.71 years (standard deviation [SD] =15.26; age range 18–79). The mean for years of education was 11.43 (SD =4.12; range 1–22 years). Sociodemographic characteristics of the participants are listed in Table 1.
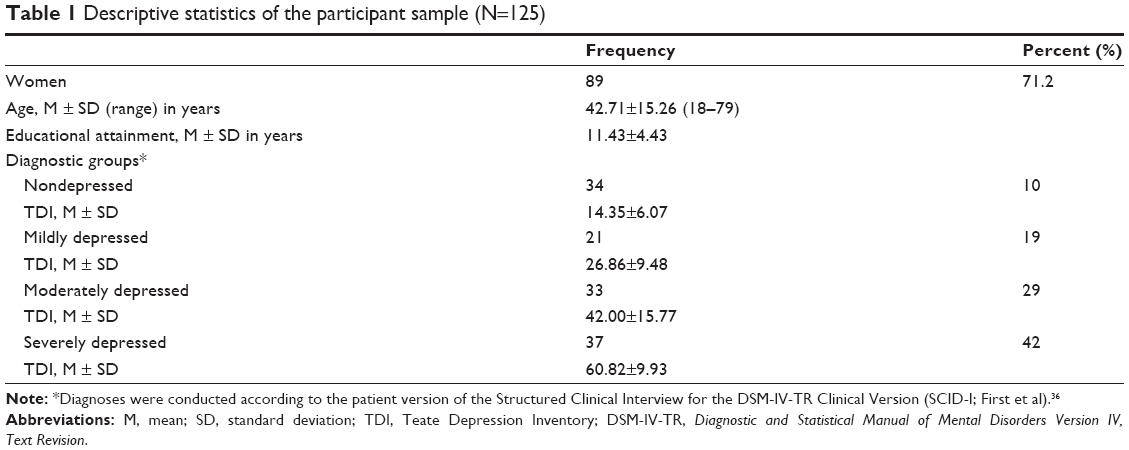 | Table 1 Descriptive statistics of the participant sample (N=125) |
Inclusion criteria were 1) a current principal Axis I diagnosis according to the DSM-IV-TR diagnostic criteria;11 and 2) a minimum age of 18 years, or older. Exclusion criteria included the presence of any condition affecting the ability to take the self-report assessment, such as 1) severe medical diagnoses; 2) any major disorder of the central nervous system; 3) current florid psychotic symptoms; and 4) refusal to give informed consent.
Of the 125 patients, 91 were diagnosed with single episode or recurrent major depression, including DSM-IV-TR specifiers (mild, moderate, or severe depression). Specifically, 21 patients were classified as mildly depressed, 33 as moderately depressed, and 37 as severely depressed (Table 1). The remaining 34 patients were classified as nondepressed based on the absence of diagnostic criteria, such as 1) any major affective disorder; 2) depressive disorder, not otherwise specified; 3) dysthymic disorder; and 4) adjustment disorder with depressed mood or mixed emotional features. These patients fulfilled the DSM-IV-TR diagnoses of anxiety disorders (N=11); dissociative disorders (N=10); eating disorders (N=6); somatoform disorders (N=3); impulse control disorder (N=2); conversion disorder (N=1); and algic disorder (N=1).
Of the 125 patients, 7.2% (N=9) were free from pharmacological and/or psychotherapeutic treatment, 29.6% (N=37) received psychotherapeutic treatment, 41.6% (N=52) received pharmacological treatment, and 21.6% (N=27) received both pharmacological and psychotherapeutic treatment. Patients were recruited through private psychotherapeutic institutions (N=53; 42.4%) and public psychiatric departments (N=72; 57.6%). They were outpatients (N=117; 93.6%), and hospitalized patients (N=8; 6.4%). Their occupations included housewives (N=32; 25.6%), pensioners (N=4; 3.2%), workers (N=39; 31.2%), self-employees (N=9; 7.2%), managers (N=14; 11.2%), unemployed (N=15; 12%), and students (N=12; 9.6%). Study participants were recruited between November 2007 and May 2008. They completed the TDI and a diagnostic structured clinical interview for DSM-IV-TR Axis I disorders (SCID-1),32 conducted by psychiatrists, as a part of the standard intake assessment in the psychiatric institutions. Each test session began with the SCID-I.32 Thereafter, the administrator presented and explained the TDI and a demographic data sheet. All participants contributed voluntarily and anonymously. No honorarium was given for completing the assessments, which the participants provided written and informed consent for. The study was approved by the local Institutional Review Board.
Measures
The TDI
The TDI is a new 21-item self-report instrument designed to assess major depression as specified by the latest editions of the DSM, editions IV-TR and V.11,33 The TDI was developed using Rasch analysis, in order to overcome psychometric weaknesses of existing depression measures. Each item of the TDI is rated on a 5-point Likert-type scale ranging from 0 (always) to 4 (never). The total score ranges from 0–84, with higher scores indicating more severe depressive symptoms. In a study of test development,34 the fit between raw data and the Rasch model was satisfactory; therefore, the TDI represents an “objective” measure of depression. Other psychometric properties, found in the clinical and nonclinical samples, included 1) excellent Person Separation Index (=0.95), which is the proportion of observed variance that is considered true; 2) no evidence of sex bias due to item–trait interaction (even when items are administered to respondents belonging to different sexes, they will continue to measure the same ability, or, in this case, severity of depression [invariance]); and 3) control of major response sets, such as acquiescence and social desirability. A recently developed, small but growing body of literature shows that TDI demonstrates greater discriminant validity than the BDI-II34 as well as having an excellent internal consistency and convergent validity (Balsamo et al, unpublished data, 2014).20,21 In the present sample, Cronbach’s alpha was 0.97.
The SCID-I
The SCID-I is a semi-structured diagnostic interview designed to assess the DSM-IV-TR diagnostic criteria for Axis I disorders.11,32,36 Several studies have shown its superior validity over standard clinical interviews at intake episodes.37–39 The SCID-I begins with an overview of the patient’s presenting complaints and history. Then, the interviewer proceeds through several required diagnostic modules until the interview is complete. The SCID-I incorporates a categorical system for the rating of symptomatology and diagnostic criteria, and algorithms that guide the interviewer through the diagnostic process. When the interview is completed, lifetime and current Axis I diagnoses are recorded on a summary score sheet.
Statistical analysis
The following procedures were employed for the purpose of developing a set of cut-off scores for the assessment of depression severity among patients with a major depressive disorder. First, according to clinical diagnoses based on the administration of the outpatient version of the SCID-I, sample patients were classified into four groups: 1) mildly depressed, 2) moderately depressed, 3) severely depressed, and 4) nondepressed. Next, optimal cut-off scores for the TDI were developed through the use of receiver operating characteristic (ROC) curves.40 Hence, the following three ROC curves were constructed: 1) the nondepressed group vs the mildly depressed group; 2) the nondepressed and mildly depressed groups vs the moderately depressed group; and 3) the nondepressed, mildly depressed, and moderately depressed groups vs the severely depressed group.
ROC curve analysis displays the relation between the sensitivity (true positives) and the inverse of the specificity (true negatives) at each value along a dimensional screening scale as it pertains to differentiating two groups of interest (eg, nondepressed groups vs mildly depressed groups).
A ROC curve is a two-dimensional depiction of test performance. The curve results from matching each point along the total scale score in terms of that score’s sensitivity and the inverse of its specificity with regards to the two groups being examined. For each ROC curve generated in this study, the percentage of true positives (or “hits”) was plotted against the percentage of false positives (or “false alarms”), according to successive TDI cut-off scores.
The main outcome variable is the area under the ROC curve, abbreviated AUC.41,42 The AUC is interpreted as the probability that a randomly sampled respondent will be correctly assigned to the appropriate group.42 Thus, the AUC directly represents the overall accuracy of the instrument in screening for depression. Since the AUC is a portion of the area of the unit square, its value will always be between zero and one. An AUC of 0.5 indicates random performance; one denotes perfect performance. Specifically, values of 0.9–1 indicate excellent predictive accuracy, values 0.8–0.9 good accuracy, values 0.7–0.8 fair accuracy, values 0.6–0.7 poor accuracy, and 0.5–0.6 unacceptably poor accuracy.43,44
For this study in which maximizing sensitivity (the probability of correctly classifying an individual as depressed, or more severely depressed, according to the TDI score) and maximizing specificity (the probability of correctly classifying a respondent as not depressed, or less severely depressed) is considered equally important,7 the optimal cut-off score occurs at the point of furthest displacement of the ROC curve. It reflects the maximum vertical distance between the ROC curve and the chance line.45
All statistical analyses were conducted using SPSS software version 18.0 (IBM Corporation, Armonk, NY, USA) according to the non-parametric method.42
Results
Mean TDI scores ± standard deviation (SD) obtained by the four groups from the sample described in the “Participants” section are listed in Table 1. The three ROC curves are shown in Figure 1. The diagonal green line is the “chance line” and the red line is the ROC curve of the TDI. Informally, one point (test) in ROC space is better than another if it is to the northwest (true positives rate higher, false positives are lower, or both) of the first point. The point (delineated as 0, 1 in Figure 1) represents perfect discrimination.
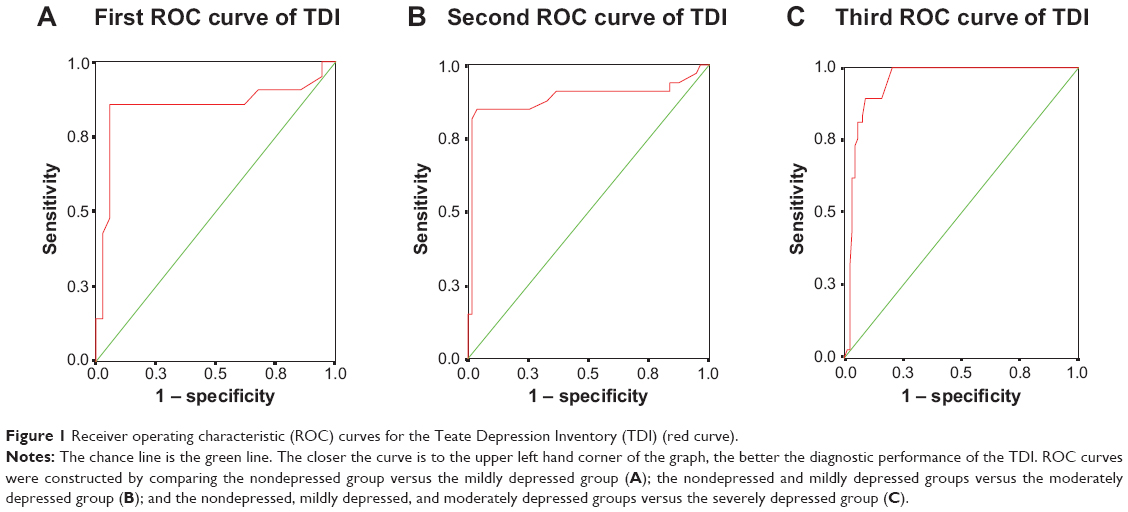 | Figure 1 Receiver operating characteristic (ROC) curves for the Teate Depression Inventory (TDI) (red curve). |
Visual inspection of the ROC curves, as well as their AUCs with 95% confidence intervals (CIs), suggests that the TDI is a good scale for discriminating nondepressed from mildly depressed patients (AUC =0.85; error standard [ES] =0.07; 95% CI =0.72–0.98); and nondepressed and mildly depressed from moderately depressed patients (AUC =0.87; ES =0.05; 95% CI =0.79–0.98), respectively. For the third curve, the TDI shows an excellent predictive accuracy for discriminating the nondepressed, mildly depressed, and moderately depressed group from the severely depressed group (AUC =0.95; ES =0.02; 95% CI =0.91–0.98). In order to choose optimal cut-off values by simultaneously maximizing sensitivity and specificity, we analyzed the coordinates of each ROC curve (Table 2).
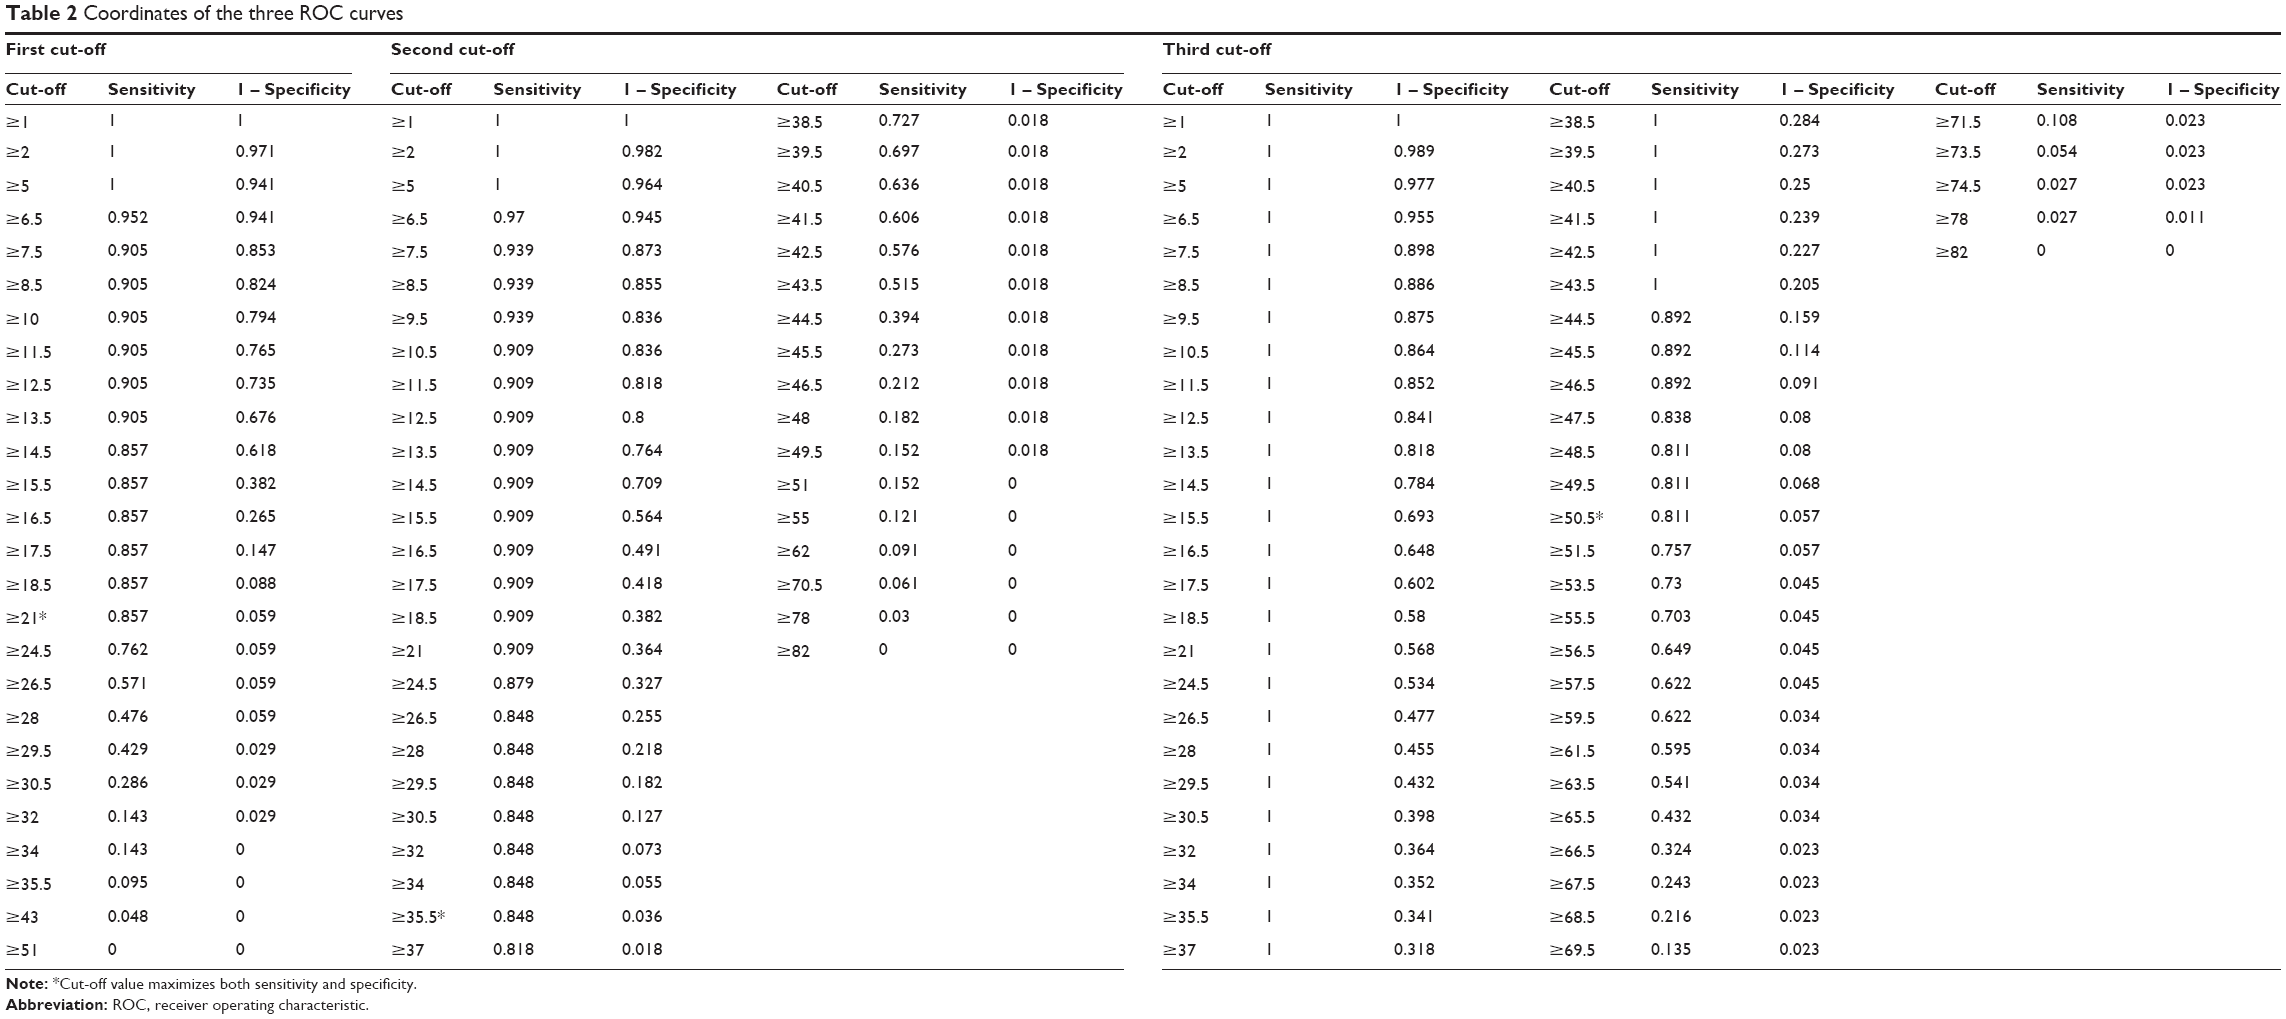 | Table 2 Coordinates of the three ROC curves |
The optimal cut-off point was a TDI total score of 21 for the first ROC curve. At this point, sensitivity was 0.86, specificity was 0.94, and classification accuracy was 0.90 (Tables 2 and 3). This cut-off score yielded 85.7% true-positives, 5.8% false-positives, and 14.2% false-negatives. The optimal cut-off value was a TDI total score of 35.5 for the second ROC curve. At this point, sensitivity was 0.82, specificity was 0.98, and classification accuracy was 0.90 (Tables 2 and 3). The cut-off score yielded 81.8% true-positives, 1.8% false-positives, and 18.2% false-negatives. The optimal cut-off point to equalize false-positives and false-negatives was a TDI total score of 49.5 for the third ROC curve. At this point, sensitivity was 0.81, specificity was 0.94, and classification accuracy was 0.88 (Table 2). The cut-off score yielded 81.1% true-positives, 5.7% false-positives, and 18.9% false-negatives. Additional details for performance of the cut-off scores are presented in Table 2. Based on our findings, the following cut-off score guidelines are suggested for total TDI scores of patients diagnosed with major depression: 1) for total scores ranging from 0–21, depression should be classified as “minimal”; 2) for total scores ranging from 22–36, classification should be “mild”; 3) for total scores ranging from 37–50, depression should be labelled “moderate”; and 4) for total scores ranging from 51–84, depression should be classified as “severe”.
 | Table 3 Prediction parameters for total Teate Depression Inventory (TDI) score (N=125) |
Discussion
The present study aimed to identify cut-off scores for the TDI that could differentiate levels of depression severity in a sample of patients with a clinician-diagnosed Axis I depression disorders. Important observations can be made when a specific method is used to determine the optimal cut-off scores for a depression rating instrument.5 Sensitivity or true positives (in this case, correct identification as a depression patient) and specificity or true negatives (correct identification as a control) are the most evident markers. Nevertheless, false positives (ie, incorrect identification as a depression patient) and false negatives (ie, incorrect identification as a control) should also be considered. In mental health, while false positives can be associated with the potential for stigmatization of psychiatric illness, false negatives can result in a failure to provide appropriate therapeutic treatments. Determining cut-off scores is challenging and depends mainly on the advantages of true positives and true negatives as well as their relative costs.5 In classical medical settings, missing a diagnosis (a false negative) of an important pathology may have a significantly higher cost than arriving at a false diagnosis (a false positive). In such conditions, the emphasis would be on sensitivity rather than specificity. Nevertheless, the nature of mental health issues is that false positives and false negatives are often considered equally problematic.7 One strategy to reduce both false positives and false negatives is to give them equal weight in identifying a cut-off score.5,7 Accordingly, in the present study three separate ROC curves were generated for psychiatric patients. The rates of sensitivity and specificity of the three cut-off scores (Table 3) support their usefulness in different circumstances. However, as Kraemer et al point out, it is not really a question of which cut-off score to use, but rather a question of when to use which cut-off score.5 Thus, the decision to use different cut-off scores for the TDI must be based both on the unique characteristics of the sample and the envisaged purpose for using the TDI.
For example, if the TDI is deployed as a screening instrument, it should be ensured that it misses as few depressive patients as possible. If the main purpose is to detect the maximum number of persons with depression, then the cut-off score should be lowered to minimize false negatives. Thus, a high sensitivity appears to be indispensable, although gains in sensitivity are generally at the expense of specificity, and vice versa.46,47 Therefore, alternative TDI cut-off scores could be considered (Table 2), which, however, would coincide with significantly decreased specificity. Low specificity would force an investment in multiple resources to diagnose patients who are not depressed, since a positive depression screening should entail an additional diagnostic session that usually includes a structured diagnostic interview. Although the number of false positives would increase, this method may be useful when screening for possible cases of depression.
For research studies in which it is important to obtain a group of persons with depression as pure as possible with regard to symptomatology, the cut-off score should be raised to reduce the number of false positives. Researchers may use the data in Table 2 for their particular samples and purposes, in light of the relative importance of sensitivity vs specificity to their research design.
In any case, a single score on one self-report measure cannot replace clinicians’ judgments in terms of providing a diagnosis. In clinical settings, the use of an assessment instrument, which has a higher sensitivity than 80% in identifying probable cases of clinical depression, is likely to be of great advantage in detecting patients who need follow-up assessments. In research settings, where clinician assessment is less often available (but not less important), a cut-off score which estimates the prevalence and likelihood of clinical depression more carefully is almost guaranteed.
The present study adds to the utility of an already promising measure, the TDI, by providing both researchers and clinicians with cut-off scores to identify different levels of severity of depression. However, further studies on the TDI’s psychometric properties, using larger and more diverse samples including a greater number of males, patients in different age groups, and patients with comorbid disorders, are needed to cross-validate the newly established cut-off scores. Future studies using larger, more diverse samples could provide additional diagnostic information that may serve as an additional, externally validated criterion for determining the TDI’s screening performance.
Author contributions
MB was both principal investigator and project director of the study. AS made substantial contribution to conception and design of the study. All authors have contributed to and have approved the final manuscript.
Disclosure
The authors report no conflicts of interest in this work.
References
Widiger TA, Coker LA. Mental disorders as discrete clinical conditions: Dimensional versus categorical classification. In Hersen M, Turner SM, editors. Adult psychopathology and diagnosis. 4th ed. New York: John Wiley and Sons; 2003:3–35. | ||
Widiger TA, Samuel DB. Diagnostic categories or dimensions? A question for the Diagnostic and Statistical Manual of Mental Disorders – fifth edition. J Abnorm Psychol. 2005;114(4):494–504. | ||
Frances A, Mack AH, First MB, et al. DSM-IV meets philosophy. J Med Philos. 1994;19(3):207–218. | ||
Flett G, Vredenburg K, Krames L. The continuity of depression in clinical and nonclinical samples. Psychol Bull. 1997;121(3):395–416. | ||
Kraemer HC, Noda A, O’Hara R. Categorical versus dimensional approaches to diagnosis: methodological challenges. J Psychiatr Res. 2004;38(1):17–25. | ||
Kessler RC. Epidemiological perspectives for the development of future diagnostic systems. Psychopathology. 2002;35(2–3):158–161. | ||
Kessler RC, Barker PR, Colpe LJ, et al. Screening for serious mental illness in the general population. Arch Gen Psychiatry. 2003;60(2):184–189. | ||
Van Dam NT, Gros DF, Earleywine M, Antony MM. Establishing a trait anxiety threshold that signals likelihood of anxiety disorders. Anxiety Stress Coping. 2013;26(1):70–86. | ||
Akiskal HS. Validating affective personality types. In: Robins L, Barrett J, editors. The Validity of Psychiatric Diagnosis. New York: Raven Press; 1989:217–227. | ||
Rasch G. Probabilistic Models for Some Intelligence and Attainment Tests. Copenhagen, Denmark: Danish Institute for Educational Research; 1960. | ||
American Psychiatric Association, editor. Diagnostic and Statistical Manual of Mental Disorders. 4th ed., Text Revision. Washington, DC: American Psychiatric Association; 2000. | ||
Mitchell AJ, Vaze A, Rao S. Clinical diagnosis of depression in primary care: a meta-analysis. Lancet. 2009;374(9690):609–619. | ||
Mitchell AJ, Rao S, Vaze A. Can general practitioners identify people with distress and mild depression? A meta-analysis of clinical accuracy. J Affect Disord. 2011;130(1–2):26–36. | ||
Beck A. Depression: Causes and Treatment. Philadelphia: University of Pennsylvania Press; 1972. | ||
Beck AT, Rush AJ, Shaw BF, Emery G. Cognitive Therapy of Depression. New York: Guilford Press; 1979. | ||
Clak DA, Beck AT. Scientific Foundations of Cognitive Theory and Therapy of Depression. New York: John Wiley and Sons; 1999. | ||
Balsamo M, Saggino A. Test per l’assessment della depressione nel contesto italiano: un’analisi critica [Depression assessment questionnaires in the Italian context: A critical analysis]. Psicoterapia Cognitiva e Comportamentale. 2007;13(2):167–199. Italian. | ||
Balsamo M, Giampaglia G, Saggino A. Building a new Rasch-based self-report inventory of depression. Neuropsychiatr Dis Treat. 2014;10:153–165. | ||
Balsamo M, Saggino A. TDI - Teate Depression Inventory- Manual. Firenze: Hogrefe Editore; 2013. Italian. | ||
Balsamo M, Imperatori C, Sergi MR, et al. Cognitive vulnerabilities and depression in young adults: an ROC curves analysis. Depress Res Treat. 2013;2013:407602. | ||
Balsamo M, Romanelli R, Innamorati M, Ciccarese G, Carlucci L, Saggino A. The State-Trait Anxiety Inventory: shadows and lights on its construct validity. J Psychopathol Behav Assess. 2013;35:475–486. | ||
Whisman MA, Perez JE, Ramel W. Factor structure of the Beck Depression Inventory-Second Edition (BDI-II) in a student sample. J Clin Psychol. 2000;56(4):545–551. | ||
Wu PC, Chang L. Psychometric properties of the Chinese version of the Beck Depression Inventory-II using the Rasch Model. Meas Eval Couns Dev. 2008;41(1):13. | ||
Storch EA, Roberti JW, Roth DA. Factor structure, concurrent validity, and internal consistency of the Beck Depression Inventory-second edition in a sample of college students. Depress Anxiety. 2004;19(3):187–189. | ||
Osman A, Kopper BA, Barrios F, Gutierrez PM, Bagge CL. Reliability and validity of the Beck Depression Inventory-II with adolescent psychiatric inpatients. Psychol Assess. 2004;16(2):120–132. | ||
Gibbons RD, Clark DC, VonAmmon Cavanaugh S, Davis JM. Application of modern psychometric theory in psychiatric research. J Psychiatr Res. 1985;19(1):43–55. | ||
da Rocha NS, Chachamovich E, de Almeida Fleck MP, Tennant A. An introduction to Rasch analysis for psychiatric practice and research. J Psychiatr Res. 2013;47(2):141–148. | ||
Beck A, Steer R. Beck Anxiety Inventory Manual. San Antonio: The Psychological Corporation; 1993. | ||
Yesavage JA, Brink TL, Rose TL, et al. Development and validation of a geriatric depression screening scale: a preliminary report. J Psychiatr Res. 1982–1983;17(1):37–49. | ||
Ree MJ, French D, MacLeod C, Locke V. Distinguishing cognitive and somatic dimensions of state and trait anxiety: Development and validation of the State-Trait Inventory for Cognitive and Somatic Anxiety (STICSA). Behav Cogn Psychother. 2008;36(3):313–332. | ||
Ware J Jr, Kosinski M, Keller SD. A 12-Item Short-Form Health Survey: construction of scales and preliminary tests of reliability and validity. Med Care. 1996;34(3):220–233. | ||
Mazzi F, Morosini P, de Girolamo G, Lussetti M, Guaraldi G. SCID-I CV: Intervista Clinica Strutturata per i Disturbi Dell’asse I del DSM-IV, Versione Clinica [SCID–I CV: Structured Clinical Interview for DSM–IV Axis I Disorders, Clinical Version]. Firenze: Organizzazioni Speciali; 2000. Italian. | ||
American Psychiatric Association, editor. Diagnostic and Statistical Manual of Mental Disorders: DSM-V. 5th ed. Arlington County: American Psychiatric Publishing; 2013. | ||
Balsamo M, Giampaglia G, Saggino A. Building a new Rasch-based self-report inventory of depression. Neuropsychiatr Dis Treat (in press). 2014;10:153–165. | ||
Beck A, Steer R, Brown G. Beck Depression Inventory-II, Manual. San Antonio: The Psychological Corporation; 1996. | ||
First MB, Spitzer RL, Gibbon M, Williams JB. Structured Clinical Interview for DSM-IV Axis I Disorders, (SCID-I), Clinical Version. Washington, DC: American Psychiatric Association; 1997. | ||
Fennig S, Naisberg-Fennig S, Craig TJ, Tanenberg-Karant M, Bromet EJ. Comparison of clinical and research diagnoses of substance use disorders in a first-admission psychotic sample. Am J Addiction. 1996;5(1):40–48. | ||
Ramirez Basco M, Bostic JQ, Davies D, et al. Methods to improve diagnostic accuracy in a community mental health setting. Am J Psychiatry. 2000;157(10):1599–1605. | ||
Zanarini MC, Frankenburg FR. Attainment and maintenance of reliability of axis I and II disorders over the course of a longitudinal study. Compr Psychiatry. 2001;42(5):369–374. | ||
Gleitman H. Psychology. New York: Norton & Co; 1986. | ||
Bradley AP. The use of the area under the ROC curve in the evaluation of machine learning algorithms. Pattern Recogn. 1997;30(7):1145–1159. | ||
Hanley JA, McNeil BJ. The meaning and use of the area under a receiver operating characteristic (ROC) curve. Radiology. 1982;143(1):29–36. | ||
Metz CE. Basic principles of ROC analysis. Semin Nucl Med. 1978;8(4):283–298. | ||
Somoza E, Soutullo-Esperon L, Mossman D. Evaluation and optimization of diagnostic tests using receiver operating characteristic analysis and information theory. Int J Biomed Comput. 1989;24(3):153–189. | ||
Schisterman EF, Perkins NJ, Liu A, Bondell H. Optimal cut-point and its corresponding Youden Index to discriminate individuals using pooled blood samples. Epidemiology. 2005;16(1):73–81. | ||
Mulrow CD, Williams JW Jr, Gerety MB, Ramirez G, Montiel OM, Kerber C. Case-finding instruments for depression in primary care settings. Ann Intern Med. 1995;122(12):913–921. | ||
Whooley MA, Avins AL, Miranda J, Browner WS. Case-finding instruments for depression. J Gen Intern Med. 1997;12(7):439–445. |
 © 2014 The Author(s). This work is published and licensed by Dove Medical Press Limited. The
full terms of this license are available at https://www.dovepress.com/terms
and incorporate the Creative Commons Attribution
- Non Commercial (unported, 3.0) License.
By accessing the work you hereby accept the Terms. Non-commercial uses of the work are permitted
without any further permission from Dove Medical Press Limited, provided the work is properly
attributed. For permission for commercial use of this work, please see paragraphs 4.2 and 5 of our Terms.
© 2014 The Author(s). This work is published and licensed by Dove Medical Press Limited. The
full terms of this license are available at https://www.dovepress.com/terms
and incorporate the Creative Commons Attribution
- Non Commercial (unported, 3.0) License.
By accessing the work you hereby accept the Terms. Non-commercial uses of the work are permitted
without any further permission from Dove Medical Press Limited, provided the work is properly
attributed. For permission for commercial use of this work, please see paragraphs 4.2 and 5 of our Terms.