Back to Journals » Clinical Epidemiology » Volume 12
Determinants of Health Status After Stroke: A Cohort Study with Repeated Measurements
Authors Larsen LP, Johnsen SP, Andersen G ![]() , Hjollund NH
, Hjollund NH ![]()
Received 27 July 2020
Accepted for publication 8 October 2020
Published 16 November 2020 Volume 2020:12 Pages 1269—1279
DOI https://doi.org/10.2147/CLEP.S270249
Checked for plagiarism Yes
Review by Single anonymous peer review
Peer reviewer comments 2
Editor who approved publication: Professor Vera Ehrenstein
Louise Pape Larsen,1 Søren Paaske Johnsen,2 Grethe Andersen,3 Niels Henrik Hjollund1,4
1AmbuFlex/WestChronic, Occupational Medicine, University Research Clinic, Aarhus University, Herning, Denmark; 2Danish Center for Clinical Health Services Research, Department of Clinical Medicine, Aalborg University, Aalborg, Denmark; 3Department of Neurology, Aarhus University Hospital, Aarhus, Denmark; 4Department of Clinical Epidemiology, Aarhus University Hospital, Aarhus, Denmark
Correspondence: Niels Henrik Hjollund
AmbuFlex/WestChronic, Occupational Medicine, University Research Clinic, Aarhus University, Gl. Landevej 61, Herning DK-7400, Denmark
Email [email protected]
Background: Knowledge about the long-term course of health following stroke is sparse and relies mainly on studies with short follow-up or few measurements per patient. We aimed to describe the course and analyze the determinants of the course of physical and mental health status after stroke with repeated measurements in a large population-based cohort of first time Danish stroke patients.
Methods: We followed 2,414 first time stroke patients admitted to any hospital in the Central Denmark Region, Denmark, between October 1, 2008 and January 1, 2012, with five questionnaires over a 2 years period. Self-rated health was assessed by the SF-12 instrument. Information on possible clinical and patient-related determinants of self-rated health was obtained from questionnaires and national registers. The scores were analyzed at five selected fixed time-points and as well as longitudinally with mixed models.
Results: The SF-12 mental component summary score (MCS) increased with 0.89 points/year (95% CI=0.6– 1.2), while the increase in the physically component summary score (PCS) did not reach statistical significance (0.13/year; 95% CI=− 0.2– 0.5). The most pronounced changes were seen in the Vitality and Role Physical SF-12 subscales, which both increased by 2.1 points/year. No statistically significant changes over time were found in the Physical Functioning and Bodily Pain subscales. Variables associated with increasing self-rated mental health (MCS) were no comorbidity, older age, male gender, and mild stroke severity. Variables associated with increasing ratings of physical health (PCS) were mild stroke severity, no comorbidity, higher educational level, and younger age. The negative impact of age increased significantly with time during the follow-up period for physical as well as mental health, while the effects of the other variables were stable over time. The results were similar in the two analytical approaches.
Conclusion: In a large, geographically well-defined population of first time stroke patients, the majority of SF-12 sub-scales and the mental component score improved slightly over time. Small improvements in self-rated mental health may be observed during the first 2 years after the stroke. Stroke is a disease with long-term consequences on a wide range of health aspects. Level as well as course differ between sub-groups, and treatment of comorbidity may be an important target with respect to rehabilitation.
Keywords: cohort studies, patient-reported outcome, repeated measurements, self-rated health, stroke
Introduction
Stroke is a leading cause of mortality and disability. Improved management of stroke has led to increased survival rates resulting in more stroke survivors living with varying levels of disability.1,2 Stroke is a condition that potentially affects the functional level as well as mental capacity and the ability to reintegrate in social life,3,4 and stroke patients report their health as substantially lower than healthy referents.5–7 Previous longitudinal studies on self-rated health after stroke have suggested stroke severity, co-morbidity, depression, fatigue, higher age, female gender, low educational level, and living alone as determinants of low self-rated health.5,7–20 However, the results are partly conflicting. Most studies on stroke survivors have been conducted in the sub-acute phase with short follow-up time or in selected groups such as patients referred to rehabilitation. Furthermore, studies with longer follow-up most often rely on only one or few measurements or are limited by small sizes of cohorts.3,5,7,9–18 As the number of survival years after stroke are increasing, the importance of knowledge of long-term prognosis of health also increases. We aimed to examine the course and the determinants of course of self-rated health with repeated measurements from 3–24 months after stroke in a large well defined cohort of first time stroke patients.
Patients and Methods
Study Population
We identified all patients with first-time stroke, who had been admitted to any hospital in the Central Denmark Region between October 1, 2008 and January 1, 2012. Central Denmark Region is one of five administrative units in Denmark with 1.2 million inhabitants.21 During the study period, the region was served by seven clinical stroke hospital units, covering all stroke patients within the geographically defined region. The cohort has been described in more detail elsewhere.19,20 Every second month, new patients were identified in the Danish Stroke Register (DSR), which is a nationwide initiative to monitor the quality of stroke treatment and care,22 and participation is mandatory for all Danish departments treating patients for acute stroke. Clinical data are prospectively collected by healthcare professionals using standardized registration forms. The register has been found to be valid and complete regarding patient registration.23,24 All first time stroke patients younger than 80 years, alive 90 days after the stroke and living in their own home prior to the stroke (n=3221), were included in the study and invited to participate. A flowchart describing the selection of study participants and questionnaires is shown in Figure 1.
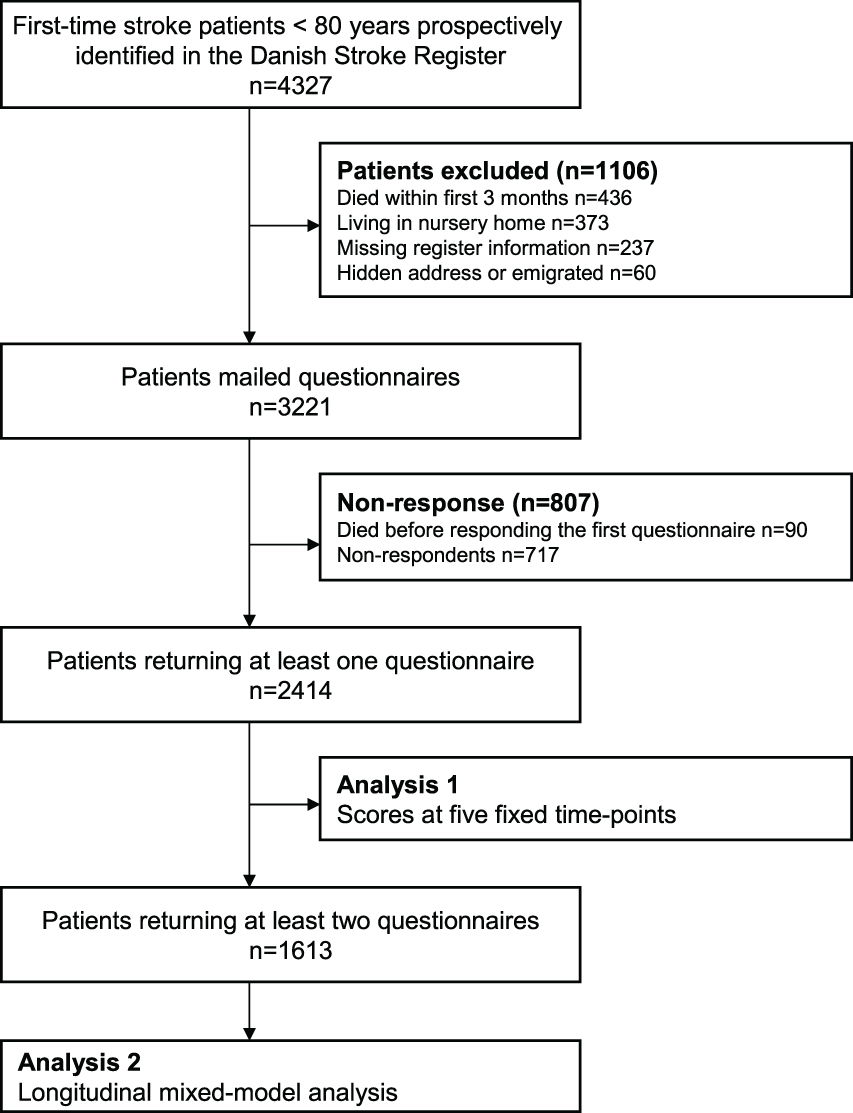 |
Figure 1 Selection of participants in a cohort of patients for Region Central Denmark suffering first time stroke between October 2008 and January 2012. |
Questionnaires
Three months after the stroke, the initial questionnaire including questions on self-rated health (SF-12) was sent to the patient by ordinary mail. Three months later and subsequently every 6 months until 2 years from onset of their stroke the patients were asked to fill in the questionnaires. The questionnaires were mailed according to patient specific schedules based on the exact date of the stroke. Except for the first questionnaire, which was always a paper form, patients could choose between paper and web-versions. In the first questionnaire, patients could indicate that they declined further participation. Non-responders were sent a new questionnaire at the time where the patient was supposed to complete the next questionnaire unless they declined. Such non-responding patients were sent up to three questionnaires over 1.5 years. For analysis, we selected the questionnaires for each patient with the best fit with respect to the five fixed time points at 3, 6, 12, 18, and 24 months. Since 1968, all Danish residents have been assigned a unique civil registry number which is used in all health databases and permits unambiguous record linkage between databases. The Civil Registration System contains information on the civil registry number, name, gender, address, date of birth, and vital status.25 Information on the address and vital status was collected simultaneously prior to approaching the individual patients.
Short-Form 12
The SF-12 is a generic measure of self-rated health that describes the patients’ experiences of function and well-being in physical, mental, and social dimensions of life during the past 4 weeks. The scale has been validated in several groups of patients, also in Denmark, and has shown satisfactory reliability and validity among stroke patients.26–29 The SF-12 consists of 12 questions that correspond to eight subscales and two summary scales: Physical Component Summary (PCS) and Mental Component Summary (MCS) scores. SF-12 scores are graded from 0–100, with higher scores indicating better health. The summary scores are norm-based with a mean of 50 and the standard deviation (SD) equals 10 in a US population sample.30 We used the Danish translation of the standard SF-12 version 2.0 with scoring as suggested by Ware et al.30,31
Possible Determinant Variables
The following covariates were a priori selected for analysis: gender, age, stroke severity, type of stroke, educational level, and co-morbidity. Information on educational level was collected from questionnaire and categorized as low (less than 10 years education), medium (11–14 years education), and high (more than 15 years of education), as suggested by the International Standard Classification of education.32 If educational level was missing in the questionnaire, it was estimated based on register information on trade-specific unemployment fund.33 Information on gender, age, and the possible date of death was obtained from the Danish Civil Registration System.25 Age was calculated at the day of the stroke. Information on type of stroke, stroke severity, body mass index (BMI), alcohol consumption, and smoking habits were obtained from the patient’s record in the DSR register. Stroke severity was measured at admittance by the Scandinavian Stroke Scale (SSS) and is graded from 0–58 with low scores indicating severe stroke.34,35 Type of stroke was categorized as ischemic, intracerebral hemorrhage, or unspecified. Charlson Comorbidity Index covers 19 major disease categories in an overall measure of co-morbidity.36 The index was calculated from the data obtained form of the Danish National Patient Registry.37
Statistical Methods
The courses of the SF-12 summary scores were presented graphically, where curves were constructed using Lowess smoothing curves with the default bandwidth of 0.8. In the first analytic approach (Figure 1), we calculated regression based adjusted mean score for MCS and PCS at each of five selected time-point and analyzed the impact of covariates on differences in scores between the levels of the covariates. All responding patients were included in this analysis. Multiple imputations were used to handle missing data. The imputation model was based on register-based data as well as data from the questionnaires and took the individual time course into account. Missing data were imputed 25 times. Analyses were performed both with and without the imputed data and results were supplemented with a sensitivity scenario in which missing measurements were assumed to represent subjects with lower health than estimated with the imputation models. Details of the imputation model are given in Supplementary Table I. In a second longitudinal analytic approach (Figure 1), the overall courses for summary- and sub-scales were analyzed by mixed models and the impact of determinants on the courses of summary scores were evaluated with respect to the same covariates. Time-dependence was evaluated by including time-dependent interaction terms. Patients with at least two questionnaires were included in this analysis. Imputed data were not used in longitudinal analyses based on mixed-models.38 In both analyses, point estimates of adjusted means were calculated from the multiple regression equation, while the size of 95% confidence intervals and statistical tests were based on the standard error of the parameter in question. Statistical analysis were made using Stata 13.0 SE. Estimates were presented with 95% confidence intervals (CI) and P-values below 0.05 were considered statistically significant.
Ethics Approval and Consent to Participate
Participation was voluntary and the study followed the principles of the Declaration of Helsinki and was conducted based on approval from the Danish Data Protection Agency journal number 2007–41-0990. According to Danish law, approval by the ethics committee and written informed consent is not required in questionnaire-based and register-based research.
Results
The first questionnaire was mailed to 3,221 patients (Figure 1, Table 1). Ninety patients died before responding to the first questionnaire, and 717 patients declined to participate in the study or remained non-respondent. The remaining patients (n=2,414) all returned one or more questionnaire during the following 24 months. The initial response-rate was 77.1%. Of these patients, 1,613 (66.8%) returned at least two and thus included in the longitudinal analyses. After 24 months, 297 patients had died while 1,140 returned the last questionnaire (Table 1). In total, 7,140 questionnaires were used in the analyses.
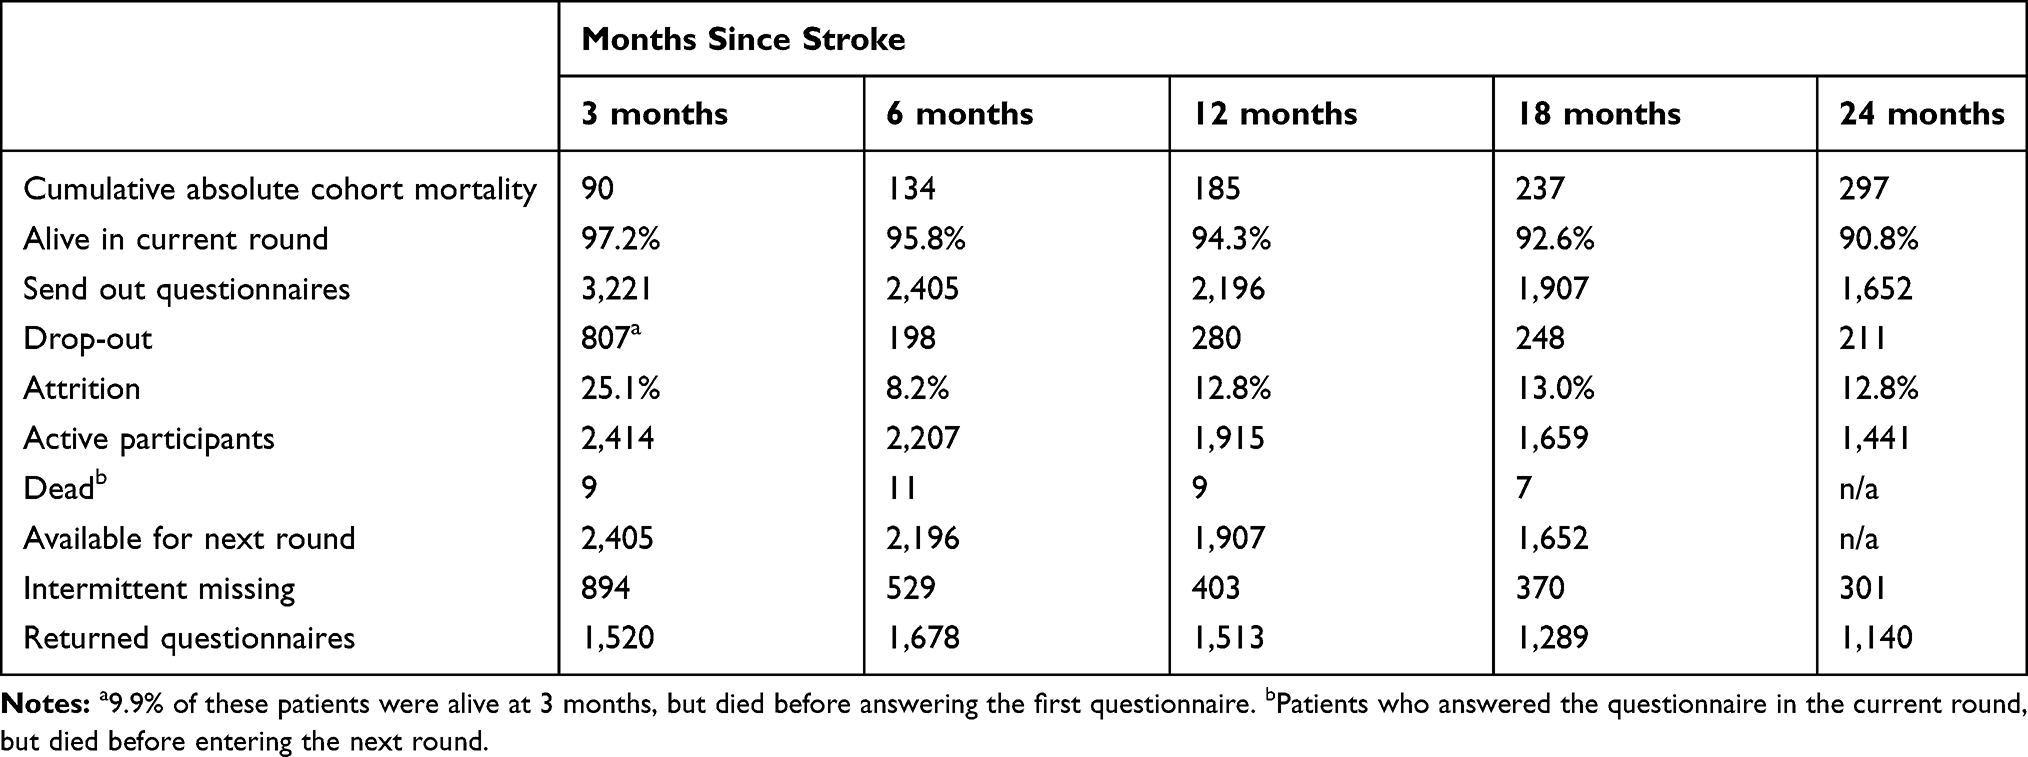 |
Table 1 Attrition and Response Pattern in a Cohort of Danish First-Time Stroke Patients Alive 90 Days After (N=3,221) |
The mean age at the date of stroke was 64.5 years (SD=10.9 years). Characteristics of the population are presented in Table 2. More than 60% of the patients were men and ischemic stroke was the most frequent diagnosis.
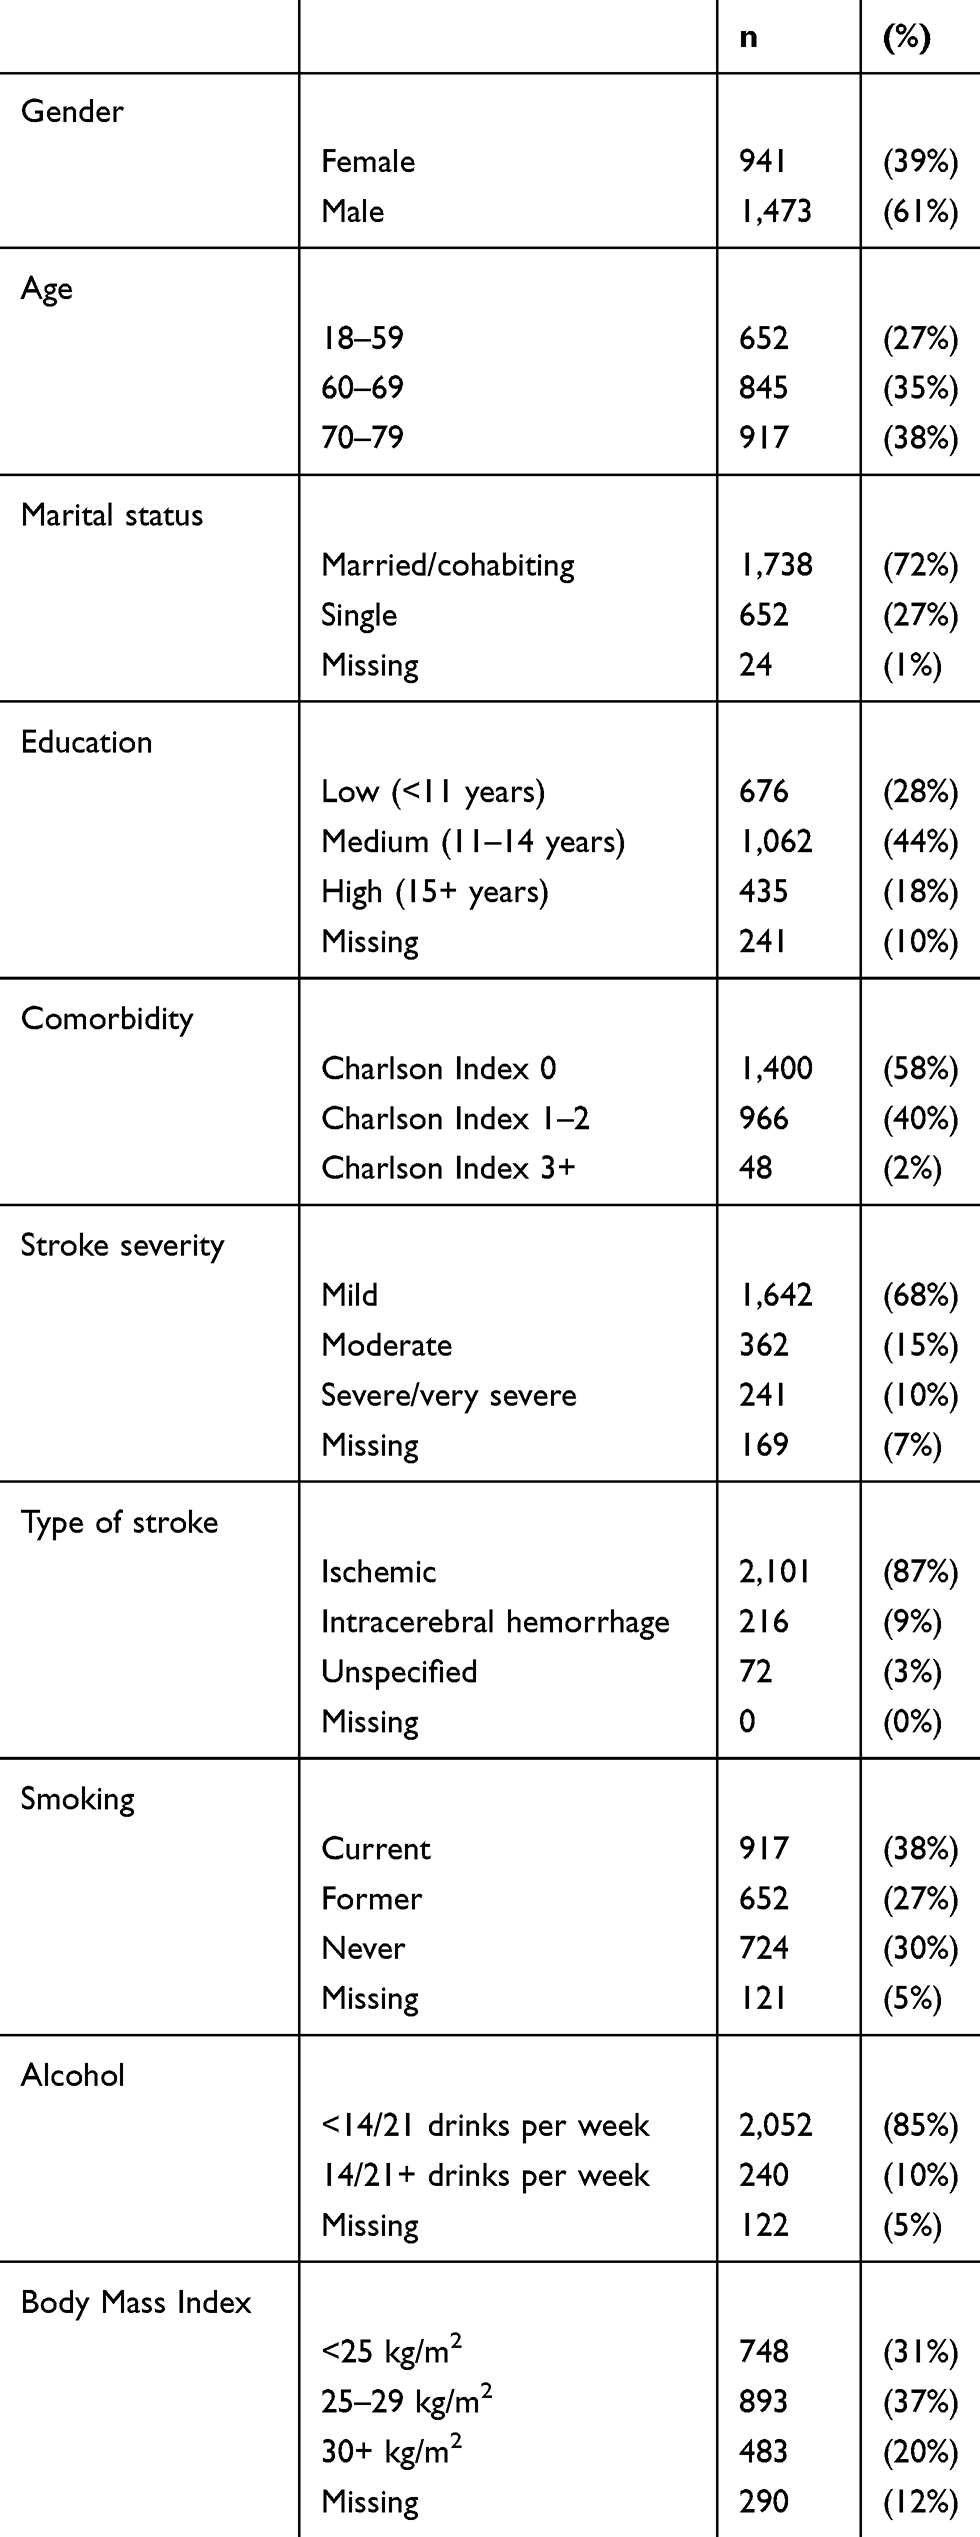 |
Table 2 Patient Characteristics of Respondents in a Cohort of Danish Stroke Patients (N=2,414) |
Course of the SF-12 Summary Component Scores
The measured scores of SF-12 mental component summary (MCS) and physically component summary (PCS) scores are shown in Figure 2. Most patients delivered their responses at the prescribed time-points: 3, 6, 12, 18, and 24 months after the date of their stroke (Figure 2). The MCS score increased with 0.89 points/year (95% CI=0.6–1.2), while the increase in PCS score did not reach statistical significance (0.13/year; 95% CI=−0.2– 0.5).
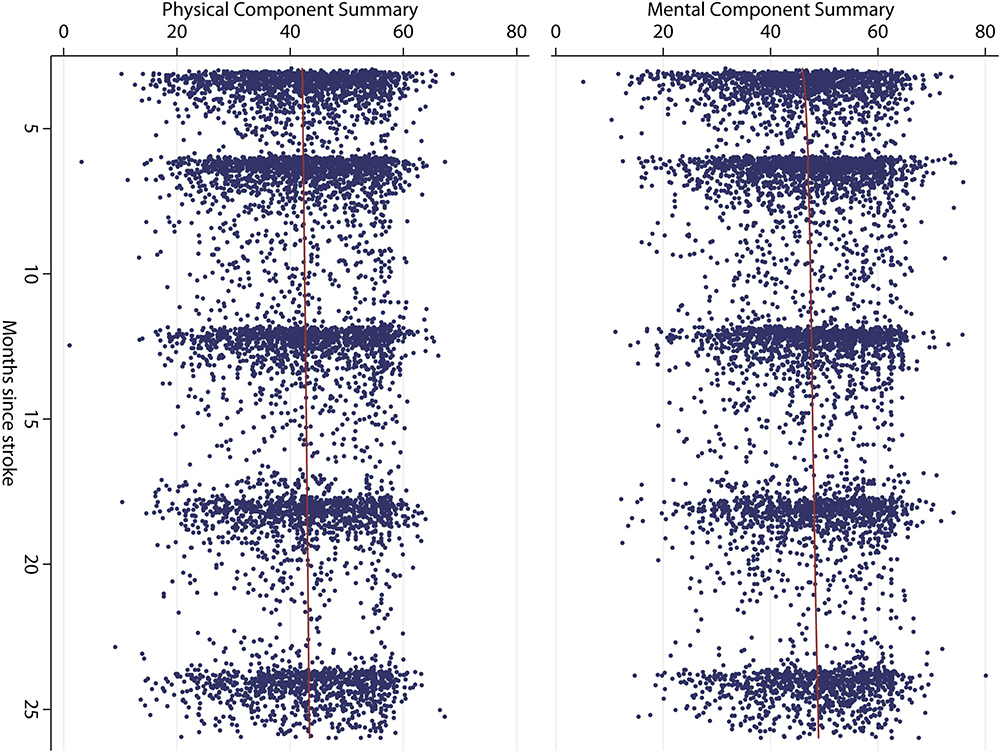 |
Figure 2 Measurements of Short-Form 12 physical and mental component scores in a cohort of 2,414 Danish first time stroke patients. Lowess smoothing curve bandwidth=0.8. |
The results from the analyses at the fixed time points are presented in Tables 3 and 4, while the results of the longitudinal analyses are shown in Table 5. Similar tables containing 95% confidence intervals are shown in Supplementary Tables II–IV. The determinants for better mental outcome (MCS) were no comorbidity, older age, mild stroke severity, and high educational level. The findings were very similar in the two analytic approaches (Tables 3 and 5). The effect of comorbidity (co-morbidity index of 3 or more) and age (70–79 years) showed the strongest effect. The beneficial effect of higher age diminished over time, while the other variables were stable within the 2 years period. With respect to physical health (PCS), the strongest determinants for better physical outcome were mild stroke severity, no comorbidity, higher educational level, and younger age (Tables 4 and 5). The effect of stroke severity and comorbidity both exceeded one half standard deviation (0.78 and 0.60 SD, respectively, Table 5). The negative effect of age increased over time, while the negative effect of stroke severity tended to decrease over the 2 years period (Table 5), but was still the most important determinant for PCS after 24 months (Table 4). The overall strongest effect was found for severe stroke severity after 3 months, where PCS was 0.85 SD below the level among patients with mild stroke severity (Table 4). The type of stroke did not influence the courses of MCS or PCS.
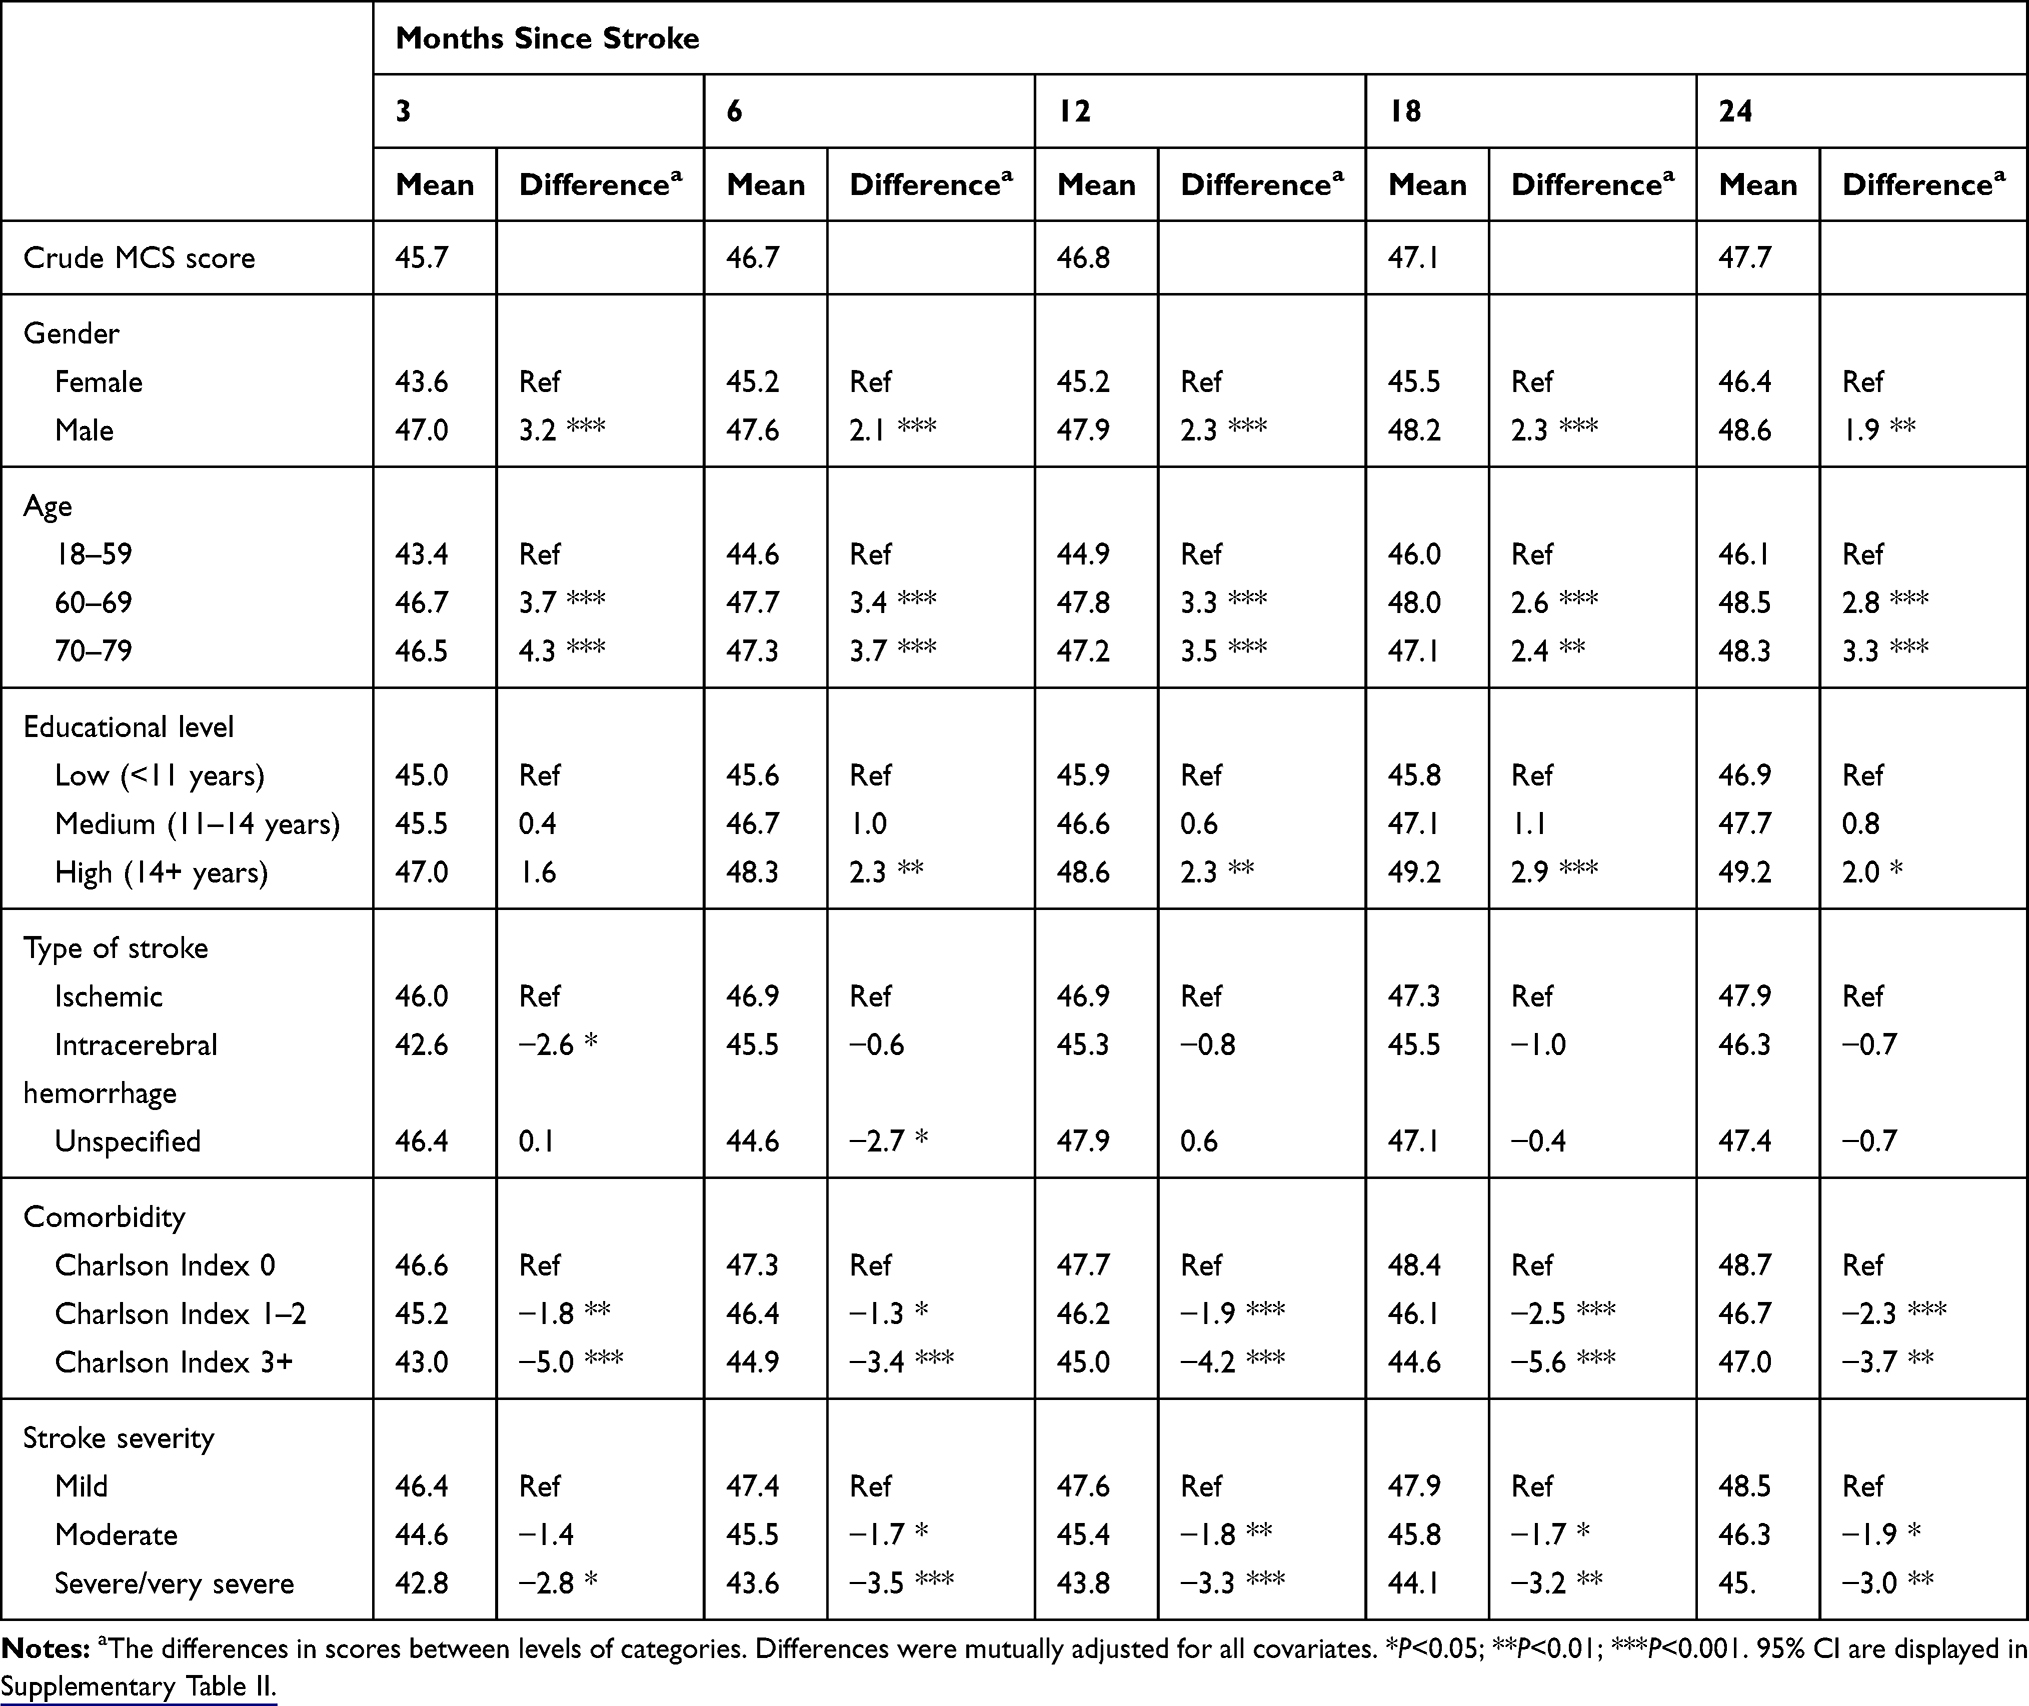 |
Table 3 Differences in SF-12 Mental Component Summary (MCS) at Each Point of Follow-Up in a Cohort of 2414 First-Time Danish Stroke Patients |
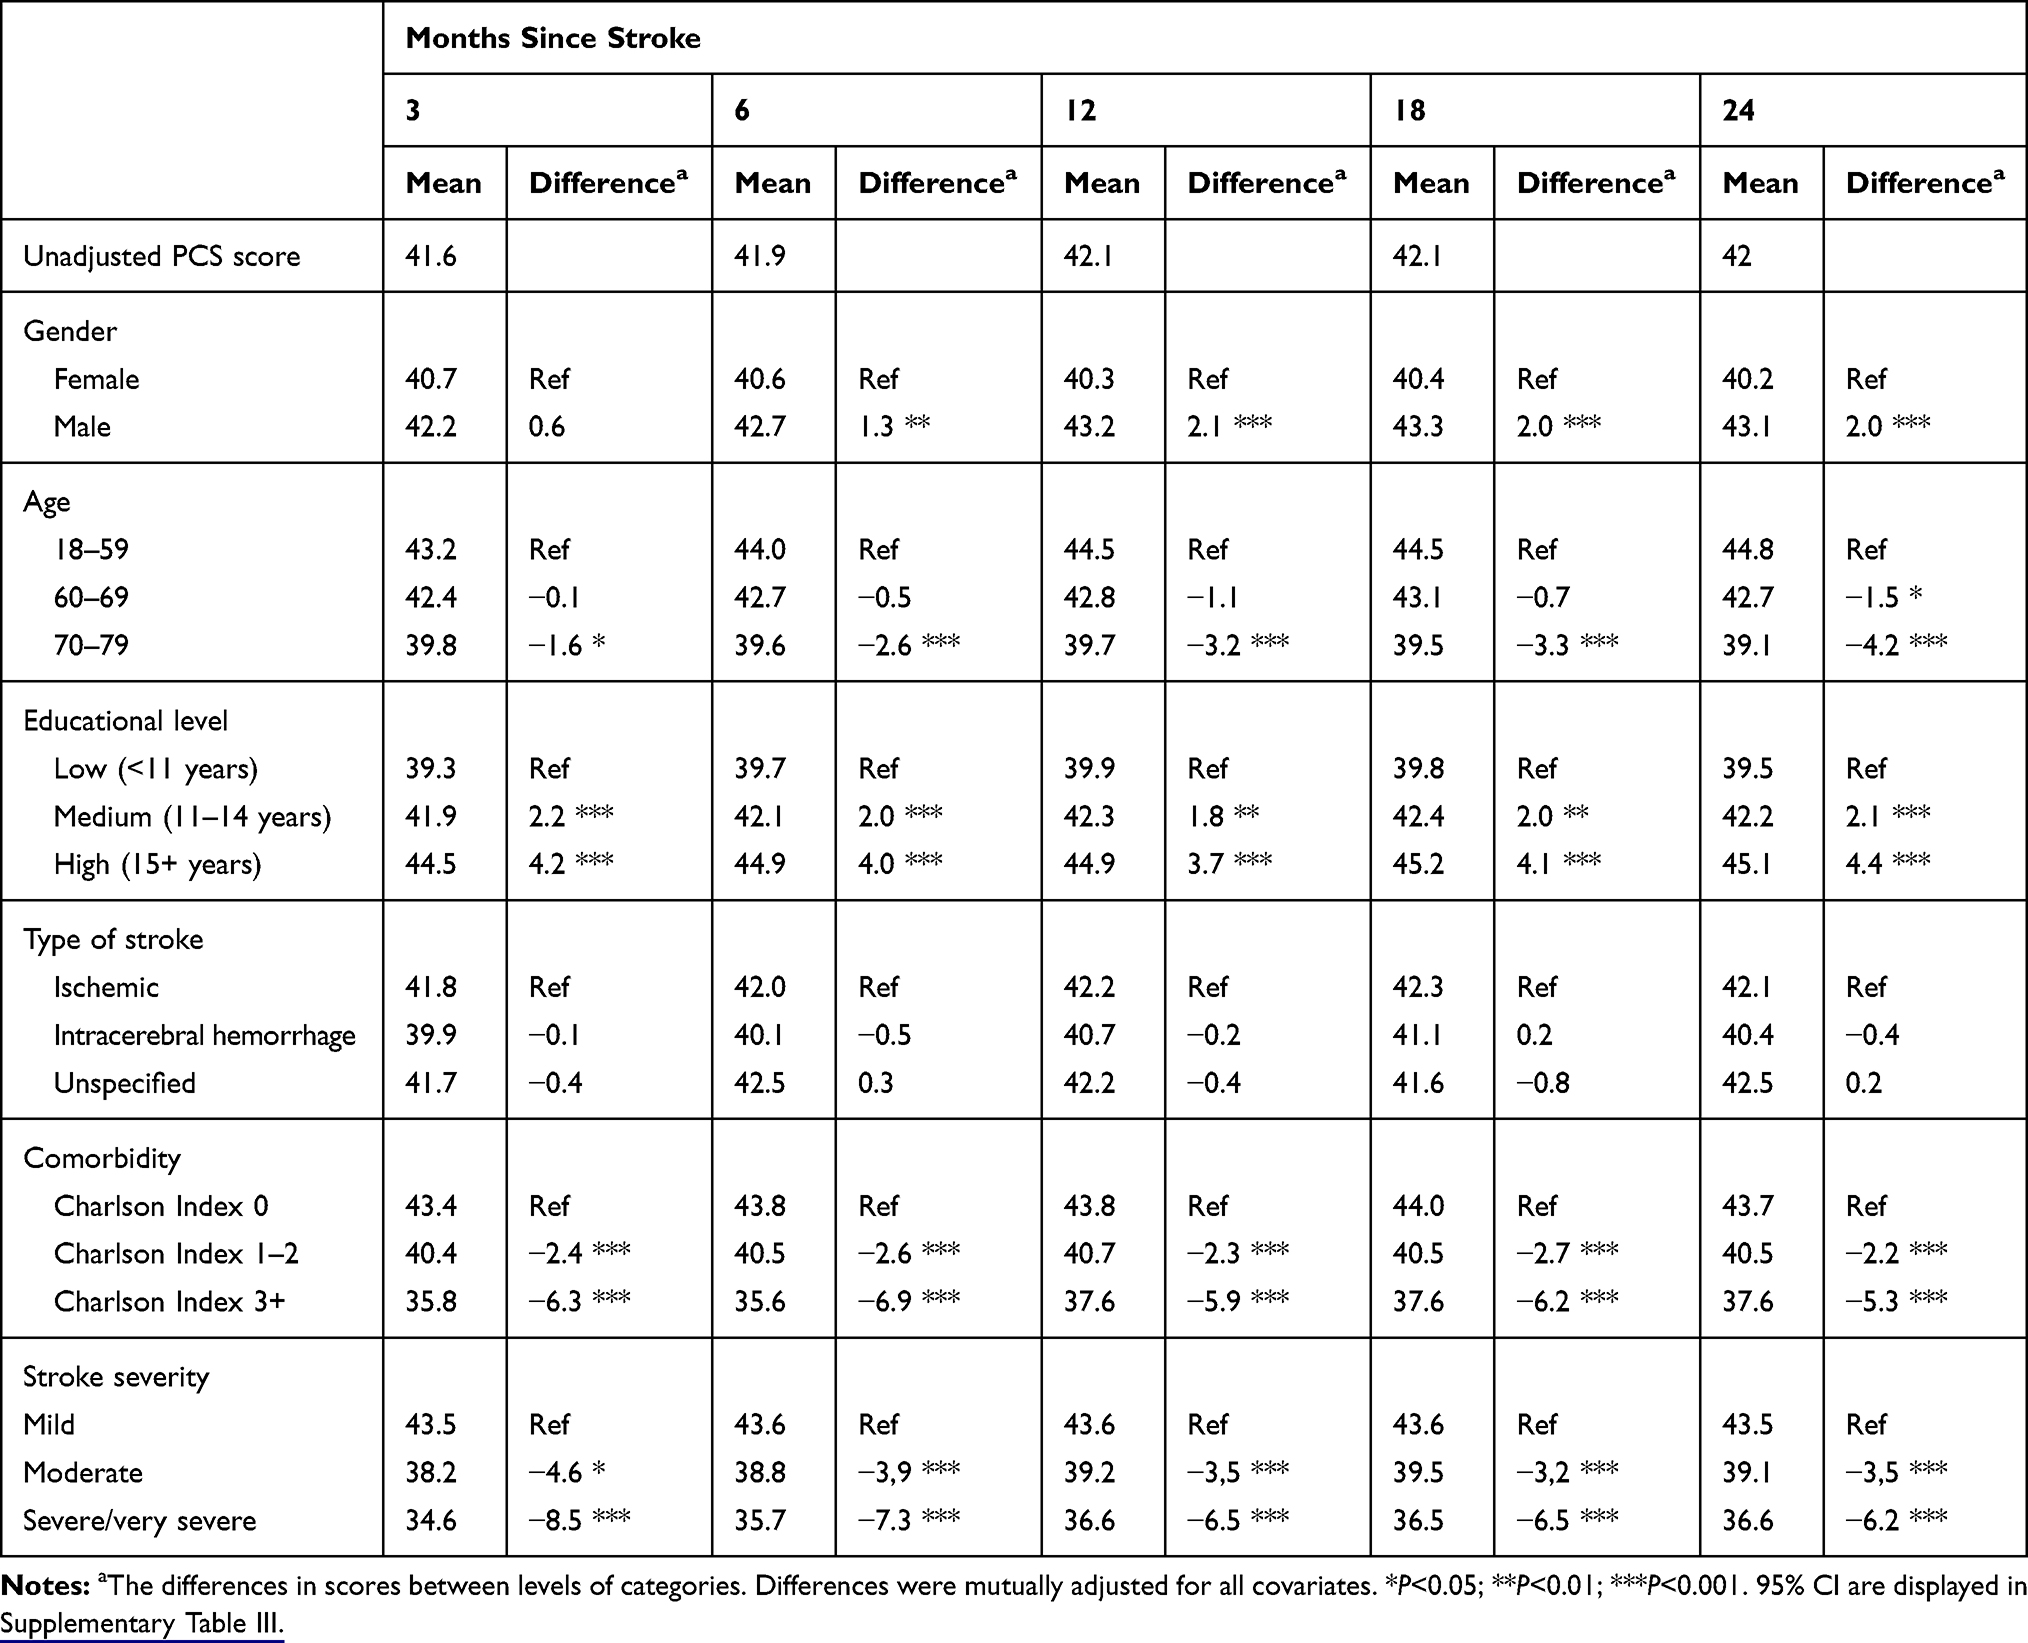 |
Table 4 Differences in SF-12 Physical Component Summary (PCS) at Each Point of Follow-Up in a Cohort of 2414 First-Time Danish Stroke Patients |
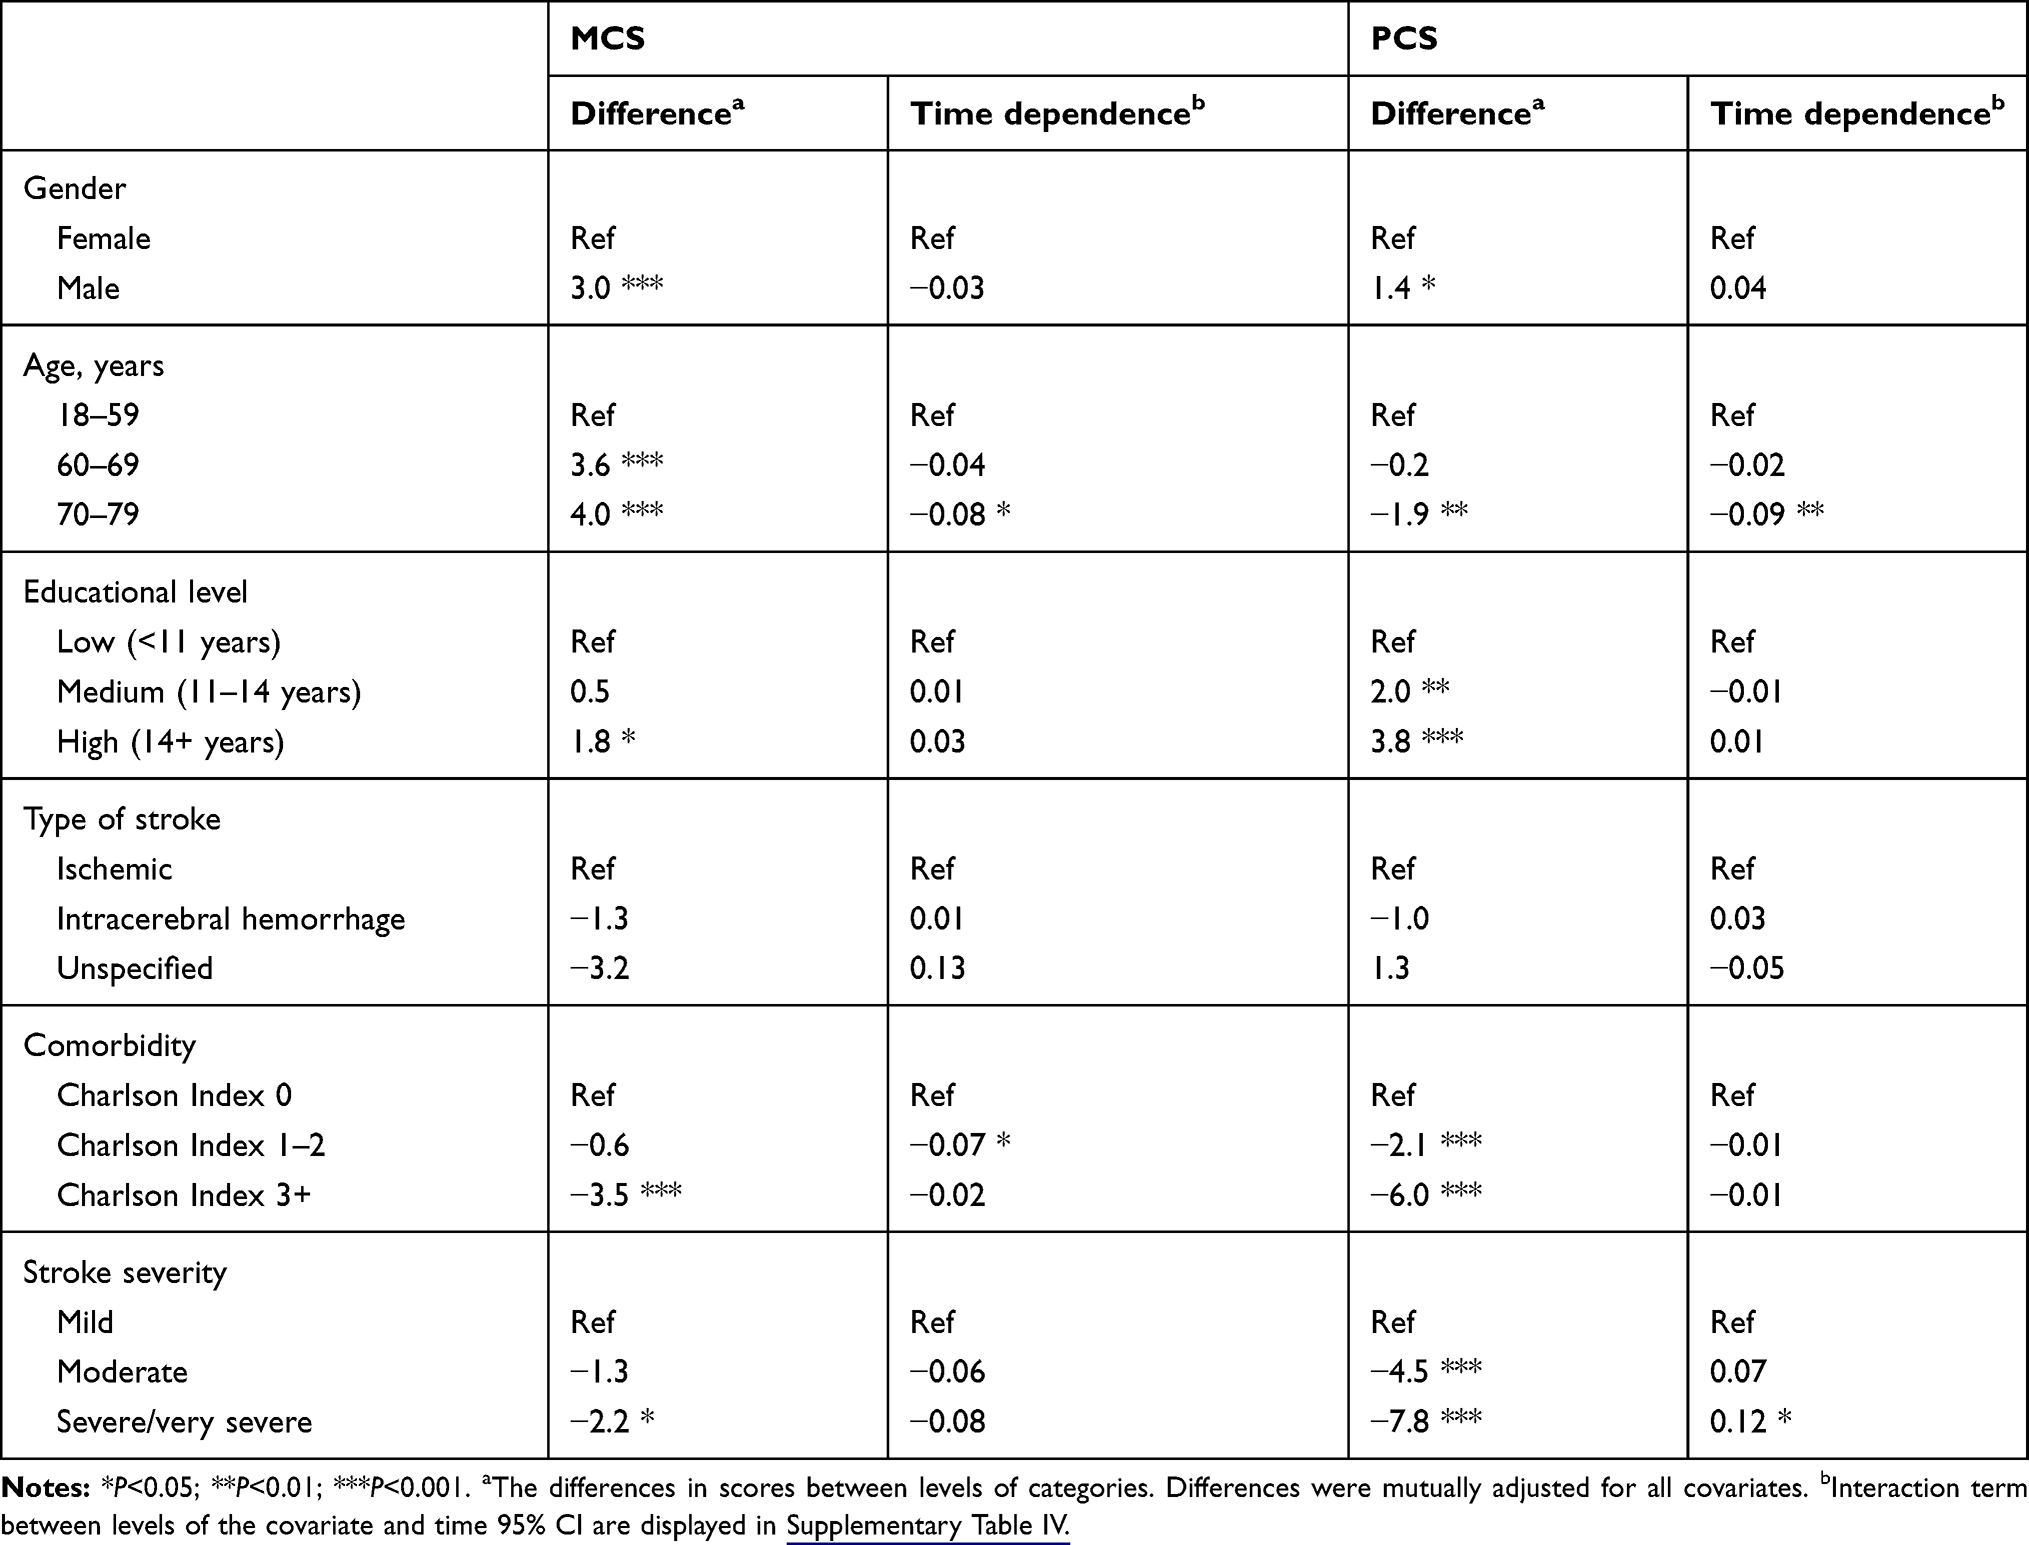 |
Table 5 Determinants of Courses of SF-12 Mental and Physical Component Summary (MCS/PCS) in a Cohort of 1613 Danish Stroke Patients |
Results from analysis based on imputed data of PCS and MCS scores were similar to those presented in Tables 3 and 4. The results for MCS are presented in Supplementary Table V.
Courses of the SF-12 Sub-Scales
Mean values of the majority of SF-12 sub-scales improved statistical significance during follow-up (Table 6). The largest improvements were found in the domains of physical limitations (Role Physical) and Vitality, with improvements of 2.1 points/year corresponding to nearly one half standard deviation within the 2 year period of follow-up. For these sub-scales the improvements were most marked during the first 6 months after onset of the stroke (Table 6). No improvements were found in Bodily Pain or Physical Functioning, while the remaining four sub-scales had smaller, but statistically significant, improvements.
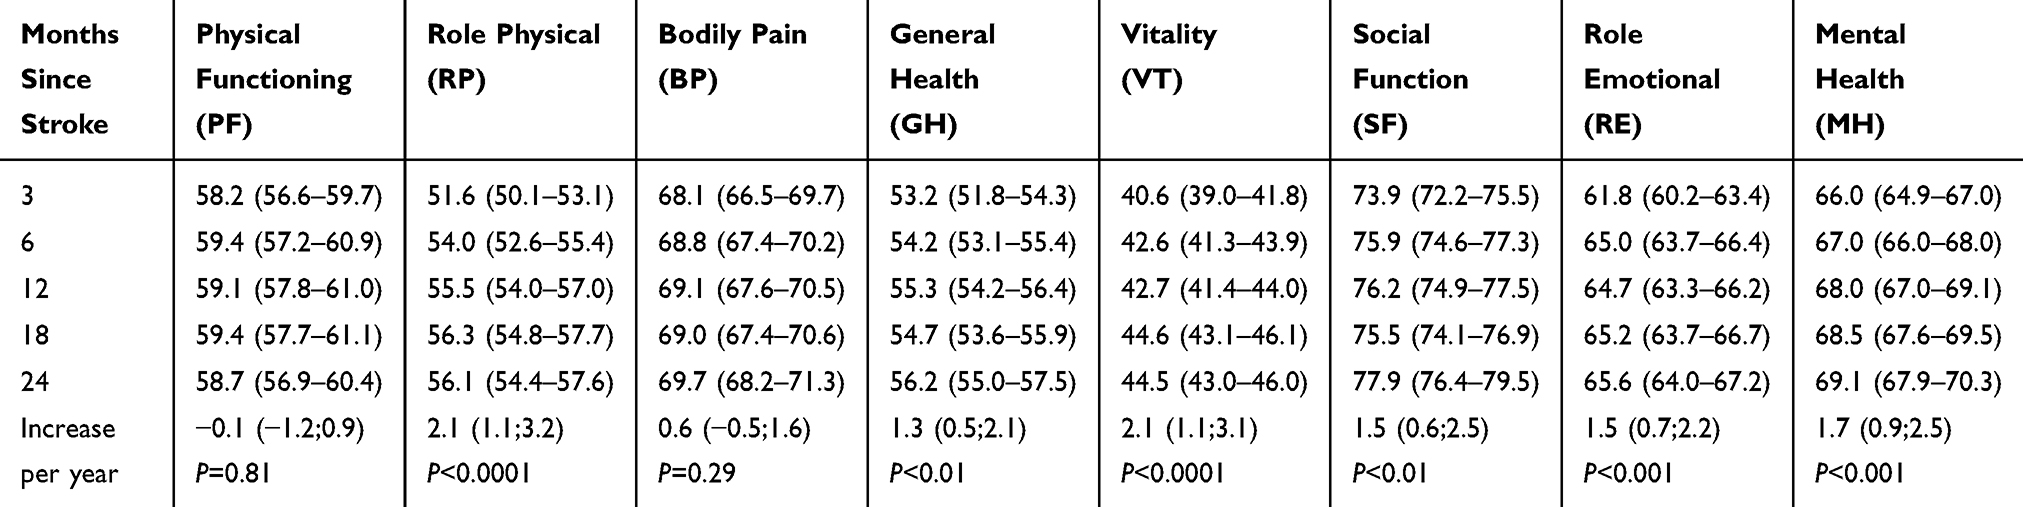 |
Table 6 Unadjusted Means (95% CI) of SF-12 Subscales at Each Time Point of Follow-Up in a Cohort of 2414 Danish First-Time Stroke Patients |
Discussion
In a geographically defined population of first-time stroke patients, the mean values of the majority of SF-12 subscales and summary scores for mental health improved statistically significantly during a follow-up period of 2 years. The largest improvements were found in the domains of Vitality and Role Physical. For all scales, the improvements were most pronounced during the first 6 months after the stroke. Variables associated with good mental health were male gender, high age, and no comorbidity, while high educational level, young age, mild stroke severity, and no comorbidity were associated with higher ratings of physical health. Overall, comorbidity and stroke severity were the most important determinants of anunfavorable course of self rated health.
Our study supports previous findings that the progress achieved mentally and physically more than 3 months after the stroke are relatively sparse. Both Haley et al6, and Suenkeler et al39 found a decrease in self-rated health in the timespan from 1–4 years after the stroke. Other studies found, as we did, some improvements or steady state in self-rated health in the time after a stroke.40–42
Scandinavian Stroke Scale scores typically deteriorate in about 1/3 of patients with intracerebral hemorrhage within the first days.43 Contrary, some patients with ischemic stroke experience a marked improvement after thrombolytic therapy.44 We only had access to data on SSS obtained at admission and not at discharge, and for that reason the association between SSS and self-rated health among patients with intracerebral hemorrhage might have been attenuated.
While the majority of the stroke patients were men, female patients rated their mental and physical health significantly lower than men at all times of measurement, most pronounced for mental health. The difference between genders was relatively constant during follow-up, and gender was not a predictor for change, which is consistent with findings in other studies.6,7,40 However, Muus et al45 found in a Danish study female patients to recover more slowly than men, and male gender to be a strong determinant for deterioration in HRQoL in comparison with the pre-stroke state. This difference may be due to different ways of measuring self-rated health.
While higher age was associated with better mental health, a negative effect of age was found for physical health. The positive effect on mental health attenuated over time while the negative effect on physical health tended to become stronger. Also in the general population, older age is associated with high mental health and low physical health.6,31 Similar results in stroke patients have previously been reported.9,14 We also found higher age associated with less improvement of self-rated health compared to younger patients. Previous studies did not find age associated with the time course of self-rated health after stroke, which may be due to small sample sizes in these studies.6,7,40,45
Higher educational level or socioeconomic status has previously been reported to be associated with better self-reported health after stroke.9 We found a time-stable dose–response pattern in the association between educational level and physical health, where patients with a higher educational level rated their physical health higher.
The high level of comorbidity had a strong and time-stable impact on physical as well as mental health. Most other studies analyzed comorbidity by single diseases and found varying results. We used a systematic and register based method to assess comorbidity, which may explain the stronger effect in this study.
After experiencing a stroke, patients may lower their expectations to the future, which may have influenced the patients rating of own health after stroke. High scores on the SF-12 scale could possibly reflect a response shift, ie, that after a stroke patients lower their expectations, and change their frame of reference to what is good quality-of-life. Previous studies did not find differences in responses when comparing stroke patients to older stroke-free patients, indicating that the change in self-rated health over time among stroke patients was real, rather than a result of response shift.46,47
This patient cohort was geographically well defined, was large, and had a long follow-up with a multitude of measurement points and with comprehensive information obtained from national registries. The study comprised more than 2,000 first time stroke patients and is thus by far the largest cohort study of stroke patients in terms of number of patients as well as the number of measurements. Only two other studies included more than 500 patients,4,48 with 612 as the largest number of participating patients,48 and in these studies only two and one measurement points, respectively, were applied. However, some limitations should be considered. We did not have measurements of self-rated health for the first 3 months, and our findings do not apply to stroke patients admitted from nursing homes. Furthermore, we did not include patients over 80 years, accounting for approximately 29% of all acute stroke patients,49 because we anticipated a low response rate in this group. However, the correlation between age and response rate was weak, so in future studies we recommend to consider a higher age cut-off or to omit any age criterium. We did not send reminders to non-responders because we thought that this may provoke an active decision of not to participate. Instead we send a new short questionnaire after 3 months. This has probably increased the number of participating patients, but also increased the number of missing data in the measure of self-rated health at each time point. Seventy-five percent of patients alive after 3 months returned at least one questionnaire. However, the initial response-rate and the following attrition constitute the main weakness of the study since drop out is likely to be differential. Low and differential participation rates in cohorts of patients with severe chronic is a well known problem. However, results based on the original and the imputed dataset were largely similar, which indicates missing data as a minor problem in this study and the two different analytic approaches we applied to deal with missing data (mixed models and multiple imputation) gave similar results with respect to the determinants.
Conclusion
Stroke is a disease with long-term consequences on a wide range of health aspects. Small improvements in self-rated mental health may be observed during the first 2 years after the stroke. Level as well as course differs between sub-groups, and careful treatment of comorbidity may be an important target with respect to rehabilitation.
Funding
This research was supported by The Health Foundation (grant # 10-B-0045) and a 2/3 fellowship from the Faculty of Health (grant # 2010-218/2-71), Aarhus University, Aarhus, Denmark.
Disclosure
The authors declare that there is no conflict of interest.
References
1. Rajsic S, Gothe H, Borba HH, et al. Economic burden of stroke: a systematic review on post-stroke care. Eur J Health Econ. 2019;20:107–134. doi:10.1007/s10198-018-0984-0
2. GBD 2016 Stroke Collaborators. Global, regional, and national burden of stroke, 19902016: a systematic analysis for the Global Burden of Disease Study 2016. Lancet Neurol. 2019;18(5):439–458. doi:10.1016/S1474-4422(19)30034-1
3. De Wit L, Theuns P, Dejaeger E, et al. Long-term impact of stroke on patients’ health-related quality of life. Disabil Rehabil. 2017;39:1435–1440. doi:10.1080/09638288.2016.1200676
4. Mayo NE, Wood-Dauphinee S, Cote R, et al. Activity, participation, and quality of life 6 months poststroke. Arch Phys Med Rehabil. 2002;83:1035–1042. doi:10.1053/apmr.2002.33984
5. Anderson CS, Carter KN, Brownlee WJ, et al. Very long-term outcome after stroke in Auckland, New Zealand. Stroke. 2004;35:1920–1924. doi:10.1161/01.STR.0000133130.20322.9f
6. Haley WE, Roth DL, Kissela B, et al. Quality of life after stroke: a prospective longitudinal study. Qual Life Res. 2011;20:799–806. doi:10.1007/s11136-010-9810-6
7. Naess H, Waje-Andreassen U, Thomassen L, et al. Health-related quality of life among young adults with ischemic stroke on long-term follow-up. Stroke. 2006;37:1232–1236. doi:10.1161/01.STR.0000217652.42273.02
8. White J, Magin P, Attia J, et al. Predictors of health-related quality of life in community-dwelling stroke survivors: a cohort study. Fam Pract. 2016;33:382–387. doi:10.1093/fampra/cmw011
9. Almborg AH, Ulander K, Thulin A, et al. Discharged after stroke - important factors for health-related quality of life. J Clin Nurs. 2010;19:2196–2206. doi:10.1111/j.1365-2702.2010.03251.x
10. Aprile I, Piazzini DB, Bertolini C, et al. Predictive variables on disability and quality of life in stroke outpatients undergoing rehabilitation. Neurol Sci. 2006;27:40–46. doi:10.1007/s10072-006-0563-5
11. Carod-Artal FJ. Determining quality of life in stroke survivors. Expert Rev Pharmacoecon Outcomes Res. 2012;12:199–211. doi:10.1586/erp.11.104
12. Carod-Artal FJ, Trizotto DS, Coral LF, et al. Determinants of quality of life in Brazilian stroke survivors. J Neurol Sci. 2009;284:63–68. doi:10.1016/j.jns.2009.04.008
13. Gunaydin R, Karatepe AG, Kaya T, et al. Determinants of quality of life (QoL) in elderly stroke patients: a short-term follow-up study. Arch Gerontol Geriatr. 2011;53:19–23. doi:10.1016/j.archger.2010.06.004
14. Jonsson AC, Lindgren I, Hallstrom B, et al. Determinants of quality of life in stroke survivors and their informal caregivers. Stroke. 2005;36:803–808.
15. Laurent K, De Seze MP, Delleci C, et al. Assessment of quality of life in stroke patients with hemiplegia. Ann Phys Rehabil Med. 2011;54:376–390. doi:10.1016/j.rehab.2011.06.002
16. Morris JH, van Wijck F, Joice S, et al. Predicting health related quality of life 6 months after stroke: the role of anxiety and upper limb dysfunction. Disabil Rehabil. 2013;35:291–299. doi:10.3109/09638288.2012.691942
17. Patel MD, McKevitt C, Lawrence E, et al. Clinical determinants of long-term quality of life after stroke. Age Ageing. 2007;36:316–322.
18. Haacke C, Althaus A, Spottke A, et al. Long-term outcome after stroke: evaluating health-related quality of life using utility measurements. Stroke. 2006;37:193–198. doi:10.1161/01.STR.0000196990.69412.fb
19. Larsen LP, Biering K, Johnsen SP, et al. Self-rated health and return to work after first-time stroke. J Rehabil Med. 2016;48:339–345. doi:10.2340/16501977-2061
20. Larsen LP, Johnsen SP, Andersen G, Hjollund NH. Determinants of self-rated health 3 months after stroke. J Stroke Cerebrovasc Dis. 2016;25:1027–1034. doi:10.1016/j.jstrokecerebrovasdis.2015.12.014
21. Regions of Denmark (Danske Regioner). Danish regions; 2019. Available from: https://www.regioner.dk/services/in-english.
22. Mainz J, Bartels PD, Laustsen S, et al. The National Indicator Project for monitoring and improvement of professional performance within health care. Ugeskr Laeger. 2001;163:6401–6406.
23. Mainz J, Krog BR, Bjornshave B, et al. Nationwide continuous quality improvement using clinical indicators: the Danish National Indicator Project. Int J Qual Health Care. 2004;16(Suppl 1):i4550. doi:10.1093/intqhc/mzh031
24. Ingeman A, Andersen G, Hundborg HH, et al. Medical complications in patients with stroke: data validity in a stroke registry and a hospital discharge registry. Clin Epidemiol. 2010;2:5–13. doi:10.2147/CLEP.S8908
25. Pedersen CB. The Danish Civil Registration System. Scand J Public Health. 2011;39:22–25. doi:10.1177/1403494810387965
26. Almborg AH, Berg S. Quality of life among Swedish patients after stroke: psychometric evaluation of SF-36. J Rehabil Med. 2009;41:48–53. doi:10.2340/16501977-0287
27. Dorman P, Slattery J, Farrell B, et al. Qualitative comparison of the reliability of health status assessments with the EuroQol and SF-36 questionnaires after stroke. United Kingdom Collaborators in the International Stroke Trial. Stroke. 1998;29:63–68. doi:10.1161/01.STR.29.1.63
28. Anderson C, Laubscher S, Burns R. Validation of the short form 36 (SF-36) health survey questionnaire among stroke patients. Stroke. 1996;27:1812–1816. doi:10.1161/01.STR.27.10.1812
29. Jenkinson C, Layte R, Jenkinson D, et al. A shorter form health survey: can the SF-12 replicate results from the SF-36 in longitudinal studies? J Public Health Med. 1997;19:179–186. doi:10.1093/oxfordjournals.pubmed.a024606
30. Ware JE
31. Bjørner JB, Damsgaard MT, Watt T, Bech P. Danish Guidelines to SF-36.
32. United Nations educational, scientific and cultural organization (UNESCO). International Standard Classification of Education (ISCED); 2006. Available from: http://uis.unesco.org/sites/default/files/documents/international-standard-classification-of-education-1997-en_0.pdf.
33. Hjollund NH, Larsen FB, Andersen JH. Register-based follow-up of social benefits and other transfer payments: accuracy and degree of completeness in a Danish interdepartmental administrative database compared with a population-based survey. Scand J Public Health. 2007;35:497–502. doi:10.1080/14034940701271882
34. Barber M, Fail M, Shields M, et al. Validity and reliability of estimating the scandinavian stroke scale score from medical records. Cerebrovasc Dis. 2004;17:224–227.
35. Govan L, Langhorne P, Weir CJ. Categorizing stroke prognosis using different stroke scales. Stroke. 2009;40:3396–3399. doi:10.1161/STROKEAHA.109.557645
36. Charlson ME, Pompei P, Ales KL, et al. A new method of classifying prognostic comorbidity in longitudinal studies: development and validation. J Chronic Dis. 1987;40:373–383. doi:10.1016/0021-9681(87)90171-8
37. Andersen TF, Madsen M, Jorgensen J, et al. The Danish National Hospital Register. A valuable source of data for modern health sciences. Dan Med Bull. 1999;46:263–268.
38. Twisk J, de Boer M, de Vente W, et al. Multiple imputation of missing values was not necessary before performing a longitudinal mixed-model analysis. J Clin Epidemiol. 2013;66:1022–1028. doi:10.1016/j.jclinepi.2013.03.017
39. Suenkeler IH, Nowak M, Misselwitz B, et al. Timecourse of health-related quality of life as determined 3, 6 and 12 months after stroke. Relationship to neurological deficit, disability and depression. J Neurol. 2002;249:1160–1167. doi:10.1007/s00415-002-0792-3
40. Ronning OM, Stavem K. Determinants of change in quality of life from 1 to 6 months following acute stroke. Cerebrovasc Dis. 2008;25:67–73. doi:10.1159/000111524
41. Katona M, Schmidt R, Schupp W, et al. Predictors of health-related quality of life in stroke patients after neurological inpatient rehabilitation: a prospective study. Health Qual Life Outcomes. 2015;13:5801502589. doi:10.1186/s12955-015-0258-9
42. Skaner Y, Nilsson GH, Sundquist K, et al. Self-rated health, symptoms of depression and general symptoms at 3 and 12 months after a first-ever stroke: a municipality-based study in Sweden. BMC Fam Pract. 2007;8:61. doi:10.1186/1471-2296-8-61
43. Davis SM, Broderick J, Hennerici M, et al. Hematoma growth is a determinant of mortality and poor outcome after intracerebral hemorrhage. Neurology. 2006;66:1175–1181. doi:10.1212/01.wnl.0000208408.98482.99
44. Dirks M, Niessen LW, van Wijngaarden J, et al. The effectiveness of thrombolysis with intravenous alteplase for acute ischemic stroke in daily practice. Int J Stroke. 2012;7:289–292. doi:10.1111/j.1747-4949.2011.00709.x
45. Muus I, Petzold M, Ringsberg KC. Health-related quality of life among Danish patients 3 and 12 months after TIA or mild stroke. Scand J Caring Sci. 2010;24:211–218. doi:10.1111/j.1471-6712.2009.00705.x
46. Barclay R, Tate RB. Response shift recalibration and reprioritization in health-related quality of life was identified prospectively in older men with and without stroke. J Clin Epidemiol. 2014;67:500–507. doi:10.1016/j.jclinepi.2013.12.003
47. Ahmed S, Mayo NE, Corbiere M, et al. Change in quality of life of people with stroke over time: true change or response shift? Qual Life Res. 2005;14:611–627.
48. Muller-Nordhorn J, Nolte CH, Rossnagel K, et al. The use of the 12-item short-form health status instrument in a longitudinal study of patients with stroke and transient ischaemic attack. Neuroepidemiology. 2005;24:196–202. doi:10.1159/000084712
49. Ingeman A, Andersen G, Thomsen RW, et al. Lifestyle factors and early clinical outcome in patients with acute stroke: a population-based study. Stroke. 2017;48:611–617. doi:10.1161/STROKEAHA.116.015784
 © 2020 The Author(s). This work is published and licensed by Dove Medical Press Limited. The
full terms of this license are available at https://www.dovepress.com/terms
and incorporate the Creative Commons Attribution
- Non Commercial (unported, 3.0) License.
By accessing the work you hereby accept the Terms. Non-commercial uses of the work are permitted
without any further permission from Dove Medical Press Limited, provided the work is properly
attributed. For permission for commercial use of this work, please see paragraphs 4.2 and 5 of our Terms.
© 2020 The Author(s). This work is published and licensed by Dove Medical Press Limited. The
full terms of this license are available at https://www.dovepress.com/terms
and incorporate the Creative Commons Attribution
- Non Commercial (unported, 3.0) License.
By accessing the work you hereby accept the Terms. Non-commercial uses of the work are permitted
without any further permission from Dove Medical Press Limited, provided the work is properly
attributed. For permission for commercial use of this work, please see paragraphs 4.2 and 5 of our Terms.