")
Back to Journals » International Journal of Nanomedicine » Volume 16
Detection of PD-L1 Expression in Temozolomide-Resistant Glioblastoma by Using PD-L1 Antibodies Conjugated with Lipid‑Coated Superparamagnetic Iron Oxide
Authors Lee GA , Lin WL, Kuo DP, Li YT , Chang YW, Chen YC, Huang SW, Hsu JBK, Chen CY
Received 17 March 2021
Accepted for publication 16 July 2021
Published 31 July 2021 Volume 2021:16 Pages 5233—5246
DOI https://doi.org/10.2147/IJN.S310464
Checked for plagiarism Yes
Review by Single anonymous peer review
Peer reviewer comments 2
Editor who approved publication: Professor Israel (Rudi) Rubinstein
Gilbert Aaron Lee,1,2 Wan-Li Lin,1 Duen-Pang Kuo,3 Yi-Tien Li,4,5 Yu-Wei Chang,1 Yung-Chieh Chen,4,6 Shiu-Wen Huang,1,7,8 Justin Bo-Kai Hsu,1 Cheng-Yu Chen3,4,6,9
1Department of Medical Research, Taipei Medical University Hospital, Taipei, Taiwan; 2Department of Microbiology and Immunology, School of Medicine, College of Medicine, Taipei Medical University, Taipei, Taiwan; 3Department of Medical Imaging, Taipei Medical University Hospital, Taipei, Taiwan; 4Translational Imaging Research Center, Taipei Medical University Hospital, Taipei, Taiwan; 5Neuroscience Research Center, Taipei Medical University, Taipei, Taiwan; 6Research Center of Translational Imaging, College of Medicine, Taipei Medical University, Taipei, Taiwan; 7Department of Pharmacology, School of Medicine, College of Medicine, Taipei Medical University, Taipei, Taiwan; 8Graduate Institute of Medical Sciences, College of Medicine, Taipei Medical University, Taipei, Taiwan; 9Department of Radiology, School of Medicine, College of Medicine, Taipei Medical University, Taipei, Taiwan
Correspondence: Cheng-Yu Chen
Department of Radiology, School of Medicine, College of Medicine, Taipei Medical University, No. 251 Wu Hsing Street, Taipei City 110, Taipei, Taiwan
Email [email protected]
Purpose: Targeted superparamagnetic iron oxide (SPIO) nanoparticles are a promising tool for molecular magnetic resonance imaging (MRI) diagnosis. Lipid-coated SPIO nanoparticles have a nonfouling property that can reduce nonspecific binding to off-target cells and prevent agglomeration, making them suitable contrast agents for molecular MRI diagnosis. PD-L1 is a poor prognostic factor for patients with glioblastoma. Most recurrent glioblastomas are temozolomide resistant. Diagnostic probes targeting PD-L1 could facilitate early diagnosis and be used to predict responses to targeted PD-L1 immunotherapy in patients with primary or recurrent glioblastoma. We conjugated lipid-coated SPIO nanoparticles with PD-L1 antibodies to identify PD-L1 expression in glioblastoma or temozolomide-resistant glioblastoma by using MRI.
Methods: The synthesized PD-L1 antibody-conjugated SPIO (PDL1-SPIO) nanoparticles were characterized using dynamic light scattering, zeta potential assays, transmission electron microscopy images, Prussian blue assay, in vitro cell affinity assay, and animal MRI analysis.
Results: PDL1-SPIO exhibited a specific binding capacity to PD-L1 of the mouse glioblastoma cell line (GL261). The presence and quantity of PDL1-SPIO in temozolomide-resistant glioblastoma cells and tumor tissue were confirmed through Prussian blue staining and in vivo T2* map MRI, respectively.
Conclusion: This is the first study to demonstrate that PDL1-SPIO can specifically target temozolomide-resistant glioblastoma with PD-L1 expression in the brain and can be quantified through MRI analysis, thus making it suitable for the diagnosis of PD-L1 expression in temozolomide-resistant glioblastoma in vivo.
Keywords: PD-L1, superparamagnetic iron oxide, SPIO, magnetic resonance imaging, MRI, lipid-coated nanoparticle, glioblastoma
Background
Glioblastoma multiforme (GBM) has a harsh immunosuppressive microenvironment and poor prognosis.1,2 The presence of tumor-infiltrating cytotoxic T lymphocytes (CTLs) in the GBM tumor microenvironment is correlated with overall survival,3 and immunosuppressive responses are associated with poor prognosis.4 CTLs can specifically target and kill invading tumor cells.3 Myeloid-derived suppressor cells (MDSCs) and regulatory T cells (Tregs) possess high immunosuppressive capacity, directly suppress T cell function, and cause T cell exhaustion.5 Patients with a high level of CTLs and low levels of immunosuppressive MDSCs and Tregs were demonstrated to have better survival probability than those with a high immunosuppressive level.6 Taken together, the tumor immune profile is closely associated with the prognosis of patients with GBM.
Immune therapy targeting negative regulatory molecules at the immune inhibitory checkpoint axis (ie, programmed cell death protein 1 [PD-1] and its ligand [PD-L1]) has achieved breakthroughs in many cancers.7 PD-L1 is widely expressed in almost all tumor cells.8 PD-1 is the receptor of PD-L1 and is expressed on CTLs and natural killer (NK) cells. The PD-1/PD-L1 axis is the major pathway that inhibits the activation or proliferation of CTLs and NK cells in the tumor microenvironment.9–11 PD-L1-mediated immunosuppression in GBM is associated with M2 macrophage polarization and poor survival.12,13 The PD-L1 status of a tumor was reported to be correlated to the outcome of PD-L1 blockade, and responses were significantly higher in PD-L1-expressing tumors than in PD-L1-nonexpressing tumors.14 Thus, the PD-L1 level in GBM is considered a major predictive marker of PD-1/PD-L1 antibody response.15 Accurate detection of PD-L1 expression in GBM tissues may help predict PD-1/PD-L1 antibody response.
Due to intratumoral heterogeneity within different regions of individual tumors, a small piece of tumor biopsy may not represent the pathological molecular profile of the entire tumor.16,17 Various analytic strategies in immunohistochemistry and inconsistent cut-off values of PD-L1 expression may lead to false classification, depending on the area of a tumor biopsy sample that is examined.18,19 Thus, a standardized approach for quantifying PD-L1 expression in the whole tumor should be developed to improve consistency and accuracy in the measurement of PD-L1 in GBM. In addition, dynamic changes in immune cell populations and PD-L1 expression levels occur during chemotherapy or immune checkpoint blockade in multiple cancer types.20 The heterogeneity of the GBM tumor microenvironment in different subtypes of GBM, the limitations of immunohistochemistry, and the dynamic changes in the PD-L1 expression profile during treatment are current challenges in PD-L1 checkpoint blockade immunotherapy against GBM.16,21 Thus, the capacity to efficiently and precisely quantify the PD-L1 level in the whole tumor must be developed.
Superparamagnetic iron oxide (SPIO) nanoparticles that are biodegradable and exhibit low toxicity are suitable for biomedical imaging applications.22 SPIO nanoparticles can be manipulated to conjugate with functional groups for cross-linking with antibodies, peptides, or small-molecule drugs for diagnostic imaging or the delivery of therapeutic drugs.22 They possess unique paramagnetic properties and can serve as contrast agents for multiple parametric magnetic resonance imaging (MRI) modalities, including T2-, T2*-, and susceptibility-weighted imaging (SWI).23 To identify patients who may benefit from PD-L1-targeted therapy, evaluating the PD-L1 expression level and its distribution is critical. SPIO nanoparticles have many benefits in biomedical imaging applications, including tunable size-dependent magnetic properties, easy modification, and a lack of ionizing radiation.23,24 Nonfouling lipid-coated surfaces can effectively reduce nonspecific binding to synthesized ex vivo surfaces.25–27 In the present study, we manipulated lipid-coated SPIO nanoparticles for conjugation with PD-L1 antibodies (PDL1-SPIO) to detect PD-L1 expression by using both in vitro and in vivo MRI. We demonstrated that PDL1-SPIO could specifically target PDL1-positive GBM cells and generate distinguishable molecular MRI images for noninvasive PD-L1 expression measurement in temozolomide (TMZ)-resistant GBM in vivo.
Materials and Methods
Construction of PDL1-SPIO Nanoparticles
The PDL1-SPIO nanoparticles were constructed as previously described27 with some modifications. Briefly, 0.25 mL of amine-functionalized lipid-coated SPIO nanoparticles (OceanNanoTech Inc. USA, 1 mg/mL [Fe)] = 0.86 nmol/mL nanoparticles, 10 nm in size) was reacted with 37.5 μL/mL sulfo-SMCC (10 mg/mL, 858 nmol) at room temperature for 1 h to obtain maleimide-functionalized SPIO nanoparticles. The maleimide-functionalized SPIO nanoparticles were washed with 10 mL of phosphate buffered saline (PBS) to remove the excess free sulfo-SMCC by using an LS column (Miltenyi Biotech, Germany) and were then eluted in 800 μL of PBS. Subsequently, 0.43 nmol PD-L1 antibodies (10F.9G2, BioXCell, USA) were treated with iminothiolane (1.2 μg, 8.7 nmol; Thermo, USA), dissolved in 200 μL of Traut’s reagent (50 mM NaHCO3, 150 mM NaCl, and 10 mM EDTA, pH 8.6), and reacted at room temperature for 60 min. After thiolation, 200 μL of 10 mM tris(2-carboxyethyl)phosphine (TCEP; Sigma, USA) was added at room temperature for 30 min. The solution was replaced with a 5 mM EDTA solution in PBS via Vivaspin (10-kDa MWCO polyethersulfone, Sartorius, USA). Finally, the thiolated antibodies and maleimide-functionalized SPIO nanoparticles were mixed and reacted at 4 °C overnight. The unused maleimide-functionalized groups were then blocked with excess cysteine for 15 min at room temperature. The PD-L1 antibody–conjugated SPIO nanoparticles were separated using an LS column and washed with PBS at a volume 25 times greater than the column bed volume to remove unconjugated antibodies; the nanoparticles were then eluted in 600 μL of PBS. The number of immobilized PDL1 antibodies per SPIO nanoparticle was estimated to be two, based on the molarities of the components in the reaction. The total amounts of PD-L1 antibody and SPIO in the PDL1-SPIO were determined by using the intrinsic fluorescence of the amino acid in the antibody structure (excitation at 280 nm and emission at 340 nm) and by using a spectrophotometric technique (absorption at 400 nm), respectively. The fluorescence and absorption signals were determined by using the Thermo Varioskan Flash (Thermo, USA) and the Multiskan GO Microplate Spectrophotometer (Thermo, USA), respectively.
Dynamic Light Scattering and Zeta Potential Measurement
The hydrodynamic size and zeta potential of the SPIO and PDL1-SPIO nanoparticles were determined using a Zetasizer Nano ZS (Malvern Instruments, UK) according to manufacturer instructions. The nanoparticles were diluted in a 10 mM NaCl solution.
Generation of the GL261/TMZ-R Cell Line
The murine GBM cell line (GL261) was obtained from Deutsche Sammlung von Mikroorganismen und Zellkulturen. Cells were cultured in Dulbecco’s modified Eagle’s medium (DMEM) supplemented with 10% fetal bovine serum (FBS). We established a TMZ-resistant subline (GL261/TMZ-R) through continuous exposure of GL261 cells to TMZ in our lab. These cells were treated with 50 μM TMZ for 1 day before being divided into 96 wells. Cells were incubated with 150 μM TMZ for 21 days, and surviving cells were cultured in the culture medium containing 150 μM TMZ for an additional 39 days.
Colony Formation Assay
We placed 2000 GL261 or GL261/TMZ-R cells into six-well plates and incubated them for 5 days, followed by treatment with 150 μM TMZ (Cayman, USA) for 12 days. The cells were fixed with 4% paraformaldehyde and stained with 0.5% crystal violet, and the colony number was counted.
Brain Tumor Animal Model
For the GL261/TMZ-R GBM animal model, C57BL/6JNarl mice were purchased from the National Laboratory Animal Center. The tumor cell inoculation assay was conducted as described. Briefly, 1.5 × 10⁵ GL261/TMZ-R cells in 4 μL of PBS solution were slowly injected into the right-brain region at a rate of 0.5 μL/min. The injection site was 2.5 mm lateral, 0.1 mm posterior, and 3.1 mm ventral from the central bregma. The injection hole was sealed with bone wax to prevent the leakage of cells, and the skin was closed with sterilized sutures.
Isolation of Tumor-Infiltrating Leukocytes
To isolate brain-infiltrating leukocytes, we anesthetized mice and transcardially perfused them with 5 mL of cold PBS. Tumor-infiltrating leukocytes were dissociated into single-cell suspensions by using a Tumor Dissociation Kit and a Multi Tissue Dissociation Kit 1 (Miltenyi Biotec, Germany) in combination with the gentle MACS Octo Dissociator with Heaters (Miltenyi Biotec, Germany).
Flow Cytometry
To detect the PD-L1 expression on GL161 cells, cells were detached using Accutase (Thermo Fisher Scientific, USA) and then stained with PDL1-SPIO nanoparticles, SPIO nanoparticles, PDL1 antibodies, or isotype control antibodies, followed by PE-conjugated anti-rat IgG2b antibodies (MRG2b-85, BioLegend, USA). To detect PD-L1 expression on brain-infiltrating leukocytes, cells were stained with specific antibodies following standard protocols and analyzed on a CytoFLEX flow cytometer (Beckman Coulter, USA). The following antibodies conjugated with fluorochrome were used: Ly6G-PB (RB6-8C5), Ly6C-FITC (HK1.4), CD45-APC-Cy7, (30-F11), CD11b-PB (M1/70), and PD-L1-PE (10F.9G2) (BioLegend, USA). Data were analyzed using FlowJo software.
Immunofluorescence Assay
To detect PD-L1 expression in GL161 cells, 105 GL261 cells were seeded on a four-well chamber slide for 24 h. Cells were treated with SPIO nanoparticles, PDL1-SPIO nanoparticles, PDL1 antibodies, or isotype control antibodies for 24 h at 37 °C and then fixed with 4% paraformaldehyde for 30 min. Slides were then stained with AF-488 anti-mouse Rat IgG2b antibody and mounted with a mounting medium containing 4’6-diamidino-2-phenylindole (DAPI) (Vectashield, USA). Immunofluorescence (IF) images of stained cells were acquired through microscopy (Olympus/Bx43, Japan).
Prussian Blue Staining Assay for GBM Cells and TEM for SPIO Nanoparticles
To identify iron in GBM cells by using Prussian blue staining, 105 GL261 cells were seeded on a four-well chamber slide (SPL Life Sciences Co., USA) with DMEM supplemented with 10% FBS for 24 h. Next, cells were treated with SPIO or PDL1-SPIO nanoparticles and incubated at 37 °C for 24 h. The presence of iron was detected using an Abcam iron stain kit (ab150674, Abcam, USA). In brief, hydrochloric acid solution (2%) and potassium ferrocyanide solution were mixed at equal volumes (1:1) and used to incubate with cells or tumor tissue slides for 20 min; the cells or slides were then rinsed with distilled water and stained with nuclear fast red. Images of stained cells were acquired using a microscope (Olympus BX43). Transmission electron microscopy (TEM) images were acquired using an HT-7700 microscope (Hitachi, Japan), and the analysis was performed according to the manufacturer’s instructions.
Detection of Iron in GBM Tissues Treated with PDL1-SPIO Nanoparticles by Using Prussian Blue Staining Assay
To test the binding of PDL1-SPIO nanoparticles to tumor tissue, PDL1-SPIO nanoparticles were used to stain tumor slices, after which a Prussian blue staining assay was performed. Briefly, GL261/TMZ-R tumor-bearing mice were sacrificed and transcardially perfused with 5 mL of PBS and 5 mL of formalin. Whole brains were fixed with formalin for approximately 3 days. Formalin-fixed 2-mm coronal slices were embedded in paraffin and cut into 5-μm-thick sections. The sections were then deparaffinized, rehydrated through a graded series of ethanol solutions, subjected to an antigen retrieval process, and then stained using PDL1-SPIO or SPIO nanoparticles at 4 °C for 24 h. The presence of iron in these sections was detected using an Abcam iron stain kit. These sections were observed through microscopy (Olympus/BX43). In some experiments, after tumor-bearing mice were injected with PDL1-SPIO nanoparticles or PDL1 antibodies for 4 h, the brains were directly subjected to a Prussian blue assay to detect the presence of iron caused by PDL1-SPIO nanoparticles in the tumor tissue.
Immunohistochemistry Assay
To identify PD-L1 expression in tumor tissue, formalin-fixed sections underwent deparaffinized, rehydration, and an antigen retrieval process and then were stained using the PD-L1 antibody (Cell Signaling, USA) at 4 °C for 24 h. Next, the secondary antibody, horseradish peroxidase anti-rabbit IgG antibody, was applied to stain the section. Finally, 3,3’-diaminobenzidine staining was performed on sections by using DAB Chromogen Concentrate (Biolegend, USA). The sections were observed through microscopy (Olympus/BX43).
Cellular MRI Measurements
MRI images were obtained using a 7T Bruker PharmaScan MRI scanner having a volume coil with an inner diameter of 72 mm (Bruker BioSpin, MA, USA). T2-weighted images were acquired using spin-echo sequences with an echo time (TE) of 8.8 ms, a repetition time (TR) of 3500 ms, 50 echoes, a field of view (FOV) of 50×50 mm2, a resolution of 256 × 256, and a slice thickness of 1 mm. The MRI samples were PDL1-SPIO nanoparticle phantoms and GL261 cells treated with various concentrations of PDL1-SPIO nanoparticles and then suspended in 1% agarose gel.
Animal MRI Measurements
In vivo MRI images of mouse brains were obtained using a 7T Bruker PharmaScan MRI scanner using a volume coil with an inner diameter of 72 mm (Bruker BioSpin). MRI was performed in mice anesthetized using 2% isoflurane in the coronal plane. The MRI protocol included a T2-weighted image (TR, 2500 ms; TE, 33 ms; flip angle, 45°; FOV, 16×16 mm2; matrix, 256 × 256; 2D; slice thickness, 0.75 mm; number of excitations, 8; resolution, 0.0625×0.0625 × 0.75 mm3), a T2*-weighted image (TR, 1000 ms; TE, 12 ms; flip angle; FOV, 16×16 mm2; matrix, 256 × 256; 2D; slice thickness, 0.75 mm; number of excitations, 2; resolution, 0.0625×0.0625 × 0.75 mm3), SWI (TR, 39 ms; TE, 51.8 ms; flip angle, 15°; FOV, 50×50 mm2; matrix, 128 × 128; 3D; slice thickness, 0.5 mm; number of excitations, 3; resolution 0.39×0.39 × 0.5 mm3), and T2* mapping (16-echo gradient echo sequence; TR, 1150 ms; minimum TE, 3.3 ms; ∆TE, 3 ms; flip angle, 80°; FOV, 16×16 mm2; matrix, 256 × 256; 2D; slice thickness, 0.5 mm; number of excitations, 2; resolution, 0.0625×0.0625 × 0.5 mm3). The initial T2* mapping scan was performed before injection of PDL1-SPIO or SPIO nanoparticles. The second T2* mapping session was started 4 h after injection. The T2* value of each voxel was calculated through exponential fitting performed in-house by using MATLAB (version R2020a, MathWorks, Sherborn, MA, USA). The T2* map was first converted to an R2* relaxivity map by taking its reciprocal. The increase in R2* value (∆R2*) after PDL1-SPIO or SPIO injection was calculated using the following formulas: ∆R2* = R2* PDL1-SPIO – R2* pre or ∆R2* = R2* SPIO – R2* pre, where R2*pre refers to the R2* value measured in precontrast MR images, and R2*PDL1-SPIO or R2*SPIO are the R2* values measured in MR images following PDL1-SPIO or SPIO administration. The ∆R2* value, which indicates the change in relaxivity due to the local aggregation of PDL1-SPIO or SPIO nanoparticles, has a linear relationship with the local PDL1-SPIO or SPIO nanoparticle concentration. The coefficient of the linear transformation function between ∆R2* and the local PDL1-SPIO or SPIO nanoparticle concentration was estimated through linear regression analysis of agarose phantoms containing various concentrations of PDL1-SPIO or SPIO nanoparticles. The ∆R2* map was then converted into a local PDL1-SPIO or SPIO nanoparticle concentration map by using the estimated linear transformation function. A disk of nickel-coated neodymium iron boron (Nd2Fe14B) with a diameter of 8 mm, a height of 5 mm, and a 0.43-T N42 grade magnet was placed on the tumor site of tumor-bearing mice. After placing the magnet, 60 μg (0.052 pmol) of PDL1-SPIO or SPIO nanoparticles was administered via tail vein injection. The magnet was maintained on the tumor site for 1 h and then removed. MRI scans were performed at the indicated time. A radiologist evaluated the MRI images to identify dark signals due to PDL1-SPIO nanoparticles on T2-weighted images, T2*-weighted images, SWI, and T2* mapping.
Results
Characterization of PDL1‑SPIO Nanoparticles
To generate an MRI contrast agent with targeting specificity for PD-L1, the PD-L1 antibody was conjugated with 10-nm lipid-coated SPIO nanoparticles (Figure 1). In brief, the amine-functionalized lipid-coated SPIO nanoparticles were reacted with sulfo-SMCC to obtain maleimide-functionalized SPIO nanoparticles. PD-L1 antibodies were treated with iminothiolane to form free thiol groups before spontaneous reaction with the maleimide-functionalized lipid-coated SPIO nanoparticles. This coupling strategy enabled direct robust covalent conjugation of the PD-L1 antibodies to SPIO nanoparticles. We first determined the hydrodiameter of PDL1-SPIO, which peaked at 25.8 ± 1.8 nm on the volume distribution graph, and unconjugated lipid-coated SPIO nanoparticles, which peaked at 21.9 ± 1.4 nm (Figure 2A). We also determined the diameters of SPIO nanoparticles and PDL1-SPIO by using TEM; the diameters were observed to be 11.2 ± 0.6 nm and 12.7 ± 0.7 nm, respectively (Figure 2B), and the zeta potentials of SPIO nanoparticles and PDL1-SPIO peaked at −7.8 ± 0.9 mV and −24.5 ± 3.3 mV, respectively (Figure 2C). We determined that the amount of PD-L1 antibody on SPIO was 0.09 μg of PD-L1 antibody/μg of SPIO (0.685 nmol PD-L1 antibody/nmol SPIO). We also determined that a higher density of anti-PD-L1 antibody on SPIO causes PDL1-SPIO aggregation in the solution (data not shown). These data suggest that the colloidal dispersion of PDL1-SPIO is more stable than that of SPIO nanoparticles and PDL1-SPIO does not aggregate.
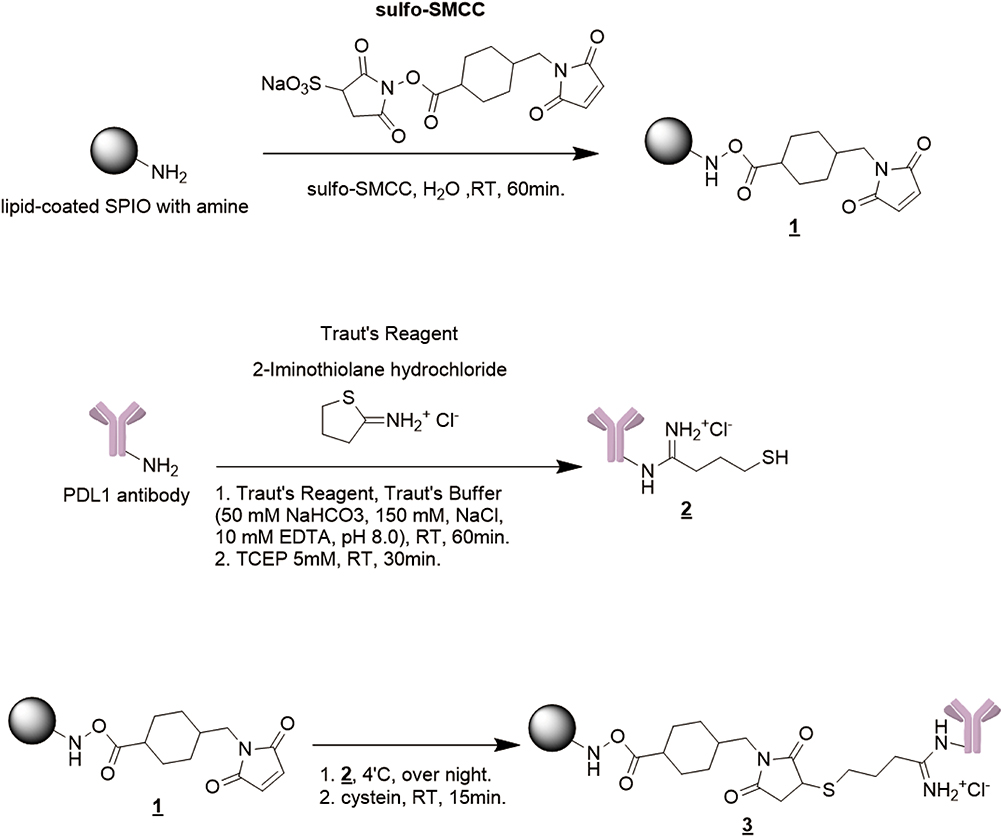 |
Figure 1 Synthetic scheme of PD-L1 antibodies conjugated with lipid-coated SPIO nanoparticles. 1. Lipid-coated SPIO nanoparticles were modified with maleimide through reaction with sulfo-SMCC. 2. PD-L1 antibodies were thiolated with iminothiolane, and TCEP was added to reduce disulfide bonds. 3. The maleimide-functionalized SPIO nanoparticles were mixed with the thiolated antibody solution to form antibody-conjugated lipid-coated SPIO nanoparticles. |
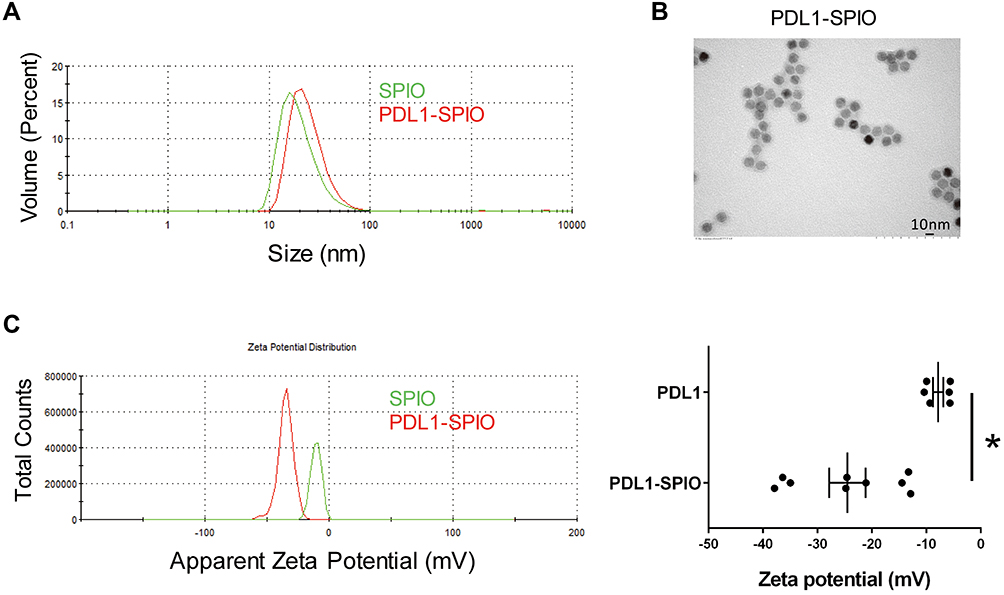 |
Figure 2 Characterization of the physical properties of PDL1-SPIO nanoparticles. (A) The size distributions of PDL1-SPIO and unconjugated SPIO nanoparticles were determined through DLS measurement, as shown on the volume distribution graph. (B) TEM image of PDL1-SPIO nanoparticles (scale bar, 10 nm). (C) Representative results of the zeta potential (mV) distribution of PDL1-SPIO and SPIO nanoparticles from three independent experiments (*p < 0.05). The data from three batches of PDL1-SPIO preparation experiments were combined. |
Evaluation of the Targeting Specificity of PDL1-SPIO to PDL1‑Expressing GBM Cells
To evaluate the PD-L1 targeting specificity of the PD-L1 antibodies after conjugation with SPIO nanoparticles, we used PDL1-SPIO to detect surface PD-L1 expression on a murine GBM cell line (GL261). Flow cytometry analysis demonstrated that PD-L1 on GL261 cells can be detected using both PDL1-SPIO nanoparticles and PDL1 antibodies (Figure 3A). The mean fluorescence intensity (MFI) of PD-L1 expression was higher in the PDL1-SPIO staining group than in the PD-L1 antibody staining group (Figure 3A). Next, the targeting specificity of PDL1-SPIO was evaluated using an IF labeling technique. The results revealed markedly strong green fluorescence signals specifically on the GL261 cells, indicating the affinity and binding magnitude of the PDL1-SPIO to GL261 cells (Figure 3B). By contrast, no signal was detected for the lipid-coated SPIO nanoparticle controls or isotype control antibodies. Taken together, these findings indicate that the PD-L1 antibodies retained affinity to PD-L1 after conjugation with SPIO nanoparticles.
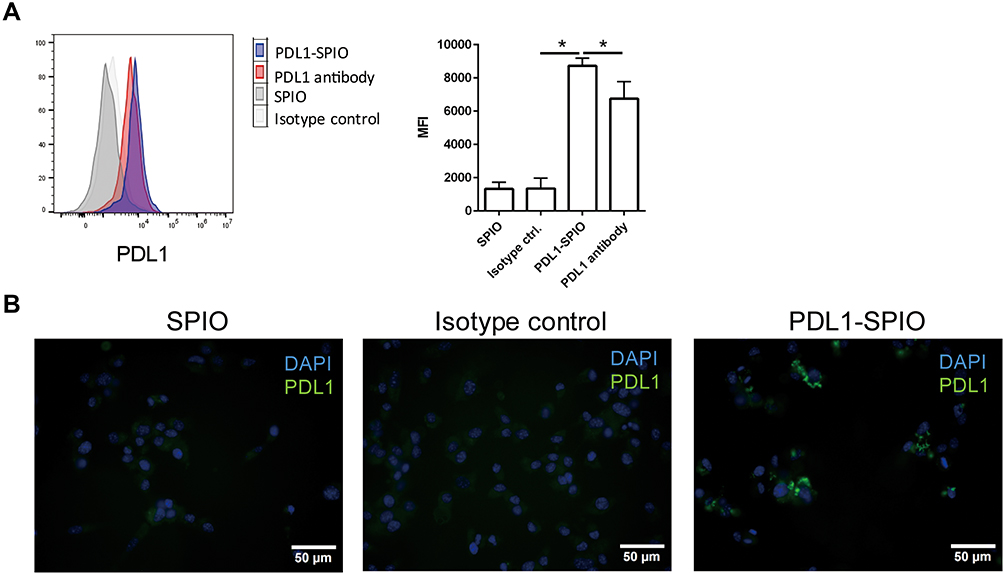 |
Figure 3 PD-L1 expression of GL261 cells detected using PDL1-SPIO. (A) Flow cytometry analysis for surface PD-L1 expression on GBM cells by using PDL1-SPIO nanoparticles. GL261 cells were stained with SPIO nanoparticles, PDL1-SPIO nanoparticles, PD-L1 antibodies, or isotype control antibodies (rat IgG2b antibody) and then stained with PE anti-rat IgG2b antibodies. PD-L1 expression was quantified based on its MFI. (*p < 0.05; n=4) (B) Evaluation of PDL1-SPIO nanoparticles targeting specificity through IF staining. GL261 cells were fixed and incubated with SPIO nanoparticles, isotype control antibodies (rat IgG2b antibody), and PDL1-SPIO nanoparticles. After washing with PBS, the specimens were incubated with goat anti-rat IgG2b AF-488 antibodies to detect the presence of PD-L1 antibodies. Green, PDL1; blue, DAPI. |
Detection of PDL1-SPIO in GBM Cells
To confirm the presence of targeted PDL1-SPIO in GBM cells, Prussian blue staining was performed to detect the presence of iron oxide nanoparticles in GL261 cells that were incubated with PDL1-SPIO or SPIO nanoparticles for 24 h. Consistent with the IF staining results, blue signals were detected in the GL261 cells after incubation with PDL1-SPIO, indicating the presence of iron oxide nanoparticles in these cells but not in those incubated with SPIO nanoparticles (Figure 4A). In addition, to validate the cellular localization of PDL1-SPIO and confirm nanoparticle uptake after treatment, the presence of nanoparticles in the cytoplasmic region of GL261 cells was detected using TEM. The TEM images of SPIO-treated GL261 cells revealed only sparse nanoparticles, whereas those of PDL1-SPIO-treated cells revealed electron-dense clustering of SPIO nanoparticles (>50 particles; Figure 4B). These data indicate that GBM cells can uptake PDL1-SPIO.
 |
Figure 4 Detection of PDL1-SPIO nanoparticles in the GBM cell line and TMZ-resistant tumor tissue. (A) Presence of nanoparticles in GBM cells after incubation with PDL1-SPIO. GL261 cells were incubated with culture medium containing unconjugated SPIO nanoparticles (0.27 mg/mL) or PDL1-SPIO nanoparticles (0.27 mg/mL) for 24 h; Prussian blue and nuclear fast red staining were then performed. Blue color indicates the presence of iron in the cells. (B) SPIO or PDL1-SPIO nanoparticle sorption was detected in GL261 cells through TEM. GL261 cells were incubated with SPIO nanoparticles (0.27 mg/mL) or PDL1-SPIO nanoparticles (0.27 mg/mL) for 4 h before TEM. Arrowhead, SPIO cluster; red line box, magnified area. (C) TMZ resistance of GL261/TMZ-R cells was confirmed using colony formation assay. Representative images of GL261 and GL261/TMZ-R cell colonies after 12 days of treatment with 150 μM TMZ are shown. Quantitative results of the colony formation assay are shown as the total number of surviving colonies/well (*p < 0.05; n = 3). (D) Flow cytometry analysis for surface PDL1 expression on GL261 and GL261/TMZ-R cells. Cells were stained with PD-L1 antibodies and isotype control antibodies and then stained with PE antirat IgG2b antibodies (n = 4). (E) PD-L1 expression in brain tissue of GL261/TMZ-R tumor-bearing mice was detected using PDL1-SPIO nanoparticles. The brains of GL261/TMZ-R tumor-bearing mice were fixed at posttumor inoculation day 25. The brain slices were stained using SPIO nanoparticles (6 μg) or PDL1-SPIO nanoparticles (6 μg), after which Prussian blue assay was performed. The dotted line indicates the boundary between brain tissue and tumor in the brain. Representative data from three independent experiments (n = 3) are shown. (F) Analysis of PD-L1 expression on cell subsets in the tumor and tumor-bearing hemisphere. At posttumor inoculation day 25, the single-cell suspensions from the tumor and tumor-bearing hemisphere were analyzed through flow cytometry. Representative results of PD-L1 expression on MO-MDSCs (CD45 hiCD11bhiLy6C+Ly6G−) and nonhematopoietic cells (CD45−) from three independent experiments (n = 3) are shown. |
PDL1-SPIO Can Be Used to Detect PD-L1 Expression in TMZ-Resistant GBM Tissue
Most recurrent GBMs are resistant to TMZ.28 TMZ treatment can upregulate PD-L1 expression in human GBM cell lines.28 PD-L1 in the GBM microenvironment is contributed mainly by tumor-infiltrating monocytic MDSCs (MO-MDSCs) and by GBM tumor cells themselves.5,29 Thus, to detect PD-L1 expression in TMZ-resistant GBM tissue, we generated a TMZ-resistant GBM cell line (GL261/TMZ-R) from GL261 cells incubated for a long time in a culture medium containing TMZ. The clonogenic assay revealed that GL261/TMZ-R cells had fewer colonies than did GL261 cells under normal culture conditions, suggesting that long-term TMZ treatment decreases the clonogenic activity of GBM cells; moreover, the number of GL261/TMZ-R cell colonies was not affected by TMZ treatment (Figure 4C). By contrast, GL261 cells did not form colonies after TMZ treatment (Figure 4C). These results indicate that GL261/TMZ-R cells can resist the cytotoxic effects of TMZ.
The level of PD-L1 expression was slightly increased in GL261/TMZ-R cells compared with GL261 cells (Figure 4D). To test PDL1-SPIO binding specificity to tumor tissues of GL261/TMZ-R-bearing mice, we treated tumor and peritumoral tissues with PDL1-SPIO or SPIO and performed a Prussian blue assay. Both peritumoral and tumor regions in brain slices had positive blue signals after treatment with PDL1-SPIO, but no signals were observed after treatment with the SPIO control (Figure 4E). An immunohistochemistry (IHC) staining assay also revealed PD-L1 expression in tumor tissues when using the PD-L1 antibody (Supplementary Figure 1A) and some positive signaling in peritumoral and tumor regions (Supplementary Figure 1B). We next examined the level of PD-L1 in MO-MDSCs (CD45 hiCD11bhi Ly6C+Ly6G−) and nonhematopoietic cells (CD45− cells) in tumor tissues by using flow cytometry and observed that both subsets expressed PD-L1; however, the expression was relatively low in MO-MDSCs and nonhematopoietic cells in tumor-bearing hemispheres (Figure 4F). Together, these findings indicate that PDL1-SPIO can be used to detect PD-L1 expression in intratumoral and peritumoral regions in TMZ-resistant GBM-bearing mice.
MR Fitting Curve and T2 Relaxation Time of PDL1‑SPIO Phantoms
To evaluate the feasibility of using PDL1-SPIO for PDL1-positive cell detection in MRI, PDL1-SPIO phantom scans were performed to investigate the MRI signal intensity and response to T2 relaxation time at various concentrations. The signal intensity and T2 relaxation time of PDL1-SPIO suspended in agarose gel with known Fe concentrations (0–15.7 μg/mL) were measured using 7-T MRI. The T2-fitting curve of PDL1-SPIO exhibited a correlation between signal intensity and nanoparticle concentration at TE values ranging from 8.8 to 352 ms (Figure 5A). Moreover, the PDL1-SPIO indicated a decrease in MR T2 relaxation time with an increase in Fe concentration (Figure 5B). The T2 relaxation time of PDL1-SPIO nanoparticles was 92.4 ms at 0.98 μg/mL, and this decreased to 22.9 ms when the Fe concentration was increased to 15.7 μg/mL. Figure 5C presents the MRI signal intensities of various concentrations of PDL1-SPIO phantoms; the PDL1-SPIO concentration was positively correlated with the dark signals in T2-weighted in vitro MR images. The positive correlations of PDL1-SPIO concentration with T2 relaxation time and signal intensity suggest that the PDL1-SPIO can be quantitatively detected using in vitro MRI.
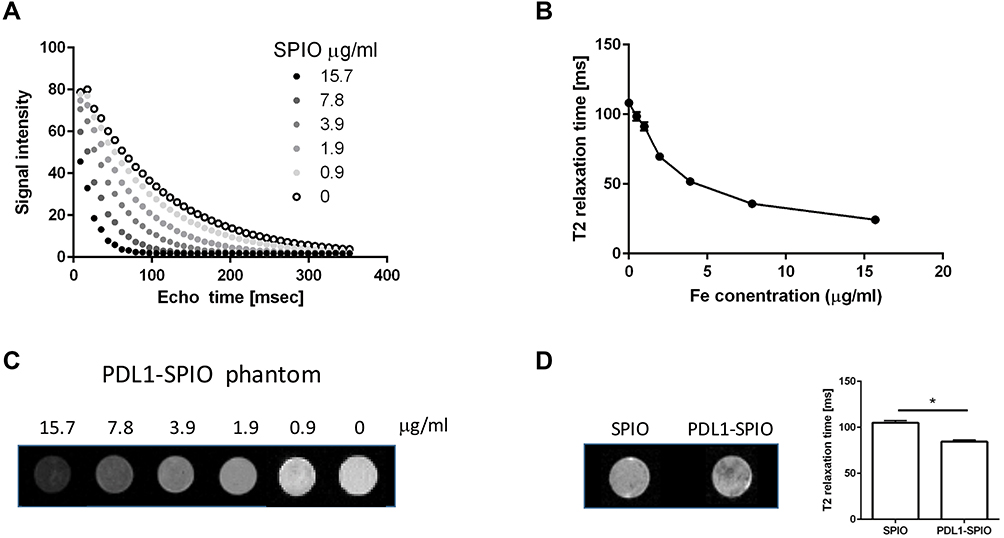 |
Figure 5 Detection of PDL1-SPIO binding in GL261 cells in T2-weighted MRI images. (A) Echo time curve fitting of PDL1-SPIO phantoms in various known concentrations was measured using 7T MRI. (B) T2 relaxation time of PDL1-SPIO in known Fe concentrations (n = 3 for each concentration). (C) Corresponding signal intensity images of PDL1-SPIO standards (0–15.7 μg/mL) measured using T2-weighted images. (D) T2-weighted images of in vitro PDL1-SPIO-treated GL261 cells. Cells were incubated with SPIO or PDL1-SPIO nanoparticles at 0.1 mg/mL at 37 °C for 2 h. A lower T2 signal intensity was observed in PDL1-SPIO-treated GL261 cells. The T2 relaxation times of SPIO and PDL1-SPIO nanoparticle-treated GL261 cells are shown in the bar graph. (*p < 0.05; n = 3). |
Identification of PDL1‑Positive GBM Cells Through in vitro MRI
To test whether PDL1-SPIO can be used for PD-L1-positive GBM cell detection, GL261 cells were incubated with PDL1-SPIO or SPIO nanoparticles, and SPIO signals were detected in T2-weighted MRI images. The T2 relaxation time was lower in PDL1-SPIO-treated GL261 cells than in the SPIO control group (Figure 5D). These findings indicate that PDL1-SPIO can be used for identifying PD-L1 positive GBM cells in MRI images in vitro.
Detection of PD-L1 in GL261/TMZ-R GBM Through in vivo MRI
To detect PD-L1 expression in TMZ-resistant GBM in vivo, PDL1-SPIO was administered intravenously to GL261/TMZ-R GBM-bearing mice. The heads of tumor-bearing mice were scanned using T2-, T2*-, and susceptibility-weighted MRI at indicated postinjection times (0, 1, 4, and 24 h); the dark signals in the tumor were most prominent in SWI at 4 h (Figure 6A). To confirm the presence of targeted PDL1-SPIO in GBM tissue, Prussian blue staining was performed to detect the presence of Fe in tumors from GBM-bearing mice after PDL1-SPIO or SPIO nanoparticle injection. Prussian blue staining revealed blue signals in the tumor region in PDL1-SPIO-treated mice but not in SPIO-treated mice, indicating that iron oxide nanoparticles were present in tumor tissue after PDL1-SPIO injection (Figure 6B). IHC staining also revealed positive signals of PD-L1 expression in the tumor (Figure 6B). To quantify and further test the specificity of the binding of PDL1-SPIO in brain tumors of TMZ-resistant tumor-bearing mice, SPIO or PDL1-SPIO nanoparticles were injected into tumor-bearing mice, and PD-L1 expression was quantified using a T2* map scan before and after PDL1-SPIO or SPIO injection. Hypointense areas in the tumor region of GBM-bearing mice were identified at 4 h after PDL1-SPIO injection (Figure 6C). By contrast, we did not detect notable hypointense areas in GBM-bearing mice that received SPIO nanoparticles (Figure 6C). In addition, ∆R2* analysis quantified PDL1-SPIO expression in the tumor region of tumor-bearing mice through T2* mapping (Figure 6C), whereas no signaling was observed in the GBM-bearing mice that received SPIO. Thus, the findings imply that PDL1-SPIO can target PD-L1 expression in tumors and can be detected on MRI images.
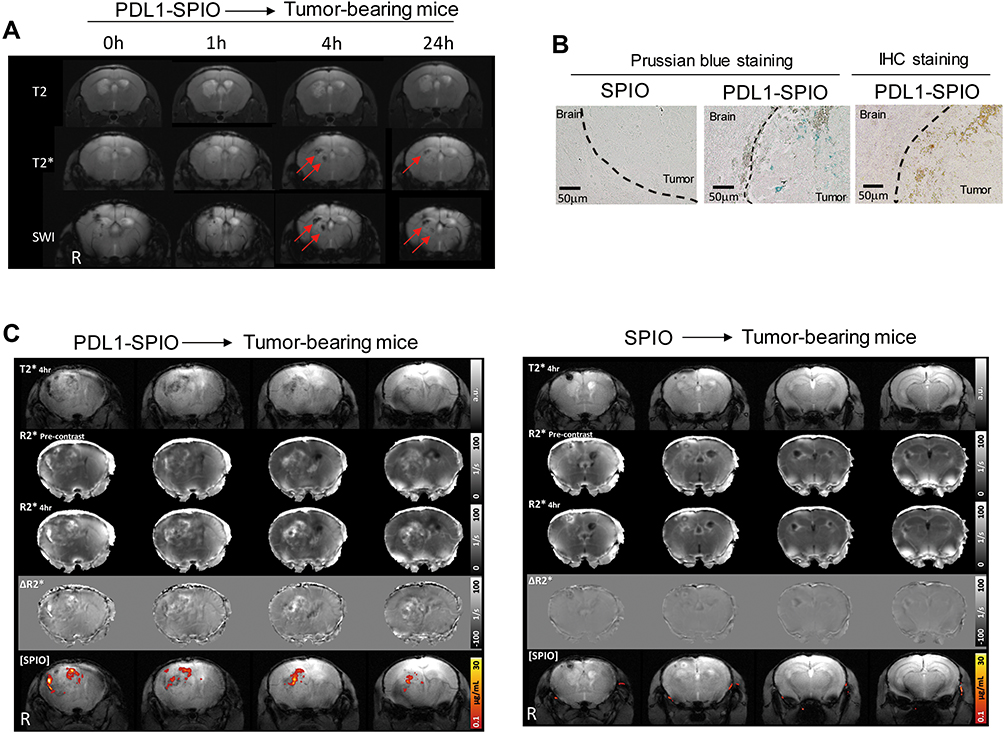 |
Figure 6 In vivo MRI detection of PD-L1 expression in TMZ-resistant GBM-bearing mice. (A) In vivo MRI detection of PDL1-SPIO nanoparticles in GL261/TMZ-R tumor-bearing mice at tumor inoculation day 25. T2-weighted, T2*-weighted, and SWI images of tumor-bearing mice at 0, 1, 4, and 24 h after intravenous injection with PDL1-SPIO nanoparticles (60 μg/mouse) are shown. Red arrows indicate the hypointense area in the brain according to MRI analysis. (B) Detection of iron from SPIO- and PDL1-SPIO-treated GL261/TMZ-R tumor-bearing mice by using Prussian blue assay. PD-L1 expression in tumors were determined by IHC staining. At tumor inoculation day 25, brains were harvested 4 h after injection with SPIO nanoparticles (60 μg/mouse) or PDL1-SPIO nanoparticles (60 μg/mouse). Blue color indicates the presence of iron in the tissues. Representative figures from two independent experiments (n = 3) are shown. (C) T2*-weighted map images of GL261/TMZ-R tumor-bearing mice 4 h after injection with PDL1-SPIO nanoparticles (60 μg/mouse) or SPIO nanoparticles (60 μg/mouse). At tumor inoculation day 25, R2* precontrast and R2* 4-h MRI images were acquired before and after injection of PDL1-SPIO nanoparticles (60 μg/mouse) and SPIO (60 μg/mouse), respectively. Representative MRI figures from two independent experiments (n = 3) are shown. The letter “R” indicates the right side of the brain. |
Discussion
We demonstrated a method of conjugating lipid-coated SPIO nanoparticles with PD-L1 antibodies (PDL1-SPIO) for MRI analysis. PDL1-SPIO nanoparticles specifically target PD-L1-expressing GL261 cells and generate distinguishable signals in TMZ-resistant GBM-bearing mice in MRI analysis. In addition, lipid-coated SPIO nanoparticles exhibit a potent nonfouling property that efficiently suppresses the nonspecific sorption of SPIO nanoparticles by GBM cells. This can reduce system noise in MRI, thus preventing false-positive signals. Conjugating PD-L1 antibodies with lipid-coated SPIO nanoparticles enabled specific targeting toward PD-L1, and the conjugation process did not alter the antibody affinity, which was confirmed using flow cytometry analysis, IF staining, Prussian blue staining, and TEM. Furthermore, PDL1-SPIO nanoparticles were successfully used for in vitro and in vivo MRI analyses. According to multiple-parameter in vivo MR images, including SWI, T2*and T2* map images, PDL1-SPIO nanoparticles can noninvasively reveal PD-L1 expression levels in brain tumors. According to our review of the relevant literature, this study is the first to describe the conjugation of PD-L1 antibodies with lipid-coated SPIO nanoparticles.
The development of novel noninvasive approaches for the early detection of PD-L1 is beneficial for PD-L1 diagnosis. Several studies have demonstrated that PD-L1 expression can be detected by radiolabeled PD-L1 antibodies through positron emission tomography imaging analysis.30 However, these studies have also reported that radiolabeled PD-L1 antibody–mediated imaging has limitations. Imaging with radiolabeled antibodies is associated with considerable background signals and requires imaging several days after injection of the mAbs to obtain the best contrast image.30 Moreover, because radiolabeled antibodies have radioactivity, the radiation burden on highly perfused and radiosensitive organs would be high.30 The PDL1-SPIO nanoparticles used to detect PDL1 expression in vivo are nonradioactive, thus avoiding this radiation burden.
TMZ treatment causes differential effects on PD-L1 expression levels in GBM cells. TMZ treatment leads to downregulation of PD-L1 in IFN-γ-stimulated human primary GBM cells.31 However, another study demonstrated that TMZ treatment can upregulate PD-L1 expression in the U87 and U251 human GBM cell lines.28 In the present study, long-term TMZ treatment of GL261 murine glioma cells did not significantly affect PD-L1 expression. These findings suggest that TMZ treatment differentially affects PD-L1 expression levels in various types of GBM cells under different culture conditions. Although TMZ treatment differentially affects the PD-L1 expression level on different types of GBM cells, in a previous study, the manipulation of the PD-L1 expression level positively regulated TMZ resistance in human GBM cells; the overexpression of PD-L1 increased TMZ resistance in TMZ-sensitive GBM cells, and the silencing of PD-L1 sensitized TMZ-resistant GBM cells to TMZ.32 Taken together, these results indicate that the PD-L1 expression level in GBM cells is linked to the TMZ resistance of GBM cells.
Recent clinical trials have revealed a lower response to targeted PD-L1 immunotherapy in recurrent GBM.33 A potential explanation for the lower response may be the reduced expression of PD-L1 in recurrent GBM.19 Tumor biopsy limitations, the heterogeneity of PD-L1 expression in intratumoral GBM tumor tissue, and dynamic changes of the PD-L1 expression profile in primary and recurrent GBM are possible reasons for poor responses to targeted PD-L1 immunotherapy. Thus, precisely measuring PD-L1 expression levels in whole tumors would be beneficial for patients with GBM who request targeted PD-L1 therapy. In this study, PDL1-SPIO nanoparticles targeted PD-L1 in both the edge and core regions of the tumor, indicating that they were perfused into the TMZ-resistant GBM tissue. Furthermore, we quantified the PD-L1 expression level in tumors through T2* map MR imaging. Although hypointense signals were observed in the liver and spleen after intravenous administration of PDL1-SPIO nanoparticles, possibly due to them being trapped by reticuloendothelial cells in the liver and spleen (data not shown),34 they also targeted PD-L1 and generated prominent signals in brain tumors. Thus, PDL1-SPIO nanoparticles could serve as an MRI diagnostic contrast agent to determine the PD-L1 expression level in GBM.
The blood–brain barrier is compromised and exhibits substantial leakiness in glioma animal models.35 Leaky tumor vasculature with pores 7–100 nm in size allows certain nanoparticles to accumulate in a brain tumor.35,36 Systemic circulating nanoparticles accumulate in the brain tumor due to the leaky vasculature and defective lymphatic drainage through the enhanced permeability and retention (EPR) effect.37 In the current study, SPIO-PDL1 was intravenously injected into tumor-bearing mice and was able to reach the brain tumor through blood circulation. The structure of PDL1-SPIO improves the EPR-based passive targeting effect due to the high affinity of the PDL1 antibody to PDL1. Thus, PDL1-SPIO can specifically target PDL1 in a brain tumor for improved accumulation and retention of SPIO.
Lipid-coated SPIO nanoparticles are a suitable diagnostic contrast reagent for application in MRI analysis. A previous study concluded that lipid-coated SPIO nanoparticles conjugated with epidermal growth factor receptor antibodies (EGFR-SPIO) can specifically detect EGFR expression in a human GBM cell line.27 However, animal experiments were not performed to test whether EGFR-SPIO revealed EGFR expression in GBM tumors when conducting in vivo MRI analysis. In the present study, we demonstrated that PDL1-SPIO nanoparticles intravenously delivered into tumor-bearing mice can specifically target PD-L1 in the GBM. Chen et al used a high molar ratio of iminothiolane to antibodies (2000:1) to thiolate EGFR antibodies, and they conjugated these thiolated EGFR antibodies to lipid-coated SPIO nanoparticles. EGFR-SPIO nanoparticles exhibited lower binding efficiency compared with control EGFR antibodies.27 Because Traut’s reagent with iminothiolane can randomly modify antibody molecules with sulfhydryl groups, the antibody-binding specificity may be lost when the amino groups are excessively thiolated in antigen-binding regions.38 Thus, we reduced the molar ratio of iminothiolane to PD-L1 antibodies from 2000:1 to 20:1. The present data demonstrated that thiolated PD-L1 antibodies have normal binding efficacy compared with control PD-L1 antibodies (data not shown), and they can be conjugated to SPIO nanoparticles through the linker SMCC.
Conclusions
We developed a PD-L1 MRI diagnostic probe that can quantify PD-L1 expression in GBM tumors in vitro and in vivo. The potential of a PDL1-SPIO diagnostic probe is that it can be used to noninvasively trace the PD-L1 expression level in the GBM, thus making diagnoses more accurate by reflecting the status of PD-L1 expression levels in tumors at different stages of development.
Data Sharing Statement
The datasets used and/or analyzed in the current study are available from the corresponding author upon reasonable request.
Ethics Approval and Consent to Participate
All animal care and experimental procedures were approved by the Ethics Committee of Taipei Medical University, and followed the principles of ethical animal research outlined in the Basel Declaration and the ethical guidelines by the International Council For Laboratory Animal Science (ICLAS).
Acknowledgments
We gratefully acknowledge the services and facilities at the Core Facility Center and Laboratory Animal Center of Taipei Medical University for technical support in MRI and TEM experiments. This manuscript was edited by Wallace Academic Editing.
Funding
This work was supported by MOST 108-2314-B-038-023, MOST 109-2314-B-038-128, TMU109-AE1-B19, and TMU109-AE2-I06-1.
Disclosure
The authors have no potential conflicts of interest to disclose.
References
1. Stupp R, Hegi ME, Mason WP, et al. Effects of radiotherapy with concomitant and adjuvant temozolomide versus radiotherapy alone on survival in glioblastoma in a randomised Phase III study: 5-year analysis of the EORTC-NCIC trial. Lancet Oncol. 2009;10(5):459–466. doi:10.1016/S1470-2045(09)70025-7
2. Stupp R, Mason WP, van den Bent MJ, et al. Radiotherapy plus concomitant and adjuvant temozolomide for glioblastoma. N Engl J Med. 2005;352(10):987–996. doi:10.1056/NEJMoa043330
3. Mohme M, Neidert MC. Tumor-specific T cell activation in malignant brain tumors. Front Immunol. 2020;11:205. doi:10.3389/fimmu.2020.00205
4. Grabowski MM, Sankey EW, Ryan KJ, et al. Immune suppression in gliomas. J Neurooncol. 2021;151(1):3–12. doi:10.1007/s11060-020-03483-y
5. Mi Y, Guo N, Luan J, et al. The emerging role of myeloid-derived suppressor cells in the glioma immune suppressive microenvironment. Front Immunol. 2020;11:737. doi:10.3389/fimmu.2020.00737
6. Hsu JB, Lee GA, Chang TH, et al. Radiomic Immunophenotyping of GSEA-assessed immunophenotypes of glioblastoma and its implications for prognosis: a Feasibility Study. Cancers. 2020;12(10):3039. doi:10.3390/cancers12103039
7. Nduom EK, Wei J, Yaghi NK, et al. PD-L1 expression and prognostic impact in glioblastoma. Neuro Oncol. 2016;18(2):195–205. doi:10.1093/neuonc/nov172
8. Dong Y, Sun Q, Zhang X. PD-1 and its ligands are important immune checkpoints in cancer. Oncotarget. 2017;8(2):2171–2186. doi:10.18632/oncotarget.13895
9. Alsaab HO, Sau S, Alzhrani R, et al. PD-1 and PD-L1 checkpoint signaling inhibition for cancer immunotherapy: mechanism, combinations, and clinical outcome. Front Pharmacol. 2017;8:561. doi:10.3389/fphar.2017.00561
10. Dong H, Strome SE, Salomao DR, et al. Tumor-associated B7-H1 promotes T-cell apoptosis: a potential mechanism of immune evasion. Nat Med. 2002;8(8):793–800. doi:10.1038/nm730
11. Quatrini L, Mariotti FR, Munari E, Tumino N, Vacca P, Moretta L. The immune checkpoint PD-1 in natural killer cells: expression, function and targeting in tumour immunotherapy. Cancers. 2020;12(11):3285. doi:10.3390/cancers12113285
12. Chen RQ, Liu F, Qiu XY, Chen XQ. The prognostic and therapeutic value of PD-L1 in glioma. Front Pharmacol. 2018;9:1503. doi:10.3389/fphar.2018.01503
13. Zhu Z, Zhang H, Chen B, et al. PD-L1-mediated immunosuppression in glioblastoma is associated with the infiltration and M2-polarization of tumor-associated macrophages. Front Immunol. 2020;11:588552. doi:10.3389/fimmu.2020.588552
14. Topalian SL, Hodi FS, Brahmer JR, et al. Safety, activity, and immune correlates of anti-PD-1 antibody in cancer. N Engl J Med. 2012;366(26):2443–2454. doi:10.1056/NEJMoa1200690
15. Sanmamed MF, Chen L, Paradigm A. Shift in Cancer immunotherapy: from enhancement to normalization. Cell. 2018;175(2):313–326. doi:10.1016/j.cell.2018.09.035
16. Bergmann N, Delbridge C, Gempt J, et al. The intratumoral heterogeneity reflects the intertumoral subtypes of glioblastoma multiforme: a regional immunohistochemistry analysis. Front Oncol. 2020;10:494. doi:10.3389/fonc.2020.00494
17. Itakura H, Achrol AS, Mitchell LA, et al. Magnetic resonance image features identify glioblastoma phenotypic subtypes with distinct molecular pathway activities. Sci Transl Med. 2015;7(303):303ra138. doi:10.1126/scitranslmed.aaa7582
18. Hao C, Chen G, Zhao H, et al. PD-L1 expression in glioblastoma, the clinical and prognostic significance: a systematic literature review and meta-analysis. Front Oncol. 2020;10:1015. doi:10.3389/fonc.2020.01015
19. Heynckes S, Gaebelein A, Haaker G, et al. Expression differences of programmed death ligand 1 in de-novo and recurrent glioblastoma multiforme. Oncotarget. 2017;8(43):74170–74177. doi:10.18632/oncotarget.18819
20. Rochigneux P, Garcia AJ, Chanez B, Madroszyk A, Olive D, Garon EB. Medical treatment of lung cancer: can immune cells predict the response? A systematic review. Front Immunol. 2020;11:1036. doi:10.3389/fimmu.2020.01036
21. Wang X, Guo G, Guan H, Yu Y, Lu J, Yu J. Challenges and potential of PD-1/PD-L1 checkpoint blockade immunotherapy for glioblastoma. J Exp Clin Cancer Res. 2019;38(1):87. doi:10.1186/s13046-019-1085-3
22. Peng XH, Qian X, Mao H, et al. Targeted magnetic iron oxide nanoparticles for tumor imaging and therapy. Int J Nanomedicine. 2008;3(3):311–321. doi:10.2147/ijn.s2824
23. Nduom EK, Bouras A, Kaluzova M, Hadjipanayis CG. Nanotechnology applications for glioblastoma. Neurosurg Clin N Am. 2012;23(3):439–449. doi:10.1016/j.nec.2012.04.006
24. Maier-Hauff K, Ulrich F, Nestler D, et al. Efficacy and safety of intratumoral thermotherapy using magnetic iron-oxide nanoparticles combined with external beam radiotherapy on patients with recurrent glioblastoma multiforme. J Neurooncol. 2011;103(2):317–324. doi:10.1007/s11060-010-0389-0
25. Wu JC, Tseng PY, Tsai WS, et al. Antibody conjugated supported lipid bilayer for capturing and purification of viable tumor cells in blood for subsequent cell culture. Biomaterials. 2013;34(21):5191–5199. doi:10.1016/j.biomaterials.2013.03.096
26. Lai JM, Shao HJ, Wu JC, Lu SH, Chang YC. Efficient elusion of viable adhesive cells from a microfluidic system by air foam. Biomicrofluidics. 2014;8(5):052001. doi:10.1063/1.4893348
27. Chen HL, Hsu FT, Kao YJ, et al. Identification of epidermal growth factor receptor-positive glioblastoma using lipid-encapsulated targeted superparamagnetic iron oxide nanoparticles in vitro. J Nanobiotechnology. 2017;15(1):86. doi:10.1186/s12951-017-0313-2
28. Wang S, Yao F, Lu X, et al. Temozolomide promotes immune escape of GBM cells via upregulating PD-L1. Am J Cancer Res. 2019;9(6):1161–1171.
29. Antonios JP, Soto H, Everson RG, et al. PD-1 blockade enhances the vaccination-induced immune response in glioma. JCI Insight. 2016;1(10):548. doi:10.1172/jci.insight.87059
30. Broos K, Lecocq Q, Raes G, Devoogdt N, Keyaerts M, Breckpot K. Noninvasive imaging of the PD-1: PD-L1immune checkpoint: embracing nuclear medicine for the benefit of personalized immunotherapy. Theranostics. 2018;8(13):3559–3570. doi:10.7150/thno.24762
31. Heynckes S, Daka K, Franco P, et al. Crosslink between Temozolomide and PD-L1 immune-checkpoint inhibition in glioblastoma multiforme. BMC Cancer. 2019;19(1):117. doi:10.1186/s12885-019-5308-y
32. Zheng Y, Liu L, Wang Y, et al. Glioblastoma stem cell (GSC)-derived PD-L1-containing exosomes activates AMPK/ULK1 pathway mediated autophagy to increase temozolomide-resistance in glioblastoma. Cell Biosci. 2021;11(1):63. doi:10.1186/s13578-021-00575-8
33. Caccese M, Indraccolo S, Zagonel V, Lombardi G. PD-1/PD-L1 immune-checkpoint inhibitors in glioblastoma: a concise review. Crit Rev Oncol Hematol. 2019;135:128–134. doi:10.1016/j.critrevonc.2018.12.002
34. Weissleder R, Elizondo G, Wittenberg J, Rabito CA, Bengele HH, Josephson L. Ultrasmall superparamagnetic iron oxide: characterization of a new class of contrast agents for MR imaging. Radiology. 1990;175(2):489–493. doi:10.1148/radiology.175.2.2326474
35. Hobbs SK, Monsky WL, Yuan F, et al. Regulation of transport pathways in tumor vessels: role of tumor type and microenvironment. Proc Natl Acad Sci USA. 1998;95(8):4607–4612. doi:10.1073/pnas.95.8.4607
36. Kumar M, Medarova Z, Pantazopoulos P, Dai G, Moore A. Novel membrane-permeable contrast agent for brain tumor detection by MRI. Magn Reson Med. 2010;63(3):617–624. doi:10.1002/mrm.22216
37. Rosenblum D, Joshi N, Tao W, Karp JM, Peer D. Progress and challenges towards targeted delivery of cancer therapeutics. Nat Commun. 2018;9(1):1410. doi:10.1038/s41467-018-03705-y
38. Ji T, Muenker MC, Papineni RV, Harder JW, Vizard DL, McLaughlin WE. Increased sensitivity in antigen detection with fluorescent latex nanosphere-IgG antibody conjugates. Bioconjug Chem. 2010;21(3):427–435. doi:10.1021/bc900295v
 © 2021 The Author(s). This work is published and licensed by Dove Medical Press Limited. The
full terms of this license are available at https://www.dovepress.com/terms.php
and incorporate the Creative Commons Attribution
- Non Commercial (unported, v3.0) License.
By accessing the work you hereby accept the Terms. Non-commercial uses of the work are permitted
without any further permission from Dove Medical Press Limited, provided the work is properly
attributed. For permission for commercial use of this work, please see paragraphs 4.2 and 5 of our Terms.
© 2021 The Author(s). This work is published and licensed by Dove Medical Press Limited. The
full terms of this license are available at https://www.dovepress.com/terms.php
and incorporate the Creative Commons Attribution
- Non Commercial (unported, v3.0) License.
By accessing the work you hereby accept the Terms. Non-commercial uses of the work are permitted
without any further permission from Dove Medical Press Limited, provided the work is properly
attributed. For permission for commercial use of this work, please see paragraphs 4.2 and 5 of our Terms.