Back to Journals » Cancer Management and Research » Volume 10
Detection of circulating tumor cells in liquid biopsy from Ewing sarcoma patients
Authors Benini S, Gamberi G, Cocchi S, Garbetta J, Alberti L, Righi A, Gambarotti M ![]() , Picci P, Ferrari S
, Picci P, Ferrari S
Received 13 May 2017
Accepted for publication 16 September 2017
Published 9 January 2018 Volume 2018:10 Pages 49—60
DOI https://doi.org/10.2147/CMAR.S141623
Checked for plagiarism Yes
Review by Single anonymous peer review
Peer reviewer comments 5
Editor who approved publication: Professor Harikrishna Nakshatri
Stefania Benini,1 Gabriella Gamberi,1,2 Stefania Cocchi,1 Jessica Garbetta,1 Laurent Alberti,3 Alberto Righi,1 Marco Gambarotti,1 Piero Picci,1 Stefano Ferrari4
1Department of Pathology, Rizzoli Institute, Bologna, 2Department of Biomedical and Neuromotor Science, University of Bologna, Bologna, Italy; 3Department of Pathology, Centre Léon Bérard, Lyon, France; 4Department of Chemotherapy, Rizzoli Institute, Bologna, Italy
Background: Circulating tumor cells (CTCs) analysis is a promising new diagnostic field to estimate risk and monitor treatment efficacy, metastatic relapse, and progression in cancer patients. The study aim was to isolate and characterize CTCs in blood samples of Ewing sarcoma (ES) patients exploiting two main characteristics: CD99 expression and presence of chromosomal translocations.
Materials and methods: The method isolated CTCs from peripheral blood (PB) of ES patients. Cell-surface CD99 was a useful marker for CTCs determined using immunomagnetic separation with microbeads and CD99 monoclonal antibody. We tested sensitivity and specificity by detecting CTCs in blood collected from healthy donors and randomly during therapy from 18 ES patients. Evidence of CTCs was confirmed by detection of specific molecular markers using quantitative and digital reverse transcription-polymerase chain reaction targeting EWSR1/FLI1 type 1 and type 2 or EWSR1/ETS-related gene transcripts type 1 and type 9e.
Results: Feasibility of finding CTCs in PB of ES patients by immunoseparation with CD99 antibody and magnetic microbeads was demonstrated for the first time. At molecular analysis, three PB specimens tested positive for chimeric EWSR1/FLI1 type 2 and one PB for chimeric EWSR1/FLI1 type 2. CTCs detection was found above a limit of detection of 1 cell/mL of PB.
Conclusion: CTCs in PB of ES patients can be identified by this method and in ES CTCs analysis can be used as a liquid biopsy approach for prognostic and predictive purposes. The potential clinical implications of CTCs in PB samples detected by the platform for CTC isolation with molecular confirmation during therapy require further evaluation.
Keywords: circulating tumor cells, anti-CD99 antibody, magnetic beads, Ewing sarcoma, immunoseparation, liquid biopsy
Introduction
Dissemination of tumor cells from the primary site is the main cause for relapse or metastasis. The metastatic process involves a variety of steps where tumor cells from the primary tumor site are released into the bloodstream, reach distant sites, and colonize. Circulating tumor cells (CTCs) are the rare tumor cells that circulate in blood of cancer patients.1 CTCs present in peripheral blood (PB) are one of the different sample categories that dominate liquid biopsy today, and can be enriched and detected via different technologies, providing a potentially accessible source for characterization and monitoring of cancers.2 Whatever the path, CTCs potentially hold valuable information about tumor composition, invasiveness, drug susceptibility, and resistance to therapy.3 This is the reason why CTC analyses are indeed considered a real-time liquid biopsy, a field that in contrast to tissue biopsy provides a minimally invasive method for marker detection. In recent years, accumulating reports have suggested the use of CTCs to detect and predict cancer spread.4,5 As CTCs are gaining importance in understanding both the disease and therapeutic outcomes, new modalities are under development to detect, enumerate, and isolate CTCs from patient blood.6 Many state-of-the-art CTC technologies have been elaborated for CTC detection in patients.7 CTCs have been identified in PB in patients affected by the most disparate types of tumors, but there are only few evidences about their presence in blood samples collected from patients with a diagnosis of Ewing sarcoma (ES).8
ESs are a group of highly aggressive small round cell tumors of bone or soft tissue with a high metastatic potential and low cure rate.9 It is the second most common solid bone and soft tissue malignancy in children, adolescents, and young adults. Rarely, it occurs also in adults.10 The clinical prognostic parameters currently accepted do not accurately predict survival of high-risk patients.11 ES is driven by a reciprocal translocation between the EWS gene and an ETS family member (Fli-1 proto-oncogene, ETS transcription factor [FLI1] in 85% of tumors and ETS-related gene [ERG] in another 10%).12,13 The translocation oncogene is essential for the initiation and maintenance of the transformed phenotype, making it an ideal molecular marker, because besides being present in every single tumor cell as the essential driver it will not be downregulated or lost during tumor progression.14 The isolation and characterization of CTCs remain a technically challenging issue. As the half-life of CTCs is <3 h15 and CTCs occur at very low concentrations, in the background of millions of normal hematopoietic cells, their identification and capturing require extremely sensitive and specific methods, which usually consist of a combination of enrichment and detection procedures.16
The objective of the current study was to isolate CTCs from patients affected by ESs, based on the immunoseparation of CD99-positive tumor cells. ESs strongly express CD99 antigen,17 and for enrichment/positive selection of CTCs we use immunomagnetic separation with anti-CD99-coated magnetic beads. Thus, taking advantage of the high specificity of the chimeric transcript, as confirmation, we used the most common translocation rearrangement of the tumor: EWSR1/FLI1 type 1, type 2, and EWSR1/ERG type 1 for the analysis of cDNA obtained from CTCs isolation and confirmed by RNA extraction and detection.
This study aimed to determine whether ES releases CTCs, to characterize their RNA cargo and to explore in a preclinical setting whether the characteristic transcripts of the ES might constitute suitable candidates for validation as biomarkers in a subsequent clinical study.
Materials and methods
Blood sample collection
PB samples were collected in spray-coated K2 EDTA Vacutainer Tubes (Becton Dickinson, Franklin Lakes, NJ, USA) from 9 healthy volunteers and 18 patients with ESs. Blood samples were drawn with the negative pressure syringe, maintained at room temperature and processed within 2 h of collection. PB was collected for CTCs evaluation at a random time during therapy. A second PB sample was obtained from those patients who were hospitalized for a second time. The second PB sample collected from the same patient was analyzed separately. The use of PB and tumor tissue was approved by the multidisciplinary bioethics committee of oncology of the Rizzoli Institute before the inclusion of patients into the study (Prot. Gen 0043699, 29/12/2015), and all patients provided written informed consent.
Isolation and detection of CTCs
The 10-mL venous blood specimens, drawn from the patients or volunteers, were used for the isolation of CTCs. All laboratory operations, such as centrifugation and immunomagnetic enrichment, were carried out at room temperature. To isolate CTCs with immunoseparation as soon as they arrive at the laboratory, the nucleated cells were isolated using red blood cell lysis buffer 1× (Miltenyi Biotec, Bergisch Gladbach, Germany) in a ratio of 1:10. The mixture was kept at room temperature for 10–15 min in constant mixing. Then the solution was centrifuged at 500×g for 10 min to isolate the single nucleated cell pellet. The obtained cells were suspended with 5 mL of separation buffer (SB) (Miltenyi Biotec, Bergisch Gladbach, Germany) and centrifuged at 500×g for 10 min. The obtained cells were suspended with 1 mL of SB and then centrifuged again at 700×g for 5 min. Finally, the pellet was resuspended in 90 µL of SB and 10 µL of fluorescein isothiocyanate (FITC)-conjugated CD99 monoclonal antibody (clone 3B2/TA8; Miltenyi Biotec) was added to the isolated cells and incubated for 15 min at 4°C–8°C. After washing with 1 mL of SB, the pellet was resuspended in 80 µL of SB and 20 µL of an anti-FITC MicroBeads (Miltenyi Biotec) and incubated for 15 min at 4°C–8°C. Cell suspensions were washed with 10 volumes of SB and centrifuged at 500×g for 5 min. The supernatant was removed and the washing step was repeated once. Cells were suspended in 500 μL of SB for the enrichment step; LS separation columns (Miltenyi Biotec) were placed on the magnet MidiMACS™ Separator (with proper strength) of a magnetic-activated cell sorter (Miltenyi Biotec) and prepared by washing with 3 mL of SB. Cell suspension was loaded and the flowthrough (unlabeled cells) discarded. Each column was washed three times with 3 mL of SB; then the column was removed from the magnet, 5 mL of SB was added to LS separation columns, and labeled cells were pushed out with a plunger rapidly and collected with new collecting tubes. The obtained CD99+ cells were centrifuged at 500×g for 5 min, and then the supernatant was removed. The pellet of cells was used for subsequent molecular investigations (Figure 1). Alternatively, to isolate CTCs under density gradient, the PB sample was immediately centrifugated at 400×g for 40 min using Ficoll-Histopaque. Cell suspensions were washed with 10 volumes of SB and centrifuged at 500×g for 5 min. The pellet of cells was used for subsequent molecular investigations.
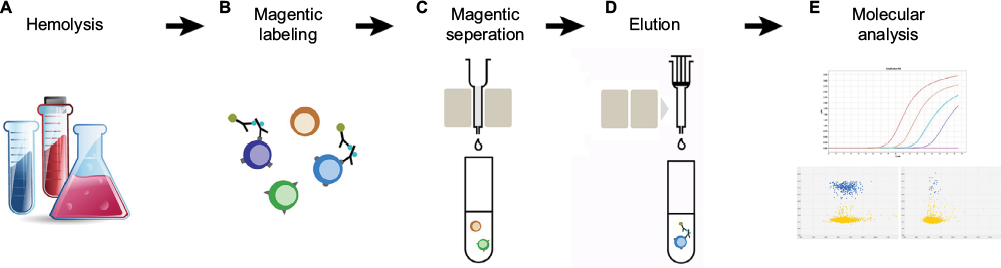 | Figure 1 Isolation of CTCs from blood samples. Notes: (A) Lysis of red blood cells using 10 mL of red blood cell lysis solution per mL of peripheral blood. (B) Enrichment of CD99+ cells with magnetic labeling. CTCs are labeled using anti-CD99 FITC antibodies, followed by incubation with anti-FITC MicroBeads (Miltenyi Biotec, Bergisch Gladbach, Germany). (C) Unlabeled cells pass through, while the magnetically labeled cells are retained within LS separation columns (Miltenyi Biotec). (D) The column is removed from the MidiMACS™ Separator (Miltenyi Biotec), and the magnetically labeled cells are eluted. (E) RNA from CTCs is examined for the presence of fusion genes, using real-time quantitative reverse transcription-polymerase chain reaction and digital reverse transcription-polymerase chain reaction. Abbreviations: CTCs, circulating tumor cells; FITC, fluorescein isothiocyanate. |
Determination of recovery rate of ES cells with different chimeric transcripts
To evaluate the feasibility to find CTCs CD99+ on PB with immunoseparation method, PB samples from healthy volunteers were collected and spiked with different concentrations of human ES cell suspensions (100–1000–10000). Two series of cell suspensions were obtained from two different ES tissue biopsies, characterized by the molecular rearrangement EWSR1/FLI1 type 1. Cells were washed in PBS and added to 5 mL of PB of healthy volunteers. Samples were processed according to isolation and detection of CTCs. To evaluate the efficiency of the method, the CTCs CD99+ immunoseparation system and Ficoll-Histopaque density gradient method were compared. One hundred thousand cells from two different ES tissue biopsies, characterized by EWSR1/FLI1 type 1, were added to 5 mL of PB from healthy volunteers. Samples were processed according to isolation and detection of CTCs. To investigate sensitivity of the CTC detection method, 5 mL of PB samples from healthy volunteers were collected and spiked with different concentrations of human ES cell suspensions (500, 50, and 5 cells). ES cells were derived from two different tissue biopsies for each type of molecular rearrangement (EWSR1/FLI1 type 1, EWSR1/FLI1 type 2, and EWSR1/ERG type 1). Samples were processed according to isolation and detection of CTCs. Each experiment was performed in duplicate. To obtain an independent measure of the ES RNA sensitivity, we performed serial dilutions (100 and 10 pg) of cellular RNA extracted form ES tissue biopsy characterized by different molecular rearrangements (EWSR1/FLI1 type 1, EWSR1/FLI1 type 2, and EWSR1/ERG type 1). RNA was mixed with 1 µg of cellular RNA from PB of healthy donors. Each experiment was performed in duplicate.
For all experiments, tumor cellularity was evaluated by the pathologist on sections of frozen biopsy, stained with hematoxylin–eosin, and examined under light microscopy; cell viability was evaluated with trypan blue.
RNA isolation and complementary DNA (cDNA) synthesis
In this study, primary tumor tissues from all patients were available to confirm the presence of specific chromosomal translocation and type of breakpoint as previously described.18 Total RNA from enriched CTCs CD99+ was extracted using TRIzol reagent (Invitrogen, Carlsbad, CA, USA) and RNeasy Mini Kit spin columns (Qiagen GmbH, Hilden, Germany) according to the manufacturer’s manual. Total RNA (from 1–2.5 μg) was then reverse transcribed to cDNA using SuperScript VILO IV Master Mix (Applied Biosystems, Foster City, CA, USA). cDNA synthesis was performed using 4 μL of VILO system (2 μL 10× RT buffer, 4 μL 25 mM MgCl2, 2 μL 0.1 M dithiothreitol, 1 μL RNaseOUT™ [40 U/μL], SuperScript™ IV RT [200 U/μL]) mixed with 1–2.5 μg mRNA in a total volume of 20 μL. Samples were incubated for 10 min at 25°C and 10 min at 50°C, and the reactions were terminated at 85°C for 5 min. The product of cDNA synthesis reaction was stored at −20°C or immediately used for quantitative real-time reverse transcription-polymerase chain reaction (RT-qPCR).
Quantitative and digital reverse transcription-polymerase chain reaction (RT-dPCR)
RT-qPCR was performed in a total volume of 20 μL using the 1× TaqMan® Universal Master Mix II with UNG (Invitrogen, Carlsbad, CA, USA) with the StepOnePlus™ real-time PCR instrument. RT-qPCR experiments were performed according to protocol and cycling conditions outlined in the manual. The final concentrations of each primer and probe in RT-qPCR reaction were 0.4 and 0.2 μM, respectively, if not otherwise indicated. Primers and probes (Table 1) were designed in collaboration with the Department of Pathology, Centre Léon Bérard, Lyon, to detect molecular markers EWSR1/FLI1 type 1, type 2, EWSR1/ERG type 1, and type 9e. Oligonucleotides and probes were synthesized by Thermo Fisher Scientific (Waltham, MA, USA) and Invitrogen (Carlsbad, CA, USA). Nucleotide sequences used for design of probe–primers were retrieved from NCBI database and the designed probe–primers were aligned by BLAST to confirm gene specificity. RNA integrity was assessed with primers for the housekeeping gene EWSR1 (see Table 1 for primer sequences). Negative controls (C-) and no template control were included in all RT-qPCR experiments. RT-qPCR reactions were carried out using an initial denaturing step (95°C for 10 min) followed by 45 cycles of amplification including denaturation (95°C for 15 s) and annealing/extension (60°C for 1 min). RT-qPCR was performed using STEPONE (Applied Biosystems, Foster City, CA, USA), according to the manufacturer’s protocol. All samples were run in triplicate. Results were analyzed using the quantification cycle (Cq). RT-dPCR was performed on all samples and assayed separately with TaqMan Assays optimized for digital PCR on a QuantStudio 3D Digital PCR System (Thermo Fisher Scientific, Waltham, MA, USA). RT-dPCR reactions were set up in a final volume of 14.5 μL including 7.25 μL of 2× Master Mix, 0.3 nM of each forward and reverse primer, 0.25 nM of TaqMan MGB probe, and 1 μL of template, and loaded on RT-dPCR chips. Thermal cycling was as follows: 10 min at 96.0°C, 39 cycles at 60.0°C for 2 min, 30 s at 98.0°C, and a final elongation step of 2 min at 60°C. Threshold values (positive vs negative; blue vs yellow spots) were automatically calculated by Thermo Fisher Cloud Analysis Suite in negative controls, manually reviewed, and then applied to CTC assays with no additional data manipulation. All samples were run in duplicate.
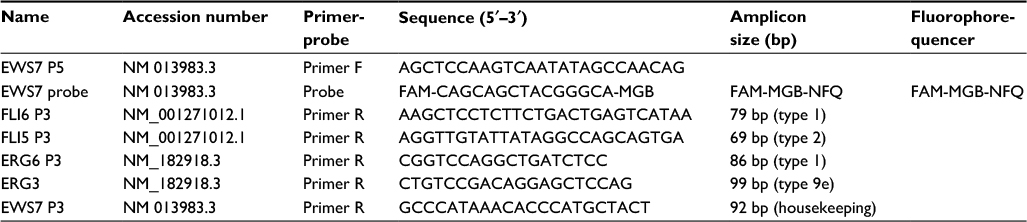 | Table 1 Oligonucleotide primers and probe sequences used in the present study Abbreviations: F, forward; R, reverse. |
Results
Detection of CTCs through enrichment of CD99+ cells
To evaluate the feasibility of finding CTCs in PB with enrichment of CD99+ cells, variable amounts of cell suspensions (10000, 1000, and 100 cells) were added to PB from healthy donors. Cell suspensions were obtained from ES fresh tissue biopsies that express the most frequent transcript EWSR1/FLI1 type 1. We used cell suspensions from fresh tissue and not from cell cultures to mimic the condition of CTCs in blood. CD99+ cells were isolated in PB samples as described; total RNA was isolated from the cells obtained, and subjected to reverse transcriptase. Molecular analysis was performed with specific assays for RT-qPCR for hybrid transcript EWSR1/FLI1 type 1 and housekeeping gene. As the EWSR1 gene is always expressed from the normal allele in ES, amplification of the EWSR1 transcript provided a test validation. The analysis shows the presence of EWSR1/FLI1 type 1 in PB with 10000, 1000, and 100 ES cells giving representative plot amplification (Figure 2A). This result confirms the feasibility of finding CTCs of ES through the enrichment of CD99+ cells in PB. We also tested the presence of CTCs in PB from healthy donors (C-) for CD99+ enrichment, and no amplification plot for EWSR1/FLI1 type 1 was found (Figure 2A).
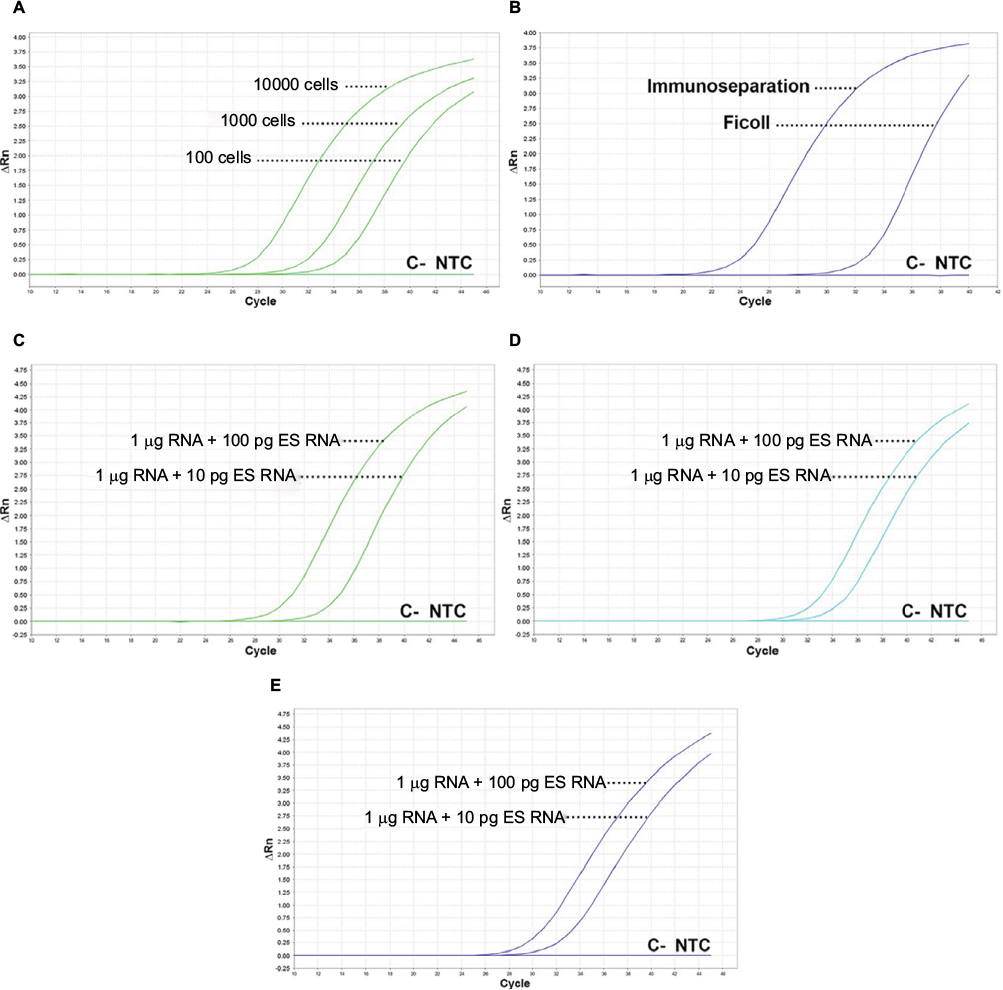
The immunoseparation method through enrichment of CD99+ cells was compared with the cell separation with Ficoll-Histopaque density gradient method that allows separation of all mononuclear cells. One hundred thousand cells obtained from fresh tissue biopsies were added to PB of healthy donors. Figure 2B shows that the CTCs isolated by CD99+ enrichment method gives an amplification plot of 24.9 Cq in contrast to the Ficoll–Histopaque method that determines an amplification plot of 33.5 Cq.
To obtain a measure of RNA sensitivity in ES, we performed serial dilutions of ES cellular RNA obtained from tissue biopsies, mixed with 1 µg of RNA from healthy donors. In these conditions, the analysis performed with RT-qPCR by different molecular rearrangements (EWSR1/FLI1 type 1, EWSR1/FLI1 type 2, and EWSR1/ERG type 1) was able to detect 10 pg of Ewing RNA, the approximate amount of RNA contained in one cell (Figure 2C–E).
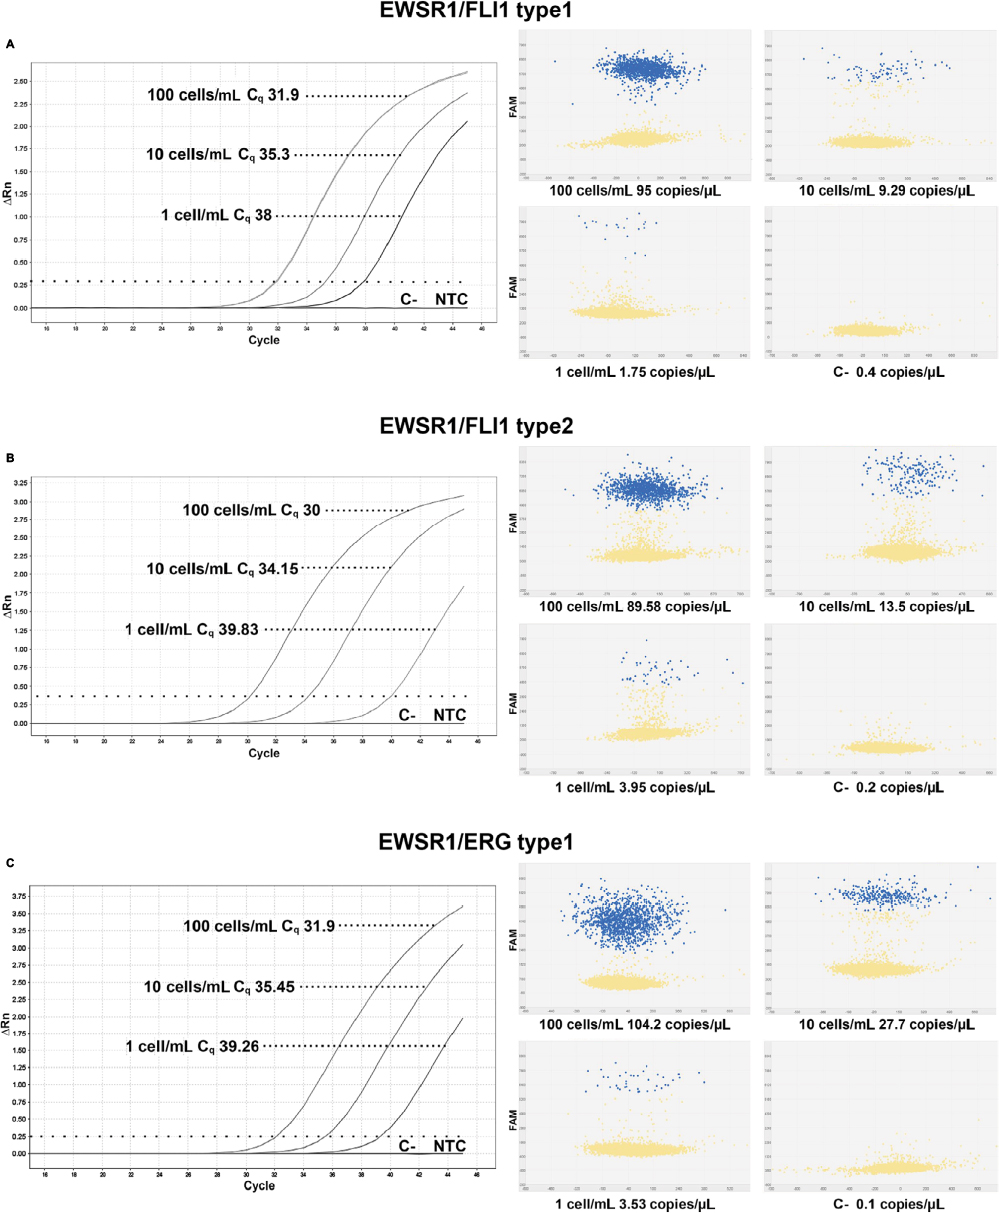
To investigate the sensitivity of the immunoseparation method to isolate CD99+ CTCs, three series of human ES cell suspensions (500, 50, and 5 cells) derived from three tissue biopsies each characterized by different molecular rearrangement (EWSR1/FLI1 type 1, EWSR1/FLI1 type 2, and EWSR1/ERG type 1) were added to PB samples of healthy donors. In independent experiments conducted on different healthy donors and with independent dilutions, EWSR1/FLI1 type 1 and type 2 were detected up to the highest dilution studied, which corresponds to 1 cell/mL of blood (Figure 3A, B). Identical sensitivity was achieved for the detection of EWSR1/ERG type 1 fusion transcript (Figure 3C). Taken together, these experiments demonstrated that RT-qPCR and RT-dPCR enabled the detection of 1 CTC/mL of blood.
ES cell suspensions used in all experiments derived from ES tissue biopsies; tumor cellularity was calculated around 90% by the pathologist and viability using Trypan blue staining was evaluated and calculated around 60%. RT-qPCR efficiency of EWSR1/FLI1 type 1, type 2, and EWSR1/ERG type 1 assays was evaluated with standard curve method. Efficiency of EWSR1/FLI1 type 1 was 98.2% (Slope: −3.417; R2: 0.994), of EWSR1/FLI1 type 2 99.8% (slope: −3.327; R2: 0.999), and for EWSR1/ERG type 1 97.7% (slope: −3.429; R2: 0.997).
Detection of chimeric transcripts from CTCs in PB of ES patients
This procedure for detection of CTCs with immunoseparation system was used to analyze 23 samples from 18 patients suffering from ES. To assess the ability of RT-qPCR and RT-dPCR to detect minimal CTCs presence in biological samples, PB samples collected from 18 patients diagnosed with ES (14 men and 4 women; median age at diagnosis 22 years, range 13–32 years) were analyzed. Diagnosis of ES was established on formalin-fixed paraffin-embedded tissue (FFPET) specimens using standard pathological criteria supported by molecular analysis on FFPET or frozen specimens. Eleven patients were characterized with EWSR1/FLI1 type 1, five patients with EWSR1/FLI1 type 2, one patient with EWSR1/ERG type 1, and one with EWSR1/ERG type 9e using RT-qPCR (Table 2). PB samples from these 18 patients were collected for the first time randomly during therapy, and the second PB sample was obtained from those patients hospitalized for the second time. A total of 23 samples were processed according to the CTCs immunoseparation method and analyzed for the presence of EWS/ETS chimeric fusion using RT-qPCR and RT-dPCR (Table 2; Figure 4). Specimens were scored positive when the amplification product corresponding to the chimeric transcript found in the primary tumor was obtained in two separate experiments by RT-qPCR reactions performed in triplicate. CTCs from patients carrying EWSR1/FLI1 type 1 were detected in 1 sample (patient 18) of 13 analyzed with RT-qPCR (Figure 4A). CTCs from patients carrying rearrangement EWSR1/FLI1 type 2 were detected in three samples (patients 5, 7, and 9) of six analyzed (Figure 4B). No amplification plot was found in the samples carrying EWSR1/ERG type 1 and type9e (Table 2). These data were confirmed by RT-dPCR. All samples from patients, and healthy volunteers (C-) were tested with RT-dPCR. With reference to the number of copies/µL detected in C-samples, we found that the same specimens that were positive with RT-qPCR confirmed their positivity by RT-dPCR. There were no significant signals found in samples carrying EWSR1/ERG type 1 (Figure 4C). Samples 4 and 4* were not tested with RT-dPCR because the test was not working in RT-dPCR.
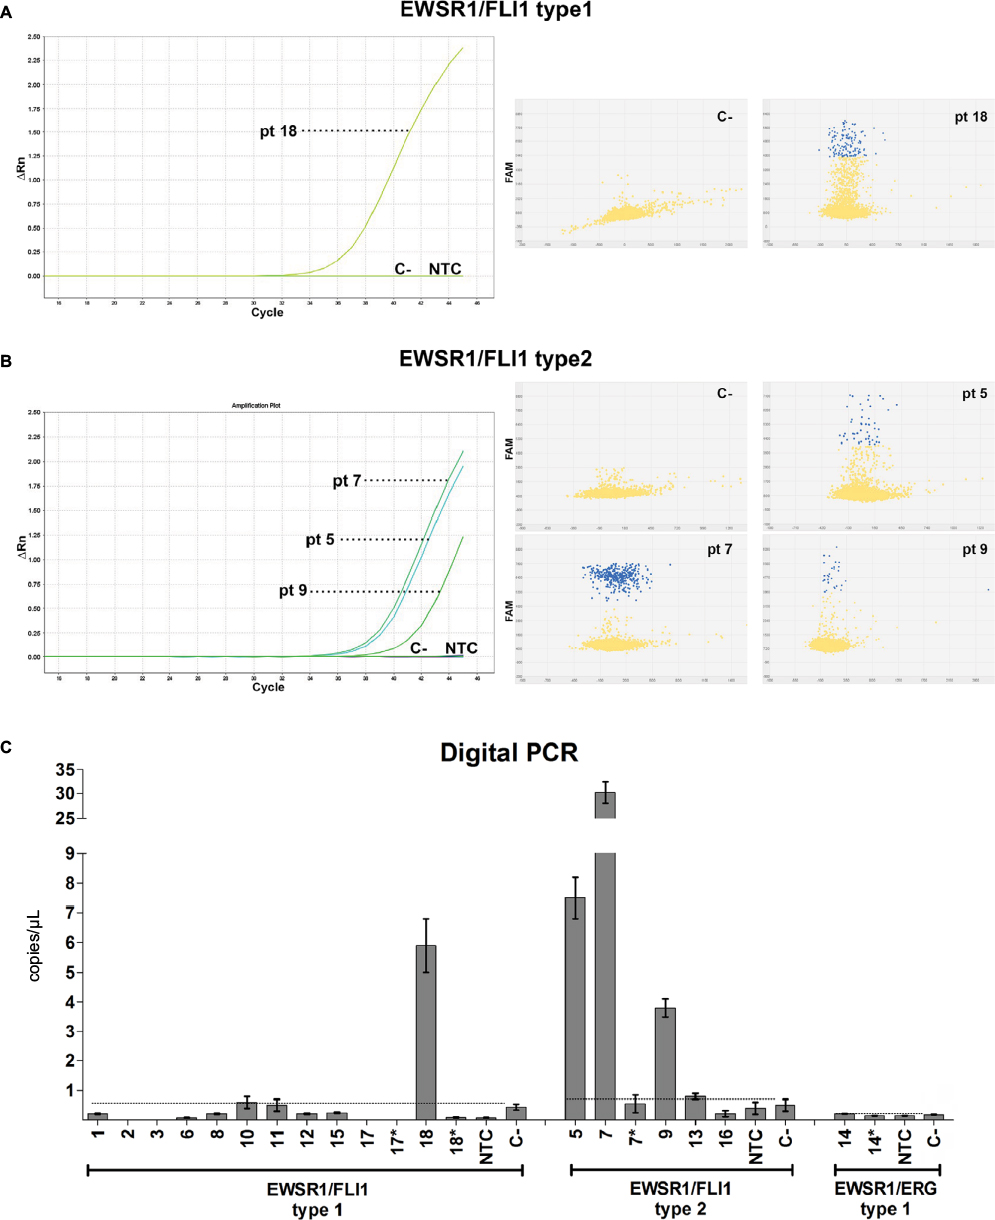 | Figure 4 Detection of CTCs in PB of Ewing sarcoma family tumor patients. Notes: 23 PB samples from 18 patients were collected and analyzed for the presence of EWSR1/ETS fusion transcript. (A) CTCs carrying typical rearrangement were analyzed with real-time quantitative reverse transcription-polymerase chain reaction for EWSR1/FLI1 type 1 (B) and for EWSR1/FLI1 type 2. All samples were analyzed twice and performed in triplicate. The figure represents one of two independent experiments. (C) All samples from patients and healthy volunteers (C-) were tested with digital reverse transcription-polymerase chain reaction. These data were calculated according to the number of copies/µL detected in the C-. Threshold values were automatically calculated by Thermo Fisher Cloud Analysis Suite in C-, manually reviewed, and then applied to samples with no additional data manipulation. The figure represents the average ± SD of two independent experiments. *indicates second PB collection after chemotherapy. Abbreviations: C-, PB sample of healthy volunteers used as negative control and treated like samples; CTCs, circulating tumor cells; PB, peripheral blood; PCR, polymerase chain reaction; NTC, no template control; pt, patient. |
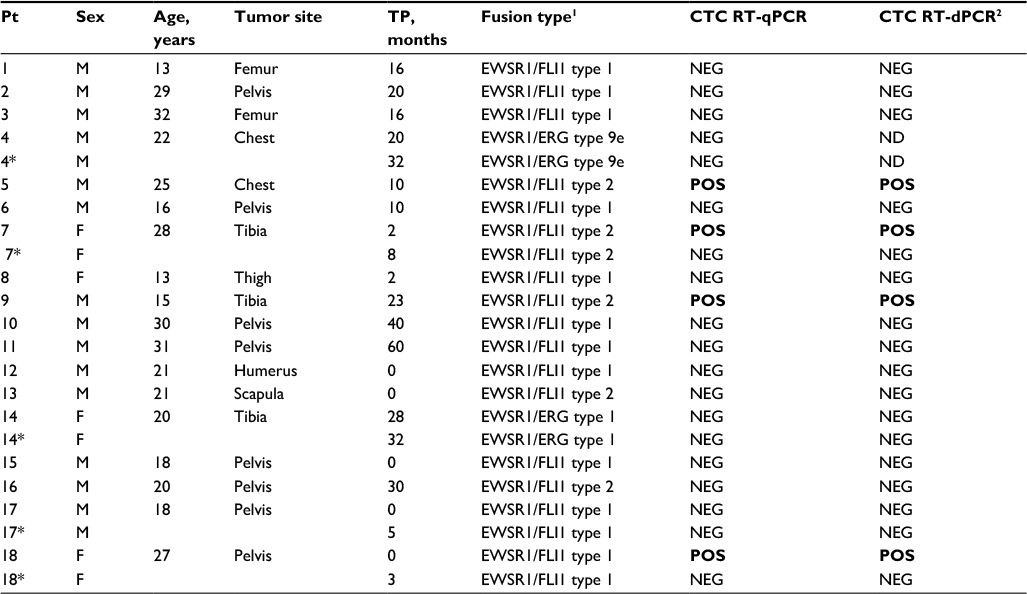 | Table 2 Molecular information for 18 patients with Ewing sarcoma family tumors and CTCs detection Notes: 1Analysis from tissue biopsy; 2threshold values were automatically calculated by the Thermo Fisher Cloud Analysis Suite in peripheral blood of healthy volunteers (C-) manually reviewed, and then applied to samples with no additional data manipulation (see also Figure 4). *Second peripheral blood collection after chemotherapy. Bold entries indicate positive cases. Abbreviations: C-, PB sample of healthy volunteers used as negative control and treated like samples; CTCs, circulating tumor cells; F; female; M, male; ND, not determined; Pt, patient; RT-dPCR, digital reverse transcription-polymerase chain reaction; RT-qPCR, quantitative real-time reverse transcription-polymerase chain reaction TP, time point passed by the diagnosis; PB, peripheral blood; POS, positive; NEG, negative. |
Samples from patients 7 and 18, positive for CTCs at diagnosis, had a control examination 3 and 6 months from the start chemotherapy, which resulted negative with RT-qPCR. The analysis performed with RT-dPCR had the same outcome: in patient 7, the first withdrawal was quantified on an average of 30.8 copies/µL of EWSR1/FLI1 type 2 fusion transcript, and after 6 months the data were reduced to 0.88 copies/µL. In patient 18, the first specimen was quantified on an average of 5.9 copies/µL of EWSR1/FLI1 type 1 fusion transcript and reduced to 0.09 copies/µL after 3 months of chemotherapy. A second testing for patients 14 and 17 by RT-qPCR analysis confirmed the negativity already observed for the previous samples. The same results were obtained by testing these specimens with RT-dPCR.
Discussion
CTCs in human cancer were previously detected and hypothesized to be closely correlated with clinical stage, lymph node metastasis, and poor prognosis.19 There is also abundant evidence insisting that the presence of CTCs is frequent in human cancers; furthermore, their levels show a gradual increasing trend with the increased tumor staging.20 Detection of CTCs in PB might, hence, possibly reveal an early existence of metastasis; however, it is not verified that the presence of CTCs necessarily implies the formation of metastasis.
Despite intensive combination therapy, one of the major obstacles to successful treatment of patients with ES is late tumor progression. Therefore, it is relevant to assess presence of occult micrometastases at diagnosis, during therapy, and during follow-up in addition to assessing their impact on disease progression and outcome. Few studies have been performed on sarcoma-derived CTCs, possibly because sarcomas are considered relatively rare neoplasms despite their poor prognosis. The majority of studies were performed on ES by reverse transcription-polymerase chain reaction (RT-PCR) analysis for the search of the fusion gene products associated with EWSR1/FLI1 and EWSR1/ERG disease marker. Genomic fusion sequences represent promising noninvasive biomarkers for improved therapy monitoring in ES. Particularly in patients with prognostically unfavorable disseminated disease, ctDNA is a valuable addition for assessment of therapy response.21
Several studies have focused on the identification of micrometastases and CTCs in PB or bone marrow through the detection of EWSR1/FLI1 or EWSR1/ERG fusion transcripts (Table 3).8,22–30 In his study, Dubois describes a novel method of detecting CTCs in patients with ES using flow cytometry with antibodies against CD99 and CD45 to provide an alternative strategy to detect circulating ES tumor cells.
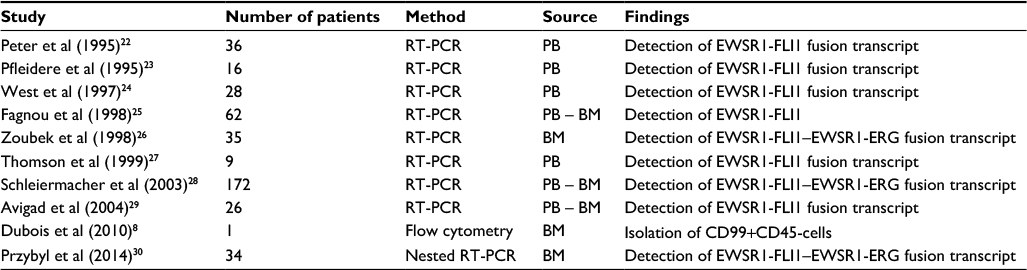 | Table 3 Published studies on circulating tumor cells from Ewing sarcoma and method used Abbreviations: BM, bone marrow; PB, peripheral blood; RT-PCR, reverse-transcription polymerase chain reaction. |
Different analytical systems for CTCs isolation and detection have been developed, and most include separation steps by size or biological characteristics, such as expression of epithelial- or cancer-specific markers. Recent technical advancements in CTCs detection and characterization include methods based on multiplex RT-qPCR and approaches based on imaging and microfilter and microchip devices.31–33 New areas of research are directed toward developing novel assays for molecular characterization of CTCs. Standardization of micrometastatic cell detection, CTCs analysis, and characterization methodologies are important for the incorporation of CTCs in prospective clinical trials to test their clinical utility. This information is mandatory for the identification of therapeutic targets and resistance mechanisms in CTCs, as well as for the stratification of patients and real-time monitoring of systemic therapies.22–30,34
This study reports, for the first time, the possibility of finding CTCs in PB with magnetic immunoseparation with the use of CD99 antigen. We report the method to isolate CTCs from PB of patients affected by ES, based on immunoseparation of CD99+ tumor cells and magnetic microbeads, followed by molecular analysis to detect specific fusion transcripts derived from chromosomal translocations that confirm the cancerous origin. Our results indicated that CD99+ ES cells were detectable in PB of healthy volunteers after adding a serial dilution of ES cells. This method, never previously described, is more sensitive compared to isolation of peripheral blood mononuclear cells (PBMCs) with Ficoll-Histopaque density gradient. Unfortunately, the most widely used approaches to isolation and enrichment of PBMC involve density gradient centrifugation in the presence of Ficoll-Histopaque, which we proved is not accurate or sensitive enough.
These reports used RT-PCR-based methods to detect tumor cells in PB taking advantage of specific gene translocations detected in ES. To test the sensitivity level of the molecular method, we reported that it is able to detect up to 10 pg of ES RNA mixed in 1 µL of nontumor RNA. The biology of ES presents a unique opportunity in that EWSR1/ETS fusion gene is the driver of oncogenesis and is present in every tumor cell, with a highly specific breakpoint. In addition, CD99 is strongly expressed in all ES cells; the combination of the two features allowed us to isolate CTCs in ES. It is worth noting that CD99 can be easily tested in mononucleated cells, which can be regarded as an excellent marker for detecting local invasion and metastasis of tumors, and prove the existence of CTCs. Molecular markers EWSR1/FLI1 type 1, type 2, and EWSR1/ERG type 1 were detected using RT-qPCR and allow CTCs detection with a limit of detection of 1 cell/mL of PB; these data were also confirmed with RT-dPCR.
Feasibility of the method was reported showing that immunoseparation is able to find CTCs in PB of patients with ES, regardless of the type of molecular rearrangement. CD99+ CTCs were detected in 4 of 23 PB samples, whereas none were observed in healthy volunteers, highlighting the important role of CD99+ in theoretically predicting ES development. We demonstrated the presence of CTCs carrying oncogenic EWSR1/FLI1 rearrangements in tumor specimens. In the cases investigated, we highlighted the presence of CTCs in three patients with EWSR1/FLI1 type 2 rearrangement. We also demonstrated the presence of CTCs carrying oncogenic EWSR1/FLI1 fusion type 1 in one patient with ES. These patient data were obtained by RT-qPCR and RT-dPCR analysis; these techniques have the potential of improving risk stratification and early response assessment in patients with this disease.
At the present time, the true biological meaning or clinical relevance of detecting CTCs in the blood of ES patients is unknown. For instance, it is not clear whether tumor cells detected in PB are equivalent to metastatic disease because as yet there is no evidence to indicate that these cells are capable of giving rise to metastases.20–30 For these reasons, to draw conclusions from a prognostic point of view, a more homogeneous population is required.
The frequency at which characteristic fusion genes were identified led to the incorporation of molecular analysis, that is, fluorescence in situ hybridization or RT-PCR, in the routine diagnostic screening for ES.18,35,36 In the present study, CTCs detection assay was established for reliable amplification of EWSR1/FLI1 and EWSR1/ERG transcript fusion genes.
Here we report the utility of cell-surface CD99 as a marker for CTCs in ES patients. For the first time, CTCs detection based on CD99 cell enrichment using immunomagnetic separation, which enables detection of CTCs in patients affected by ES, was reported. Isolation of CD99-positive CTCs will provide an understanding of the metastatic precursor subpopulation and help provide novel diagnostic treatment and prognostic options based on therapeutic monitoring of patients with ES and will play a potential role in clinical decision-making. A clinical study to determine the ability of this methodology to detect circulating ES tumor cells in blood and bone marrow of additional patients with newly diagnosed or relapsed disease is ongoing.
Acknowledgments
We thank Dr Martina Piccinni Leopardi for technical assistance in performing and managing the collection samples from ES patients. We also thank Dr Alba Balladelli and Ms Cristina Ghinelli for editing the manuscript.
Disclosure
The authors report no conflicts of interest in this work.
References
Alix-Panabieres C, Pantel K. Circulating tumor cells: liquid biopsy of cancer. Clin Chem. 2013;59(1):110–118. | ||
De Mattos-Arruda L, Cortes J, Santarpia L et al. Circulating tumour cells and cell-free DNA as tools for managing breast cancer. Nat Rev Clin Oncol. 2013;10(7):377–389. | ||
Gold B, Cankovic M, Furtado LV, et al. Do circulating tumor cells, exosomes, and circulating tumor nucleic acids have clinical utility? A report of the association for molecular pathology. J Mol Diagn. 2015;17(3):209–224. | ||
Allard WJ, Matera J, Miller MC, et al. Tumor cells circulate in the peripheral blood of all major carcinomas but not in healthy subjects or patients with nonmalignant diseases. Clin Cancer Res. 2004;10(20): 6897–6904. | ||
Cristofanilli M, Budd GT, Ellis MJ, et al. Circulating tumor cells, disease progression, and survival in metastatic breast cancer. N Engl J Med. 2004;2004(351):781–91. | ||
Lianidou ES. Circulating tumor cell isolation: a marathon race worth running. Clin Chem 2014;60(2):287–289. | ||
Chinen LT, Mello CA, Abdallah EA, et al. Isolation, detection, and immunomorphological characterization of circulating tumor cells (CTCs) from patients with different types of sarcoma using isolation by size of tumor cells: a window on sarcoma-cell invasion. Onco Targets Ther. 2014;7:1609–1617. | ||
Dubois SG, Epling CL, Teague J, et al. Flow cytometric detection of Ewing sarcoma cells in peripheral blood and bone marrow. Pediatr Blood Cancer. 2010;54(1):13–18. | ||
Khoury JD. Ewing sarcoma family of tumors. Adv Anat Pathol. 2005;12(4):212–22. | ||
Llombart-Bosch A. Small round cell tumors of bone and soft tissue: introduction. Semin Diagn Pathol. 1996;13(3):149–152. | ||
Gaspar N, Hawkins DS, Dirksen U, et al. Ewing sarcoma: current management and future approaches through collaboration. J ClinOncol. 2015;33(27):3036–3046. | ||
Delattre O, Zucman J, Melot T, et al. The ewing family of tumors – a subgroup of small-round-cell tumors defined by specific chimeric transcripts. N Engl J Med. 1994;331(5):294–299. | ||
Sorensen PH, Lessnick SL, Lopez-Terrada D, et al. A second Ewing’s sarcoma translocation, t(21;22), fuses the EWS gene to another ETS-family transcription factor, ERG. Nat Genet. 1994;6(2):429–437. | ||
Lowes LE, Allan AL. Recent advances in the molecular characterization of circulating tumor cells. Cancers. 2014;6(1):595–624. | ||
Ji JL, Jiang YZ, Tang QQ, et al. Detection of circulating tumor cells using a novel immunomagnetic bead method in lung cancer patients. J Clin Lab Anal. 2016;30(5):656–662. | ||
Kovar H, Aryee DN, Jug G, et al. EWS/FLI-1 antagonist induce growth inibition of Ewing tumor cells in vitro. Cell Growth Differ. 1996;7(4):429–437. | ||
Iinuma H, Watanabe T, Mimori K, et al. Clinical significance of circulatingtumor cells, including cancer stem-like cells, in peripheral blood for recurrenceand prognosis in patients with Dukes’ stage B and C colorectal cancer. J Clin Oncol. 2011;29(12):1547–1555. | ||
Gamberi G, Cocchi S, Benini S, et al. Molecular diagnosis in Ewing family tumors: the Rizzoli experience-222 consecutive cases in four years. J Mol Diagn. 2011;13(3):313–324. | ||
Hoshimoto S, Shingai T, Morton DL, et al. Association between circulating tumor cells and prognosis in patients with stage III melanoma with sentinel lymph node metastasis in a phase III international multicenter trial. J Clin Oncol. 2012;30(31):3819–3826. | ||
Cools-Lartigue J, Spicer J, McDonald B, et al. Neutrophil extracellular traps sequester circulating tumor cells and promote metastasis. J Clin Invest. 2013;123(8):3446. | ||
Krumbholz M, Hellberg J, Steif B, et al. Genomic EWSR1 fusion sequence as highly sensitive and dynamic plasma tumor marker in Ewing sarcoma. Clin Cancer Res. 2016;22(17):4356–4365. | ||
Peter M, Magdelenat H, Michon J, et al. Sensitive detection of occult Ewing’s cells by the reverse transcriptase-polymerase chain reaction. Br J Cancer. 1995;72(1):96–100. | ||
Pfleiderer C, Zoubek A, Gruber B, et al. Detection of tumour cells in peripheral blood and bone marrow from Ewing tumour patients by RT-PCR. Int J Cancer. 1995;64(2):135–139. | ||
West DC, Grier HE, Swallow MM, et al. Detection of circulating tumor cells in patients with Ewing’s sarcoma and peripheral primitive neuroectodermal tumor. J Clin Oncol. 1997;15(2):583–588. | ||
Fagnou C, Michon J, Peter M, et al. Presence of tumor cells in bone marrow but not in blood is associated with adverse prognosis in patients with Ewing’s tumor. Société Française d’Oncologie Pédiatrique. J Clin Oncol. 1998;16(5):1707–1711. | ||
Zoubek A, Ladenstein R, Windhager R, et al. Predictive potential of testing for bone marrow involvement in Ewing tumor patients by RT-PCR: a preliminary evaluation. Int J Cancer. 1998;79(1):56–60. | ||
Thomson B, Hawkins D, Felgenhauer J, et al. RT-PCR evaluation of peripheral blood, bone marrow and peripheral blood stem cells in children and adolescents undergoing VACIME chemotherapy for Ewing’s sarcoma and alveolar rhabdomyosarcoma. Bone Marrow Transplant. 1999;24(5):527–533. | ||
Schleiermacher G, Peter M, Oberlin O, et al. Increased risk of systemic relapses associated with bone marrow micrometastasis and circulating tumor cells in localized Ewing tumor. J Clin Oncol. 2003;21(1):85–91. | ||
Avigad S, Cohen IJ, Zilberstein J, et al. The predictive potential of molecular detection in the nonmetastatic Ewing family of tumors. Cancer. 2004;100(5):1053–1058. | ||
Przybyl J, Kozak K, Kosela H et al. Gene expression profiling of peripheral blood cells: new insights into Ewing sarcoma biology and clinical applications. Med Oncol. 2014;31(8):109. | ||
Fehm T, Solomayer EF, Meng S, et al. Methods for isolating circulating epithelial cells and criteria for their classification as carcinoma cells. Cytotherapy. 2005;7(2):171–185. | ||
Königsberg R, Obermayr E, Bises G, et al. Detection of EpCAM positive and negative circulating tumor cells in metastatic breast cancer patients. Acta Oncol. 2011;50(5):700–710. | ||
Sieuwerts AM, Kraan J, Bolt J, et al. Anti-epithelial cell adhesion molecule antibodies and the detection of circulating normal-like breast tumor cells. J Natl Cancer Inst. 2009;101(1):61–66. | ||
Lianidou ES, Mavroudis D, Sotiropoulou G, Agelaki S, Pantel K. What’s new on circulating tumor cells? A meeting report. Breast Cancer Res. 2010;12(4):307. | ||
Antonescu CR. The role of genetic testing in soft tissue sarcoma. Histopathology. 2006;48(1):13–21. | ||
Lazar A, Abruzzo LV, Pollock RE, Lee S, Czerniak B. Molecular diagnosis of sarcomas: chromosomal translocations in sarcomas. Arch Pathol Lab Med. 2006;130(8):1199–1207. |
 © 2018 The Author(s). This work is published and licensed by Dove Medical Press Limited. The
full terms of this license are available at https://www.dovepress.com/terms
and incorporate the Creative Commons Attribution
- Non Commercial (unported, 3.0) License.
By accessing the work you hereby accept the Terms. Non-commercial uses of the work are permitted
without any further permission from Dove Medical Press Limited, provided the work is properly
attributed. For permission for commercial use of this work, please see paragraphs 4.2 and 5 of our Terms.
© 2018 The Author(s). This work is published and licensed by Dove Medical Press Limited. The
full terms of this license are available at https://www.dovepress.com/terms
and incorporate the Creative Commons Attribution
- Non Commercial (unported, 3.0) License.
By accessing the work you hereby accept the Terms. Non-commercial uses of the work are permitted
without any further permission from Dove Medical Press Limited, provided the work is properly
attributed. For permission for commercial use of this work, please see paragraphs 4.2 and 5 of our Terms.