")
Back to Journals » International Journal of General Medicine » Volume 15
Derivation and Validation a Risk Model for Acute Kidney Injury and Subsequent Adverse Events After Cardiac Surgery: A Multicenter Cohort Study
Authors Zhang H , Yu M, Wang R, Fan R, Zhang K, Chen W, Chen X
Received 19 December 2021
Accepted for publication 16 August 2022
Published 10 October 2022 Volume 2022:15 Pages 7751—7760
DOI https://doi.org/10.2147/IJGM.S354821
Checked for plagiarism Yes
Review by Single anonymous peer review
Peer reviewer comments 2
Editor who approved publication: Dr Scott Fraser
Hang Zhang,1,2,* Min Yu,3,* Rui Wang,1 Rui Fan,1 Ke Zhang,4 Wen Chen,1 Xin Chen1
1Department of Thoracic and Cardiovascular Surgery, Nanjing First Hospital, Nanjing Medical University, Nanjing, 210006, People’s Republic of China; 2Department of Thoracic Surgery, Shanghai General Hospital, Shanghai Jiao Tong University School of Medicine, Shanghai, 201620, People’s Republic of China; 3Department of Cardiovascular Surgery, Shanghai General Hospital, Shanghai Jiao Tong University School of Medicine, Shanghai, 200080, People’s Republic of China; 4Department of Thoracic and Cardiovascular Surgery, Changzhou Second People’s Hospital, Nanjing Medical University, Changzhou, 213003, People’s Republic of China
*These authors contributed equally to this work
Correspondence: Wen Chen; Xin Chen, Department of Thoracic and Cardiovascular Surgery, Nanjing First Hospital, Nanjing Medical University, No. 68 Changle Road, Nanjing, 210006, People’s Republic of China, Tel +86-25-52271363, Fax +86-25-52247821, Email [email protected]; [email protected]
Purpose: To establish a risk model for acute kidney injury and subsequent adverse events in Chinese cardiac patients.
Patients and Methods: This study included 11,740 patients who had cardiac surgery at 14 institutions in China. Patients were randomly assigned to a derivation cohort (n = 8197) or a validation cohort (n = 3543). Variables ascertained during hospitalization were screened using least absolute shrinkage and selection operator and logistic regression to construct a nomogram model. Model performance was evaluated using C-statistic, calibration curve, and Brier score. The nomogram was further compared with the five conventional models: Mehta score, Ng score, AKICS score, SRI score, and Cleveland Clinic score. Acute kidney injury was defined according to the Kidney Disease Improving Global Outcomes criteria. Subsequent adverse events included mid-term outcomes: death from all causes and major adverse kidney events (defined as composite outcome of death from renal failure, dialysis, and advanced chronic kidney disease).
Results: Acute kidney injury occurred in 3237 (27.6%) patients. The model included 12 predictors. The total score generated from the nomogram ranged from 0 to 556. The nomogram achieved a C-statistic of 0.825 and 0.804 in the derivation and validation cohorts, respectively, and had well-fitted calibration curves. The model performance of the nomogram was better than other five conventional models. After risk stratification, moderate-risk or high-risk groups were associated with significantly higher rates of death from all causes and major adverse kidney events compared with low-risk group during 7-year follow-up.
Conclusion: The nomogram could serve as an effective tool for predicting acute kidney injury and evaluating its subsequent adverse events after cardiac surgery.
Keywords: acute kidney injury, cardiac surgery, prediction model, nomogram
Introduction
Cardiac surgery is more and more frequent in a growing population of older patients with multiple co-morbidities in developing countries. As one of the most serious complications after cardiac surgery, the incidence of cardiac surgery-associated acute kidney injury (CSA-AKI) is reported ranging 26.0–28.5%.1 CSA-AKI is strongly associated with short-term surgical complications and long-term adverse outcomes, including increased risk of cardiovascular events, advanced chronic kidney disease, and death.2–4
Early identification of patients at high risk of AKI is essential to trigger the use of preventive care actions. In the past few decades, multiple efforts have been made to develop various models to predict AKI after cardiac surgery. The Mehta score,5 Simplified Renal Index (SRI) score,6 and Cleveland Clinic score7 are the most widely used scoring systems for predicting CSA-AKI in Western countries. The predictive ability of Mehta score and Cleveland Clinic score had been adequately validated in North American patient populations. However, adoption of these models to Chinese patient population would be of challenge, since the demographic, clinical characteristics, and health-care system are quite different from the existing model derivation cohorts.
In 2013, the International Society of Nephrology promoted the “0 by 25” initiative for AKI, namely, zero deaths of patients with untreated acute kidney failure by 2025.8 The vision aims to improve the diagnosis and treatment of AKI and appears inspiring. In contrast to the United States, over the past decade, the proportion of cardiac surgery continues to rise in China.9,10 However, to date, a little progress has been made in predicting CSA-AKI in Chinese cardiac patients. Besides, no model has been used to evaluate the subsequent adverse events of CSA-AKI. Our first objective was therefore to establish a nomogram model for CSA-AKI which included preoperative, intraoperative, and early postoperative variables with the data retrieving from three registers in China. The nomogram was then compared with that of five conventional models (Mehta score, Ng score,11 AKICS score,12 SRI score, and Cleveland Clinic score) to determine whether these models could be used to predict CSA-AKI in Chinese patients. Given that AKI acts as a powerful predictor of poor mid-/long-term prognosis, finally, we aimed to use the nomogram to evaluate mid-term outcomes of 7-year follow-up.
Materials and Methods
Study Design and Participants
Consecutive patients who had cardiac surgery at 14 institutes, China, admitted between January 2013 and December 2020, were recruited from three population-based registers: Jiangsu Province Coronary Artery Bypass Grafting Registry, Patient Data Management Platform, and Chinese Cardiac Surgery Registry. All data were de-identified and were pre-processed by the administrators at each institute. Before delivering for analysis, the data integrity was screened and examined by two administrators of each institution.
We enrolled patients who had received coronary artery bypass grafting surgery (CABG), valve surgery, and a combination of both treatments. Patients were excluded after meeting the following criteria: (i) younger than 18 years old; (ii) preoperative AKI, dialysis, or end-stage renal disease; (iii) kidney transplantation; (iv) missing data of serum creatinine. The research was approved by the Ethical Committee of Nanjing First Hospital, and patient informed consent was waived given its retrospective nature.
End Point Definition
The primary end point was any-stage AKI according to the Kidney Disease Improving Global Outcomes (KDIGO) definition,13 specifically, an acute increase in serum creatinine (Scr) from baseline of ≥0.3 mg/dL within 48 hours or >1.5 times the baseline level within 7 days, or a requirement for renal replacement therapy. The Scr level measured within 7 days before surgery was used as the reference value. We did not use urine output to define AKI because of its unavailability for the majority of patients. Secondary end points were 7-year follow-up outcomes: (i) death from all causes; and (ii) major adverse kidney events (MAKEs), defined as the composite outcome of death from renal failure, dialysis, and advanced chronic kidney disease (estimated glomerular filtration rate [eGFR] <30 mL/min/1.73 m2 for at least three months). eGFR was calculated using the Chronic Kidney Disease Epidemiology Collaboration (CKD-EPI) creatinine equation.14
Potential Predictive Variables and Definitions
The potential predictive variables are listed in Table 1. Quantitative variables were categorized according to the clinically meaningful cut-off values or previous literature reports. For example, we classified age into three groups, including <60, 60–70, and >70 years. Scr was classified into three groups, including <1.2, 1.2–2.0, and >2.0 mg/dL. Cardiopulmonary bypass (CPB) time was dichotomized at a value of 116 minutes according to the maximal Youden index.15 To compare with previous data,12,16 we chose a cut-off value of 120 minutes for subsequent analysis. Chronic kidney disease was defined as any one of the following renal diseases: hypertensive renal disease, diabetic nephropathy, primary glomerulonephritis, nephrotic syndrome, or other renal disease with eGFR <60 mL/min/1.73 m2, lasting more than three months. Critical preoperative state was defined as any one of the following preoperative situations: cardiogenic shock, cardiopulmonary resuscitation, ventricular fibrillation or flutter, intra-aortic balloon pump implantation, or an ejection fraction <30%. Other variables’ definitions are provided in Supplementary Table 1. This study adhered to the Transparent Reporting of a Multivariable Prediction Model for Individual Prognosis or Diagnosis (TRIPOD) guideline for reporting.17
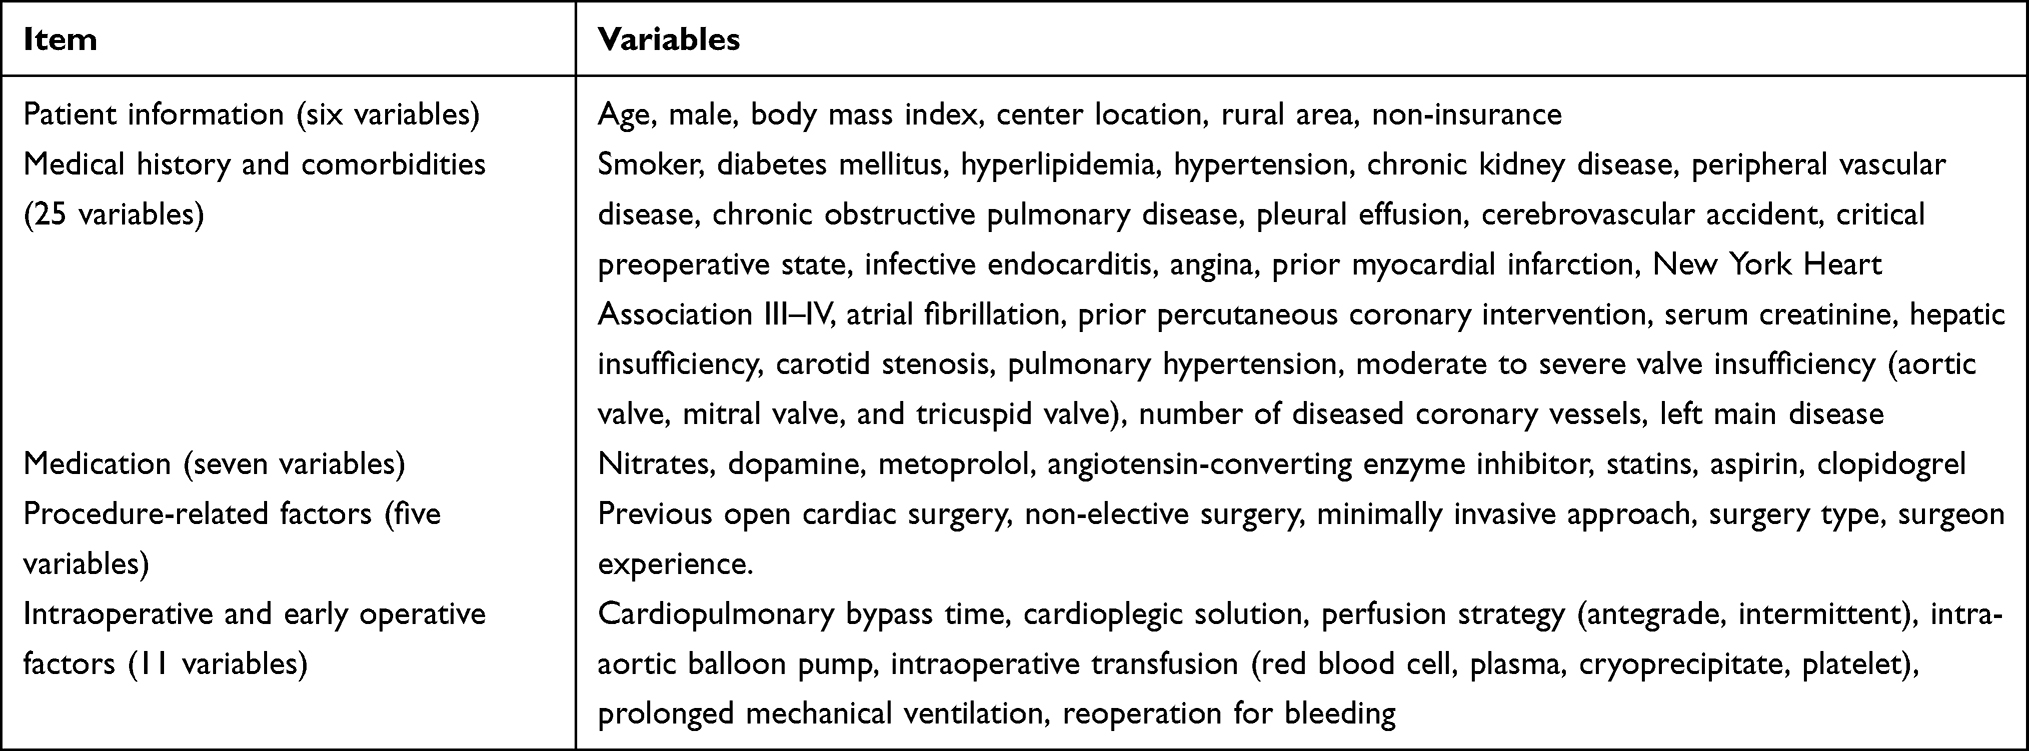 |
Table 1 Variable Overview |
Statistical Analysis
Categorical variables are reported as frequency (n) and proportion (%). Quantitative variables are summarized with means ± standard deviations in the case of normal distribution or medians (interquartile range) otherwise. Statistical differences between derivation and validation cohorts were carried out using the chi-square test, Fisher’s exact probability method, t-test, or Mann–Whitney U-test as appropriate. As most data were collected through manual review of the medical records, missing values are unavoidable. Our dataset was highly complete with most variables having missing rates ranging 0–4.7%. The missing values were handled with multiple imputation method (mice package of R, version 3.13.0).
The prediction model was developed in the derivation dataset and it consisted of two main stages: (i) feature selection; and (ii) multivariate logistic regression analysis. This is a logistic regression model. Multicollinearity of the variables was tested and excluded by establishing the variance inflation factor (VIF); the maximum VIF was 1.45, indicating no multicollinearity existed between variables.18 To identify the risk factors, clinical characteristics ascertained during hospitalization were entered into the feature selection process using least absolute shrinkage and selection operator (LASSO). As a machine learning approach, LASSO regression adds the L1 regularization as a penalty, shrinking the regression coefficients of weak factors towards zero with larger penalties.19 It generates a model that minimizes the prediction error. The most predictive variables were determined by the tuning parameter (minimum lambda plus a standard error) using an automated 10-fold cross-validation method (glmnet package of R, version 4.0–2).
Selected predictors were incorporated in a logistic regression analysis to generate a nomogram model (rms package of R, version 6.1–0). Model discrimination was assessed using the C-statistic, an index equivalent to the area under the receiver operating characteristic curve (AUC). The relationship between predicted probabilities and observed outcome frequencies was accessed by the Brier score and was visualized with a calibration plot using 1000 bootstrap resampling method. Lower Brier score indicates superior model calibration.20 In both derivation and validation cohorts, we compared the discrimination and calibration of the nomogram with five conventional scoring systems: Mehta score, Ng score, AKICS score, SRI score, and Cleveland Clinic score. The clinical practice and benefits of the models were estimated by decision curve analyses (rmda package of R, version 1.6).21 To facilitate clinical use of the model, we calculated the total score for each patient by summing the points of each factor. Patients were stratified into three risk groups based on the score distribution: low-risk group (<20th percentile), moderate-risk group (20th-80th percentile), and high-risk group (>80th percentile).
Next, we evaluated mid-term outcomes (two events: death from all causes and MAKEs) according to the three risk-stratified groups. Time-to-event analysis was performed using Cox proportional hazards model to compare death from all causes. Competing risk analysis was performed in the Fine and Gray model to compare MAKEs after adjusting death as a competing risk (cmprsk package of R, version 3.5.3). Hazard ratios (HRs), sub-distribution HRs (SHRs), and their two-sided 95% confidence intervals (CIs) were determined. Statistical analyses were performed using R (version 4.0.3, http://www.r-project.org/). A two-sided P value <0.05 indicated statistically significant.
Results
Characteristics of the Cohorts
From January 2013 to December 2020, a total of 11,740 participants were included in the analysis. They were randomly assigned to a derivation cohort (n = 8197) or a validation cohort (n = 3543), with a split ratio of 7:3. The analysis workflow is shown in Supplementary Figure 1. The baseline characteristics were similar between the two cohorts. The rates of AKI were 27.6%, 27.5%, and 27.8% in the total, derivation, and validation cohorts, respectively (Supplementary Table 2). The clinical characteristics of patients in the derivation and validation cohorts who did or did not develop CSA-AKI are listed in the Supplementary Table 3.
Feature Selection
Fifty-four variables were included in LASSO regression (Figure 1A). The results showed that 14 variables remained significant predictors of AKI, including age, male, diabetes mellitus, hypertension, chronic kidney disease, critical preoperative state, infective endocarditis, Scr, surgery type, CPB time, intra-aortic balloon pump, intraoperative red blood cell (RBC) transfusion, prolonged mechanical ventilation (PMV), and reoperation for bleeding (Figure 1B). Inclusion of these 14 predictors in a multivariate logistic regression model resulted in 12 predictors (excluded male and reoperation for bleeding) that were statistically significant for AKI and were included in the final model (Table 2).
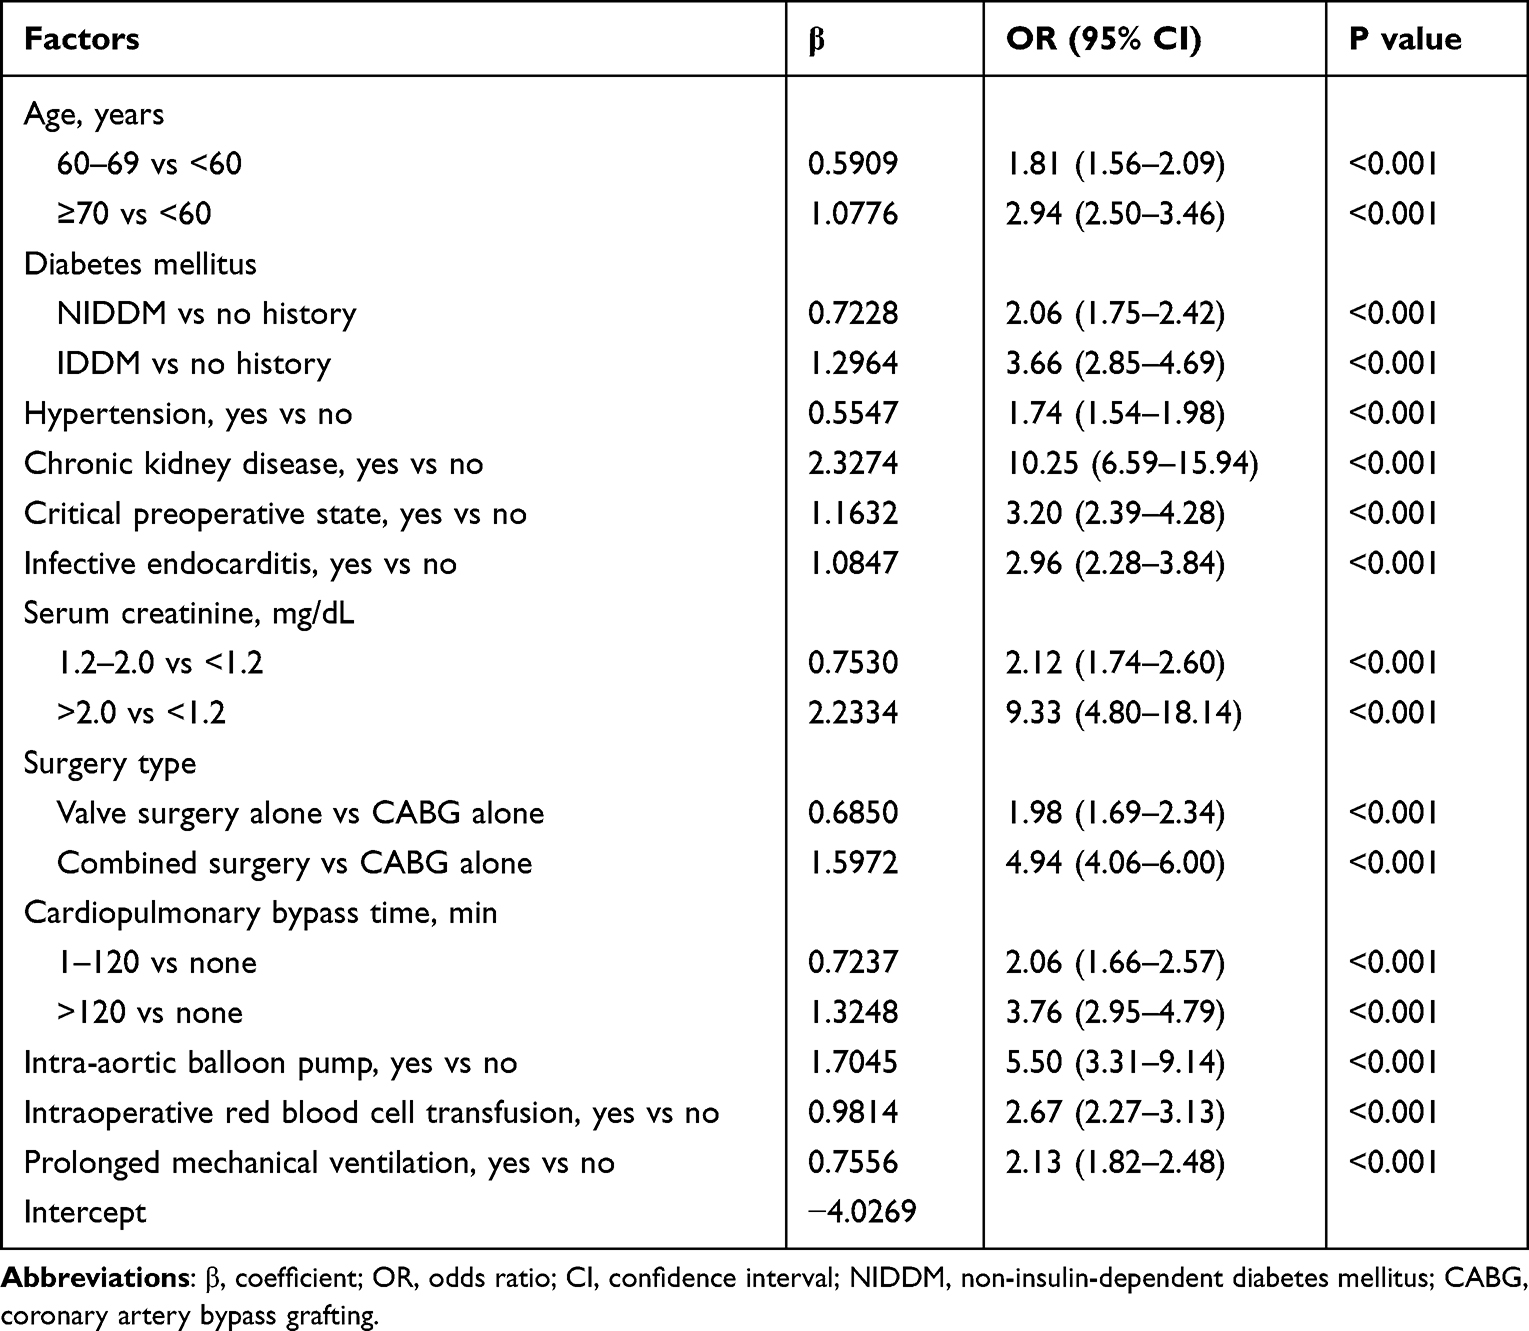 |
Table 2 Multivariate Logistic Regression Model Showing the Independent Risk Factors of Acute Kidney Injury in the Derivation Cohort |
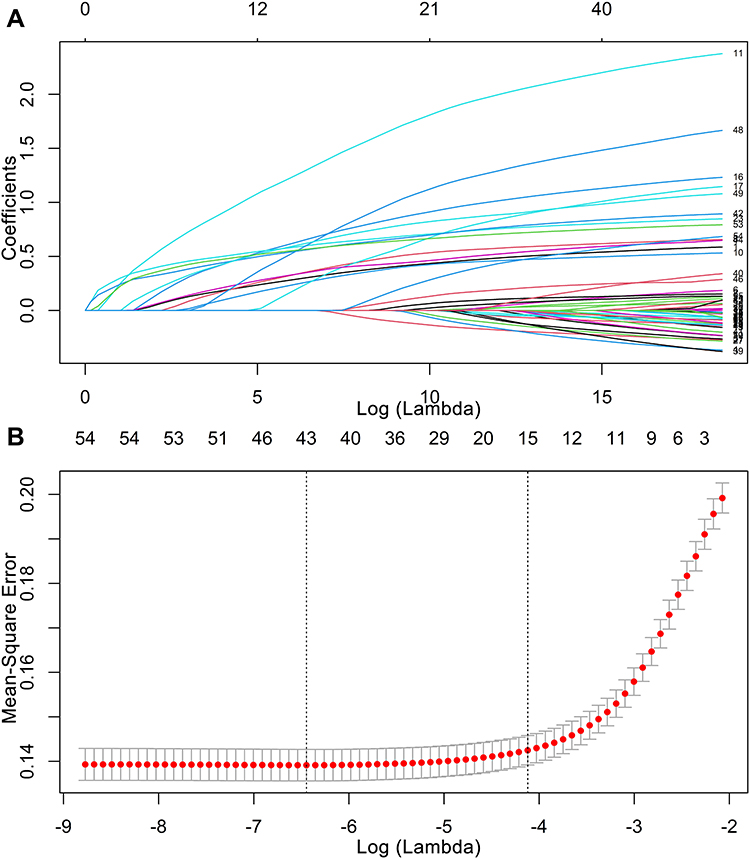 |
Figure 1 Feature selection using least absolute shrinkage and selection operator regression. (A) Coefficient profiles of 54 variables. (B) Identification of optimal penalization coefficient using 10-fold cross-validation via minimum lambda plus a standard error criterion (14 variables). |
Nomogram and Model Performance
A nomogram model was generated based on the coefficients of the logistic regression (Figure 2). The nomogram demonstrated good discrimination for predicting AKI, with a C-statistic of 0.825 (95% CI 0.815–0.835) and an adjusted C-statistic of 0.819. Correspondingly, in the validation cohort, the nomogram achieved a C-statistic of 0.804 (95% CI 0.789–0.820). The 1000-resample bootstrapped calibration plot showed an optimal agreement between the predicted risk and observed frequency in both cohorts (Figure 3).
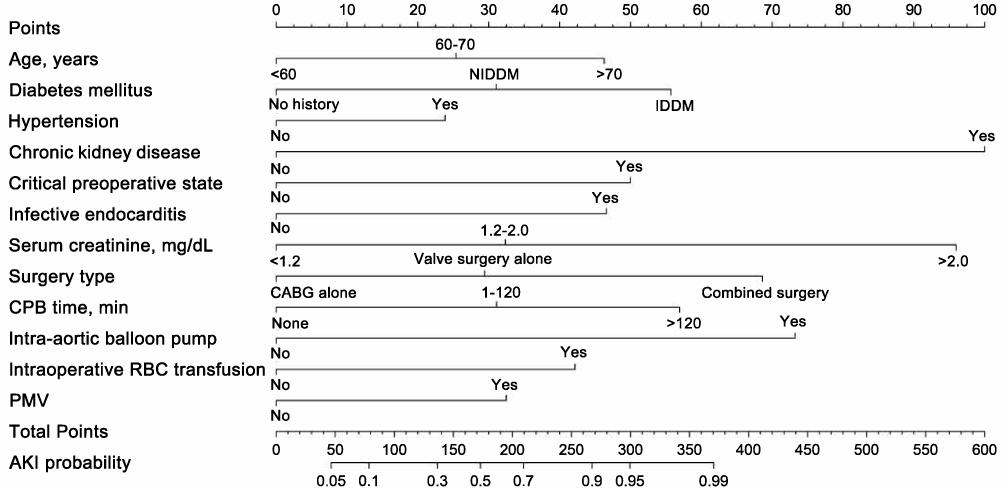 |
Figure 2 Nomogram to predict the probability of cardiac surgery-associated acute kidney injury. Abbreviations: NIDDM, non-insulin-dependent diabetes mellitus; CABG, coronary artery bypass grafting; CPB, cardiopulmonary bypass; PMV, prolonged mechanical ventilation; CI, confidence interval. |
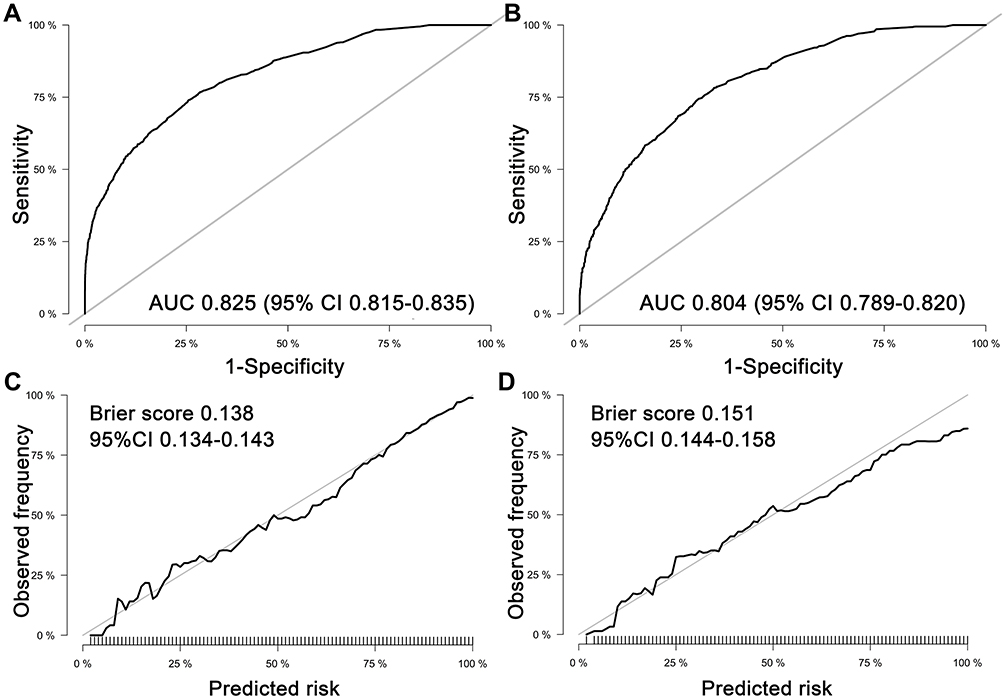 |
Figure 3 Model performance for evaluating cardiac surgery-associated acute kidney injury. The area under the curves of the nomogram for predicting acute kidney injury in the derivation (A) and validation (B) cohorts. Calibration curves of the nomogram for predicting acute kidney injury in the derivation (C) and validation (D) cohorts. Abbreviations: AUC, area under the curve; CI, confidence interval. |
Model Comparisons
The detailed comparison between the nomogram and the five models (Mehta score, Ng score, AKICS score, SRI score, and Cleveland Clinic score) is listed in Supplementary Table 4. In both cohorts, the nomogram model had better discrimination and calibration than other five models. Decision curve analyses revealed that the nomogram model had a superior net benefit over other five models for most of the examined probabilities (Supplementary Figure 2).
Mid-Term Outcomes According to Risk Stratification
In the derivation cohort, the patients were stratified into low-risk, moderate-risk, and high-risk groups with two knots score being placed at 60 and 165, corresponding to the 20th and 80th percentile of score distribution, respectively. The risks of AKI for the three risk groups were approximately similar in both cohorts (Supplementary Figure 3). The percentage of patients in risk category is shown in Supplementary Table 5.
The mid-term follow-up data were extracted from our center, and 2786 consecutive patients were available for analysis (January 2013-June 2019). They were allocated to low-risk group (score <60, n = 557), moderate-risk group (score ≥60/≤165, n = 1625), and high-risk group (score >165, n = 604) by calculating each individual score. Data were censored on 31st January 2020. One hundred and forty-nine patients (5.3%) were lost to follow-up and were included in the analysis according to the last data recorded in the registry. The missing follow-up rates were 4.7%, 5.4%, and 5.8% for low-risk, moderate-risk, and high-risk groups, respectively; no significant difference was found between the three groups (P = 0.683). Higher score group was associated with significantly higher probabilities of death and MAKEs during the 7-year follow-up. With the low-risk group used as the reference category, the rates of death from all causes were 8.9% (95% CI 6.3–11.3%) for moderate-risk group (HR 2.01, 95% CI 1.12–3.61; P = 0.012) and 19.4% (95% CI 12.9–25.5%) for high-risk group (HR 4.50, 95% CI 2.47–8.22; P < 0.001) (Table 3 and Figure 4A). Similar findings were observed for MAKEs after adjusting for death as a competing risk. The rates of MAKEs were 5.7% (95% CI 3.1–9.5%) for moderate-risk group (SHR 5.24, 95% CI 1.63–16.90; P = 0.006) and 10.2% (95% CI 6.0–15.7%) for high-risk group (SHR 11.30, 95% CI 3.47–36.71; P < 0.001) (Table 3 and Figure 4B).
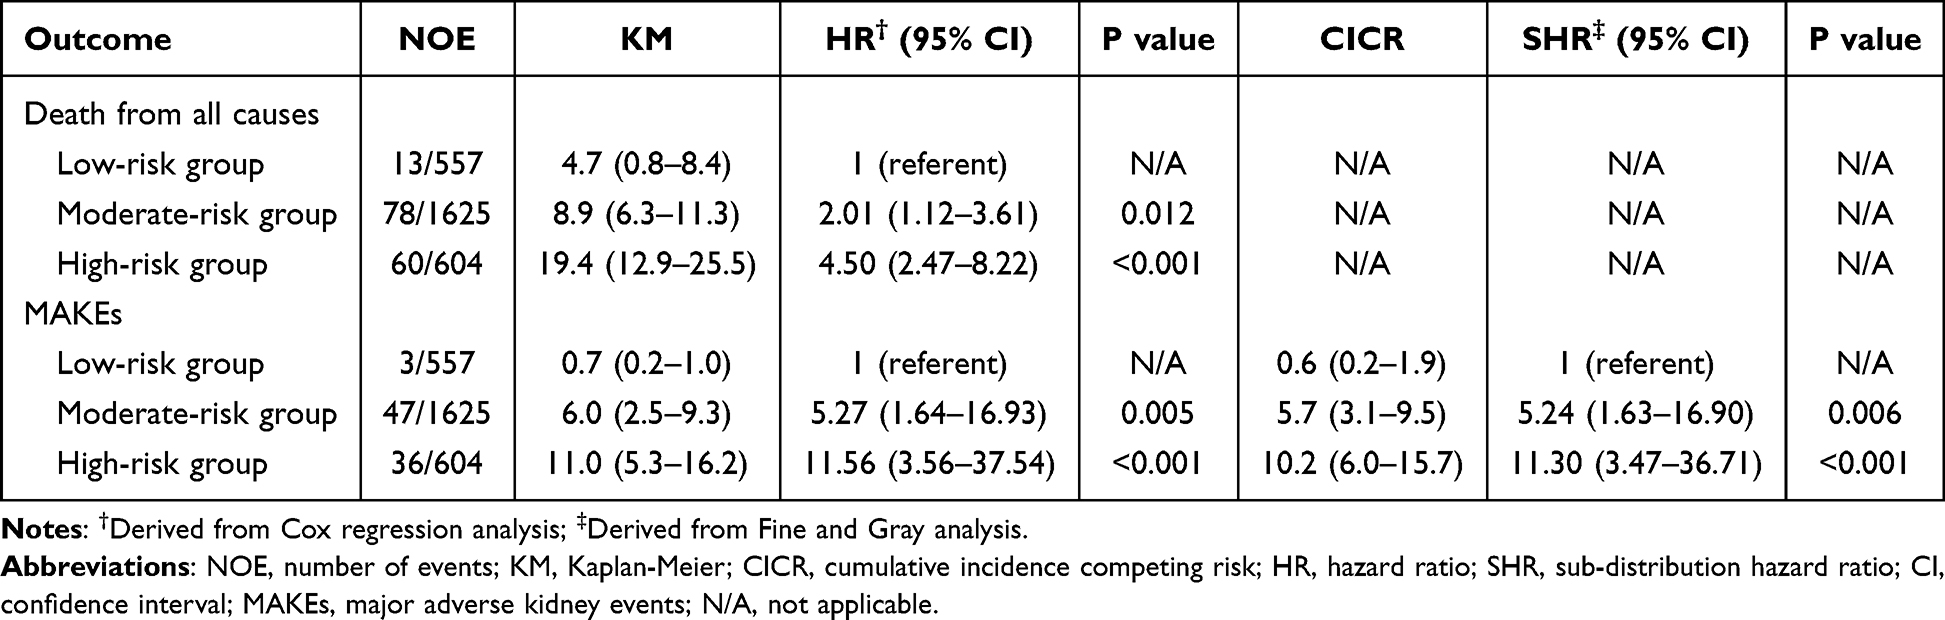 |
Table 3 7-Year Cumulative Incidences of Death from All Causes and MAKEs by Risk Groups |
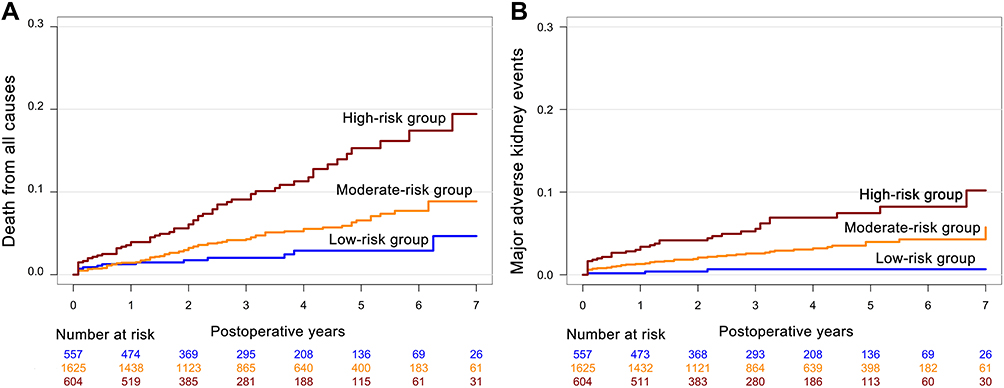 |
Figure 4 Cumulative incidence curves for death from all causes (A) and major adverse kidney events (B) after risk stratification. Abbreviation: MAKEs, major adverse kidney events. |
Discussion
Using a large cohort from 14 Chinese cardiac centers, we developed and validated a nomogram model to predict AKI and evaluate subsequent adverse outcomes in patients undergoing cardiac surgery. The nomogram demonstrated better discrimination and calibration compared with the other five scoring systems. Additionally, we stratified patients into low-risk, moderate-risk, and high-risk groups according to the score generated from the nomogram. Higher score group was associated with higher risks of death from all causes and MAKEs during 7-year follow-up. These findings suggested that the nomogram could serve as a risk-calculated tool for enhancing the risk stratification of CSA-AKI and its relevant clinical outcomes in Chinese cardiac patients. We suggest that the model could be used for evaluating the risk of AKI within 24 hours after ICU admission.
Among 54 variables, we identified 12 important risk factors associated with CSA-AKI. Feature selection procedure is one of the most important processes when constructing a prediction model. Logistic regression is commonly used. Traditional approach that included a set of variables to generate a model tends to lead to overfitting.22 The feature selection strategy we applied in this study, which is a combination of machine learning and logistic regression method, provides insights on handing clinical data. LASSO is an alternative and effective option in handling high-dimensionality data. It penalizes magnitude of regression coefficients and excludes variables with a zero coefficient. A particular advantage of this technique is that it avoids both overfitting and overestimation during model derivation,19 thus identifying the strongest predictors among a number of exposure variables. In this study, some predictors are consistent with previous researches, including advanced age, diabetes mellitus, hypertension, critical preoperative state, Scr, surgery type, CPB time, and intraoperative RBC transfusion. Infective endocarditis and PMV are new risk factors that are not incorporated in the previous scoring systems. This suggests that, despite ethnic differences, AKI may have some common risk factors. However, these risk factors have different coefficients between races, and thus contributing different weights in the models.
We compared the performance of the five conventional models and found none of them demonstrated adequate power for predicting AKI in Chinese patients, both in terms of discrimination and calibration. Several factors may affect their wide adoption. First, the AKI definitions were various in the previous studies. In 2012, the diagnostic criteria of AKI were revised significantly by the KDIGO organization. Therefore, the models established before 2012 may be imprecise and should be cautiously applied to current clinical practice.23 Second, the Mehta score, Cleveland Clinic score, and SRI score were developed principally for AKI requiring renal replacement therapy (RRT-AKI), which is rare and catastrophic stage of AKI, with incidences of 1.4–2.2% in their reports, obviously lower than the any-stage AKI rate (27.6%) in our study. Ranucci et al24 validated the three models in a single-center study. They found that the three models showed excellent predictive ability for RRT-AKI, but were not well-performed for predicting non-RRT-AKI. Similarly, Che et al25 found that the Cleveland Clinic score and SRI score had poor classification (AUCs ranged from 0.516 to 0.673), and cannot be applied in Chinese AKI patients. Third, most of previous prediction models only attached importance to preoperative variables. Given that the occurrence of AKI is a dynamic process and is particularly affected by procedure-related factors, we suggest that all preoperative, intraoperative, and early postoperative parameters should be screened for assessment during model derivation.26 Taken together, these data indicated that the study end point, race, and sample source are still pivotal factors and different models may be more suitable to apply to local populations.
Although AKI may be reversible, some of the patients develop mild or even transient AKI that could lead to CKD or adverse clinical outcomes.27,28 Particularly in patients with pre-existing renal disease (eg, in older patients, high levels of Scr), AKI substantially accelerates the severity of kidney dysfunction and its progression to end-stage renal disease or adverse events.29,30 The pathophysiology and precise mechanism of AKI-to-CKD transition are complex and remain not fully understood. Of note, the nomogram model did not only predict CSA-AKI, higher score group was also associated with higher rates of mid-term death and MAKEs. When considering the clinical implications, we suggest that this model may be useful in enriching patient cohorts for clinical trials or establishing benchmarks of intensive care. Using the nomogram may help in choosing preventive strategies in the perioperative management of AKI patients. These strategies may include individualized blood pressure control, change of the surgical procedures (eg, change from on-pump to off-pump surgery), reduced CPB duration, optimizing hemodynamic status, and intensified airway management (eg, early extubation).
Our study has several strengths. We included 14 hospitals, and more than 11,000 Chinese cardiac patients. Compared with previous study of AKI, defined as RRT-AKI, a definition of any-stage AKI was used in this study, thus extending the risk model to milder AKI patients. Besides, our study revealed that AKI is strongly associated with poor clinical prognosis; an AKI prediction model could also be useful for evaluating subsequent adverse outcomes of CSA-AKI. Several limitations of this study should also be acknowledged. First, although the data were prospectively collected with adequate quality, the ascertainment or selection bias from a retrospective in design could not be fully avoided. Second, the model was developed based on routine variables extracted from the electronic health records. Therefore, the risk model can only apply the variables that have been collected. Third, although we developed and validated the model with a multicenter data resource, the model was not externally validated in other races or regions. It would be of caution to apply the model to other developing countries. External validation of the model in larger scale of Chinese patient cohorts is also needed.
Conclusion
The nomogram provided an effective tool for predicting acute kidney injury and evaluating its subsequent adverse events after cardiac surgery.
Data Sharing Statement
All data were retrieved from the databases and are available from the corresponding author on reasonable request.
Ethical Approval
The Ethical Committee of Nanjing First Hospital approved the study. Consent to participate for this study was waived because no individual patients were identified. This study was conducted in accordance with the Declaration of Helsinki.
Funding
This work was supported by the National Natural Science Foundation of China (No. 82170272 to Xin Chen), and Clinical Research Plan of SHDC (No. SHDC2020CR3100B to Min Yu).
Disclosure
The authors report no conflicts of interest in this work.
References
1. Neugarten J, Sandilya S, Singh B, Golestaneh L. Sex and the risk of AKI following cardio-thoracic surgery: a meta-analysis. Clin J Am Soc Nephrol. 2016;11(12):2113–2122. doi:10.2215/CJN.03340316
2. James MT, Bhatt M, Pannu N, Tonelli M. Long-term outcomes of acute kidney injury and strategies for improved care. Nat Rev Nephrol. 2020;16(4):193–205. doi:10.1038/s41581-019-0247-z
3. Hobson CE, Yavas S, Segal MS, et al. Acute kidney injury is associated with increased long-term mortality after cardiothoracic surgery. Circulation. 2009;119(18):2444–2453. doi:10.1161/CIRCULATIONAHA.108.800011
4. Vanmassenhove J, Kielstein J, Jörres A, Biesen WV. Management of patients at risk of acute kidney injury. Lancet. 2017;389(10084):2139–2151. doi:10.1016/S0140-6736(17)31329-6
5. Mehta RH, Grab JD, O’Brien SM, et al. Bedside tool for predicting the risk of postoperative dialysis in patients undergoing cardiac surgery. Circulation. 2006;114(21):2208–2216. doi:10.1161/CIRCULATIONAHA.106.635573
6. Wijeysundera DN, Karkouti K, Dupuis JY, et al. Derivation and validation of a simplified predictive index for renal replacement therapy after cardiac surgery. JAMA. 2007;297(16):1801–1809. doi:10.1001/jama.297.16.1801
7. Thakar CV, Arrigain S, Worley S, Yared JP, Paganini EP. A clinical score to predict acute renal failure after cardiac surgery. J Am Soc Nephrol. 2005;16(1):162–168. doi:10.1681/ASN.2004040331
8. Remuzzi G, Horton R. Acute renal failure: an unacceptable death sentence globally. Lancet. 2013;382(9910):2041–2042. doi:10.1016/S0140-6736(13)62193-5
9. Bowdish ME, D’Agostino RS, Thourani VH, et al.; The Society of Thoracic Surgeons Adult Cardiac Surgery Database. 2020 update on outcomes and research. Ann Thorac Surg. 2020;109(6):1646–1655. doi:10.1016/j.athoracsur.2020.03.003
10. Zheng Z, Zhang H, Yuan X, et al. Comparing outcomes of coronary artery bypass grafting among large teaching and urban hospitals in China and the United States. Circ Cardiovasc Qual Outcomes. 2017;10(6):e003327. doi:10.1161/CIRCOUTCOMES.116.003327
11. Ng SY, Sanagou M, Wolfe R, et al. Prediction of acute kidney injury within 30 days of cardiac surgery. J Thorac Cardiovasc Surg. 2014;147(6):1875–1883. doi:10.1016/j.jtcvs.2013.06.049
12. Palomba H, de Castro I, Neto AL, Lage S, Yu L. Acute kidney injury prediction following elective cardiac surgery: AKICS Score. Kidney Int. 2007;72(5):624–631. doi:10.1038/sj.ki.5002419
13. Inker LA, Astor BC, Fox CH, et al. KDOQI US commentary on the 2012 KDIGO clinical practice guideline for the evaluation and management of CKD. Am J Kidney Dis. 2014;63(5):713–735. doi:10.1053/j.ajkd.2014.01.416
14. Levey AS, Stevens LA, Schmid CH, et al. A new equation to estimate glomerular filtration rate. Ann Intern Med. 2009;150(9):604–612. doi:10.7326/0003-4819-150-9-200905050-00006
15. Fluss R, Faraggi D, Reiser B. Estimation of the Youden Index and its associated cutoff point. Biom J. 2005;47(4):458–472. doi:10.1002/bimj.200410135
16. Nah CW, Ti LK, Liu W, et al. A clinical score to predict acute kidney injury after cardiac surgery in a Southeast-Asian population. Interact Cardiovasc Thorac Surg. 2016;23(5):757–761. doi:10.1093/icvts/ivw227
17. Collins GS, Reitsma JB, Altman DG, Moons KG. Transparent reporting of a multivariable prediction model for individual prognosis or diagnosis (TRIPOD): the TRIPOD statement. BMJ. 2015;350(4):g7594. doi:10.1136/bmj.g7594
18. Kutner M, Nachtsheim C, Neter J, Li W. Applied Linear Statistical Models.
19. Alhamzawi R, Ali HTM. The Bayesian adaptive lasso regression. Math Biosci. 2018;303:75–82. doi:10.1016/j.mbs.2018.06.004
20. Cook NR. Statistical evaluation of prognostic versus diagnostic models: beyond the ROC curve. Clin Chem. 2008;54(1):17–23. doi:10.1373/clinchem.2007.096529
21. Vickers AJ, Elkin EB. Decision curve analysis: a novel method for evaluating prediction models. Med Decis Making. 2006;26(6):565–574. doi:10.1177/0272989X06295361
22. Ranstam J, Cook JA. Statistical models: an overview. Br J Surg. 2016;103(8):1047. doi:10.1002/bjs.10240
23. Stevens PE, Levin A. Evaluation and management of chronic kidney disease: synopsis of the kidney disease: improving global outcomes 2012 clinical practice guideline. Ann Intern Med. 2013;158(11):825–830. doi:10.7326/0003-4819-158-11-201306040-00007
24. Ranucci M, Aloisio T, Cazzaniga A, et al. Validation of renal-risk models for the prediction of non-renal replacement therapy cardiac surgery-associated acute kidney injury. Int J Cardiol. 2018;272:49–53. doi:10.1016/j.ijcard.2018.07.114
25. Che M, Wang X, Liu S, et al. A clinical score to predict severe acute kidney injury in Chinese patients after cardiac surgery. Nephron. 2019;142(4):291–300. doi:10.1159/000499345
26. Zhang H, Wang Z, Tang Y, et al. Prediction of acute kidney injury after cardiac surgery: model development using a Chinese electronic health record dataset. J Transl Med. 2022;20(1):166. doi:10.1186/s12967-022-03351-5
27. Liotta M, Olsson D, Sartipy U, Holzmann MJ. Minimal changes in postoperative creatinine values and early and late mortality and cardiovascular events after coronary artery bypass grafting. Am J Cardiol. 2014;113(1):70–75. doi:10.1016/j.amjcard.2013.09.012
28. Mehta RL, Pascual MT, Soroko S, et al. Spectrum of acute renal failure in the intensive care unit: the PICARD experience. Kidney Int. 2004;66(4):1613–1621. doi:10.1111/j.1523-1755.2004.00927.x
29. Ishani A, Xue JL, Himmelfarb J, et al. Acute kidney injury increases risk of ESRD among elderly. J Am Soc Nephrol. 2009;20(1):223–228. doi:10.1681/ASN.2007080837
30. James MT, Pannu N, Hemmelgarn BR, et al. Derivation and external validation of prediction models for advanced chronic kidney disease following acute kidney injury. JAMA. 2017;318(18):1787–1797. doi:10.1001/jama.2017.16326
 © 2022 The Author(s). This work is published and licensed by Dove Medical Press Limited. The full terms of this license are available at https://www.dovepress.com/terms.php and incorporate the Creative Commons Attribution - Non Commercial (unported, v3.0) License.
By accessing the work you hereby accept the Terms. Non-commercial uses of the work are permitted without any further permission from Dove Medical Press Limited, provided the work is properly attributed. For permission for commercial use of this work, please see paragraphs 4.2 and 5 of our Terms.
© 2022 The Author(s). This work is published and licensed by Dove Medical Press Limited. The full terms of this license are available at https://www.dovepress.com/terms.php and incorporate the Creative Commons Attribution - Non Commercial (unported, v3.0) License.
By accessing the work you hereby accept the Terms. Non-commercial uses of the work are permitted without any further permission from Dove Medical Press Limited, provided the work is properly attributed. For permission for commercial use of this work, please see paragraphs 4.2 and 5 of our Terms.