Back to Journals » Journal of Pain Research » Volume 13
Depression of Mitochondrial Function in the Rat Skeletal Muscle Model of Myofascial Pain Syndrome Is Through Down-Regulation of the AMPK-PGC-1α-SIRT3 Axis
Authors Ye L, Li M, Wang Z, Yang Z, Zhang J, Fang H, He Z, Wang X
Received 6 October 2019
Accepted for publication 23 May 2020
Published 13 July 2020 Volume 2020:13 Pages 1747—1756
DOI https://doi.org/10.2147/JPR.S233583
Checked for plagiarism Yes
Review by Single anonymous peer review
Peer reviewer comments 2
Editor who approved publication: Professor Michael Überall
Le Ye,1,* Mingli Li,2,* Zhankui Wang,3,* Zhongwei Yang,4,* Jinyuan Zhang,5,* Hongwei Fang,5,* Zhenzhou He,1 Xiangrui Wang5
1Department of Pain Management, The South Campus of Renji Hospital, Shanghai Jiao-Tong University School of Medicine, Shanghai 20025, People’s Republic of China; 2Department of Anesthesiology, The Shanghai First Rehabilitation Hospital, Shanghai 200090, People’s Republic of China; 3Department of Orthopedics, The First Clinical Medical College, Shaanxi University of Chinese Medicine, Xianyang, Shaanxi 712046, People’s Republic of China; 4Department of Anesthesiology, Renji Hospital, Shanghai Jiao-Tong University School of Medicine, Shanghai 200127, People’s Republic of China; 5Department of Anesthesiology and Intensive Care Unit, Dongfang Hospital, Tongji University, Shanghai 200123, People’s Republic of China
*These authors contributed equally to this work
Correspondence: Xiangrui Wang
Department of Anesthesiology and Intensive Care Unit, Dongfang Hospital, Tongji University, Shanghai 200123, People’s Republic of China
Email [email protected]
Purpose: The causative mechanisms triggering myofascial pain syndrome (MPS) are still in debate. It is becoming evident that mitochondrial dysfunction may regulate pathways controlling MPS. The aim of this study was to investigate whether AMPK-PGC-1α-SIRT3 axis is associated with depression of mitochondrial function in the rat MPS model.
Methods: A total of 32 Sprague–Dawley rats were randomly divided into control group and experimental group. The expression level of mRNA and protein of gastrocnemius medialis (GM) was analyzed by Western blot and RT-PCR. The histopathological findings were investigated through electron microscopes in GM of all groups.
Results: Our results showed that MPS induces continuous depression of mitochondrial biogenesis and function via down-regulation of PGC-1α-SIRT3 axis accompanying with ATP fuel crisis as compared to control group. However, the expression level of SIRT3 mRNA did not change. Additionally, a correlated reduction of the mRNA and protein expression level of NRF-1 and TFAM, known as the downstream target of PGC-1α, suggesting further transcription of nuclear genes encoding mitochondria functional proteins for promoting mitochondria proliferation, oxidative phosphorylation and energy production is continuously depressed. Furthermore, phosphorylation extent of AMPK is also declined following MPS, and it is negatively correlated with reduction of ATP generation, suggesting that the complex network involves different inhibition in transcription, post-translational modification and a plethora of other effectors that mediate the inhibition roles.
Conclusion: We here suggested that the down-regulation in AMPK-PGC-1α-SIRT3 axis network may be the basis for the association between mitochondrial dysfunction and MPS, where a vicious circle further aggravates the disease symptoms with ongoing ATP energy crisis.
Keywords: myofascial pain syndrome, mitochondrial biogenesis, myofascial trigger points, PGC-1α, ATP crisis, gastrocnemius medialis muscle
Introduction
Myofascial pain syndrome (MPS) is one of the most prevalent pain cause in clinical conditions, which is characterized by twitch response, spontaneous electromyographic activity and hyperirritable nodules in the taut bands (TBs), termed as myofascial trigger points (MTrPs).1 The concept of MTrPs is first put forward by Travell and Simons, and the MTrPs is identified as the dominating factor for functional limitations and pain in the corresponding neuromusculoskeletal system.1 As a significant health problem, MPS is estimated to affect as much as 85% of the general population.2 Although significant progress has been made in understanding histopathological nature of the MTrPs, using animal models,3 there is still limited information on the etiology and exact pathogenesis of MTrPs.4 Recently, accumulating studies reported that MTrPs are caused by chronic overload, overstretching, or by direct trauma of the affected muscles.5,6
Mitochondria, the energy-producing unit in skeletal muscle, are the primary organelles responsible for ATP energy-generating through respiration and oxidative phosphorylation. Importantly, great interest has focused on understanding the correlation between mitochondrial biogenesis and skeletal muscle function following disease and aging.7 Moreover, some reports point out that changes in the number and function of mitochondria can cause changes in pain-related behavior, thereby contributing to the pathogenesis of various kinds of pain.8 Additionally, using different pain model of mice, a recent study indicate that the distribution of mitochondrial show a significant change.9 Furthermore, mitochondrial dysfunction might aggravate the symptoms of different models of pain.10 Clearly, mitochondrial biogenesis is dependent on the coordinated actions of many different transcription factors and co activators. Subsequently, this ultimate coordination of the nuclear and mitochondrial genomes plays a key role in regulating the stoichiometric production of cellular energy and assembly of the corresponding proteins.11
Generally, the peroxisome proliferator-activated receptor-gamma coactivator-1α (PGC-1α) is proposed to play main roles in modulating many biological programs related to energy metabolism,12 and also act as mediators in regulating mitochondrial content within cells.13 Moreover, reduction of PGC-1α expression level in skeletal muscle is linked to defects in mitochondrial biogenesis and overall impairment of cellular energy metabolism besides reduced mitochondrial content and function.14,15 Additionally, down-regulation expression of PGC-1α gene and protein can activate catabolic events,16 and the regulation of PGC-1α is associated with ATP-generating capacity.17 As a result, the increase ratio in AMP/ATP activates the “upstream” of PGC-1α, namely AMPK signaling pathway,18,19 acting as cellular energy sensor.20 Moreover, as an upstream regulator, PGC-1α also regulates gene expression level of the mitochondrial sirtuin 3,21 which functions as the major regulator of mitochondrial protein deacetylation.22 Furthermore, deacetylated PGC-1α induce the expression of nuclear genes encoding mitochondrial proteins, such as nuclear respiratory factor 1 (NRF-1). Subsequently, activated NRF-1 medicates the expression of mitochondrial transcription factor A (Tfam), ultimately modulates directly replication and transcription of mitochondrial DNA (mtDNA) encoded genes.23,24 Thus, the modulation process is responsible for the link between external physiological stimuli and regulation of the nuclear and mitochondrial genomes.13
In the present study, we examine the effects of MTrPs in experimental animals in inducing chronically histopathological change of mitochondria accompanying with impaired energy production (energy crisis) and decline AMPK activation. Furthermore, we examine whether and how MTrPs could trigger the down-regulation of PGC-1α-SIRT3 axis and downstream NRF-1/TFAM signaling pathway, and ultimately resulting in inhibition of the mitochondrial biogenesis, whereby led to MPS aggravation for a long time.
Materials and Methods
Animals
A total of 32 Sprague–Dawley rats, weighing between 220g and 250g, were obtained from the Sino-British SIPPR/BK Lab (Shanghai, China). Animals were caged under controlled conditions with 12h-12h light-dark cycle, temperature of 22 ± 2°C, and 60–70% humidity. The rats were allowed for free access to chow diet and tap water. All animal experiments in this study were conducted in accordance with the institutional guidelines and ethics for the use and care of laboratory animals and approved by the Animal Care and Use Committee in the Shanghai Jiao Tong University of School of Medicine, Shanghai, China.
Experimental Grouping
Thirty-two rats were randomly divided into two groups, that is a blank control group (n=8) and an experimental group (n=24). Then, the rats in the experimental group were further splitted into three subgroups with different follow-up times of 3 weeks (n=8), 9 weeks (n=8) and 15 weeks (n=8) post treatment, respectively.
Modeling Intervention
The model was established with reference to previously described method.3,48 In brief, the rats in the experimental group were anaesthetized with intraperitoneal (ip) 3% Pentobarbital Sodium (0.1 mL/100 g bodyweight). After the animals were anesthetized, the rats were fixed on a board and the left GM was marked by a pen. Then the marked GM of the left hind limb in rats of experiment group was hit by a homemade striking device with a stick dropping from a height of 20 cm with a kinetic energy of 2.352 J once a week. The rats were then made to run for 90 min on a treadmill (DSPT-202, China) at a −16° downward angle and speed of 16 m/min in the following day. The interventions of all rats in experimental group were repeated with the same procedure at weekly intervals for a total of 8 weeks, while rats in control group underwent no intervention. The rats were then allowed to rest for 4 weeks. Then, rats in experimental group were randomly divided into one of the three subgroups (3w post treatment, 9w post treatment and 15w post treatment) without further interventions.
The Location of MTrPs in Gastrocnemius Muscle
After complete dissection of the skin and underlying fascia, the GM of the left hind limb in each animal was surgically exposed. Here, the flat palpation method described by Travell et al was used to assess the presence or absence of taut band (TB).1 The muscle fiber was palpated by two well trained trigger point acupuncturists with their fingertips. Then, the fingertip slid across muscle fibers of GM to seek a small, hard bundle-like texture of the TB. Any apparent taut bumps found were marked and identified as possible TB. Reproductively, the two investigators could palpate TB in the experimental groups but not in the control groups. Finally, the same investigator who was blinded to the animal’s treatments identified the location of TBs in all animals. The location of MTrPs is based on the method previously described by Huang et al.3,48 Briefly, the first needle was inserted in the tail of the rat as a reference electrode; then, the second needle was inserted into the marked TB. If a local twitch responses (LTR) was elicited by needling, the TB was considered as a possible MTrP. For further confirmation, a third electrode was then inserted longitudinally into the identified TB, and the distance away from the other electrode is about 3- to 5 mm. The above three fine needles (0.3 mm in diameter) were connected to an electromyography (EMG) device (Z2J-NB-NCC08, NuoCheng, Shanghai) to record myoelectrical signals. When spontaneous electrical activity (SEA) was detected, it suggested that the TB was considered as a genuine (active) MTrP.
After the operation, the animals were executed at 10.00 h after 2 h without food by using cervical dislocation to obtain gastrocnemius muscle at the site of the MTrPs in the experimental group at 3, 9 and 15 week post treatment, respectively. Normal gastrocnemius muscle was taken from the control group. Then, muscles were immediately frozen in liquid nitrogen and stored at −80°C.
Western Blot
The muscles samples were immediately homogenized in a lysis buffer containing 20 mM Tris-HCl (pH 7.4), 150 mM NaCl, 10% glycerol, 1% Triton X-100, 3 mM EDTA, 100 mM NaF, 2 mM PMSF supplemented with 1×protease inhibitor and phosphatase inhibitors (Sigma-Aldrich). The homogenates were then centrifuged for 20 min at 18,000 g at 4°C to remove debris and insoluble material. Then, the supernatants were equally divided and stored at −80°C until ready to use. Equal amounts of samples were loaded on gradient precast gels purchased from Bio-Rad (Bio-Rad Laboratories (Shanghai) Co., Ltd). The protein samples were then electro-transferred to polyvinylidene difluoride (PVDF) membranes and non-specific staining was blocked by using 5% nonfat dry milk in Tris-buffer containing 0.1% Tween 20 (TBST), pH 7.4. Subsequently, the blocked membranes were rinsed with TBST, incubated overnight with the appropriate antibody (see below) at 4°C, rinsed with TBST again, and incubated with horseradish peroxidase-conjugated anti-rabbit IgG. The antibody-reactive band of each protein was visualized used an enhanced chemiluminescence method, and exposed immediately to autoradiography film. The Western blot signals were then quantified by densitometry in each sample with Quantity software (Bio-Rad).
Gene Expression Analysis
Total RNA of skeletal samples was extracted by using a TRizol reagent (Sigma-Aldrich). cDNA was synthesized using a PrimeScriptTM RT Reagent kit for RT-PCR (TAKARA BIO INC, Japan). Quantitative real-time PCR analysis was performed in the Real-time Detection System (Roche LightCycler480 II, Switzerland) by ChamQTMSYBR® qPCR Master Mix (Vazyme, Nanjing, China) detection. Equal amounts of RNA (300 ng) were used to prepare cDNA. Fluorescence was monitored during PCR by an ABI7300 sequence detection system (Applied Biosystems). All genes were amplified in the study using the following conditions: denaturation at 95°C for 30 seconds, annealing at 60°C for 20 seconds, and extension at 72°C for 10 seconds for 32 cycles with an additional 5-minute extension time. Optimal cycle number was determined to obtain a PCR product within the linear range. Afterwards, the specificity of the amplified target gene was verified through method of melting curves analysis, and melting curves of amplified products were analyzed from 60°C to 95°C. The relative gene expression value of each gene was calculated by the 2(−ΔΔCT) method, with GAPDH as internal controls. The forward (FP) and reverse (RP) primers were synthesized by Sangon Biotech (Shanghai, China) company and listed in Table 1.
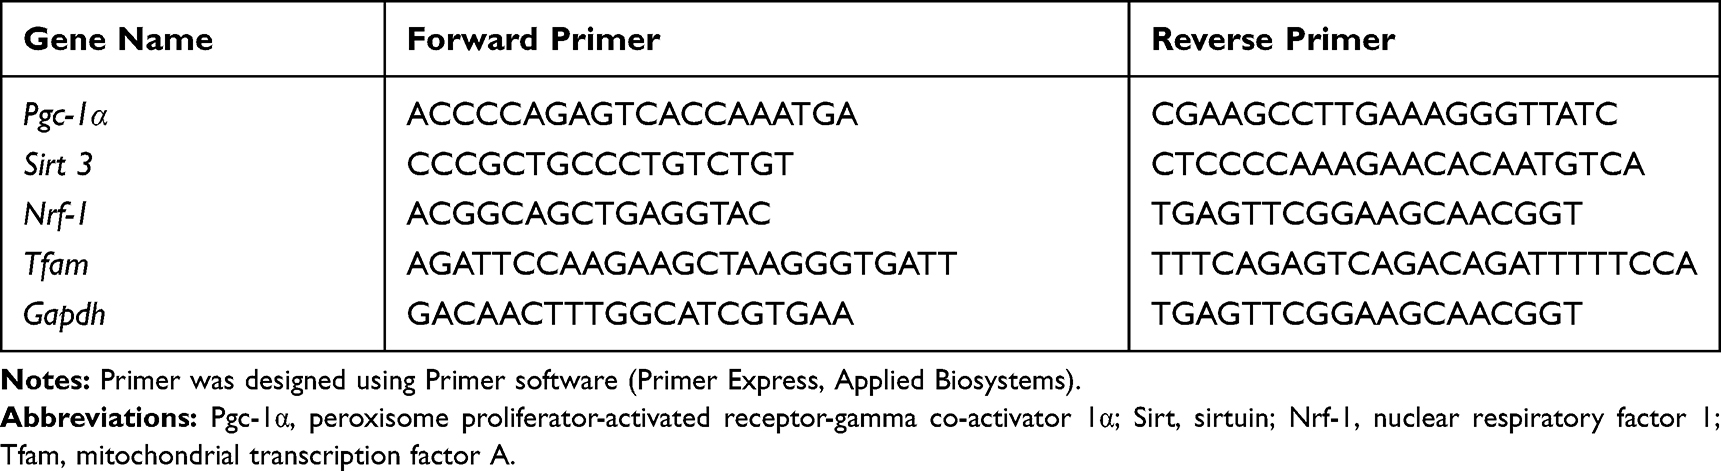 |
Table 1 Primer Sequence for Gene Expression Analysis |
Antibodies
Primary antibodies including anti-rabbit PGC-1α, anti-rabbit p-AMPK (thr 172); anti-rabbit AMPK (Cell Signaling Technology, Inc., Danvers, MA, USA); Anti-SIRT3 antibody (Santa Cruz Biotechnology, Inc., Santa Cruz, CA, USA); anti-rabbit TFAM, anti-rabbit NRF-1 and anti-rabbit GAPDH were obtained from Abcam Biotechnology (Cambridge, MA, USA). Horse-radish peroxidase-conjugated anti-rabbit IgG (Cell Signaling) and enhanced chemiluminescence reagents (ECL and ECL plus) were obtained from Amersham Biosciences (Buckinghamshire, UK). All other reagents were obtained from Sigma (St. Louis, MO).
Ultrastructure Morphology of Skeletal Muscle
The muscle filament arrangement and histopathological nature of mitochondria in control and experimental group (3w, 9w and 15weeks post treatment) were analyzed by visualizing images of the muscle sections using a Philips CM-120 transmission electron microscope (TEM) (Philips, Holland). The tissues were fixed with 2% glutaraldehyde in PBS for 2 hours at 4°C. After being washed by buffer, they were post fixed with 1% osmium tetroxide for 2 hours at 4°C, then the tissue was subjected to dehydration in ethanol and embedded in an Epon-Araldite mixture. Thin sections with 70nm in thickness were made with a LKB-V ultramicrotome and stained with lead citrate.
Measurement of ATP Content in Skeletal Muscle Mitochondrial
The firefly luciferase-based ATP assay kit (Beyotime, China) was used to measure GM muscle ATP levels. Following the manufacturer’s instructions, tissues were lysed in lysis buffer, and centrifuged at 12,000 g for 5 min at 4°C. The supernatant was used to detect the ATP level using microplate reader (BioTek Synergy 2, VT, USA).
After samples or standard products were added into the test tube, and mix them quickly by the micropipette. Several seconds later, the RLU value was determined by the luminometer (Bio-Rad Laboratories, Hercules, CA, USA). The protein concentration was measured by BCA protein assay kit. The ATP concentration in the sample is calculated according to the standard curve.
Statistical Analysis
Data were expressed as mean ± standard deviation (SD). Analysis was performed using OriginPro 8 software (Origin lab Corporation, USA). Differences were determined using a paired Student’s t-test between two groups. Statistical significance of the differences between means in multiple‑group comparisons was determined by one-way analysis of variance (ANOVA) analysis. A value of p<0.05 was considered as significant difference, and p<0.01 was considered highly as significant difference.
Results
Key Proteins and mRNA Expression Level Related to Mitochondrial Function in the MPS Model
To define the adaptations of mitochondrial biogenesis and function in the MPS model, we use RT-PCR and Western blot analysis. To examine the effects of MTrPs on expression of mitochondrial biogenesis-related genes, the mRNA transcript and protein level of PGC-1α, a central regulator in mitochondrial biogenesis and structural/functional integrity are studied. Figure 1A shows the ~76% decrease in PGC-1α mRNA expression level at 3 weeks of MTrPs. Although the expression level of PGC-1α mRNA increased at 15 weeks post treatment, the expression level is still lower than that in control group (p<0.01). Figure 1E refers to the ~74% decrease in PGC-1α protein expression level at 3 weeks of MTrPs. The expression level of PGC-1α increased at 15 weeks post treatment; however, the expression level is still lower than that in control group (p<0.01). Additionally, the SIRT3 protein expression level, the most studied and well characterized sirtuin in mitochondria, is significantly declined following a similar pattern with that in PGC-1α (Figure 1F and I), in accordance with the concept that they are controlled by PGC-1α in the nucleus.47 However, the expression level of SIRT3 mRNA was unchanged both at 3, 9 and 15 weeks of MTrPs (Figure 1B). Furthermore, the protein and mRNA expression level of NRF-1 and TFAM, located in downstream of PGC-1α signaling pathway, shows a remarkably similar decline pattern with PGC-1α expression level in comparison with that in control group (Figure 1C and D and 1G-H), supporting the expected down-regulation function of PGC-1α.
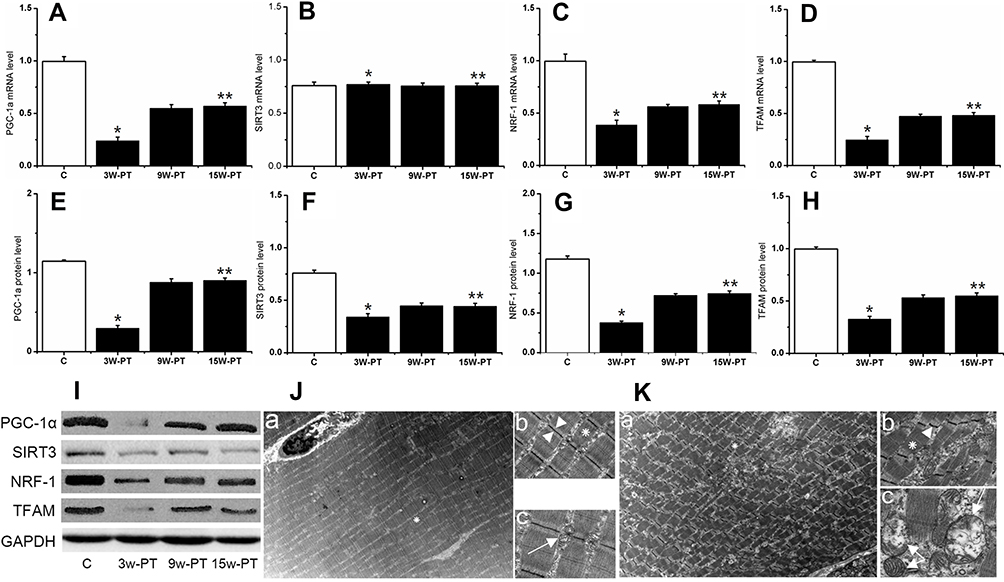 |
Figure 1 Key proteins and mRNA expression related to mitochondrial biogenesis and function as well as ultrastructural pattern of muscle fibers. Level of (A) PGC-1α mRNA, (E) PGC-1α protein, (B) SIRT3 mRNA, (F) SIRT3 protein, (C) NRF-1 mRNA, (G) NRF-1 protein, (D) TFAM mRNA and (H) TFAM protein were determined in GM muscle from control group and modelled rat. (I) indicates the result for Western blotting. In control group (J), visualized with TEM, large numbers of mitochondria with oval shape (white arrows) accompanying with ridge-like structures inside and intact myofilaments in well-arranged and clean-cut sarcomeres were observed in longitudinal section (J-a, J-b, J-c). At the 15W groups (K), the arrangement of sarcomeres was significantly abnormal, and the myofilaments showed more electron-dense bands with staggered and disarranged characteristic in longitudinal section (K-a, K-b); in addition, vacuoles of the mitochondrial structure, distorted distribution, break and disappearance of the mitochondrial cristae could be seen (white arrows) in longitudinal-section (K-c). The Z-line became thinner than that in control group, which seems like a drifting wave-like line (arrowhead); moreover, the gap between the two Z-lines is enlarged (arrowhead) with irregular space distance. *Indicates there is significantly different from C (3w-PT.vs Control); **Indicates there is significantly different from C (15w-PT.vs Control); P<0.01, n=8 rats for each group. Data are presented as means ± SD. Magnification times of J-a and K-a, ×3400; Magnification times of J-b and K-b, ×13,500; Magnification times of J-c and K-c, ×33,000. Abbreviations: C, control; PT, post-treatment; w, week. |
Figure 1I shows the protein expression level of key proteins displays declined at 3-week post treatment, and then increased at 9-week post treatment; however, the increasing amplitude is still lower in comparison with that in control (p<0.05).
Moreover, to verify whether the ultrastructural pattern of mitochondria changed in the MPS condition, the transmission electron microscopy is used to visualize the images of muscle sections. We found that the arrangement of the sarcomeres is significantly disordered at 15 weeks groups post treatment, and their myofilaments show the more electron-dense bands characterized by twitch response; moreover, the myofilaments are stagger and disarrange in longitudinal section (Figure 1K(a-b)), compared with that in the control group (Figure 1J(a-c)). Additionally, vacuoles of the mitochondrial structure, distorted distribution, break and disappearance of the mitochondrial cristae can be seen. Notably, they also display heterogeneous disruption of inner and outer membranes, variable swelling, and the Z-line in the modelled group is wave-like in appearance (Figure 1K(b-c)).
ATP Energy Crisis and Down-Regulation of Energy Sensor Molecular in the MPS Model
To evaluate if the changes in ATP are associated or driven by a condition of MPS, and if energy sensor AMPK, upstream of PGC-1α, is regulated in concert with the PGC-1α-SIRT3 axis. To achieve this aim, ATP content of GM muscle is analyzed in control and model groups at different phases. Moreover, the p-AMPKThr172/AMPK ratio is also assessed by Western blot (Figure 2). AS shown in Figure 2A, at 3-week post-treatment, quantitative evaluation reveals that the amount of ATP level declined about 73% compared with that in the control (3w-PT. vs control, p<0.01). Intriguingly, significant decrease was observed in the p-AMPKThr172/AMPK ratio at 3 weeks post treatment (about 53% decline) (Figure 2B), as well as in the active (phosphorylated) AMPK protein levels (data not shown), supporting the unexpected absence of AMPK activation. Subsequently, the ration increased gradually after 3-week post treatment; however, the relative index of p-AMPKThr17/AMPK ratio, following a similar pattern with ATP production level, is still lower than that in the control group (p<0.01).
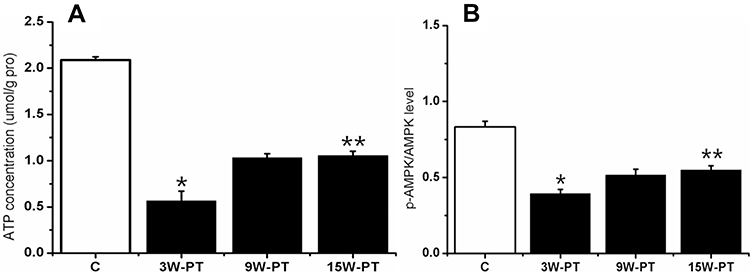 |
Figure 2 Alternations on level of ATP-generating energy and on ratio of p-AMPK/AMPK activity. Quantification of ATP level (A) and AMP kinase activity (B) by Western blot measuring the ratio between the phosphorylated (p) and total forms (p-AMPK/AMPK) in rats GM in control and model groups at different time points. *Indicates there is significantly different from C (3w-PT. vs Control); **indicates there is significantly different from C (15w-PT. vs Control); P<0.01, n=8 rats for each group. Data are presented as means ± SD. Abbreviations: C, control; PT, post-treatment; w, week. |
Discussion
Similar with the result in vastus medialis (VM) muscle in MPS model,3 the morphology characteristics of mitochondria in GM of MPS model were also abnormal, as indicated by disarranged myofilaments, the swelling, vacuolization and damaged crest in the mitochondria of skeletal muscle at 15 weeks post treatment. In our study, the MPS-based dysfunctions of skeletal muscle show the crisis of generating ATP. These results indicated that morphological abnormalities of mitochondria and energy metabolism underlie the dysfunction of the mitochondrial biogenesis in skeletal muscle of MPS model. Strikingly, MPS is one of the factors that contribute to the AMPK inhibition and its biological effects. In the present study, we found that the PGC-1α/NRF-1/TFAM mRNA and protein expression levels declined in GM muscles induced by MTrPs (Figure 1). Although the expression level of SIRT3 mRNA was unchanged, its protein levels were also down-regulated. Taking into consideration that mitochondrial biogenesis is depressed continuously in the MPS model of rat. The present empirical study unveils new evidence that enhances our understanding of the regulatory mechanisms by which AMPK-PGC-1α-SIRT3 axis and downstream NRF-1 and TFAM signaling pathway acts in MTrPs development during the process of mitochondrial biogenesis and energy crisis mediated by reductions in the intracellular phosphorylation potential that accompany the decline of generating ATP. These evidences clearly showed that the AMPK-PGC-1α-SIRT3 axis and downstream NRF-1 and TFAM signaling pathway are down-regulated by MTrPs in rat GM muscle.
It has been well known that the energy status of the cell is maintained in a homeostasis, which is a crucial factor in all aspects of cell function. However, in the present study, we observed that the ATP generation is declined at 3-week post-treatment with concomitant decrease of p-AMPKThr172, AMPK ratio compared with that in the control group. Although there is a weak increase at 9-week and 15-week post treatment, the increased amplitude of generating ATP still shows scarcity. Our results are in contrast to what was observed in previous studies in different cell stress events.25,26 Indeed, ultrastructural pathology from TEM result indicated that mitochondria injury is still not to be repaired at 15-week post treatment (Figure 1K), which may suggest that efficiency of mitochondria biogenesis maintains in a lower level. The mitochondrion is crucial to cellular energy balance and metabolism, being the main site of ATP generation in cells. Thus, the continuous suppression in mitochondrial biogenesis and impaired mitochondrial function could sustain ATP production in a relatively lower level, which generates persistently energy crisis, and then down-regulate the gene expression level, finally start up a vicious circle. This might explain why, following MTrPs, ATP production rate is still inhibited. The present results further provide empirical evidence for an integrated hypothesis of energy crisis for mechanism of MTrPs formation proposed by Simons,1 who pointed out that sustained muscular contraction leads to a localized ATP generation crisis.
AMPK, controlled by allosteric regulation by the [AMP]/[ATP] ratio, is a key sensor of cellular energy balance in mammalian cells, including skeletal myocyte.20 Generally, AMPK activity is recognized to be up-regulated by several cell stress events resulting in energy impairment, including exercise/muscle contractile activity.25,27 On the contrary, several studies indicated that AMPK could also be inhibited by decreased phosphorylation by upstream kinases and increased de-phosphorylation by protein phosphatases, such as inactive states of Src activity through LKB1 independently of the [AMP]/[ATP] ratio.28,29 Moreover, a most recent study suggested that phosphorylation extent of AMPK did not change after bed-rest and rehabilitation conditions.30 In the current study, we also found that lower ATP generation is linked with lower phosphorylation extent of AMPK, which brought lower expression of mitochondrial biogenesis and function related gene. These alternations in gene and protein expression may be involved in the pathomechanism of MPS. Moreover, the difference between our results and previous studies was that different mechanism might address a different type of cell stress challenge, although we did not do deep research on the molecular mechanisms by which AMPK influences muscle cell response to MTrPs. Additionally, owing to allosteric regulation of AMPK, it might be playing a key role in regulation of AMPK activity. However, we cannot ignore that the allosteric regulatory effect of [AMP]/[ATP] cannot be measured in vitro, and direct measure of AMPK activity only generally reflects the phosphorylation state at the time of extraction, as a previous study has shown.31 It is necessary to recognize its limitation when an interpretation of the results in the present study was put forward. Collectively, these results thus indicate that the regulation of AMPK activity is complex,20,25,32 and multiple factors may contribute to energy-induced decrease in AMPK in the MPS model.
It is reported that a switching off of AMPK leads to impaired PGC-1α activity and diminished mitochondrial activity.15,33 In the current study, we also found that the expression level of PGC-1α is down-regulated, and then modulate the down-regulation expression of NRF-1 and TFAM, which correlated positively with inhibition level of AMPK. In recent years, the report about the expression PGC-1α is contradictory. Actually, higher,34 lower35 and unchanged36 expression level of PGC-1α have been reported. Thereby, we inferred that AMPK regulates mitochondrial biogenesis in response to energy deprivation via PGC-1α, either by decreasing its expression or its phosphorylation. In reverse, down-regulated PGC-1α might play a negative feedback role in the modulation function of AMPK, which deteriorates the expression of several players in mitochondrial metabolism. Under no circumstances should we exclude the possibility that the regulation of PGC-1α transcription in response to MPS, and its role in modulating the mitochondrial biogenesis/remodeling, observed in the current study were driven by mechanism(s) not linked to AMPK. It also raises the probability that the multiple signaling pathways may converge on regulation of PGC-1α.9,37 Given this, it is possible that a more complex relationship exists between AMPK and PGC-1α function in MPS. This is an interesting topic for further research.
Ferrer et al showed that the expression of PGC-1α correlated positively with that of SIRT3 to induce the antioxidant defenses,38 suggesting that PGC-1α functions as an upstream regulator of SIRT3. In fact, PGC1α-SIRT3 signaling axis has been testified as essential for the regulation of mitochondrial oxidative stress and biogenesis from cell and animal models.39,40 Meanwhile, PGC-1α has been reported to function as the critical downstream molecule of AMPK.19,41,42 Based on our current findings that AMPK-PGC-1α signaling was observably down-regulated in MPS; therefore, we hypothesized that reduced AMPK-PGC-1α signaling resulted in decreased SIRT3 expression and fuel-generating crisis might weaken SIRT3 signaling via the suppression of AMPK-PGC-1α. Sure enough, the results reported here showed that inhibition of AMPK markedly down-regulated PGC-1α and SIRT3 signaling. Therefore, we come to the conclusion that MPS deteriorates mitochondrial function by increasing mitochondrial oxidative damage and decreasing its biogenesis, thus aggravating mitochondria injury. Another interesting finding of this current study is that changes in SIRT3 mRNA expression are significantly not correlated with changes in PGC-1α expression in experimental group. However, there is a significant relationship between the change in PGC-1α and SIRT3 protein content in response to MTrPs. As for the expression of SIRT3, this is the first study that the mRNA and protein expression levels were not correlating with each other in relation to MTrPs. Moreover, down-regulation expression of SIRT3 aggravated inhibition of PGC-1α-mediated mitochondrial biogenesis probably by reduced transcription levels of NRF-1 and mtTFA through the PGC-1α. Thus, it is likely that the MTrPs-induced decrease in SIRT3 protein is independent of a change in SIRT3 mRNA level. What is more, we cannot rule out that PGC-1α could be important for promoting the gene expression of SIRT3 in MPS, which further underscoring the importance that AMPK-PGC1α-SIRT3 axis plays a fundamental role in this process.
During protein synthesis, ribosomes first bind to the translated mRNA and thus form translationally competent structures, which is known as polysomes profiling. Inhibition of translation initiation results in a decrease in the proportion of ribosomal subunits in polysomes,43 which indicating that translation initiation is weakened after muscle contractile activity. This mechanism might be the possible factor for the MTrPs-induced decrease in SIRT3 protein expression without the decrease in mRNA level. In addition, the morphology of mitochondria from histological result is still abnormal and ATP synthesis also maintains in a lower level at 15 weeks post treatment (Figures 1K and 2), indicating that SIRT3 may play a role in regulation of mitochondrial oxidative stress,44 which shows similar effect with other studies.45,46 Thus, an MTrPs-induced decrease in SIRT3 may be difficult to reduce the production of reactive oxygen species. We cannot exclude another possibility that MTrPs decreases mitochondrial biogenesis in skeletal muscles through the declined SIRT3 intrinsic activity but not through the declined expression level. These possibilities described here need further experimental exploration.
Conclusion
Taken together, according to the previous studies and our current findings, we proposed that mitochondrial biogenesis is continually depressed in the rat model of MPS. Electron microscopy result of mitochondria in GM is similar to previous study in VM.3 More importantly, another novel finding of this study is that we proved the importance of AMPK-PGC-1α-SIRT3 signaling in MPS. We found that MPS induces down-regulation of AMPK-PGC-1α-SIRT3 axis and its downstream NRF-1-TRFM signaling pathway. In addition, ATP generation is also inhibited and remains in a lower level associated with decrease of p-AMPK/AMPK. These findings provide evidence that MPS induces continuous crisis for energy production, and then induce decreased expression of nuclear and mitochondrial genes associated with mitochondrial biogenesis. Thus, the stimulation or enhancement of mitochondrial biogenesis may provide a novel strategy in the future for the treatment of MPS.
Data Accessibility
All datasets from this study are available from the corresponding author upon reasonable request.
Acknowledgments
This work was supported by grants from the Natural Science Fund Project of Minhang district Science and Technology Committee of Shanghai (Grant Number: 2016MHZ57).
Disclosure
The authors report no conflicts of interest in this study.
References
1. Simons DG, Travell TG, Simons LS. Myofascial Pain and Dysfunction: The Trigger Point Manual.
2. Simons DG. Clinical and etiological update of myofascial pain from trigger points. J Musculoskelet Pain. 2010;4(1–2):93–122. doi:10.1300/J094v04n01_07
3. Zhang H, Lü JJ, Huang QM, Liu L, Liu QG, Eric OA. Histopathological nature of myofascial trigger points at different stages of recovery from injury in a rat model. Acupunct Med. 2017;35(6):445–451. doi:10.1136/acupmed-2016-011212
4. Jafri MS. Mechanisms of myofascial pain. Int Sch Res Notices. 2014;2014:1–16. doi:10.1155/2014/523924
5. Shah JP, Thaker N, Heimur J, Aredo JV, Sikdar S, Gerber L. Myofascial trigger points then and now: a historical and scientific perspective. PMR. 2015;7(7):746–761. doi:10.1016/j.pmrj.2015.01.024
6. Itoh K, Okada K, Kawakita K. A proposed experimental model of myofascial trigger points in human muscle after slow eccentric exercise. Acupunct Med. 2004;22(1):2–12. doi:10.1136/aim.22.1.2
7. Carter HN, Chen CC, Hood DA. Mitochondria, muscle health, and exercise with advancing age. Physiology (Bethesda). 2015;30(3):208–223. doi:10.1152/physiol.00039.2014
8. Joseph EK, Levine JD. Mitochondrial electron transport in models of neuropathic and inflammatory pain. Pain. 2006;121(1–2):105–114. doi:10.1016/j.pain.2005.12.010
9. Guo BL, Sui BD, Wang XY, et al. Significant changes in mitochondrial distribution in different pain models of mice. Mitochondrion. 2013;13(4):292–297. doi:10.1016/j.mito.2013.03.007
10. Xiao WH, Bennett GJ. Effects of mitochondrial poisons on the neuropathic pain produced by the chemotherapeutic agents, paclitaxel and oxaliplatin. Pain. 2012;153(3):704–709. doi:10.1016/j.pain.2011.12.011
11. Hood DA. Invited review: contractile activity-induced mitochondrial biogenesis in skeletal muscle. J Appl Physiol. 2001;90(3):1137–1157. doi:10.1152/jappl.2001.90.3.1137
12. Scarpulla RC. Metabolic control of mitochondrial biogenesis through the PGC-1 family regulatory network. Biochim Biophys Acta. 2011;1813(7):1269–1278. doi:10.1016/j.bbamcr.2010.09.019
13. Wu Z, Puigserver P, Andersson U, et al. Mechanisms controlling mitochondrial biogenesis and respiration through the thermogenic coactivator PGC-1. Cell. 1999;98(1):115–124. doi:10.1016/S0092-8674(00)80611-X
14. Leone TC, Lehman JJ, Finck BN, et al. PGC-1alpha deficiency causes multi-system energy metabolic derangements: muscle dysfunction, abnormal weight control and hepatic steatosis. PLoS Biol. 2005;3(4):e101. doi:10.1371/journal.pbio.0030101
15. Ringholm S, Biensø RS, Kiilerich K, et al. Bed rest reduces metabolic protein content and abolishes exercise-induced mRNA responses in human skeletal muscle. Am J Physiol Endocrinol Metab. 2011;301(4):E649–E658. doi:10.1152/ajpendo.00230.2011
16. Cannavino J, Brocca L, Sandri M, Bottinelli R, Pellegrino MA. PGC1-α over-expression prevents metabolic alterations and soleus muscle atrophy in hindlimb unloaded mice. J Physiol. 2014;592(20):4575–4589. doi:10.1113/jphysiol.2014.275545
17. Soriano FX, Liesa M, Bach D, Chan DC, Palacin M, Zorzano A. Evidence for a mitochondrial regulatory pathway defined by peroxisome proliferator-activated receptor-gamma coactivator-1 alpha, estrogen-related receptor-alpha, and mitofusin 2. Diabetes. 2006;55(6):1783–1791. doi:10.2337/db05-0509
18. Bergeron R, Ren JM, Cadman KS, et al. Chronic activation of AMP kinase results in NRF-1 activation and mitochondrial biogenesis. Am J Physiol Endocrinol Metab. 2001;281(6):E1340–E1346. doi:10.1152/ajpendo.2001.281.6.E1340
19. Irrcher I, Ljubicic V, Kirwan AF, Hood DA. AMP-activated protein kinase-regulated activation of the PGC-1a promoter in skeletal muscle cells. PLoS One. 2008. doi:10.1371/journal.pone.0003614
20. Hardie DG, Ross FA, Hawley SA. AMPK: a nutrient and energy sensor that maintains energy homeostasis. Nat Rev Mol Cell Biol. 2012;13(4):251–262. doi:10.1038/nrm3311
21. Schwer B, North BJ, Frye RA, Ott M, Verdin E. The human silent information regulator (Sir)2 homologue hSIRT3 is a mitochondrial nicotinamide adenine dinucleotide-dependent deacetylase. J Cell Biol. 2002;158(4):647–657. doi:10.1083/jcb.200205057
22. Menzies K, Auwerx J. An acetylation rheostat for the control of muscle energy homeostasis. J Mol Endocrinol. 2013;51(3):T101–T113. doi:10.1530/JME-13-0140
23. Handschin C, Spiegelman BM. Peroxisome proliferator-activated receptor gamma coactivator 1 coactivators, energy homeostasis, and metabolism. Endocr Rev. 2006;27(7):
24. Campbell CT, Kolesar JE, Kaufman BA. Mitochondrial transcription factor A regulates mitochondrial transcription initiation, DNA packaging, and genome copy number. Biochim Biophys Acta. 2012;1819(9–10):921–929. doi:10.1016/j.bbagrm.2012.03.002
25. Kjøbsted R, Hingst JR, Fentz J, et al. AMPK in skeletal muscle function and metabolism. FASEB J. 2018;32(4):1741–1777. doi:10.1096/fj.201700442R
26. Burkewitz K, Zhang Y, Mair WB. AMPK at the nexus of energetics and aging. Cell Metab. 2014;20(1):10–25. doi:10.1016/j.cmet.2014.03.002
27. Hardie DG. The AMP-activated protein kinase pathway – new players upstream and downstream. J Cell Sci. 2004;117(Pt23):5479–5487. doi:10.1242/jcs.01540
28. Zou MH, Hou XY, Shi CM, et al. Activation of 5′-AMP-activated kinase is mediated through c-Src and phosphoinositide 3-kinase activity during hypoxia-reoxygenation of bovine aortic endothelial cells. Role of peroxynitrite. J Biol Chem. 2003;278(36):34003–34010. doi:10.1074/jbc.M300215200
29. Yamada E, Pessin JE, Kurland IJ, Schwartz GJ, Bastie CC. Fyn-dependent regulation of energy expenditure and body weight is mediated by tyrosine phosphorylation of LKB1. Cell Metab. 2010;11(2):113–124. doi:10.1016/j.cmet.2009.12.010
30. Buso A, Comelli M, Picco R, et al. Mitochondrial adaptations in elderly and young men skeletal muscle following 2 weeks of bed rest and rehabilitation. Front Physiol. 2019. doi:10.3389/fphys.2019.00474
31. Putman CT, Kiricsi M, Pearcey J, et al. AMPK activation increases uncoupling protein-3 expression and mitochondrial enzyme activities in rat muscle without fibre type transitions. J Physiol. 2003;551(Pt1):169–178. doi:10.1113/jphysiol.2003.040691
32. Hahn-Windgassen A, Nogueira V, Chen CC, Skeen JE, Sonenberg N, Hay N. Akt activates the mammalian target of rapamycin by regulating cellular ATP level and AMPK activity. J Biol Chem. 2005;280(37):32081–32089. doi:10.1074/jbc.M502876200
33. Brocca L, Cannavino J, Coletto L, et al. The time course of the adaptations of human muscle proteome to bed rest and the underlying mechanisms. J Physiol. 2012;590(20):5211–5230. doi:10.1113/jphysiol.2012.240267
34. Wagatsuma A, Kotake N, Kawachi T, Shiozuka M, Yamada S, Matsuda R. Mitochondrial adaptations in skeletal muscle to hindlimb unloading. Mol Cell Biochem. 2011;350(1–2):1–11. doi:10.1007/s11010-010-0677-1
35. Mazzatti DJ, Smith MA, Oita RC, Lim FL, White AJ, Reid MB. Muscle unloading-induced metabolic remodeling is associated with acute alterations in PPAR delta and UCP-3 expression. Physiol Genomics. 2008;34(2):149–161. doi:10.1152/physiolgenomics.00281.2007
36. Nagatomo F, Fujino H, Kondo H, et al. PGC-1α and FOXO1 mRNA levels and fiber characteristics of the soleus and plantaris muscles in rats after hindlimb unloading. Histol Histopathol. 2011;26(12):1545–1553. doi:10.14670/HH-26.1545
37. Gan Z, Fu T, Kelly DP, Vega RB. Skeletal muscle mitochondrial remodeling in exercise and diseases. Cell Res. 2018;28(10):969–980. doi:10.1038/s41422-018-0078-7
38. Ferrer MD, Tauler P, Sureda A, Tur JA, Pons A. Antioxidant regulatory mechanisms in neutrophils and lymphocytes after intense exercise. J Sports Sci. 2009;27(1):49–58. doi:10.1080/02640410802409683
39. Ventura-Clapier R, Garnier A, Veksler V. Transcriptional control of mitochondrial biogenesis: the central role of PGC-1alpha. Cardiovasc Res. 2008;79(2):208–217. doi:10.1093/cvr/cvn098
40. Kong X, Wang R, Xue Y, et al. Sirtuin 3, a new target of PGC-1alpha, plays an important role in the suppression of ROS and mitochondrial biogenesis. PLoS One. 2010;5(7):e11707. doi:10.1371/journal.pone.0011707
41. Cantó C, Gerhart-Hines Z, Feige JN, et al. AMPK regulates energy expenditure by modulating NAD+ metabolism and SIRT1 activity. Nature.2009. 458(7241):1056–1060. doi:10.1038/nature07813
42. Russo GL, Russo M, Ungaro P. AMP-activated protein kinase: a target for old drugs against diabetes and cancer. Biochem Pharmacol. 2013;86(3):339–350. doi:10.1016/j.bcp.2013.05.023
43. Bolster DR, Kimball SR, Jefferson LS. Translational control mechanisms modulate skeletal muscle gene expression during hypertrophy. Exerc Sport Sci Rev. 2003;31(3):111–116. doi:10.1097/00003677-200307000-00002
44. Bause AS, Haigis MC. SIRT3 regulation of mitochondrial oxidative stress. Exp Gerontol. 2013;48(7):634–639. doi:10.1016/j.exger.2012.08.007
45. Qiu X, Brown K, Hirschey MD, Verdin E, Chen D. Calorie restriction reduces oxidative stress by SIRT3-mediated SOD2 activation. Cell Metab. 2010;12(6):662–667. doi:10.1016/j.cmet.2010.11.015
46. Someya S, Yu W, Hallows WC, et al. Sirt3 mediates reduction of oxidative damage and prevention of age-related hearing loss under caloric restriction. Cell. 2010;143(5):802–812. doi:10.1016/j.cell.2010.10.002
47. Brenmoehl J, Hoeflich A. Dual control of mitochondrial biogenesis by sirtuin 1 and sirtuin 3. Mitochondrion. 2013;13(6):755–761. doi:10.1016/j.mito.2013.04.002
48. Huang QM, Lv JJ, Ruanshi QM, Liu L. Spontaneous electrical activities at myofascial trigger points at different stages of recovery from injury in a rat model. Acupunct Med. 2015;33(4):319–324. doi:10.1136/acupmed-2014-010666
 © 2020 The Author(s). This work is published and licensed by Dove Medical Press Limited. The
full terms of this license are available at https://www.dovepress.com/terms
and incorporate the Creative Commons Attribution
- Non Commercial (unported, 3.0) License.
By accessing the work you hereby accept the Terms. Non-commercial uses of the work are permitted
without any further permission from Dove Medical Press Limited, provided the work is properly
attributed. For permission for commercial use of this work, please see paragraphs 4.2 and 5 of our Terms.
© 2020 The Author(s). This work is published and licensed by Dove Medical Press Limited. The
full terms of this license are available at https://www.dovepress.com/terms
and incorporate the Creative Commons Attribution
- Non Commercial (unported, 3.0) License.
By accessing the work you hereby accept the Terms. Non-commercial uses of the work are permitted
without any further permission from Dove Medical Press Limited, provided the work is properly
attributed. For permission for commercial use of this work, please see paragraphs 4.2 and 5 of our Terms.