Back to Journals » Cancer Management and Research » Volume 12
Deep Learning in CT Images: Automated Pulmonary Nodule Detection for Subsequent Management Using Convolutional Neural Network
Authors Xu YM, Zhang T, Xu H, Qi L, Zhang W, Zhang YD, Gao DS, Yuan M ![]() , Yu TF
, Yu TF
Received 25 November 2019
Accepted for publication 5 April 2020
Published 29 April 2020 Volume 2020:12 Pages 2979—2992
DOI https://doi.org/10.2147/CMAR.S239927
Checked for plagiarism Yes
Review by Single anonymous peer review
Peer reviewer comments 2
Editor who approved publication: Dr Antonella D'Anneo
Yi-Ming Xu,1 Teng Zhang,1 Hai Xu,1 Liang Qi,1 Wei Zhang,1 Yu-Dong Zhang,1 Da-Shan Gao,2 Mei Yuan,1 Tong-Fu Yu1
1Department of Radiology, The First Affiliated Hospital of Nanjing Medical University, Nanjing, People’s Republic of China; 2 12sigma Technologies, San Diego, California, USA
Correspondence: Mei Yuan; Tong-Fu Yu
Department of Radiology, The First Affiliated Hospital of Nanjing Medical University, 300, Guangzhou Road, Nanjing, Jiangsu Province, People’s Republic of China
, 210009 Tel +86-13405835354
; +86-13813810516
Fax +86-02568136861
Email [email protected]; [email protected]
Purpose: The purpose of this study is to compare the detection performance of the 3-dimensional convolutional neural network (3D CNN)-based computer-aided detection (CAD) models with radiologists of different levels of experience in detecting pulmonary nodules on thin-section computed tomography (CT).
Patients and Methods: We retrospectively reviewed 1109 consecutive patients who underwent follow-up thin-section CT at our institution. The 3D CNN model for nodule detection was re-trained and complemented by expert augmentation. The annotations of a consensus panel consisting of two expert radiologists determined the ground truth. The detection performance of the re-trained CAD model and three other radiologists at different levels of experience were tested using a free-response receiver operating characteristic (FROC) analysis in the test group.
Results: The detection performance of the re-trained CAD model was significantly better than that of the pre-trained network (sensitivity: 93.09% vs 38.44%). The re-trained CAD model had a significantly better detection performance than radiologists (average sensitivity: 93.09% vs 50.22%), without significantly increasing the number of false positives per scan (1.64 vs 0.68). In the training set, 922 nodules less than 3 mm in size in 211 patients at high risk were recommended for follow-up CT according to the Fleischner Society Guidelines. Fifteen of 101 solid nodules were confirmed to be lung cancer.
Conclusion: The re-trained 3D CNN-based CAD model, complemented by expert augmentation, was an accurate and efficient tool in identifying incidental pulmonary nodules for subsequent management.
Keywords: computer-aided detection, computed tomography, pulmonary nodules, convolutional neural network
Introduction
Lung cancer is the leading cause of cancer death worldwide.1 On computed tomography (CT), lung cancer can be detected in its initial stages radiologically as a pulmonary nodule. Increased utilization of low-dose multidetector CT, increasing rates of incidentally detected pulmonary nodules on CT, and increasing amount of interpreted CT images posed challenges for radiologists. Automated detection of pulmonary nodules on CT plays an important role in nodule detection and earlier cancer diagnosis. Research into computer-aided detection (CAD) of pulmonary nodules in thoracic CT scans has rapidly grown in the last two decades.
Various traditional feature-based machine learning approaches have been proposed, especially for classification, in CAD schemes.2–6 Feature-based CAD schemes have sensitivities ranging 38–100% and 0.7–74.4 false positive per scan (FP/scan). However, it is difficult to compare CAD schemes, as only a few studies provide a comparative performance evaluation of different CAD models using a common database. In addition, manually crafted features are limited and struggle to provide a complete quantitative description of the appearance of pulmonary nodules.
A series of studies7,8 has shown that convolutional neural networks (CNNs) effectively represent high-level features and produce better classification results than hand-crafted feature-based CAD models. In general, the network architectures of CNN models consist of two steps: 1. Candidate nodule detection, and 2. False-positive reduction. The candidate nodules, obtained in the first stage, were classified in the second stage for false-positive removal. The LUNA16 study by Setio et al9 aimed to objectively evaluate various automatic nodule detection algorithms using a publicly available reference database of chest CT scans, the LIDC-IDRI dataset. Among them, a multi-level contextual 3-dimensional (3D) CNN architecture by Dou et al8 achieved the highest sensitivity of 98.1% at 2 FP/scan, and the competition performance metric (CPM) achieved 0.908, making it the single best-performing model for false-positive reduction.
In our study, we also presented two-phase prediction 3D CNN networks: a fully convolutional V-Net10 for volumetric candidate detection and a multi-level contextual 3D CNNs similar to Dou et al8 for false-positive reduction. However, when we tested the detection performance in this pre-trained network, the detection sensitivity was only 38.44% at 0.68 FP/scan and CPM of 0.347. Like many previous studies,9,11,12 Dou et al only categorized nodules ≥3 mm in size as relevant lesions and nodules <3 mm, regardless of risk factors, were considered irrelevant and ignored according to the lung cancer protocols of Aberle et al.11 Unlike the less aggressive management of small nodules in screening programs, radiologists should interpret the incidentally identified nodules based on the 2017 Fleischner Society Guidelines, which recommends that high-risk patients with solid nodules <6 mm or patients with multiple subsolid nodules warrant routine follow-up CT scan.13 Thus, incidental nodule detection, regardless of size, should be separated from subsequent nodule analysis and management. In our study, by complementing CNNs with expert augmentation, we re-trained and tested the 3D CNNs-CAD model based on a dataset of 1109 cases from our institution to detect nodules of all sizes. The aim of this study was to compare the detection performance of the 3D CNNs-CAD model with radiologists of different levels of experience in detecting pulmonary nodules of all sizes.
Patients and Methods
Data and CT Protocol
This retrospective Health Insurance Portability and Accountability Act-compliant (HIPAA) study was approved by the institution review board and the need for informed consent was waived. We retrospectively reviewed 83,512 patients aged between 35 and 82 years who underwent initial routine CT scans at our institution from January 2014 to August 2015. Patients who underwent follow-up CT scans for at least 2 years or surgery for highly suspicious nodules within 2 years of the initial CT scan were eligible for inclusion. Patients who had a previous diagnosis of lung cancer, hemoptysis, unexplained weight loss of more than 6.8 kg in the preceding year, or had undergone chest CT within 18 months before enrollment were excluded. Ultimately, 1109 patients were enrolled in our study. Eighty percent of all patients in the dataset were randomly selected as the training set (887 cases), 10% as the validation set (111 cases) for model selection, and the remaining 10% as the test set (111 cases) for assessment of the selected model. Randomization was performed by using pseudorandom numbers generated from the random function in the Python Standard Library (Python 2.7.13, Python Software Foundation, Wilmington, Del).
All patients underwent unenhanced chest CT using a 128-slice (Definition AS+; Siemens, Malvern, Pa) row CT scanner, with a slice thickness of 1.0 mm and a reconstruction interval of 0.8 mm. The protocol was as follows: 100–120 kVp; mAs settings based on CARE Dose 4D for exposure dose reduction. All images were reconstructed with a high-kernel (b60) 512×512 matrix. Window settings were as follows: standard lung (window width, 1500 HU; window level, −600 HU) and mediastinum (window width, 350 HU; window level, 50 HU).
Image Interpretation
Three radiologists at different seniority levels (authors 2, 4, and 5 with 5, 11, and 20 years of experience in chest imaging, respectively) were asked to independently interpret all of the original CT images (including the training set, validation set and test set). They were aware that this was a nodule detection study, and were otherwise blinded to all information regarding the CT scans. The order of reading was selected randomly. Reading time for each patient was measured by an assistant without revealing it to the radiologists.
A pulmonary nodule was defined as a small spherical or ellipsoid structure, non-linear circumscribed focus of abnormal tissue.14,15 Longitudinal or linear densities without a nodule like aspect and sub-pleural densities that were attributable to pleural adhesions were excluded from the nodule diagnosis. Radiologists independently marked each pulmonary nodule in CT images, and noted the size (largest axial diameter), location (slice level, right or left lung), morphological type (calcified, solid and sub-solid).
Construction of 3D CNNs Model
Pre-Processing
The 3D CNN networks were initially trained using 888 cases with 1186 nodules ≥3 mm in size from the LUNA16 dataset.16 To facilitate the training of the 3D CNNs, input images were normalized to have a zero mean and unit variance. The mean, µ, and the standard deviation, σ, of all training samples were first computed and then were used to normalize each pixel by subtracting µ and dividing by σ.
Nodule Detection
The 3D CNN networks in this study were adapted from contemporary neural networks, namely a fully convolutional V-Net10 for volumetric candidate detection and multi-level contextual 3D CNNs8 for false-positive reduction. Different from the 2D CNNs, by which pulmonary nodules can only be distinguished from the surrounding lung anatomy in the 2D plane, the 3D CNNs, represented as 3D feature volume in the convolutional/max-pooling layer, performed better in revealing the structural and appearance characteristics in 3D spatial dimensions. To optimize detection speed, a coarse-to-fine approach was adopted. A set of candidates were first selected by the coarse detection using a smaller network, while the false positives in the candidates were further pruned by larger 3D CNNs (Figure 1). The candidate detection network architecture consisted of an encoder path followed by a decoder path. The features map from the encoder path was concatenated with the feature maps in the decoder path at the corresponding scales. The layers used in the network include convolution, rectified linear unit (ReLU), max pooling, batch normalization, and residual layers. The network was fully convolutional, which is suited for object detection in a large 3D volume. The results of the candidate detection were used as the input layer for the second-phase prediction.
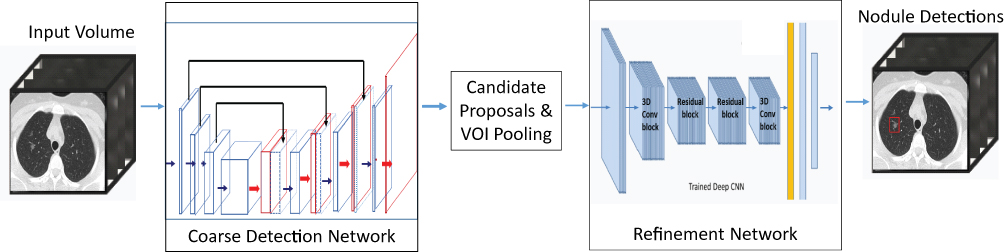 |
Figure 1 3D CNNs-CAD classification network architecture. A coarse-to-fine approach was adopted by using a fully convolutional network V-Net for coarse candidate detection and multi-level contextual 3D CNNs for fine-tuning. Average consuming time of this model for nodule detection in each scan was 4 s. |
The false-positive reduction component consisted of three 3D CNNs with different sized receptive fields to deal with pulmonary nodules of different sizes. In our study, each 3D convolutional network consisted of 3D convolutional, 3D max-pooling, residual, and fully connected layers, and a softmax layer for the final regression to probabilities. Slightly different from the networks by Dou et al, double residual-net blocks were incorporated in the proposed refinement network to improve the training efficiency and avoid gradient vanishing. The pulmonary nodules showed large variations regarding volume sizes and morphological characteristics, among other factors. According to Dou et al, it is difficult to identify a single optimal receptive field for the detection of targets with large variations. Therefore, they designed three 3D CNNs and obtained the final classification results by fusing the prediction outputs of the three.
The 3D CNNs model consisted of three 3D CNN architectures applicable to the various lesion sizes (Archi-a, Archi-b, Archi-c) with a receptive field of 20×20×6, 30×30×10, and 40×40×26, respectively. In Archi-a, the receptive field is followed by three convolutional layers with 64 kernels of 5×5×3, 5×5×3, and 5×5×1. In Archi-b and Archi-c, a receptive field is applied followed by the first convolutional layer with 64 kernels of 5×5×3. Thereafter, a max-pooling layer and two convolutional layers both with 64 kernels of 5×5×3 are applied. The difference is that the kernel of the max-pooling layer is 2×2×1 in Archi-b and 2×2×2 in Archi-c. Archi-a has the fewest fully connected layer output units (150); Archi-b and Archi-c both include a fully connected layer of 250 output units. The three prediction probabilities yielded by the subsystems were merged with a linear weighting to obtain the final prediction. For more architecture details, please refer to the study by Dou et al.8
We designed the CNN model based on Tensorflow (v. 1.4). Our model was referred to the open-source code (https://github.com/shartoo/luna16_multi_size_3dcnn.git), which was the implement of Dou’s work. We used Adam algorithm to update the weights with 0.0001 learning rate. Our model was trained on one NVIDIA GTX 1080Ti graphic card.
After complementing with expert augmentation, we re-trained the 3D CNN networks on a dataset in our institution to detect nodules of all sizes. The re-training dataset consisted of a training set and validation set with a manually labeled reference standard established by a consensus panel. Training and validation procedures were repeatedly performed by fine-tuning the 3D CNNs model until a satisfactory result was achieved. The workflow for the data analysis is shown in Figure 2.
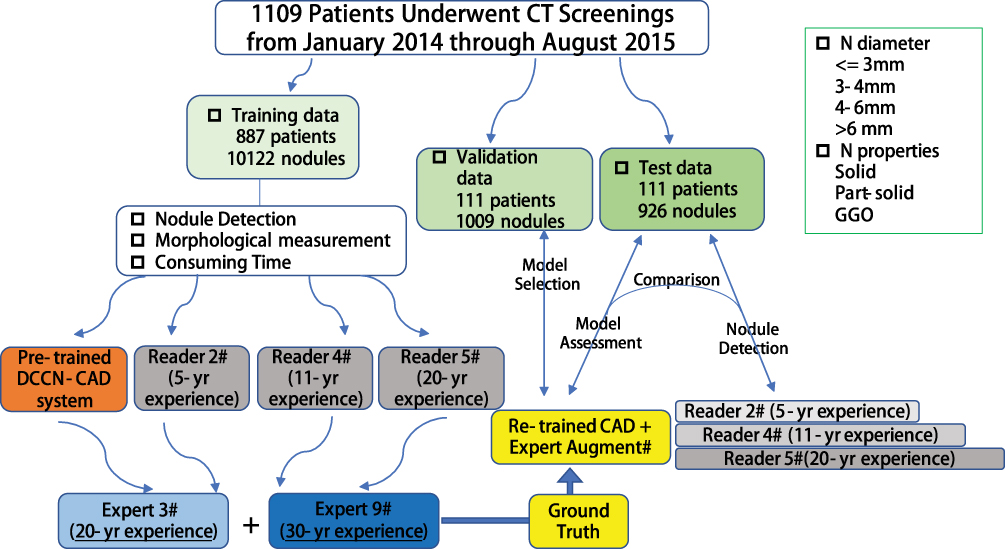 |
Figure 2 Workflow for nodule detection, validation and test in a total of 1109 patients in our single institution. |
Reference Standard of Nodule Inclusion and Model Re-Training
The reference standard was established by a consensus panel of two expert radiologists (author 3, and 9 with 20, and 30 years of experience in chest imaging, respectively). They reviewed the results of training set, validation set and test set obtained from the three radiologists (authors 2, 4, and 5) and the CAD-marked images from the pre-trained 3D CNN model. The reference standard was referred to the previously reported references.12,17 The consensus labelled lesions as “nodules” according to the definitions in the NELSON protocol.15 Non-lesions and benign lesions were regarded as findings excluded from further evaluation. Calcified lesions and abnormal findings not presenting as nodule shapes, eg pleural plaque, or fissure thickening, were recorded as benign lesions. Nodules were labelled as true positive (TP), if they were determined by the consensus panel as positive nodules needing further evaluation, or otherwise as false positive (FP). Beside identifying a pulmonary opacity as a nodule (yes/no), nodule size, location and morphological type were performed by the consensus panel.
As the present study includes all sizes of nodules, it is necessary to re-train the 3D CNNs CAD model complemented by expert augmentation. The re-training dataset consisted of a training set and validation set with a reference standard (ie, ground truth) by consensus panel of two experts. Training and validation procedures were repeatedly performed by fine-tuning the 3D CNNs model until a satisfactory result was achieved. The detection performance of the re-trained CAD model was tested in the test set and compared with three readers (authors 2, 4 and 5) at different levels of experience using the consensus panel as the reference standard.
Follow-Up Recommendation
The recommendations of the trial radiologists were developed according to the 2017 Fleischner Society Guidelines for the management of incidental pulmonary nodules detected on CT images.13
We evaluated three CT scans (first T0) at 1-year intervals (T1 and T2) for the patients who were recommended follow-up CT scans within 2 years. Patients in whom lung cancer was diagnosed and underwent surgery were not offered subsequent tests.
Statistical and Data Analysis
All statistical analyses were performed using statistical software (SPSS 17.0 Chicago, III; MedCalc software, version 8.2.0.1, Mariakerke, Belgium).
Sensitivities for pulmonary nodule detections from three readers and re-trained CAD model were calculated using the consensus panel as the reference standard in the test set. Results were evaluated using the free-response receiver operating characteristic (FROC) analysis. In the FROC curve, sensitivity was plotted as a function of the average number of FP/scan. An overall score was calculated by using the CPM value18 in order to compare with previous studies. The CPM value was defined as the average of the sensitivity at seven predefined false-positive rates: 1/8, 1/4, 1/2, 1, 2, 4, and 8 FP/scan. The accuracy and FP/scan of CAD and the three readers were calculated and compared using the two-sided Wilcoxon signed-rank test.
P values <0.05 were considered to indicate statistical significance.
Results
The final cohort comprised 1109 patients (640 men and 469 women, mean age 55.1 ± 13.8 years). The mean age of patients in the training set, validation set, and test set were 59.6 ± 10.1 years, 57.8 ± 11.5 years, and 56.6 ± 9.9 years, respectively. No statistical differences in sex or age were found between the three cohorts.
The performance of detection results in pre-trained and re-trained networks are illustrated in Tables 1 and 2. The detection sensitivity was 38.44% with 0.68 FP/scan using the pre-trained network, as shown in Figure 3. The re-trained augmentation by CAD-complemented experts improved detection performance significantly over that of the pre-trained networks (average sensitivity: 93.09% vs 38.44%, P < 0.001) without considerably increased FP/scan (1.64 vs 0.68, P > 0.05), as shown in Tables 1 and 2. Comparing the results before and after re-training, it can be seen that the detection sensitivity of nodules smaller than 3 mm has also been significantly increased (9.26% vs 89.74%) without noticeably increasing FP/scan (0.117 vs 0.597). The difference in detection performance was reduced with the increase of nodule size.
 |
Table 1 Summary of Results Before Fine-Tuning in Test Group (111 Cases) |
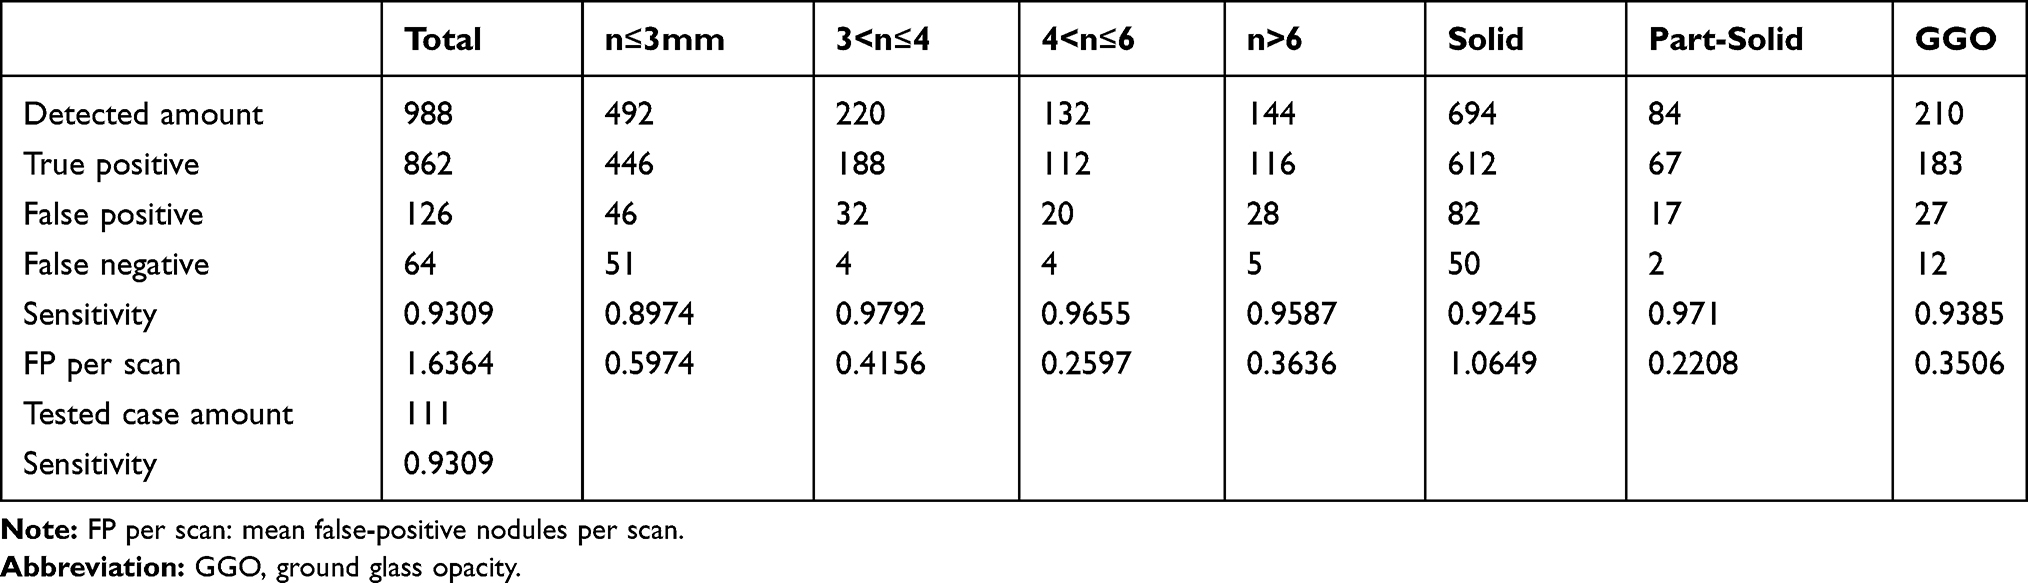 |
Table 2 Summary of Results After Fine-Tuning in Test Group |
 |
Figure 3 FROC curve of pre-trained (A) and re-trained (B) 3D CNNs-CAD model for nodule detection. In the pre-trained model, the detection sensitivity was 38.44% with 0.68 FP/scan, while an average sensitivity of 93.09% was achieved at 1.64 FP per scan in the re-trained model. |
The FROC curves of the model for nodule detection are shown in Figures 3 and 4, and Table 2. An average sensitivity of 93.09% was achieved at 1.64 FP/scan with a CPM score of 0.757. The detection for solid, sub-solid, including part-solid and ground glass opacity (GGO) nodules gave sensitivities of 92.45%, 97.10%, and 93.85% at 1.06, 0.22, and 0.35 FP/scan, respectively, with no significant difference.
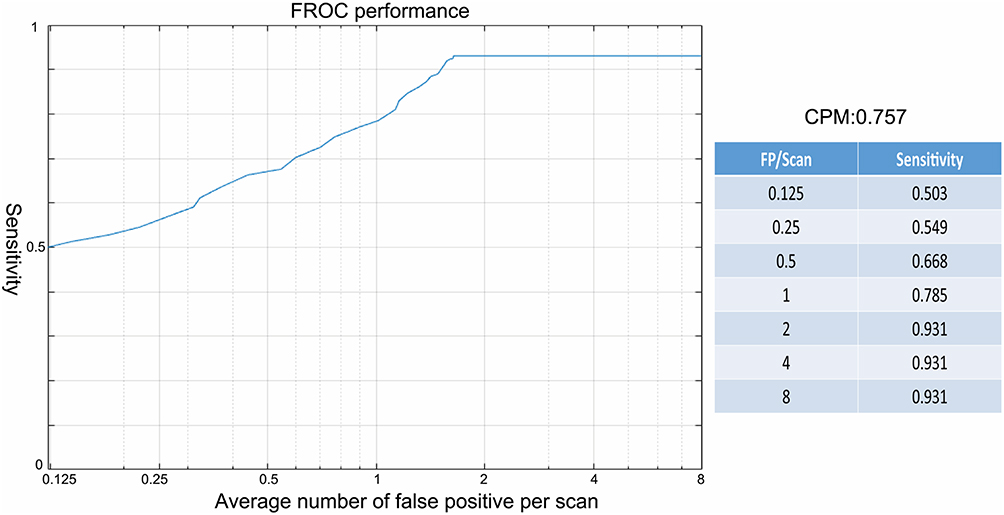 |
Figure 4 The performance of the re-trained 3D CNNs-CAD model complemented expert augment by CPM score in the FROC curve. |
The sensitivities for nodule detection by the three readers were 35%, 46%, and 50.22% with 0.71, 0.67, and 0.68 FP/scan, respectively. The detection sensitivities for solid, part-solid, and GGO nodules by the expert reader with 20 years of experience in chest imaging were 35.2%, 75.36%, and 92.31% with 0.36, 0.10, and 0.22 FP/scan, respectively. Regarding nodule size, the sensitivities of the three readers for nodules less than 3 mm were 27.81%, 28.17%, and 30.18%, respectively, which were significantly lower than the sensitivities for nodules bigger than 3 mm (all sensitivities >59%), as shown in Table 3. Among the three readers, the expert reader did not show any significant advantage in detecting lesion over the other two readers. The re-trained CAD model showed significantly higher sensitivity and better detection performance than the expert radiologist (sensitivity: 93.09% vs 50.22%; CPM score: 0.757 vs 0.436; both P < 0.001) without a significantly higher FP rate (1.64 vs 0.68, P > 0.05).
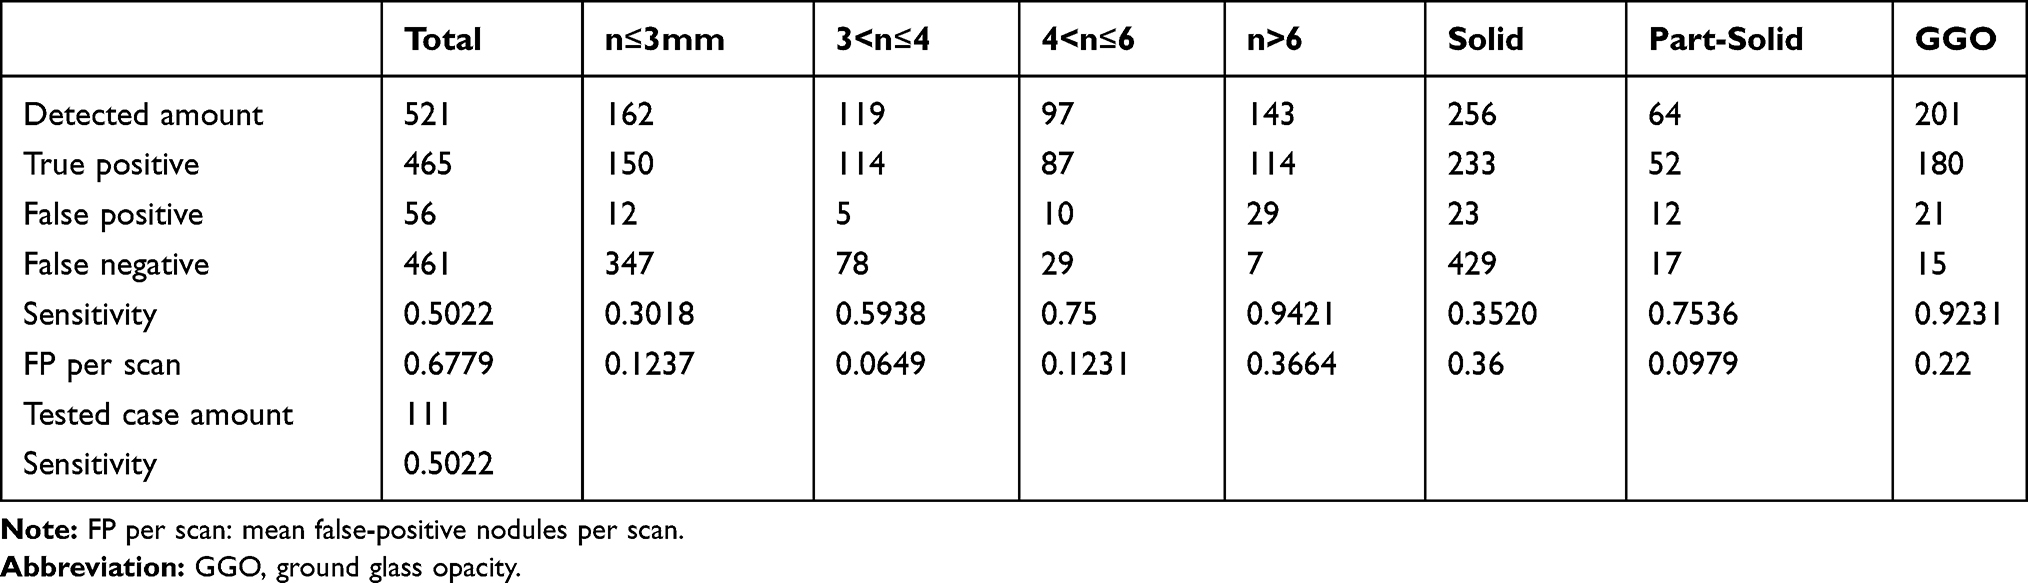 |
Table 3 Summary of Results by Highest Seniority Level Reader in Test Group |
nodules (including calcified nodules) in 887 patients were detected and the results are shown in Table 4. Among them, 56.6% nodules (n = 5731) were ≤3 mm in size, 28.2% (n = 2855) were 3–6 mm, and the remaining 15.2% (n = 1536) were ≥6 mm. By using the 3D CNNs-CAD model complemented by experts, a total of 3524 nodules in 567 patients were detected and recommended for a subsequent follow-up CT scans according to the 2017 Fleischner Society Pulmonary Nodule Guidelines.13 Among them, 922 nodules in 211 patients were less than 3 mm. Within the 24-month follow-up interval, 15 (14.85%) nodules in 15 patients of the 101 solid nodules ≤3 mm in size, and 2 (2.43%) of the 821 pure ground glass nodules (GGNs) were confirmed to be lung cancer. Representative cases including adenocarcinoma in situ (AIS), minimally invasive adenocarcinoma (MIA) et al are shown in Figure 5, Figure 6. The malignancy rate of high-risk solid nodules smaller than 3 mm was significantly higher than that of GGNs. In addition, 242 of the 821 pure GGNs that were followed-up showed to be persistent and 15 showed slight enlargement that required follow-up for the following 2 to 4 years. Ten (0.263%) of the 3798 low-risk solid nodules ≤3 mm in size and 25 (1.41%) of the 1773 solid nodules >3 mm and <6 mm in size were confirmed to be lung cancer. The malignancy rate of low-risk nodules less than 3 mm was significantly lower than the corresponding nodules in the high-risk group.
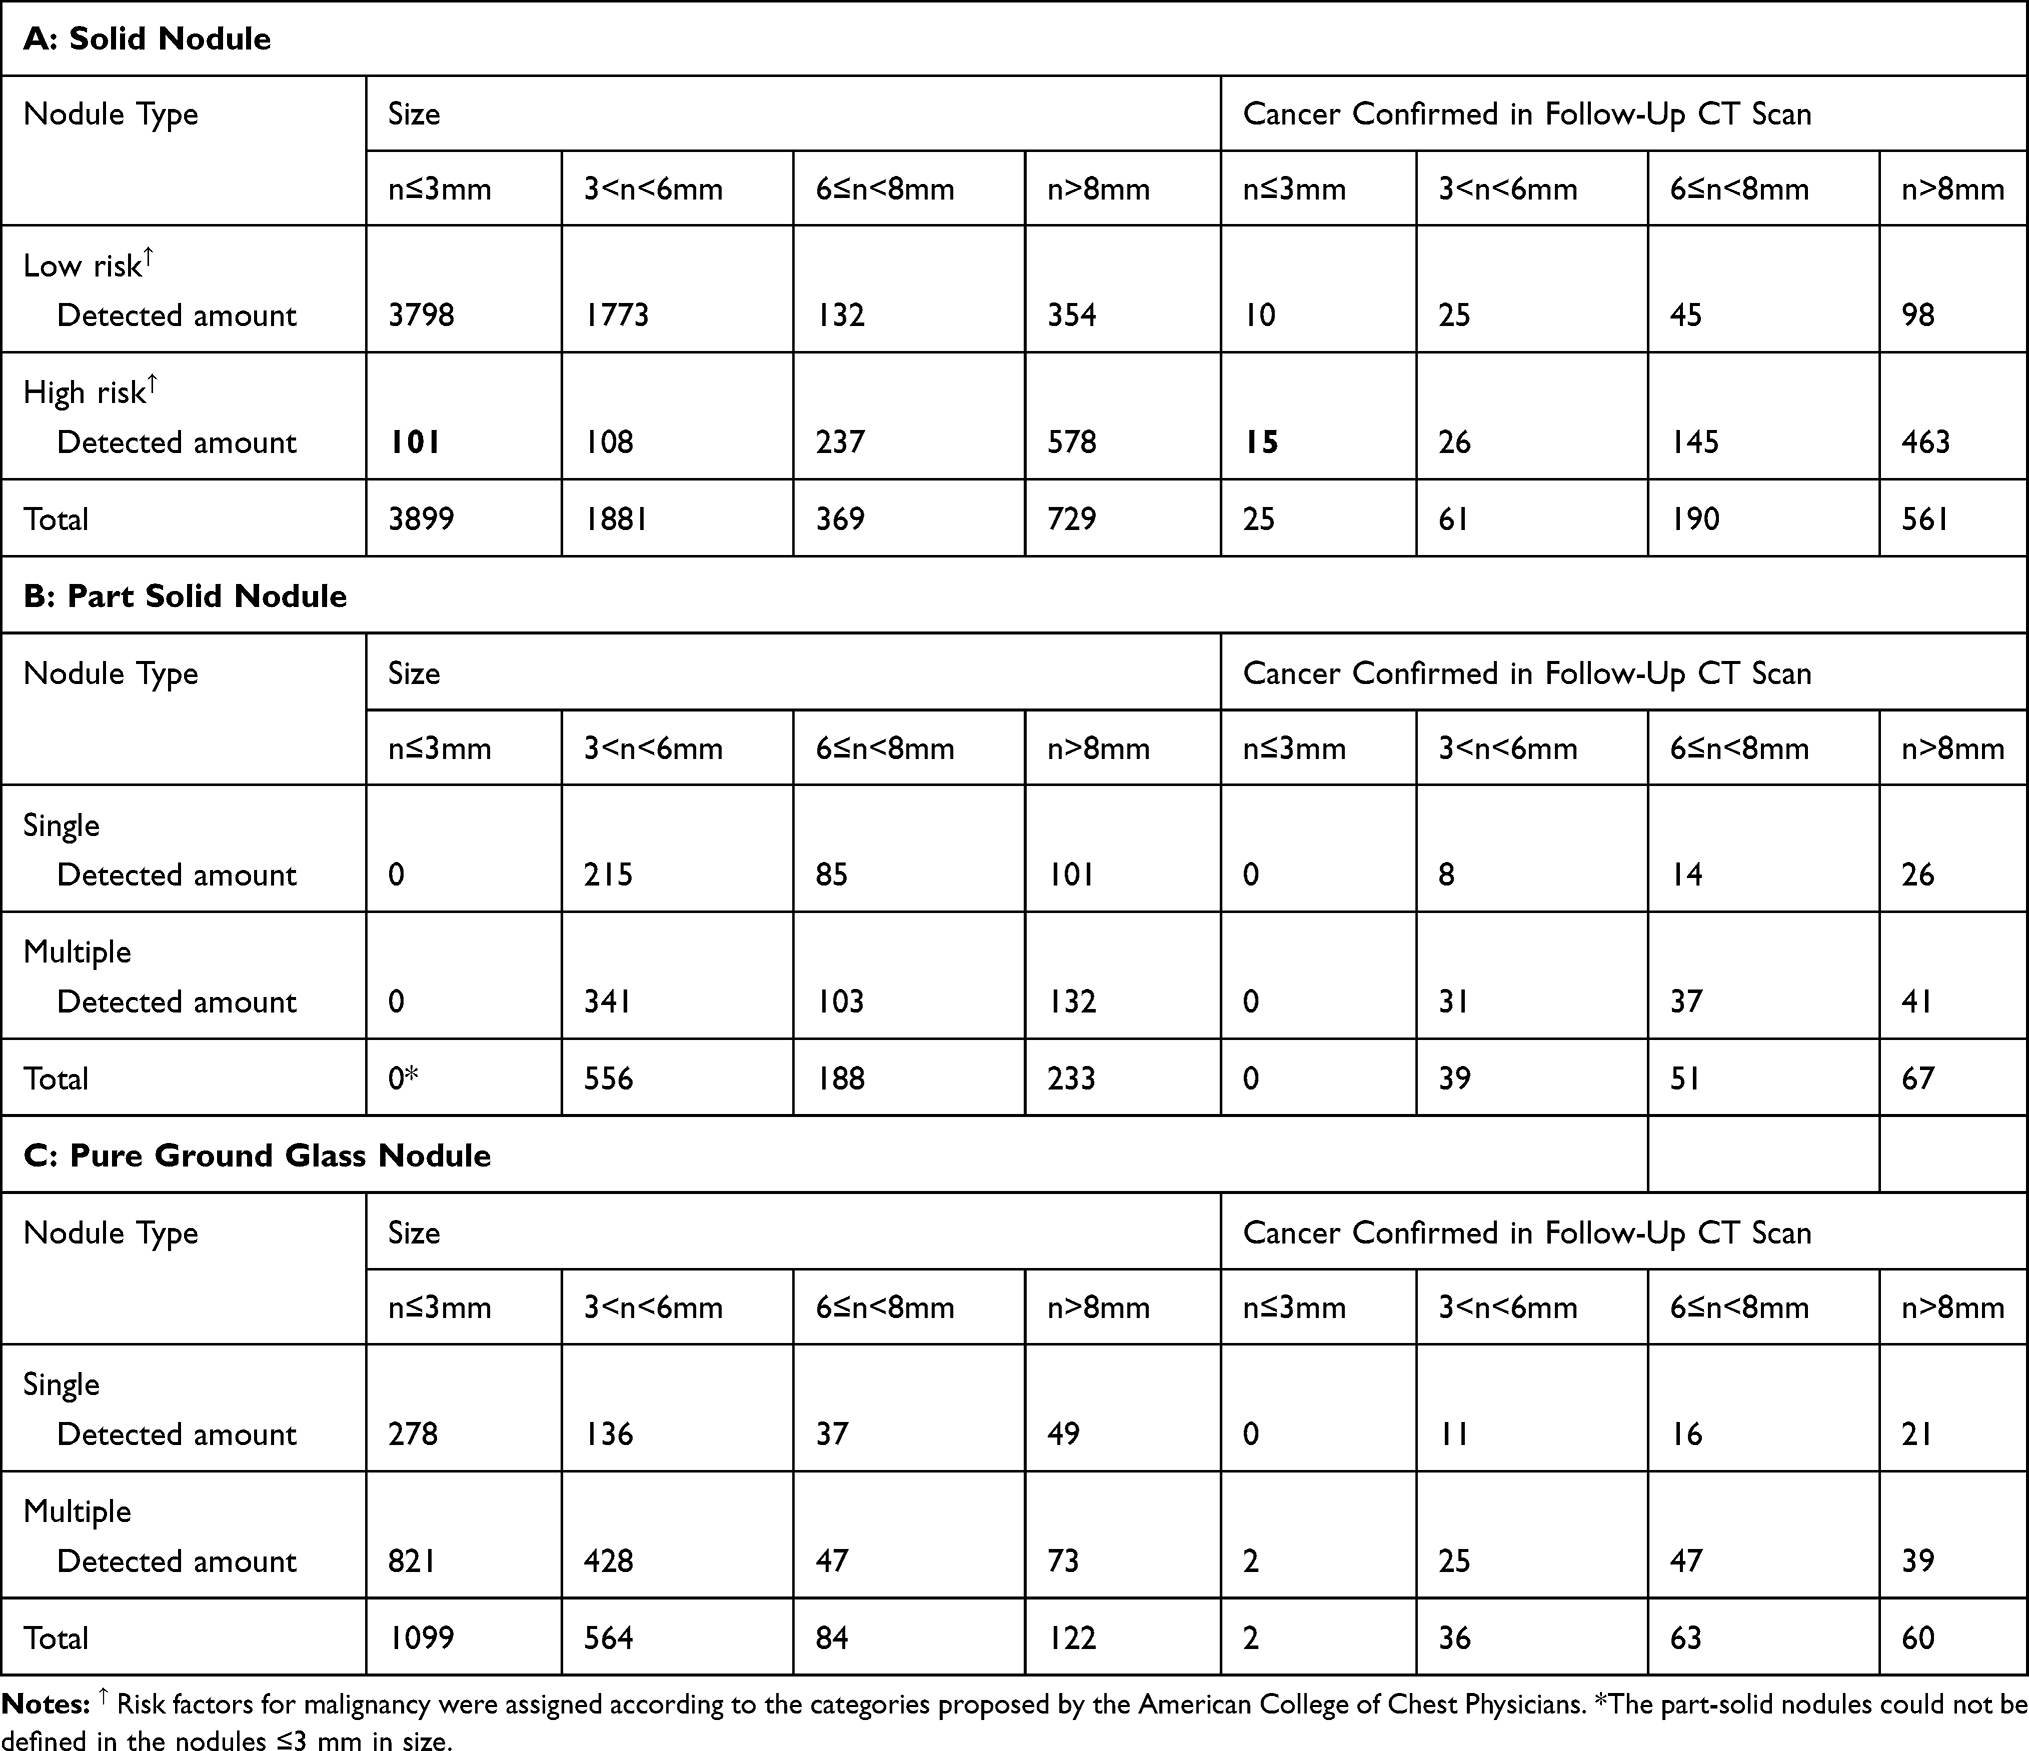 |
Table 4 Summary of 9724 Non-Calcified Nodules in 10,122 Detected Pulmonary Nodules After CAD Complemented Experts in Training Dataset (887 Cases) |
 |
Figure 5 Imaging and pathology in patients with pulmonary nodules<3 mm in size at baseline CT (hematoxylin and eosin staining). Case 1(A–C): Transverse 1.5-mm CT sections showed two sub-solid nodules in the right upper lobe. (A) Growth developed in the pure ground glass nodule (A, curve arrow) at 2 years follow-up CT. Surgical resection was performed with the diagnosis of minimally invasive adenocarcinoma (MIA). (B, C) However, the incidentally resected nodule (B, arrow) in the same lobe proved to be acinar predominant adenocarcinoma (C, magnification: ×200). Case 2(D–I): Transverse 1.0-mm CT sections showed two sub-solid nodules in the right upper (D, G, H) and lower lobe (E). (E, F) Solid component developed (E, curve arrow) during 1 year follow-up, and resection was performed with a diagnosis of chronic inflammation (F, magnification: x100). (D, G–I) CT guided location was performed (G, H, arrow) for the following surgery with a diagnosis of MIA (I, magnification: ×40). Case 3(J–L): Highly suspicious case with a persistent solid nodule (J–K, arrow) and developed bronchiectasis. Surgery was performed with a diagnosis of MIA (L, magnification: ×100). Case 4 (M–O): Incidentally resected nodule (M, arrow) with a diagnosis of acinar predominant adenocarcinoma (O, magnification: ×100). Case 5 (P–R): Incidentally resected nodule (P, arrow) with a diagnosis of adenocarcinoma in situ (AIS) (R, magnification: ×40). |
 |
Figure 6 Imaging and pathology in patients with pulmonary nodules <3 mm in size at baseline CT and progressed to be malignant at follow-up CT (hematoxylin and eosin staining). Case 1(A–C): Transverse 1.5-mm CT sections showed a solid nodule less than 3 mm in size in the left upper lobe (A, arrow). Significant growth developed at 2.5 years follow-up (B, arrow) and surgery was performed with a diagnosis of acinar predominant adenocarcinoma (C, magnification: ×200). Case 2(D–I): Transverse 1.0-mm CT sections showed a solid nodule in the left lower lobe (D, F, G, arrow). Note multiple nodules in peripheral (G, curve arrow). At 3 years follow-up, the peripheral nodules disappeared (H), while the perivascular nodule developed significantly (E, H, arrow) and confirmed to be squamous cell carcinoma (I, magnification: ×100). |
The average time for nodule detection in a patient was 4 s by the CAD model. As for the three readers who interpreted the original images, the average time for nodule detection was 8 min per scan. Compared with radiologists, the CAD model appears to be an efficient and time-saving method.
Discussion and Conclusion
In our study, a newly developed CAD model based on 3D CNNs was evaluated to detect incidental pulmonary nodules of all sizes. After re-training of the 3D CNNs-CAD model with our dataset of 887 cases and 10,122 nodules complemented by expert augmentation, the detection performance showed a significant improvement over the pre-trained network, with a sensitivity of 93.09% at 1.64 FP/scan and CPM score of 0.757. The re-trained CAD model showed significantly higher sensitivity and CPM than expert radiologists without a significantly increased FP rate (P > 0.05). The CAD model significantly improved the detection performance for nodules less than 6 mm in size (sensitivity 91.01% at 0.333 FP/scan), especially for nodules less than 3 mm in size (sensitivity 89.74% at 0.597 FP/scan), and provided an accurate and efficient method for the subsequent management of incidentally detected pulmonary nodules.
Many studies2,12,19 have demonstrated that the CAD model can significantly improve the diagnostic accuracy of pulmonary nodule detection. However, the reported sensitivity of CAD has ranged from 38% to 100% and the FP rate ranged from 0.7 to 74.4 per scan. CNN-based detection models have been shown to outperform state-of-the-art computer vision applications and have been successfully applied to nodule detection, segmentation, and diagnosis by learning highly discriminative features of raw input data, without the manual input of features.8,9
CNNs are designed to better utilize spatial and configurational information from 2D or 3D images as input. The strength of CNNs lies in their weight sharing, exploiting the intuition that similar structures occur in different locations in one image. When seeing x as a vectorized image, weights can be shared in such a way that it results in a convolution operation. This dramatically reduces the number of parameters (ie, the number of weights no longer depends on the size of the input image) that needs to be learned and renders the network equivalent with respect to translation of the input. In general, each CNN consists of convolution, non-linear activation, pooling, and fully connected layers to hierarchically extract features and a softmax layer for the final regression to probabilities. Each layer contains a number of channels, and every channel encodes a different pattern.
In the LUNA16 competition,9 the single best-performing model was developed by Dou et al8 by using multi-level contextual 3D CNNs with a CPM value of 0.908. The detection sensitivities achieved 97.2% and 98.3% at 1 and 4 FP/scan, respectively. However, when we tested the pre-trained multi-level contextual 3D CNNs with our test category, the detection sensitivity was only 38.44% at 0.68 FP/scan, with a CPM score of 0.347. The most important reason for this difference is that the annotating method in the pre-training algorithm was unfit for our dataset. According to the study by Setio et al,9 the nodules annotated ≥3 mm were categorized as relevant lesions in the pre-training process. Nodules <3 mm and non-nodule lesions were considered irrelevant lesions and were ignored, as the probability of malignancy in nodules <3 mm was negligible in previous studies.20–22 Although nodule size has a clear relationship with the risk of malignancy, there is no strict cut-off between benign and malignant lesions. Numerous other risk factors, including smoking, exposure to other carcinogens, emphysema, fibrosis, upper lobe location, family history of lung cancer, age, and sex, have differing effects on the likelihood of malignancy.23 After discussing with 23 expert radiologists in China, we determined to label all detected true positive nodules despite the size, as we considered that the detection of nodules should be separate from the subsequent nodule analysis and management. In addition, in the 2017 Fleischner Society guidelines for the management of incidental pulmonary nodules detected on CT scans, high-risk patients (according to the categories proposed by American College of Chest Physicians23) with single or multiple solid, multiple <6 mm part solid, or pure ground-glass nodules may warrant routine follow-up. Therefore, all labeled nodules were categorized as relevant lesions regardless of their size to meet clinical requirements. The differences in data characteristics for pre-training and practical use of degrade performance.24 Nomura et al25 retrained cerebral aneurysm detection software using data collected in clinic, and effectively improved the performance of this CAD model without changing the training algorithm. Thus, the re-training process is essential before the application of the CAD model. In our study, we re-trained, validated, and tested a 3D CNNs-CAD model based on a database of 1109 patients to detect as many nodules as possible for subsequent evaluation according to the 2017 Fleischner Society guidelines. This re-trained CAD model was complemented by expert augmentation and significantly improved detection performance over that of the pre-trained networks (sensitivity: 93.09% vs 38.44%), especially for nodules less than 3 mm in size (sensitivity: 89.74% vs 9.26%).
In the training dataset, 56.6% detected nodules (n=5731) were ≤3 mm in size. A total of 922 nodules in 211 patients were regarded as high risk and recommended follow-up CT scans. Fifteen (14.85%) nodules in 15 patients within the 101 high-risk solid nodules and two nodules in two patients within the 821 high-risk GGNs were confirmed as lung cancer. Thus, 1.93% of all 877 patients in the training dataset were at high risk and 8.06% of the high-risk patients had confirmed malignancy. In particular, 14.85% of patients with high-risk solid nodules ≤3 mm were confirmed to have cancer. In addition, 10 (0.263%) of the 3798 low-risk solid nodules ≤3 mm in size were confirmed to be lung cancer. The malignancy rate for nodules smaller than 3 mm was significantly higher in the high-risk group. Thus, we considered that combined with risk factor evaluation, the re-trained 3D CNNs-CAD model plays an important role in detecting pulmonary nodules of all sizes and provides an efficient and accurate method for the management of pulmonary nodules.
Another advancement of the current study was that a fully convolutional V-Net was used for candidate detection. In the candidate detection stage, high sensitivity (ideally close to 100%) is essential despite the potential increased false-positive rate because any lesions missed at this stage could not be found in the next refinement stage. The fully convolutional network, which trained end-to-end, pixel-to-pixel on semantic segmentation, exceeded state-of-the-art nodule detection with efficient inference and learning ability for candidate detection. To optimize detection speed, a coarse-to-fine approach was adopted in the study. A set of candidates was first selected using coarse detection, which utilized a smaller network, while false positives among the candidates were further pruned by using larger refinement 3D CNNs. The average time for nodule detection in a patient was 4 s by the CAD model, which is significantly less than the detection time of radiologists. Thus, the re-trained CAD model was found to be an efficient and time-saving method.
Our study has several limitations. First, the sensitivities at 0.125, 0.25 FP/scan were relatively low compared with those reported in previous studies,8,9 resulting in a relatively lower CPM score (CPM: 0.757 vs 0.908). Although we mentioned that the main reason for this is the fact that nodules of all sizes were labeled instead of annotating nodules ≥3 mm as a relevant lesion in the present study, the detection performance in terms of sensitivity should be further improved. Second, the main work in the present study focused on nodule detection and preliminary morphological parameters were measured for systematic report generation. Further deep learning methods should be developed to improve the detection of and diagnostic performance for suspicious nodules. Third, a more convenient model that integrated clinical and radiographic data together should be developed for risk factor evaluation. Fourth, although the re-trained CAD model achieved better detection performance than radiologists, quality assurance requirements are another issue in clinical practice. Considering the effects of the quality of the training data on developing a classifier, choosing an optimal training dataset and strategy should be done so more cautiously. In addition, end-user training and subsequent management methods are critical to ensuring consistency of CAD model performance at clinical sites over time.26 Finally, according to previous studies,27–29 the considerable amount of memory consumed by 3D CNNs has been a common problem. To some extent, such computational complexity hinders the translation from scientific research to clinical application.30 On the other hand, the more parameters that 3D CNN is required to learn, the larger the necessary training dataset to handle the overfitting problem. Improvements in training strategies are necessary to overcome dataset limits.31
In conclusion, the re-trained 3D CNNs-CAD model based on a dataset of 1109 patients significantly improved the detection of incidental pulmonary nodules of all sizes and proved to be an accurate and efficient tool for detecting and managing incidental pulmonary nodules.
Abbreviations
3D, 3-dimensional; 3D CNNs, 3-dimensional convolutional neural networks; AIS, adenocarcinoma in situ; CAD, computer-aided detection; CNNs, convolutional neural networks; CPM, competition performance metric; CT, computed tomography; FP, false positive; FP/scan, false positive per scan; FROC, free-response receiver operating characteristic; GGNs, ground glass nodules; GGO, ground glass opacity; HIPAA, Health Insurance Portability and Accountability Act-compliant; MIA, minimally invasive adenocarcinoma; ReLU, rectified linear unit; TP, true positive.
Data Sharing Statement
The datasets used and/or analyzed during the current study are available from the corresponding author on reasonable request.
Ethics and Consent Statement
This study was approved by the Ethics Committee of the First Affiliated Hospital of Nanjing Medical University and informed consent was waived.
Acknowledgments
The authors thank the help from the 23 radiologists from the Chinese Union of Lung Cancer. The radiologists are from the Affiliated Drum Tower Hospital of Nanjing University Medical School (Nanjing), Shanghai Chest Hospital (Shanghai), Beijing Chest Hospital (Beijing) and the First Affiliated Hospital of Nanjing Medical University (Nanjing). The authors thank the Department of Pathology of the First Affiliated Hospital of Nanjing Medical University for assistance with histopathology.
Author Contributions
Mei Yuan and Tong-Fu Yu are joint corresponding authors.
Conceptualization: Yi-Ming Xu, Teng Zhang, Mei Yuan, Tong-Fu Yu
Data curation: Yi-Ming Xu, Teng Zhang, Mei Yuan, Tong-Fu Yu
Formal analysis: Yu-Dong Zhang, Da-Shan Gao
Investigation: Teng Zhang, Hai Xu, Liang Qi, Wei Zhang, Tong-Fu Yu
Methodology: Mei Yuan, Tong-Fu Yu
Project administration: Yi-Ming Xu
Software: Da-Shan Gao, Yu-Dong Zhang
Validation: Mei Yuan, Tong-Fu Yu
Visualization: Yi-Ming Xu
Writing – original draft: Yi-Ming Xu, Mei Yuan, Teng Zhang, Hai Xu, Da-Shan Gao
Writing – review & editing: Mei Yuan, Tong-Fu Yu
All authors contributed to data analysis, drafting or revising the article, gave final approval of the version to be published, and agree to be accountable for all aspects of the work.
Funding
The work was supported by the National Natural Science Foundation of China (81801693).
Disclosure
The authors declare that they have no competing interests.
References
1. Siegel RL, Miller KD, Jemal A. Cancer statistics, 2017. CA Cancer J Clin. 2017;67(1):7–30.
2. Shaukat F, Raja G, Gooya A, Frangi AF. Fully automatic detection of lung nodules in CT images using a hybrid feature set. Med Phys. 2017;44(7):3615–3629. doi:10.1002/mp.12273
3. Torres EL, Fiorina E, Pennazio F, et al. Large scale validation of the M5L lung CAD on heterogeneous CT datasets. Med Phys. 2015;42(4):1477–1489. doi:10.1118/1.4907970
4. Golosio B, Masala GL, Piccioli A, et al. A novel multithreshold method for nodule detection in lung CT. Med Phys. 2009;36(8):3607–3618. doi:10.1118/1.3160107
5. Suzuki K. Pixel-based machine learning in medical imaging. Int J Biomed Imaging. 2012;2012:792079.
6. Suzuki K. Machine learning in computer-aided diagnosis of the thorax and colon in ct: a survey. IEICE Trans Inf Syst. 2013;E96-D(4):772–783. doi:10.1587/transinf.E96.D.772
7. Jiang H, Ma H, Qian W, et al. An automatic detection system of lung nodule based on multigroup patch-based deep learning network. IEEE J Biomed Health Inform. 2018;22(4):1227–1237. doi:10.1109/JBHI.2017.2725903
8. Dou Q, Chen H, Yu L, Qin J, Heng PA. Multilevel contextual 3-D CNNs for false positive reduction in pulmonary nodule detection. IEEE Trans Biomed Eng. 2017;64(7):1558–1567. doi:10.1109/TBME.2016.2613502
9. Setio AAA, Traverso A, de Bel T, et al. Validation, comparison, and combination of algorithms for automatic detection of pulmonary nodules in computed tomography images: the LUNA16 challenge. Med Image Anal. 2017;42:1–13. doi:10.1016/j.media.2017.06.015
10. Milletari F, Navab N, Ahmadi S. V-net: fully convolutional neural networks for volumetric medical image segmentation.
11. Aberle DR, Adams AM, Berg CD, et al. For national lung screening trial research team. reduced lung-cancer mortality with low-dose computed tomographic screening. N Engl J Med. 2011;365(5):395–409.
12. Zhao Y, de Bock GH, Vliegenthart R, et al. Performance of computer-aided detection of pulmonary nodules in low-dose CT: comparison with double reading by nodule volume. Eur Radiol. 2012;22(10):2076–2084. doi:10.1007/s00330-012-2437-y
13. MacMahon H, Naidich DP, Goo JM, et al. Guidelines for management of incidental pulmonary nodules detected on CT images: from the fleischner society 2017. Radiology. 2017;284(1):228–243. doi:10.1148/radiol.2017161659
14. Austin JH, Muller NL, Friedman PJ, et al. Glossary of terms for CT of the lungs: recommendations of the nomenclature committee of the fleischner society. Radiology. 1996;200(2):327–331. doi:10.1148/radiology.200.2.8685321
15. Xu DM, Gietema H, de Koning H, et al. Nodule management protocol of the NELSON randomised lung cancer screening trial. Lung Cancer. 2006;54(2):177–184. doi:10.1016/j.lungcan.2006.08.006
16. Armato S, McLennan G, McNitt-Gray M, et al. The Lung Image Database Consortium (LIDC) and Image Database Resource Initiative (IDRI): a completed public database of ct scans for lung nodule analysis. Med Phys. 2010;37(6Part6):3416–3417. doi:10.1118/1.3469350
17. Jankowski A, Martinelli T, Timsit JF, et al. Pulmonary nodule detection on MDCT images: evaluation of diagnostic performance using thin axial images, maximum intensity projections, and computer-assisted detection. Eur Radiol. 2007;17(12):3148–3156. doi:10.1007/s00330-007-0727-6
18. Niemeijer M, Loog M, Abramoff MD, Viergever MA, Prokop M, van Ginneken B. On combining computer-aided detection systems. IEEE Trans Med Imaging. 2011;30(2):215–223. doi:10.1109/TMI.2010.2072789
19. Jacobs C, van Rikxoort EM, Murphy K, Prokop M, Schaefer-Prokop CM, van Ginneken B. Computer-aided detection of pulmonary nodules: a comparative study using the public LIDC/IDRI database. Eur Radiol. 2016;26(7):2139–2147. doi:10.1007/s00330-015-4030-7
20. Henschke CI, McCauley DI, Yankelevitz DF, et al. Early lung cancer action project: overall design and findings from baseline screening. Lancet. 1999;354(9173):99–105. doi:10.1016/S0140-6736(99)06093-6
21. Henschke CI, Yankelevitz DF, Naidich DP, et al. CT screening for lung cancer: suspiciousness of nodules according to size on baseline scans. Radiology. 2004;231(1):164–168. doi:10.1148/radiol.2311030634
22. Swensen SJ, Jett JR, Hartman TE, et al. Lung cancer screening with CT: mayo Clinic experience. Radiology. 2003;226(3):756–761. doi:10.1148/radiol.2263020036
23. Gould MK, Donington J, Lynch WR, et al. Evaluation of individuals with pulmonary nodules: when is it lung cancer? Diagnosis and management of lung cancer, 3rd ed: american college of chest physicians evidence-based clinical practice guidelines. Chest. 2013;143(5 Suppl):e93S–e120S. doi:10.1378/chest.12-2351
24. Nomura Y, Masutani Y, Miki S, et al. Training strategy for performance improvement in computer-assisted detection of lesions: based on multi-institutional study in teleradiology environment.
25. Nomura Y, Masutani Y, Miki S, et al. Performance improvement in computerized detection of cerebral aneurysms by retraining classifier using feedback data collected in routine reading environment. J Biomed Graph Comput. 2014;4(4). doi:10.5430/jbgc.v4n4p12
26. Huo Z, Summers RM, Paquerault S, et al. Quality assurance and training procedures for computer-aided detection and diagnosis systems in clinical use. Med Phys. 2013;40(7):077001. doi:10.1118/1.4807642
27. Jin H, Li Z, Tong R, Lin L. A deep 3D residual CNN for false-positive reduction in pulmonary nodule detection. Med Phys. 2018;45(5):2097–2107. doi:10.1002/mp.12846
28. Liao F, Liang M, Li Z, Hu X, Song S. Evaluate the malignancy of pulmonary nodules using the 3-D deep leaky noisy-OR network. IEEE Trans Neural Netw Learn Syst. 2019;30(11):3484–3495. doi:10.1109/TNNLS.2019.2892409
29. Yan K, Bagheri M, Summers RM. 3D context enhanced region-based convolutional neural network for end-to-end lesion detection. Med Image Comput Comput Assisted Intervention. 2018;2018:511–519.
30. Huang X, Sun W, Tseng TB, Li C, Qian W. Fast and fully-automated detection and segmentation of pulmonary nodules in thoracic CT scans using deep convolutional neural networks. Comput Med Imaging Graph. 2019;74:25–36. doi:10.1016/j.compmedimag.2019.02.003
31. Pezeshk A, Hamidian S, Petrick N, Sahiner B. 3-D convolutional neural networks for automatic detection of pulmonary nodules in chest CT. IEEE J Biomed Health Inform. 2019;23(5):2080–2090. doi:10.1109/JBHI.2018.2879449
 © 2020 The Author(s). This work is published and licensed by Dove Medical Press Limited. The
full terms of this license are available at https://www.dovepress.com/terms
and incorporate the Creative Commons Attribution
- Non Commercial (unported, 3.0) License.
By accessing the work you hereby accept the Terms. Non-commercial uses of the work are permitted
without any further permission from Dove Medical Press Limited, provided the work is properly
attributed. For permission for commercial use of this work, please see paragraphs 4.2 and 5 of our Terms.
© 2020 The Author(s). This work is published and licensed by Dove Medical Press Limited. The
full terms of this license are available at https://www.dovepress.com/terms
and incorporate the Creative Commons Attribution
- Non Commercial (unported, 3.0) License.
By accessing the work you hereby accept the Terms. Non-commercial uses of the work are permitted
without any further permission from Dove Medical Press Limited, provided the work is properly
attributed. For permission for commercial use of this work, please see paragraphs 4.2 and 5 of our Terms.