Back to Journals » Cancer Management and Research » Volume 13
Deep Learning-Based Multi-Class Classification of Breast Digital Pathology Images
Authors Mi W ![]() , Li J
, Li J ![]() , Guo Y, Ren X, Liang Z, Zhang T, Zou H
, Guo Y, Ren X, Liang Z, Zhang T, Zou H
Received 24 March 2021
Accepted for publication 13 May 2021
Published 10 June 2021 Volume 2021:13 Pages 4605—4617
DOI https://doi.org/10.2147/CMAR.S312608
Checked for plagiarism Yes
Review by Single anonymous peer review
Peer reviewer comments 2
Editor who approved publication: Professor Seema Singh
Weiming Mi,1,2,* Junjie Li,3,* Yucheng Guo,4,* Xinyu Ren,3 Zhiyong Liang,3 Tao Zhang,1,2 Hao Zou4,5
1Department of Automation, School of Information Science and Technology, Tsinghua University, Beijing, Peoples Republic of China; 2Beijing National Research Center for Information Science and Technology, Beijing, Peoples Republic of China; 3Molecular Pathology Research Center, Department of Pathology, Peking Union Medical College Hospital (PUMCH), Peking Union Medical College and Chinese Academy of Medical Sciences, Beijing, Peoples Republic of China; 4Tsimage Medical Technology, Yantian Modern Industry Service Center, Shenzhen, Peoples Republic of China; 5Center for Intelligent Medical Imaging & Health, Research Institute of Tsinghua University in Shenzhen, Shenzhen, Peoples Republic of China
*These authors contributed equally to this work
Correspondence: Zhiyong Liang
Molecular Pathology Research Center, Department of Pathology, Peking Union Medical College Hospital (PUMCH), Peking Union Medical College and Chinese Academy of Medical Sciences, Beijing, 100730, People’s Republic of China
Email [email protected]
Tao Zhang
Department of Automation, School of Information Science and Technology, Tsinghua University, Beijing, 100084, People’s Republic of China
Email [email protected]
Introduction: Breast cancer, one of the most common health threats to females worldwide, has always been a crucial topic in the medical field. With the rapid development of digital pathology, many scholars have used AI-based systems to classify breast cancer pathological images. However, most existing studies only stayed on the binary classification of breast lesions (normal vs tumor or benign vs malignant), far from meeting the clinical demand. Therefore, we established a multi-class classification system of breast digital pathology images based on AI, which is more clinically practical than the binary classification system.
Methods: In this paper, we adopted a two-stage architecture based on deep learning method and machine learning method for the multi-class classification (normal tissue, benign lesion, ductal carcinoma in situ, and invasive carcinoma) of breast digital pathological images.
Results: The proposed approach achieved an overall accuracy of 86.67% at patch-level. At WSI-level, the overall accuracies of our classification system were 88.16% on validation data and 90.43% on test data. Additionally, we used two public datasets, the BreakHis and BACH, for independent verification. The accuracies our model obtained on these two datasets were comparable to related publications. Furthermore, our model could achieve accuracies of 85.19% on multi-classification and 96.30% on binary classification (non-malignant vs malignant) using pathology images of frozen sections, which was proven to have good generalizability. Then, we used t-SNE for visualization of patch classification efficiency. Finally, we analyzed morphological characteristics of patches learned by the model.
Conclusion: The proposed two-stage model could be effectively applied to the multi-class classification task of breast pathology images and could be a very useful tool for assisting pathologists in diagnosing breast cancer.
Keywords: image analysis, breast cancer, digital pathology images, deep learning, multi-class classification
Introduction
Breast cancer is the most frequently diagnosed tumor and the leading cause of cancer death among females worldwide. In 2020, almost 1 in 4 of the newly diagnosed female cancer cases were breast cancer, and nearly 700,000 women died of breast cancer worldwide, accounting for 15.5% of female mortality.1 Therefore, early diagnosis of breast cancer plays a significant role in reducing cancer-related deaths.
In clinical practice, breast cancer is initially diagnosed by physical examination and medical imaging, including bilateral breast palpation, mammography, and ultrasonography. Then, after surgical excision, the specimens are submitted to microscopic analysis, which allows pathologists to make a final diagnosis and predict the prognosis for further therapy and management.2 Hence, it is important for pathologists to classify breast diseases correctly. However, the qualitative visual analysis of microscopic images is a prolonged and tedious process and lacks objective standards.3,4 Thus, for the same case, the diagnostic result varies among different pathologists. It is reported that the overall discordance of independent diagnosis was 25% in breast biopsy specimens, and the discordance with the consensus-derived reference diagnoses is 9.7%.5 Furthermore, due to the increase of cancer incidence, it makes more time-consuming and overwhelming for diagnosis and grading of cancer as well as harder to manage the volume. To draw a complete diagnosis, pathologists have to go through a large number of glass slides, often including conventional H&E slides and additional immunohistochemical stains.6 As a result, developing computerized-aided diagnosis (CAD) algorithms for the detection of disease extent from digital pathology images has always been of growing necessity in the field.7,8
As a rapidly expanding field of digital pathology, the technology of whole-slide image (WSI), which can digitize glass slides at high resolution, provides an opportunity for CAD in the field of pathology. Currently, CAD is moving towards the goal of fully automated analysis of WSIs for the detection and grading of cancer. In recent years, with the advent of Graphics Processing Unit (GPU) and Field Programmable Gate Array architectures with massively parallel computing, deep learning has become a powerful tool for segmentation, detection, and classification problems in the field of medical imaging. Gao et al9 proposed to use a combination of CNNs and RNNs for grading nuclear cataracts in slit-lamp images, where CNN filters were pre-trained. Ronneberger et al10 proposed U-net, a new CNN architecture, to solve the biomedical segmentation in medical imaging. Coudray et al11 trained a deep convolutional neural network on WSIs obtained from The Cancer Genome Atlas12,13 to accurately and automatically classify them into lung adenocarcinoma, lung squamous, or normal lung tissue.
Some papers published over the last few years discussed the application of deep learning techniques on breast digital pathology images. Ciresan et al14 were the first to apply convolutional neural networks to the task of mitosis counting for primary breast cancer grading. Wang et al15 later expanded the work on mitosis detection by combining handcrafted features and convolutional neural networks. Han et al16 proposed a class structure-based deep learning model (CSDCNN) to achieve the binary classification and subtype analysis of benign and malignant, which performed outstandingly on the public dataset BreakHis.17 At the Camelyon Grand Challenge 2016 (CAMELYON16)18 held by the International Symposium on Biomedical Imaging (ISBI), a team used a stain standardization algorithm19 in the data pre-processing and used GoogLeNet architecture.20 Ultimately, their deep learning model achieved an area under the receiver operating characteristic curve (AUC) of 0.9935, superior to experts.21 Cruz-Roa et al proposed a new method that employs a convolutional neural network, which had good accuracy and robustness to identify the extent of invasive tumors on digitized images automatically.22 In general, automatic pathological image analysis could potentially save time for pathologists and reduce inter- and intra-observer variability.23,24
However, most of the above studies focused on the binary classification (normal vs tumor or benign vs malignant) of breast cancer. Only a few scholars proceeded on the breast tissue multi-class classification task, which has more clinical research value than the binary classification task. Teresa et al25 published the earliest available literature, which utilized deep learning to study the multi-class classification of digital pathology images of breasts. Their study was based on the Bioimaging Challenge 2015 Breast Histology Dataset, which contains 30 images from different biopsy samples for each of the four classes (normal, benign, in situ carcinoma, and invasive carcinoma). Based on this dataset, a new dataset named BACH26 is derived, in which each of the four classes has 100 images. Depending on the BACH, the International Conference Image Analysis and Recognition 2018 Grand Challenge on BreAst Cancer Histology images (ICIAR2018) was organized, and several works27–29 demonstrated accurate multi-class classification models utilizing deep learning. However, there are only hundreds of images with low pixels in this dataset, and the models trained with this dataset are hard to be generic and cannot fulfill the demand of the clinical application.
In our study, we focused on the task of multi-class classification of breast pathological images, and a new approach combining a deep convolutional neural network as a patch-level classifier and XGBoost as a WSI-level classifier was proposed to automatically classify H&E-stained breast digital pathology images into four classes as normal tissue, benign lesion, ductal carcinoma in situ (DCIS), and invasive carcinoma.
Materials and Methods
A Deep Learning Framework for Multi-Class Classification
In our study, we proposed a deep learning approach designed for the analysis of breast cancer. The research protocol was approved by the Ethics Committee of Peking Union Medical College Hospital (PUMCH). Informed consent was waived because the data are anonymized according to the protocol. All aspects of our research complied with the tenets of the Declaration of Helsinki. Since directly calculating the information of the WSIs will overflow the computer memory, this deep learning framework was divided into two stages.
In the first stage, tissue sections stained by the H&E procedure were firstly digitized into WSIs. Then we extracted the regions of interest (ROIs) from WSIs and performed image cutting on ROIs to get patches. Next, we used a trained CNN to obtain patch-level classification results by entering patches. In the second stage, for each WSI, a heatmap was generated using the classification results of all patches that belong in the WSI. Then, 72 statistical features were extracted from heatmaps at WSI-level to make the final diagnosis through XGBoost,30 achieving the diagnosing accuracy comparable to that from pathologists. A summary of the deep learning framework applied in our study is shown in Figure 1.
 |
Figure 1 The framework of the deep learning approach. Notes: In the training stage, pathologists annotate different regions on WSIs (A), and image cutting is performed on the annotated regions (B) to obtain four types of patches (C). In the test stage, image cutting is performed on the extracted ROIs (D). Furthermore, patch-level classification results can also generate a heatmap (E) for each WSI. |
WSI Acquisition and Label
This study was based on an H&E-stained pathology image dataset authorized by PUMCH, which was composed of uncompressed and labeled WSIs, including 486 cases of paraffin-embedded tissues and 54 cases of frozen sections. All slides were digitalized with KF-pro-400 (Ningbo, China) scanner under the same acquisition condition, with a magnification of 40× (0.2μm/pixel). The size of each WSI was different (eg, 83,956×75,514 pixels), and all WSIs occupied approximately 706GB of memory space in total. A sample WSI is shown in Figure 1A.
Of the 486 paraffin-embedded tissue WSIs, 371 WSIs were used as training and validation data (split as 8:2), and 115 WSIs were used as test data. Fifty-four cases of frozen section WSIs were used as generalizability verification data. The distribution of WSIs divided by use and class is shown in Table 1 in detail.
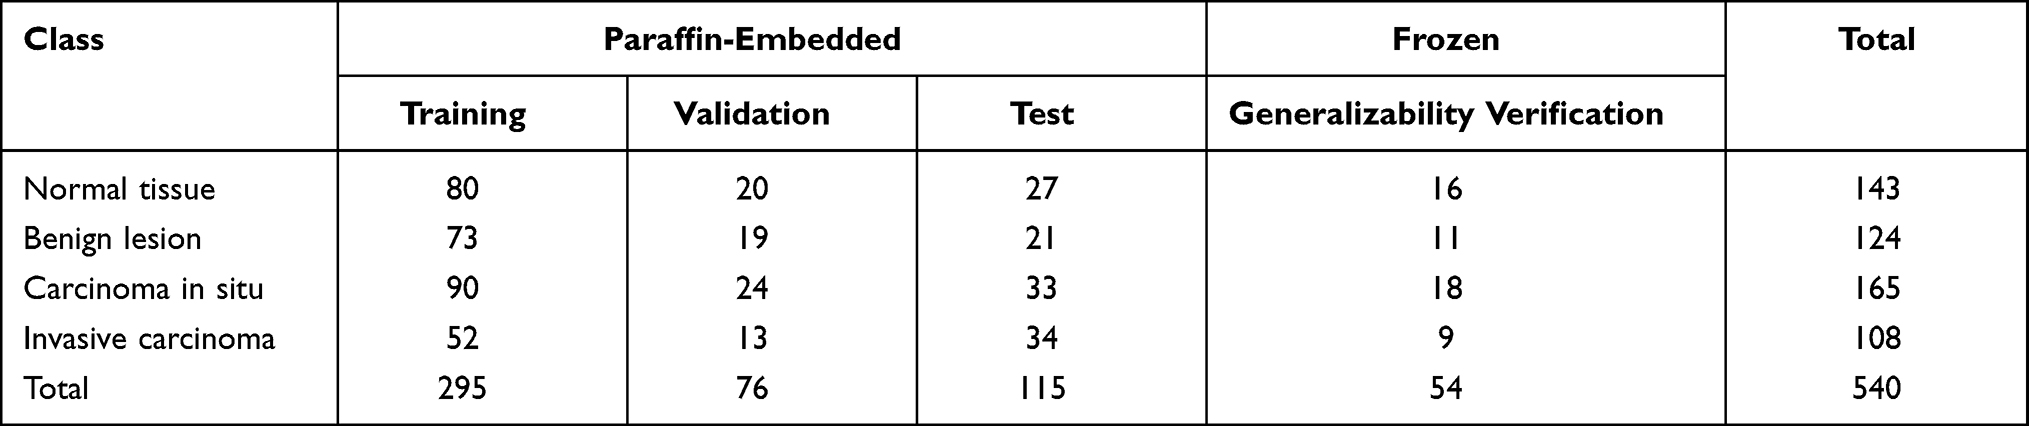 |
Table 1 Distribution of WSIs Authorized by Peking Union Medical College Hospital |
Pathologists Annotation and Image Cutting
After obtaining WSIs, two pathologists used irregular curves of four different colors to encircle the normal tissue, benign lesion (including breast adenosis and fibroadenoma), DCIS, and invasive carcinoma regions, respectively (Figure 1B) on ASAP (an open-source platform for visualization, annotating, and automatic analysis of WSIs). Because WSIs are too large to be analyzed in computer memory directly, image cutting was performed on the annotated regions to get patches. Patches extracted from training WSIs were used to train the patch-level classifier. Validation WSIs were equally divided into two parts, patches extracted from one for validation and the other for testing.
The classification of breast digital pathology images must rely on morphology-related features such as the density and variability of the nucleus. Therefore, the size of patches should make the color and shape of high nuclear density regions, as well as other morphological details, observable. Through experiments, we found that a suitable patch size being 1024×1024 pixels. Since the edges of annotated regions were irregular, for each patch extracted from annotated regions, if 75% of its area was marked as normal, the patch would be labeled normal. The proportions for the other three classes were all 90%.
Finally, we obtained 28,490 patches labeled as normal, and the number of patches of benign lesions, DCIS, and invasive carcinoma was 31,469, 50,638, and 22,447, respectively. The specific distribution of these patches is shown in Table 2, and different types of patches are shown in Figure 1C (Figure 1C (a) to (d) are patches of normal tissue, benign lesion, DCIS, and invasive carcinoma, respectively).
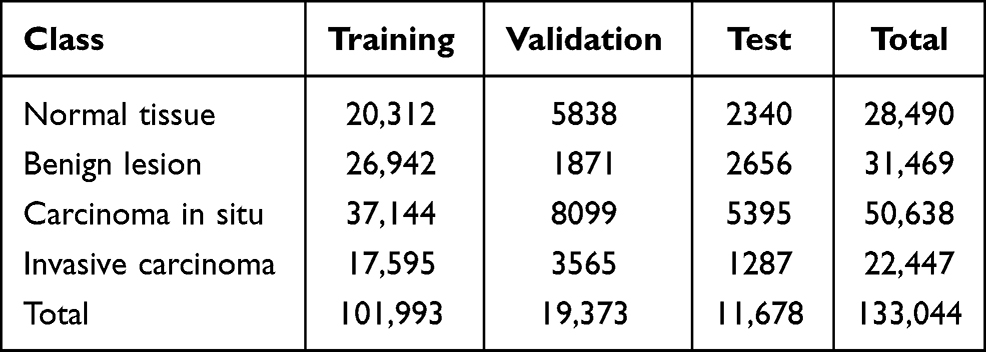 |
Table 2 Distribution of Patches Extracted from the Annotated Regions of WSIs |
ROIs Extraction from WSIs and Image Cutting
In the test stage, patches extracted from the blank background areas would waste computational resources and affect the model accuracy. Therefore, the Otsu method was used to extract the ROIs of WSIs, and image cutting was performed on the ROIs.31 The ROIs of a sample WSI are shown in Figure 1D (regions surrounded by dark red lines).
Since the edges of ROIs were irregular as well, patches extracted from ROIs might contain some background pixels. Thus, for each patch, if the proportion of ROIs pixels was less than 50%, this patch would be excluded. The size of patches was also 1024×1024 pixels.
Data Augmentation
Training an accurate artificial intelligence (AI) model requires a large amount of high-quality data, but reliable data are rare.32 Thus, we performed data augmentation for each patch extracted from annotated regions to generate new patches by rotating or flipping. Each of these new patches was considered to have the same label as the original one because the studied problem was rotation invariant, ie, pathologists can make a diagnosis using breast digital pathology images from different orientations without altering the diagnosis results. Consequently, data augmentation could enlarge the dataset without deteriorating the data quality.25
Using data augmentation, we expected that the model would better fit the validation and test data. The scale of the data augmentation depended on the number of patches in each class. After data augmentation, the number of patches for training, validation, and test was balanced.
Inception V3 as Patch-Level Classifier
In a two-stage model, the patch-level classifier was designed to extract features from patches in the first stage. Here, we selected Inception V3, an open-source CNN model developed by Google,33 as the patch-level classifier. The inception V3 can minimize the number of parameters by factorization so that the extra computing power could be used to deepen the network. Many publications have demonstrated that the Inception module is suitable for pathology tasks,11 such as skin cancer34 and diabetic retinopathy.35
In this research, a full connection layer (1024 neurons) and a softmax layer were added after the basic model of Inception V3. We trained the Inception V3 model on the training dataset from scratch and used this trained model, which has about 25 million parameters, to obtain patch-level classification results from new patches. The network weights were initialized randomly, and an 0.001 learning rate gradient-descent back-propagation algorithm was used for weight update. The selected loss function was categorical cross-entropy. The classifier was trained for 100 epochs, in which we took the set of parameters with the highest accuracy on the validation data as the final parameters of the classifier.
Feature Generation from Results of Patch-Level
For each WSI, we firstly predicted each patch, extracted from the ROIs, by the trained Inception v3 classifier to generate the four predicted probability values being classified into each of the four categories. Then, these predicted patches together were combined into one heatmap (Figure 1E). Areas in red, yellow, and cyan represented invasive carcinoma, DCIS, and benign lesion, respectively, while normal tissue kept the original color. The darker the color, the higher the probability of the patch being classified into this category.
Then we performed post-processing operations based on the patch-level classification results. We extracted 72 statistical features from the heatmap of each WSI, including the total number of patches with a probability (P) greater than threshold belonging to each of the four categories and some statistical features of probabilities belonging to each class, such as mean, variance, standard deviation, median, minimum, maximum, range, and the sum. All features are listed in Table 3.
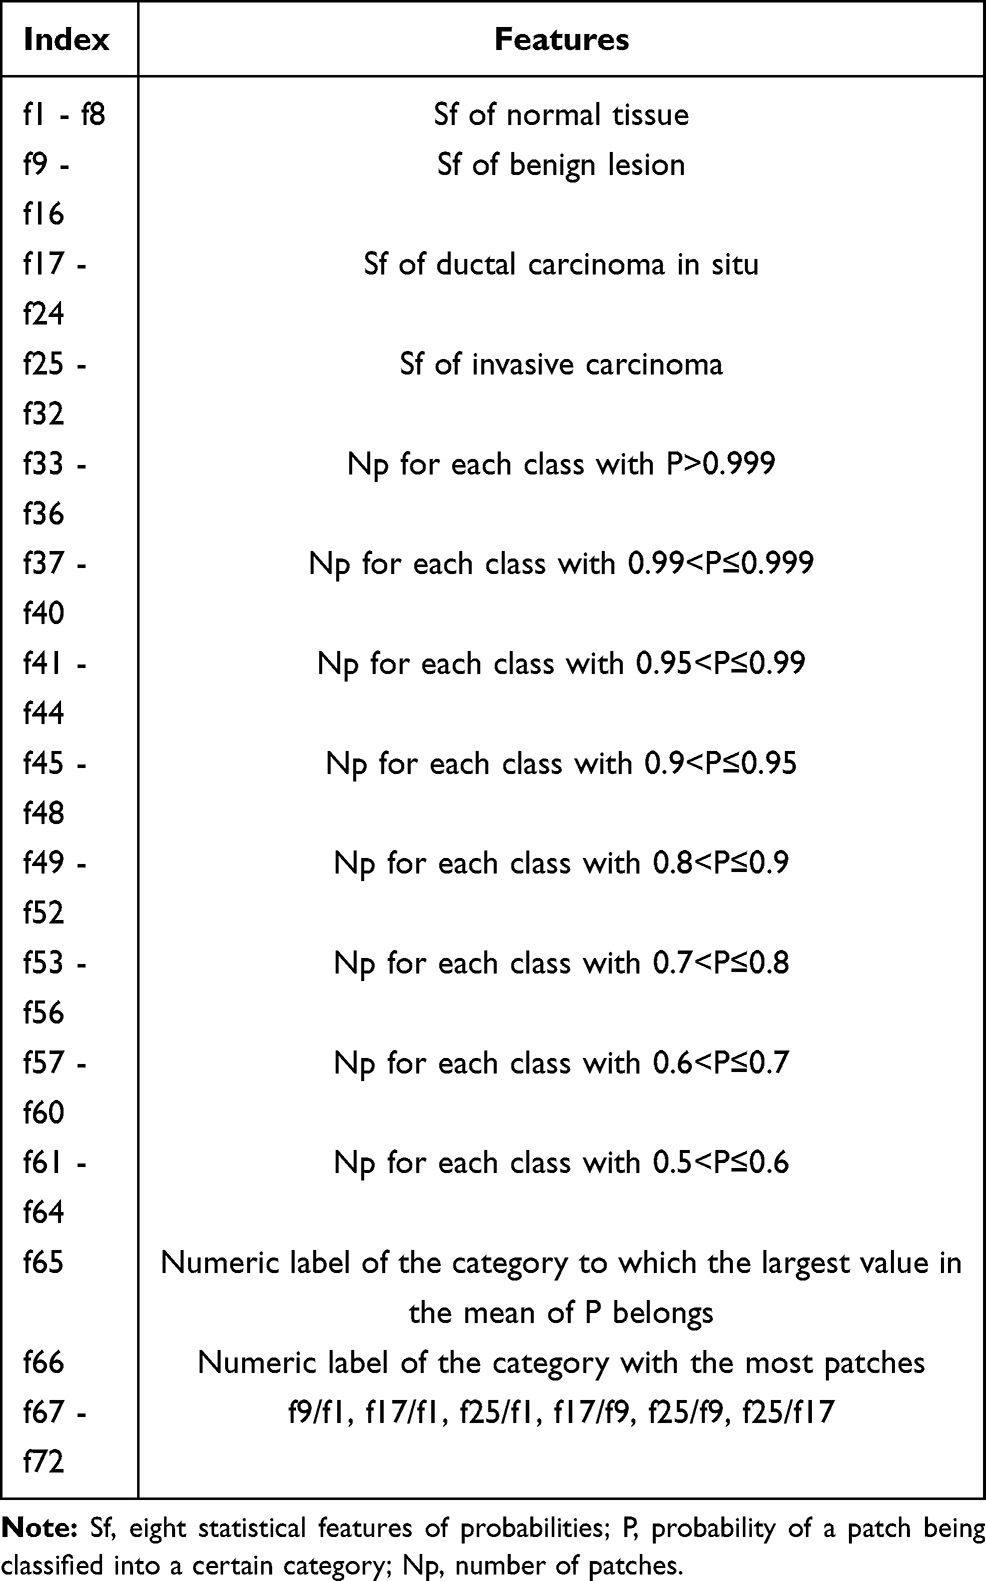 |
Table 3 Features Extracted from Heat Maps of WSIs |
WSI-Level Classifier
After obtaining features of each WSI, we used different machine learning classifiers, including Adaboost, Decision Tree, SVM, Random Forest, Gradient Boosting, LightGBM, and XGBoost, to diagnose WSIs. By comparing the classification accuracy of different classifiers, we finally choose XGboost, which has the highest accuracy, as the WSI-level classifier. XGBoost is an optimized distributed gradient boosting library designed to be highly efficient, flexible, and portable, and the impact of the system has been widely recognized in many machine learning and data mining challenges.
Time Consumption and Result Comparison
The current model framework took about 150 hours for the training stage using one NVIDIA 1080Ti GPU and the TensorFlow36 framework. Moreover, it took about one minute for our trained AI model to diagnose one WSI.
To verify the effect of our model, we invited five pathologists to diagnose each WSI in one minute (same with the time consumption of our AI model) without other clinical information about the patient for reference. Finally, the average diagnostic accuracy of these pathologists was compared with that of the AI model.
Results
Patch-Level Classification
The confusion matrix of the patch-level classifier is shown in Figure 2A, and overall accuracy of 86.67% is achieved. Then, we chose the precision, sensitivity, and ROC to evaluate the performance of the patch-level classifier. Since these evaluation parameters are designed for binary classification problems, we compressed those four categories into two categories by combining three of the four categories and compared them with the left one. The ROC is shown in Figure 2B, and the compression method is shown in Figure 3. All results above are shown in Table 4.
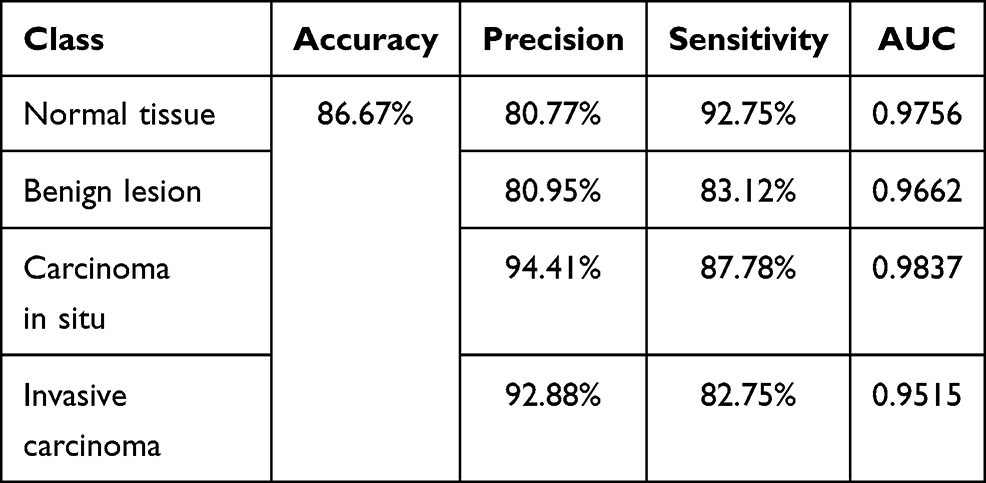 |
Table 4 Classification Effect at Patch-Level |
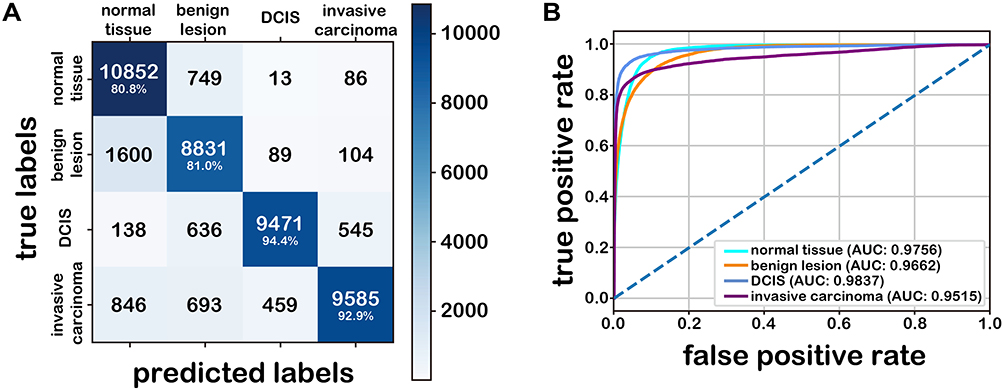 |
Figure 2 Results on the test data at patch-level. Notes: (A): Confusion matrix. The number represents the number of patches. (B): ROC. |
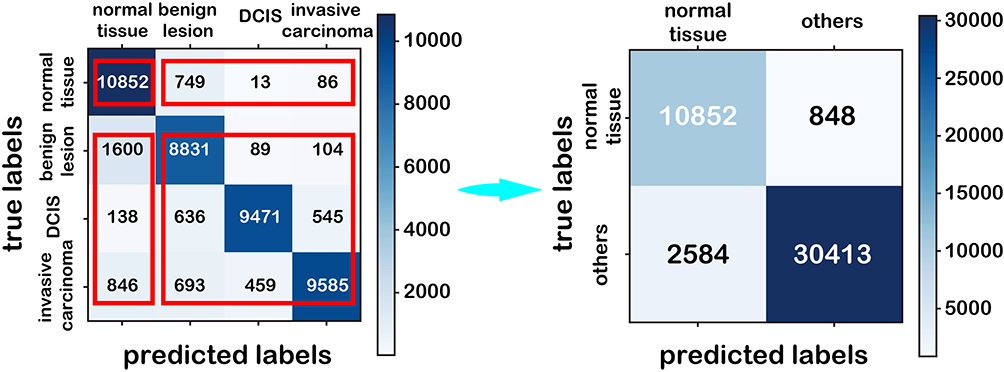 |
Figure 3 The compression method. |
WSI-Level Classification
As shown in the confusion matrix in Figure 4A, the accuracy of the WSI-level classifier on the validation data is 88.16%, and the precision and sensitivity can also be derived with the same compression method. The ROC is shown in Figure 4B, which is also obtained by the same compression method applied at patch-level.
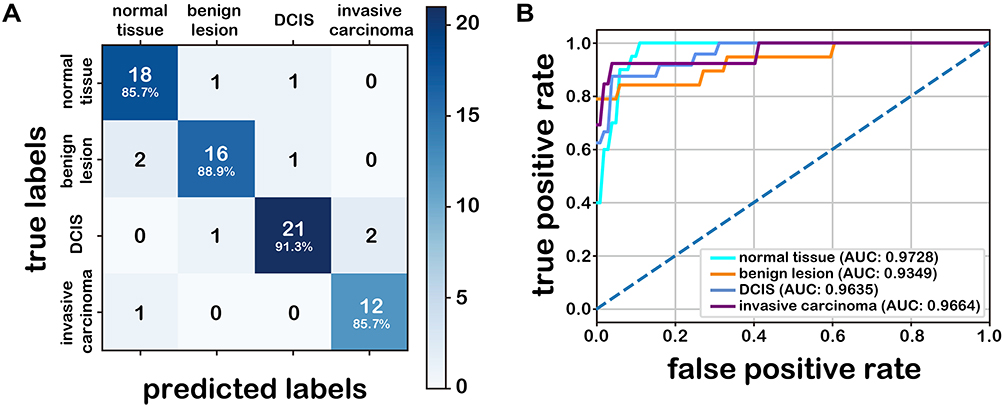 |
Figure 4 Classification results on the validation data at WSI-level. Notes: (A): Confusion matrix. The number represents the number of WSIs. (B): ROC. |
Then, we tested the WSI-level classifier on 115 WSIs. As shown in the confusion matrix (Figure 5A), the accuracy (90.43%) of our model is higher than pathologists (86.09%, the average accuracy of five pathologists). The Kappa coefficient (an evaluation index of confusion matrix consistency)37 is 0.871, demonstrating that the proposed approach is practical. All classification results are shown in Table 5, and the ROC is shown in Figure 5B.
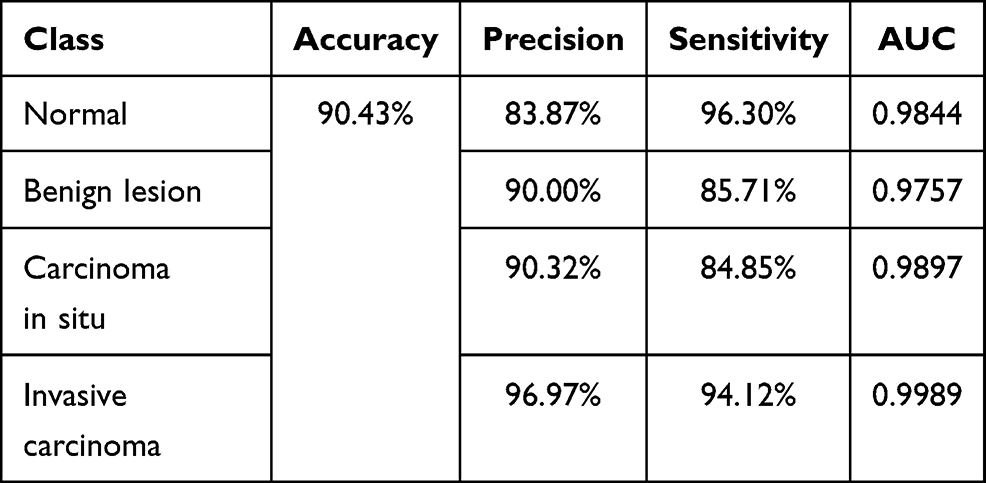 |
Table 5 Classification Effect at WSI-Level on the Test Data |
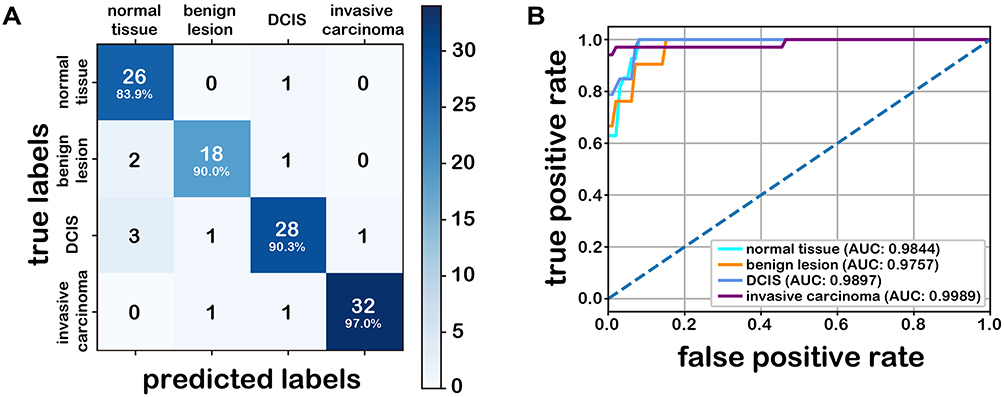 |
Figure 5 Classification results on the test data at WSI-level. Notes: (A): Confusion matrix. The number represents the number of WSIs. (B): ROC. |
The influence of different WSI-level classifiers on the whole model (Table 6) shows that the XGBoost method achieves better results than other methods.
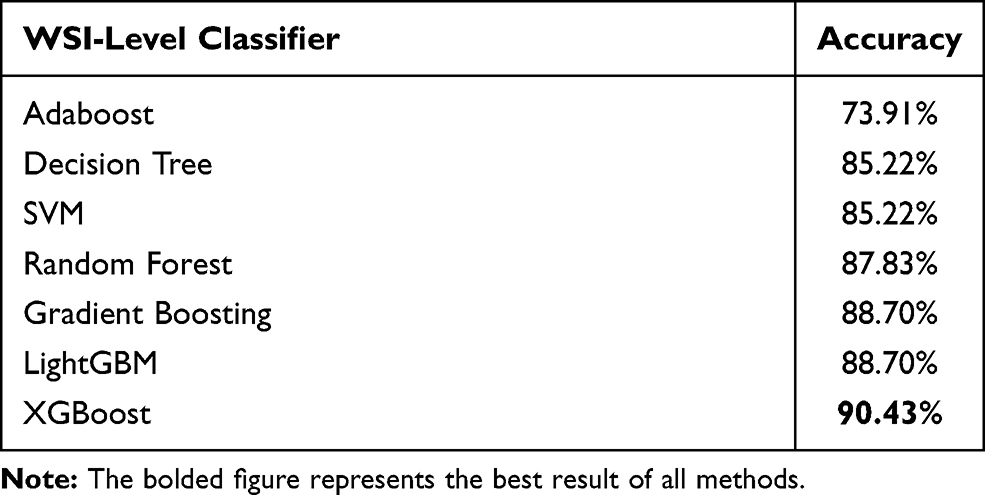 |
Table 6 Comparison of Accuracies with Different WSI-Level Classifiers |
Independent Verification
To verify the robustness of our model, we tested the trained model on two public datasets: BreakHis and BACH. BreakHis is composed of 7909 breast histopathology images with different magnifications.17 The images are divided into two main groups: benign and malignant. Considering the sizes of the images were similar to the size of the patches we extract from WSIs, we regarded these images as patches and applied our patch-level classifier to classify them as non-malignant and malignant. The classification accuracies of different magnifications are listed in Table 7, which are comparable to the related publication.16
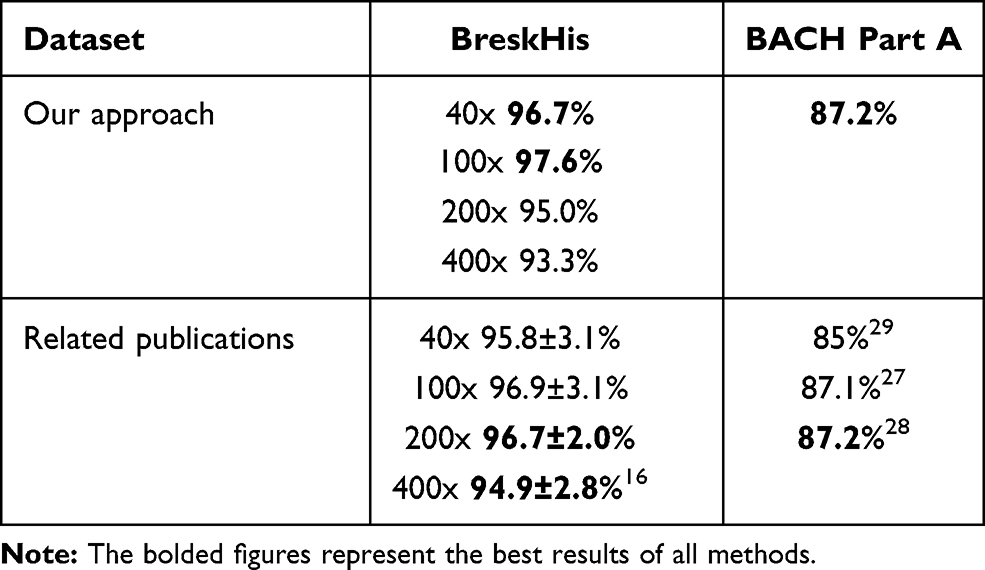 |
Table 7 Results of Independent Verification |
The BACH dataset is composed of part A and part B.26 Part A contains a total of 400 microscopic images, which are labeled as normal, benign, DCIS, or invasive carcinoma. We used our trained model to diagnose these microscopic images. The accuracy is listed in Table 7, which is also comparable to related publications.27 Part B comprises 30 WSIs, 10 of which have been annotated according to the tissues. Then, we used our trained model to diagnose these WSIs and exported their heatmaps. We also plotted the labels given by BACH on the ten annotated WSIs (the color setting is the same as that of the heatmaps generated by our method) to compare them with the heatmaps. As shown in Figure 6, our approach detects the lesion area effectively.
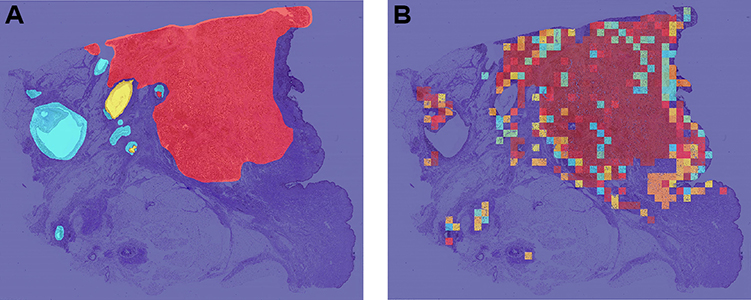 |
Figure 6 Independent verification results. Notes: (A): A sample WSI with the labels given by BACH. (B): The heatmap of the sample WSI in the BACH generated by our method. |
Generalizability Verification
It is worth mentioning that the datasets we used above were all paraffin-embedded tissue WSIs. To verify the generalizability of our model, we tested breast frozen sections based on the current classification model. Paraffin-embedded tissues and frozen section tissues are both stained by H&E, but the images are different because of the different bedding methods. Moreover, the frozen section is considered important in confirming pathologic diagnosis and determining the treatment during the operation in unclear settings.38 Figure 7 shows the results of the frozen section dataset. It can be observed that the methods can achieve high accuracy of 85.19% on classifying multi-class pathology images and 96.30% on classifying non-malignant (normal and benign lesion) vs malignant (ductal carcinoma in situ and invasive carcinoma) pathology images, which is similar to that of paraffin-embedded tissues.
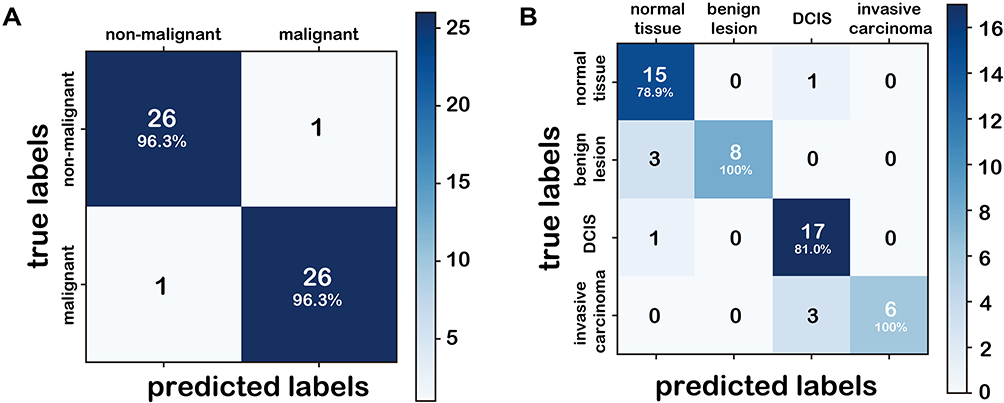 |
Figure 7 Classification results of generalizability verification. Notes: (A): Confusion matrix of binary classification on frozen sections. (B): Confusion matrix of multi-class classification on frozen sections. The number represents the number of WSIs. |
Visualization of Patch Classification Efficiency
Figure 8A shows the two-dimensional representation of patches. Figure 8B is the two-dimensional representation of activations on the second last fully-connected layer of the CNN went through by these patches. In these two figures, 500 patches belonging to each of the four categories were randomly selected from the test data, and each point corresponded to a patch. The 2D distance between points approximated the actual Euclidean distance in the multidimensional space. These representations were derived from the application of t-SNE, which was an efficient parametric embedding technique for dimensionality reduction that preserved the distance between samples.39 Compared with the patches in Figure 8A, patches in Figure 8B of the same category appear to be clustered together, and the difference between patches with different labels is noticeable. These facts indicate that inception V3 in the first step can extract relevant features from the initial data after training. Conclusively, our model is effective in patch-level classification, which lays a solid foundation for the WSI-level classifier.
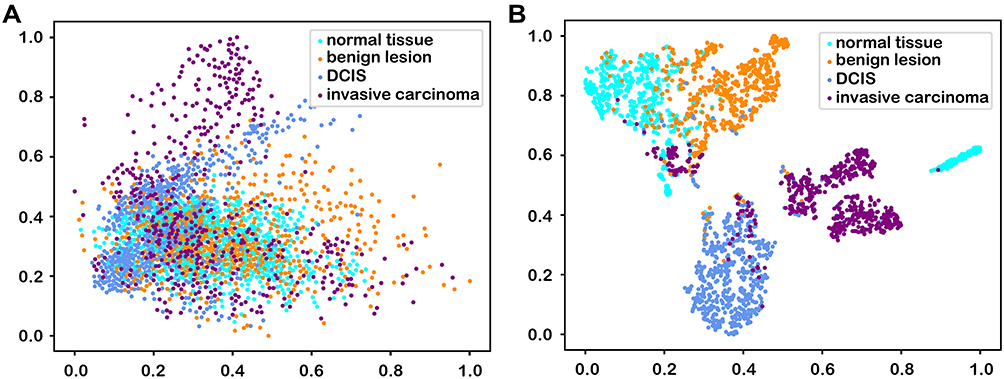 |
Figure 8 The 2D projection of patches. Notes: (A): 2D projection of raw patches. (B): 2D projection of activations on the second last fully connected layer of the CNN of these patches. The horizontal and vertical coordinates are the 2D coordinates normalized by min-max scaling. |
Analysis of Morphological Characteristics of Patches Learned by the Model
To ascertain the morphological characteristics that the inception V3 had seized in patches of different breast tissues, we used gradient-weighted class activation mapping (Grad-CAM)40 to show the patch-level features of different classes. Grad-CAM can indicate the regions that contribute most toward maximizing the predicted probability of that patch belonging to its “true” class. The warmer the color in the heatmap, the higher the possibility the area had to contribute to the prediction and vice versa. As shown in Figure 9, in the Grad-CAM of normal breast tissue (Figure 9A and B), benign lesions (Figure 9C and D), DCIS (Figure 9E and F), and invasive carcinoma (Figure 9G and H), the areas highlighted by the model are approximately as same as lesion areas identified by the pathologist under the light microscope, and these most warm-colored areas also typically reflect the morphological characteristics of the different lesions. For example, in Figure 9D, the area with high prediction probability showed hyperplasia of breast stroma which is the morphological characteristics of breast fibroadenoma, and in Figure 9E and F, the warm-colored area in the patch also showed the non-invasive margin of DCIS.
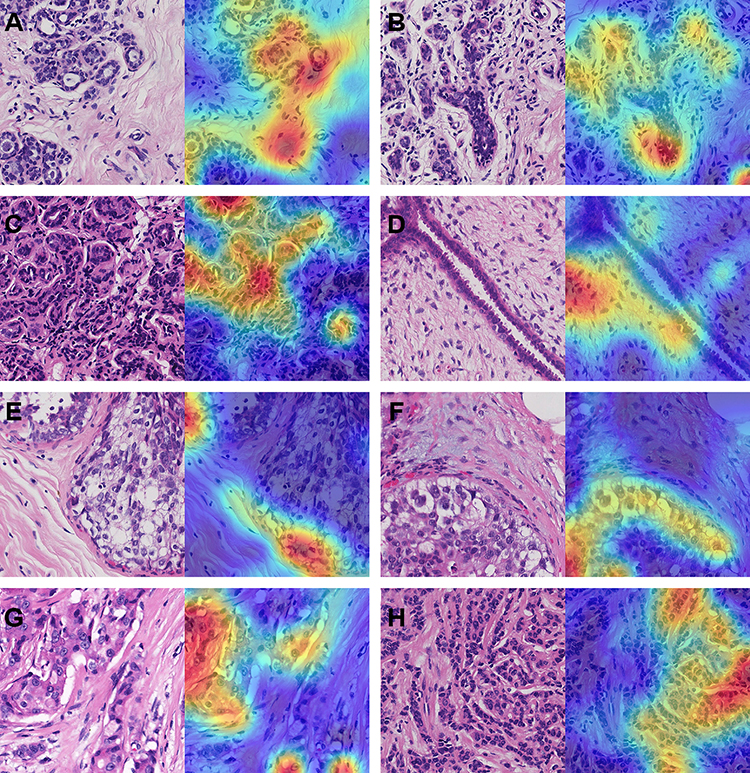 |
Figure 9 Visualization of different breast tissues by Grad-CAM. Notes: (A) and (B) Left: Patches extracted from normal tissue. Right: Grad-CAM presentation for these patches. (C) and (D) Left: Patches extracted from benign lesion. Right: Grad-CAM presentation for these patches. (E) and (F) Left: Patches extracted from carcinoma in situ. Right: Grad-CAM presentation for these patches. (G) and (H) Left: Patches extracted from invasive carcinoma. Right: Grad-CAM presentation for these patches. |
Then we analyzed the misclassification between different lesions by our model. Some patches of normal breast tissue could be mistaken as benign lesions (adenosis), while adenosis may also be misclassified as normal tissue. Some low-grade DCIS may also be mistaken as benign lesions. The misclassification may indicate that different breast lesion types share similar features in focal areas.
Discussion
A two-stage method might be the best solution to WSI diagnosis using the CAD system, limited by the computing power.19,41,42 In the first stage, local features were extracted, and in the second stage, all local information was collected to make the final diagnosis. However, with the development of science and technology, we believe that in the near future, the computing power of computers will be enough to process the whole WSI directly. On the other hand, with the maturity of distributed computing theory, deploying WSI direct diagnosis algorithm to multiple servers may be another way to solve this problem.
The multi-class classification of breast WSIs is far from enough. In the future, we hope to analyze the changes in the morphological features of breast cancer at different stages to reveal the process of breast cancer evolution in the light of the existing detection and classification model. Understanding the evolution of the disease is critical for the prevention and treatment of breast cancer, especially for early diagnosis. Also, the grading of DCIS based on H&E slides remains complex and subjective but important to the prognosis, so we will subsequently explore the grading of DCIS using AI system. Furthermore, subtype analysis of invasive cancer is an essential step of breast cancer diagnoses. Invasive breast cancers include a series of different subtypes, 80–90% of which are non-special breast cancer (known as invasive ductal carcinoma), and the rest are special subtypes. The distinguishing among these special subtypes has important implications on prognosis, as tubular carcinoma of the breast usually has a better prognosis than metaplastic carcinoma and inflammatory breast cancer. Because different cancer subtypes have different morphological characteristics, we believe that AI technology may play a more significant role. Besides, with the development of individualized treatment and the application of targeted medicines, immunohistochemical expression of estrogen receptor (ER), progesterone receptor (PR), and human epidermal growth factor receptor 2 (HER2) in breast cancer are pivotal not only to indicate molecular subtype and prognosis but also to guide the clinical medication. Thus, quantitative interpretation of the immunohistochemical profile is a key factor in making clinical decisions, and a machine learning method is usually advantageous to image quantitation interpretation beyond manual investigation. We hope that our current and future work can play a role in routine tasks and complex cases so that pathologists can focus on higher-level decisions, such as integrating histology and clinical information in order to guide treatment decisions for individual patients.
Conclusion
In this paper, a multi-class classification architecture of breast pathological images based on convolutional neural networks and XGBoost was designed. This approach aimed to detect and classify normal tissue, benign lesion, ductal carcinoma in situ, and invasive carcinoma of the breast. The experimental results demonstrated that our model had good accuracy and was comparable to manual inspection. In summary, this study demonstrated that deep learning could be a potentially feasible tool for assisting pathologists with breast cancer diagnosis.
Acknowledgments
This work was supported by the Foundation of Beijing Municipal Science and Technology Commission (Z181100001918004), Chinese Academy of Medical Sciences (CAMS) Initiative for Innovative Medicine (2017-I2M-1-001) and the National Key Research and Development Program of China (2018YFF0301102 and 2018YFF0301105).
Disclosure
The authors report no conflicts of interest in this work.
References
1. Sung H, Ferlay J, Siegel RL, et al. Global cancer statistics 2020: GLOBOCAN estimates of incidence and mortality worldwide for 36 cancers in 185 countries. CA Cancer J Clin. 2020.
2. Johns LE, Moss SM; Age trial management G. False-positive results in the randomized controlled trial of mammographic screening from age 40 (“age” trial). Cancer Epidemiol Biomark Prev. 2010;19(11):2758–2764. doi:10.1158/1055-9965.EPI-10-0623
3. Nakhleh RE. Error reduction in surgical pathology. Arch Pathol Lab Med. 2006;130(5):630–632. doi:10.5858/2006-130-630-ERISP
4. Raab SS, Grzybicki DM, Janosky JE, et al. Clinical impact and frequency of anatomic pathology errors in cancer diagnoses. Cancer. 2005;104(10):2205–2213. doi:10.1002/cncr.21431
5. Elmore JG, Longton GM, Carney PA, et al. Diagnostic concordance among pathologists interpreting breast biopsy specimens. JAMA. 2015;313(11):1122–1132. doi:10.1001/jama.2015.1405
6. Litjens G, Sanchez CI, Timofeeva N, et al. Deep learning as a tool for increased accuracy and efficiency of histopathological diagnosis. Sci Rep. 2016;6(1):1–11. doi:10.1038/srep26286
7. Ghaznavi F, Evans A, Madabhushi A, Feldman M. Digital imaging in pathology: whole-slide imaging and beyond. Annu Rev Pathol. 2013;8(1):331–359. doi:10.1146/annurev-pathol-011811-120902
8. Gurcan MN, Boucheron LE, Can A, Madabhushi A, Rajpoot NM, Yener B. Histopathological image analysis: a review. IEEE Rev Biomed Eng. 2009;2:147–171. doi:10.1109/RBME.2009.2034865
9. Gao X, Lin S, Wong TY. Automatic feature learning to grade nuclear cataracts based on deep learning. IEEE Trans Biomed Eng. 2015;62(11):2693–2701. doi:10.1109/TBME.2015.2444389
10. Ronneberger O, Fischer P, Brox T U-net: convolutional networks for biomedical image segmentation.
11. Coudray N, Ocampo PS, Sakellaropoulos T, et al. Classification and mutation prediction from non-small cell lung cancer histopathology images using deep learning. Nat Med. 2018;24(10):1559–1567. doi:10.1038/s41591-018-0177-5
12. Cancer Genome Atlas Research Network. Comprehensive genomic characterization defines human glioblastoma genes and core pathways. Nature. 2008;455(7216):1061–1068. doi:10.1038/nature07385
13. Weinstein JN, Collisson EA, Mills GB, et al., Cancer Genome Atlas Research Network. The cancer genome atlas pan-Cancer analysis project. Nat Genet. 2013;45(10):1113–1120. doi:10.1038/ng.2764.
14. Cireşan DC, Giusti A, Gambardella LM, Schmidhuber J Mitosis detection in breast cancer histology images with deep neural networks.
15. Wang H, Cruz-Roa A, Basavanhally A, et al. Mitosis detection in breast cancer pathology images by combining handcrafted and convolutional neural network features. J Med Imag. 2014;1(3):034003. doi:10.1117/1.JMI.1.3.034003
16. Han Z, Wei B, Zheng Y, Yin Y, Li K, Li S. Breast cancer multi-classification from histopathological images with structured deep learning model. Sci Rep. 2017;7(1):4172. doi:10.1038/s41598-017-04075-z
17. Spanhol FA, Oliveira LS, Petitjean C, Heutte L. A dataset for breast cancer histopathological image classification. IEEE Trans Biomed Eng. 2016;63(7):1455–1462. doi:10.1109/TBME.2015.2496264
18. Bejnordi BE, Veta M, Johannes van Diest P, et al. Diagnostic assessment of deep learning algorithms for detection of lymph node metastases in women with breast cancer. JAMA. 2017;318(22):2199–2210. doi:10.1001/jama.2017.14585
19. Bejnordi BE, Litjens G, Timofeeva N, et al. Stain specific standardization of whole-slide histopathological images. IEEE Trans Med Imaging. 2015;35(2):404–415. doi:10.1109/TMI.2015.2476509
20. Szegedy C, Liu W, Jia Y, et al. Going deeper with convolutions.
21. Litjens G, Kooi T, Bejnordi BE, et al. A survey on deep learning in medical image analysis. Med Image Anal. 2017;42:60–88.
22. Cruz-Roa A, Gilmore H, Basavanhally A, et al. Accurate and reproducible invasive breast cancer detection in whole-slide images: a deep learning approach for quantifying tumor extent. Sci Rep. 2017;7(1):46450. doi:10.1038/srep46450
23. Baardwijk AV, Bosmans G, Boersma L, et al. PET-CT-based auto-contouring in non-small-cell lung cancer correlates with pathology and reduces interobserver variability in the delineation of the primary tumor and involved nodal volumes. Int J Radiat Oncol Biol Phys. 2007;68(3):771–778. doi:10.1016/j.ijrobp.2006.12.067
24. Weaver DL, Krag DN, Manna EA, Ashikaga T, Harlow SP, Bauer KD. Comparison of pathologist-detected and automated computer-assisted image analysis detected sentinel lymph node micrometastases in breast cancer. Mod Pathol. 2003;16(11):1159–1163. doi:10.1097/01.MP.0000092952.21794.AD
25. Araujo T, Aresta G, Castro E, et al. Classification of breast cancer histology images using Convolutional Neural Networks. PLoS One. 2017;12(6):e0177544. doi:10.1371/journal.pone.0177544
26. Aresta G, Araujo T, Kwok S, et al. BACH: grand challenge on breast cancer histology images. Med Image Anal. 2019;56:122–139. doi:10.1016/j.media.2019.05.010
27. Cao H, Bernard S, Heutte L, Sabourin R Improve the performance of transfer learning without fine-tuning using dissimilarity-based multi-view learning for breast cancer histology images.
28. Rakhlin A, Shvets A, Iglovikov V, Kalinin AA Deep convolutional neural networks for breast cancer histology image analysis.
29. Wang Z, Dong N, Dai W, Rosario SD, Xing EP Classification of breast cancer histopathological images using convolutional neural networks with hierarchical loss and global pooling.
30. Chen T, Guestrin C XGBoost: a scalable tree boosting system.
31. Otsu N. A threshold selection method from gray-level histograms. IEEE Trans Syst Man Cybern. 1979;9(1):62–66. doi:10.1109/TSMC.1979.4310076
32. Krizhevsky A, Sutskever I, Hinton GE. ImageNet classification with deep convolutional neural networks. Commun ACM. 2017;60(6):84–90. doi:10.1145/3065386
33. Szegedy C, Vanhoucke V, Ioffe S, Shlens J, Wojna Z Rethinking the inception architecture for computer vision.
34. Andre E, Brett K, Roberto AN, et al. Dermatologist-level classification of skin cancer with deep neural networks. Nature. 2017;542(7639):115. doi:10.1038/nature21056
35. Gulshan V, Peng L, Coram M, et al. Development and Validation of a Deep Learning Algorithm for Detection of Diabetic Retinopathy in Retinal Fundus Photographs. JAMA. 2016;316(22):2402–2410. doi:10.1001/jama.2016.17216
36. Abadi M, Barham P, Chen J, et al. TensorFlow: a system for large-scale machine learning.
37. Rosenfield GH, Fitzpatricklins K. A coefficient of agreement as a measure of thematic classification accuracy. Photogramm Eng Remote Sensing. 1986;52(2):223–227.
38. Jaafar H. Intra-operative frozen section consultation: concepts, applications and limitations. Malays J Med Sci. 2006;13(1):4.
39. Lvd M, Hinton G. Visualizing data using t-SNE. J Mach Learn Res. 2008;9(Nov):2579–2605.
40. Selvaraju RR, Cogswell M, Das A, Vedantam R, Parikh D, Batra D. Grad-CAM: visual Explanations from Deep Networks via Gradient-Based Localization. Int J Comput Vis. 2020;128(2):336–359. doi:10.1007/s11263-019-01228-7
41. Kong J, Sertel O, Shimada H, Boyer KL, Saltz JH, Gurcan MN. Computer-aided evaluation of neuroblastoma on whole-slide histology images: classifying grade of neuroblastic differentiation. Pattern Recognit. 2009;42(6):1080–1092. doi:10.1016/j.patcog.2008.10.035
42. Sertel O, Kong J, Shimada H, Catalyurek UV, Saltz JH, Gurcan MN. Computer-aided prognosis of neuroblastoma on whole-slide images: classification of stromal development. Pattern Recognit. 2009;42(6):1093–1103. doi:10.1016/j.patcog.2008.08.027
 © 2021 The Author(s). This work is published and licensed by Dove Medical Press Limited. The
full terms of this license are available at https://www.dovepress.com/terms
and incorporate the Creative Commons Attribution
- Non Commercial (unported, 3.0) License.
By accessing the work you hereby accept the Terms. Non-commercial uses of the work are permitted
without any further permission from Dove Medical Press Limited, provided the work is properly
attributed. For permission for commercial use of this work, please see paragraphs 4.2 and 5 of our Terms.
© 2021 The Author(s). This work is published and licensed by Dove Medical Press Limited. The
full terms of this license are available at https://www.dovepress.com/terms
and incorporate the Creative Commons Attribution
- Non Commercial (unported, 3.0) License.
By accessing the work you hereby accept the Terms. Non-commercial uses of the work are permitted
without any further permission from Dove Medical Press Limited, provided the work is properly
attributed. For permission for commercial use of this work, please see paragraphs 4.2 and 5 of our Terms.