Back to Journals » Nature and Science of Sleep » Volume 15
Decreased Peripapillary and Macular Vascular Densities in Patients with Moderate/Severe Obstructive Sleep Apnea/Hypopnea Syndrome
Authors Lin PW, Lin HC ![]() , Chang CT, Lin MC
, Chang CT, Lin MC ![]() , Friedman M, Salapatas AM
, Friedman M, Salapatas AM
Received 7 August 2022
Accepted for publication 16 November 2022
Published 12 January 2023 Volume 2023:15 Pages 1—12
DOI https://doi.org/10.2147/NSS.S384372
Checked for plagiarism Yes
Review by Single anonymous peer review
Peer reviewer comments 2
Editor who approved publication: Prof. Dr. Ahmed BaHammam
Pei-Wen Lin,1– 3 Hsin-Ching Lin,2– 6 Chun-Tuan Chang,4 Meng-Chih Lin,2,3,7 Michael Friedman,8,9 Anna M Salapatas9
1Division of Glaucoma, Department of Ophthalmology, Kaohsiung Chang Gung Memorial Hospital, Kaohsiung, Taiwan; 2Sleep Center, Kaohsiung Chang Gung Memorial Hospital, Kaohsiung, Taiwan; 3College of Medicine, Chang Gung University, Taoyuan, Taiwan; 4Institute of Healthcare Management, Department of Business Management, National Sun Yat-sen University, Kaohsiung, Taiwan; 5Institute of Biomedical Science, National Sun Yat-sen University, Kaohsiung, Taiwan; 6Department of Otolaryngology, Robotic Surgery Center and Center for Quality Management, Kaohsiung Chang Gung Memorial Hospital, Kaohsiung, Taiwan; 7Division of Pulmonary and Critical Care Medicine, Department of Internal Medicine, Kaohsiung Chang Gung Memorial Hospital, Kaohsiung, Taiwan; 8Department of Otolaryngology, Division of Sleep Surgery, Rush University Medical Center, Chicago, IL, USA; 9Department of Otolaryngology, Advanced Center for Specialty Care, Advocate Illinois Masonic Medical Center, Chicago, IL, USA
Correspondence: Hsin-Ching Lin, Tel +886-7-7317123 ext.2533, Fax +886-7-7313855, Email [email protected]; [email protected]
Purpose: To compare peripapillary and macular vascular densities (PVDs and MVDs) between patients with obstructive sleep apnea/hypopnea syndrome (OSA) and control subjects with symptoms of sleep-related breathing disorders only by swept-source optical coherence tomography angiography (OCTA).
Participants and Methods: In this prospective study, 192 participants underwent a full-night polysomnography to determine OSA severity and subsequently received OCTA measurements as well as AngioTool software analysis.
Results: A total of 146 patients with OSA (51 mild, 43 moderate, 52 severe) and 24 control subjects (apnea/hypopnea index, AHI < 5) were enrolled. PVDs and MVDs in the superficial and choroidal layers were significantly different among the four groups. When participants with simple snoring/mild OSA (AHI < 15) were grouped together and compared with moderate/severe OSA (AHI ≥ 15), PVDs were significantly lower for the latter group in the superficial layer (p = 0.0003), deep layer (p = 0.004), and choroidal layer (p = 0.003). MVDs were also lower for the moderate/severe OSA group in the superficial (p = 0.012) and choroidal layer (p = 0.004). Negative correlations were identified between AHI and PVDs in the superficial layer (ρ = − 0.257, p = 0.0007), deep layer (ρ = − 0.197, p = 0.0102) and choroidal layer (ρ = − 0.220, p = 0.0039) and between AHI and MVDs in the superficial layer (ρ = − 0.199, p = 0.0094) and choroid layer (ρ = − 0.186, p = 0.0152).
Conclusion: PVDs and MVDs were significantly lower in patients with moderate/severe OSA as compared to subjects with simple snoring/mild OSA. Furthermore, decreased PVDs and MVDs significantly correlated with OSA severity.
Keywords: peripapillary vascular density, macular vascular density, peripapillary retinal nerve fiber layer, swept-source optical coherence tomography angiography, snoring, obstructive sleep apnea/hypopnea syndrome
Introduction
Patients with obstructive sleep apnea/hypopnea syndrome (OSA) commonly present with disruptive snoring, nocturnal hypoxemia, morning headache and excessive daytime sleepiness, etc. Untreated OSA is reported to be an independent risk factor for hypertension, cardiovascular disorders, stroke, and even sudden death.1–5The ocular presentations in OSA patients include floppy eyelid syndrome, papilledema, non-arteritic anterior ischemic optic neuropathy, and glaucoma.6–12The obstructive respiratory disturbances in OSA patients can lead to severe hypoxia and hypercapnia, which may compromise optic nerve head perfusion and oxygenation and result in thinning of retinal nerve fiber layer and macular layer.13,14
The ocular blood supply is mainly from the central retinal artery and ciliary arteries, which originate from ophthalmic artery. The choroidal circulation is mainly controlled by sympathetic innervation and is not autoregulated. Conversely, the retinal circulation does not have autonomic innervations and autoregulation is crucial for retinal blood supply.15,16 Intermittent hypoxia in patients with OSA may cause hemodynamic changes in the retinal and choroidal microcirculation.16
Optical coherence tomography angiography (OCTA) is an emerging technology that provides noninvasive, dye-free, and high-resolution imaging of the vasculature in the retina, choroid, and optic disc region. Previous studies evaluated the retinal vascular densities in OSA patients with spectral-domain OCTA (SD-OCTA) at a center wavelength of 840 nm. Swept-source OCTA (SS-OCTA) system use a longer wavelength (1050 nm) which allows 200 um deeper penetration below the retinal pigment epithelium with better detection of signals from the choroidal layer than SD-OCTA. Besides, SS-OCTA has faster scanning speed which allows for denser scan patterns and larger scan areas compared with SD-OCTA scan for a given acquisition time. SS-OCTA significantly improves the visualization of the retinal pigment epithelium, choriocapillaris, and choroidal layers.17,18
To the best of our knowledge, there are no OSA-related reports on ophthalmic microstructures, especially in the field of choroid, investigated with SS-OCTA system, despite the advancements of OCT. In this study, we aimed to compare peripapillary and macular vascular densities (PVDs and MVDs) in the retinal and choroidal layers between different severities of OSA and normal control subjects by SS-OCTA and further determine whether the correlations between OCTA variables and OSA severities exist.
Methods
This prospective study was approved by the Institutional Review Board and Ethics Committee of the Chang Gung Memorial Hospital, Taiwan (CGMH IRB: 201901741A3), and was performed according to the principles outlined in the Declaration of Helsinki. Informed consent was obtained from all participants. The study hospital, Kaohsiung Chang Gung Memorial Hospital (KCGMH), is an academic medical center and a tertiary referral hospital that serves an area with the population of 3.2 million in southern Taiwan.
Subjects
Patients presenting with symptoms of sleep-related breathing disorders, such as habitual loud snoring, observed apnea during sleep, or excessive daytime sleepiness, etc. were consecutively admitted for a full-night polysomnography (PSG) at the Sleep Center of the KCGMH. The patients were subsequently referred for a comprehensive ophthalmological examination at the ophthalmologic clinic of the KCGMH.
Sleep Study (Polysomnography, PSG)
The study procedure was performed identically as in our previous studies11,14 Apnea/hypopnea index (AHI; /h) was defined as the total number of apneas and hypopneas per hour of electroencephalographic sleep. OSA is defined as an AHI > 5. Subjects with an AHI between 5 and 15 are classified as mild OSA, an AHI between 15 and 30 is classified as moderate OSA, and an AHI > 30 is classified as severe OSA.19 All PSGs were scored and read by a board-certified physician who was unaware of the study and, therefore, blinded to the patients’ participation in the study.
Ophthalmologic Examination
At the time of the ophthalmologic exam, the PSG data were unknown to the patients and the examiner. To be included, subjects had to have a best-corrected visual acuity of 20/40 or better, spherical refraction within ± 8.0 diopters, and cylinder correction within ± 3.0 diopters. Patients who had a history of stroke with central apnea, presence of any other sleep disorders, chronic uveitis, glaucoma, non-glaucomatous optic neuropathy, macular lesions, and previous ocular trauma or surgeries were excluded from this study.
All patients received ophthalmologic evaluation, including best-corrected visual acuity, non-contact tonometry, slit-lamp biomicroscopy, fundoscopy, standard automated perimetry (SAP), spectral-domain optical coherence tomography (OCT), and swept-source OCTA. SAP was performed by Swedish Interactive Threshold Algorithm standard 24–2 with a Humphrey Visual Field Analyzer (Carl Zeiss Meditec Inc., Dublin, California). Unreliable SAP tests with fixation loss >20%, false positives, or false negatives >15% were excluded. OCT was performed with the Spectralis OCT (software version 6.9.5) (Heidelberg Engineering, Dossenheim Heidelberg, Germany). The OCT parameters, including global retinal nerve fiber layer (RNFL) thickness and average RNFL thickness in four quadrants were generated automatically in the analysis reports. For assessment of retinal thickness in the macular area, the Posterior Pole Asymmetry Analysis (Heidelberg Engineering, Dossenheim, Germany) scan was used to measure an 8×8 grid at the macular area. The superior retinal thickness, inferior retinal thickness, and average retinal thickness in the macular area were automatically generated in the report. Only image quality of at least 20 was used for this study.
Each eye was then dilated with 1% tropicamide eye drop and scanned by an experienced operator. PVDs and MVDs were assessed by SS-OCTA (PLEX Elite 9000, Carl Zeiss Meditec, Inc. Dublin, CA, USA). This SS-OCTA device operates at a central wavelength of 1050 nm and a speed of rate of 100,000A-scans/second. Peripapillary and macular OCTA scans 6 mm x6mm centered on the optic nerve head and the fovea were acquired. A fully automated retinal layer segmentation algorithm was applied to 3-dimensional structural OCT data in order to segment the inner limiting membrane and the outer boundary of the inner plexiform layer as superficial retinal layer, to segment the outer boundary of inner plexiform layer and the outer boundary of the outer plexiform layer as deep retinal layer. The choriocapillary layer was segmented as 29–49 um below the retinal pigment epithelium, and the choroid layer was segmented as 64–115 um below the retinal pigment epithelium. The segmentation results were then applied to OCTA flow intensity data to obtain vascular images. Maximum projection analyses of the flow intensity were performed to generate vascular plexuses of superficial layer, deep layer, choriocapillary layer, and choroidal layer for the peripapillary and macular scans. Images of OCTA with artifacts, including eye movement, defocus, shadow, decentration, and blink in the superficial vascular layer were excluded. Only signal strength of at least 9 was used for this study.
All OCTA images were further quantitatively analyzed by the AngioTool software Version 0.6a (https://angiotool.software.informer.com/). AngioTool is an open-source software for quantitative analysis of angiogenesis. It provides quick, hands-off and reproducible quantification of vascular networks in microscopic images. AngioTool graphical user interface contains a top row with buttons and two tabs containing controls to run analysis and to customize the numeric and graphical output. The basic analysis flow implemented by AngioTool includes segmentation, skeletonization, and analysis of the vasculature (Figure 1; the OCTA images of a 46-year-old male patient with an AHI of 31.2). It computes several morphological and spatial parameters including the area covered by a vascular network, the number of vessels, vessel length, vascular density, and lacunarity.20 Vascular density was defined by the percentage of area occupied by vessels. The PVDs and MVDs at superficial, deep, choriocapillary and choroid layers were analyzed, calculated and compared among normal control subjects and different severities of OSA patients.
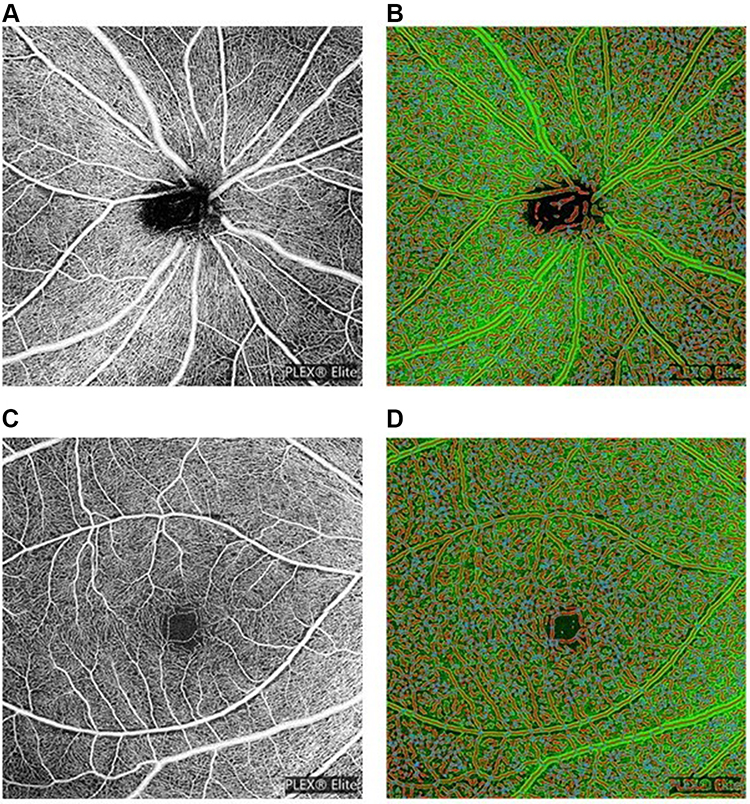 |
Figure 1 (A) Peripapillary scan in the superficial layer. (B) The resulting images of peripapillary scan in superficial layer after AngioTool analysis. (C) Macular scan in the superficial layer. (D) The resulting images of macular scan in superficial layer after AngioTool analysis. |
Statistical Analysis
All analyses were performed using MedCalc® Statistical Software version 20.027 (MedCalc Software Ltd, Ostend, Belgium). Continuous data were compared among four groups using Kruskal–Wallis test and expressed as median (interquartile range). Categorical variables were compared using Chi-square test and expressed as numbers. To determine whether the severity of OSA had effect on vascular densities, we divided the patients into two groups: those without OSA or with mild OSA (AHI <15) and those with moderate/severe OSA (AHI ≥15). Continuous data between two groups were compared using Mann–Whitney test, while categorical data were compared using Chi-square test. Correlations between PSG variables and vascular densities, and between PSG variables and OCT parameters were assessed using Spearman’s rank correlation coefficient. One eye per patient was randomly selected for analysis. All statistical tests were two-sided. A p value <0.05 was considered as significance.
Results
One hundred and ninety-two participants underwent PSG and ophthalmologic examinations were consecutively enrolled. Three patients with maculopathy, six with spherical refraction less than −8 diopters, four with previous refractive surgeries, two with previous cataract surgery, and three with glaucoma under medication treatment were excluded. Four participants with artifacts of OCTA images were also excluded. Finally, a total of 170 participants were enrolled in the study.
Of the 170 subjects, 24 subjects (with symptoms of sleep-related breathing disorders and an AHI < 5) were diagnosed as no OSA and were grouping as control (simple snorer), and 146 subjects were diagnosed as OSA with an AHI ≥ 5 (51 mild OSA, 43 moderate OSA, and 52 severe OSA). The AHI (p < 0.0001), lowest saturation of oxygen (LSaO2, %) (p < 0.0001), and oxygen desaturation index (ODI, /hr.) (p < 0.0001) were significantly different among the four groups. The major PSG data are shown in Table 1.
 |
Table 1 Demographic Data of All Participants Grouped According to the Apnea/Hypopnea Index (AHI, /hr.) |
Based on OCT data for peripapillary RNFL thickness evaluation, significant differences in global and inferior quadrant were observed among four groups (p = 0.042 and 0.006, respectively). Regarding the PVDs, there were significant differences in the superficial layer (p = 0.002), deep layer (p=0.030), and choroidal layer (p=0.018) among four groups. Regarding the MVDs, there were significant differences in the superficial layer (p = 0.019) and choroidal layer (p=0.007) among the four groups. The data are shown in Table 2.
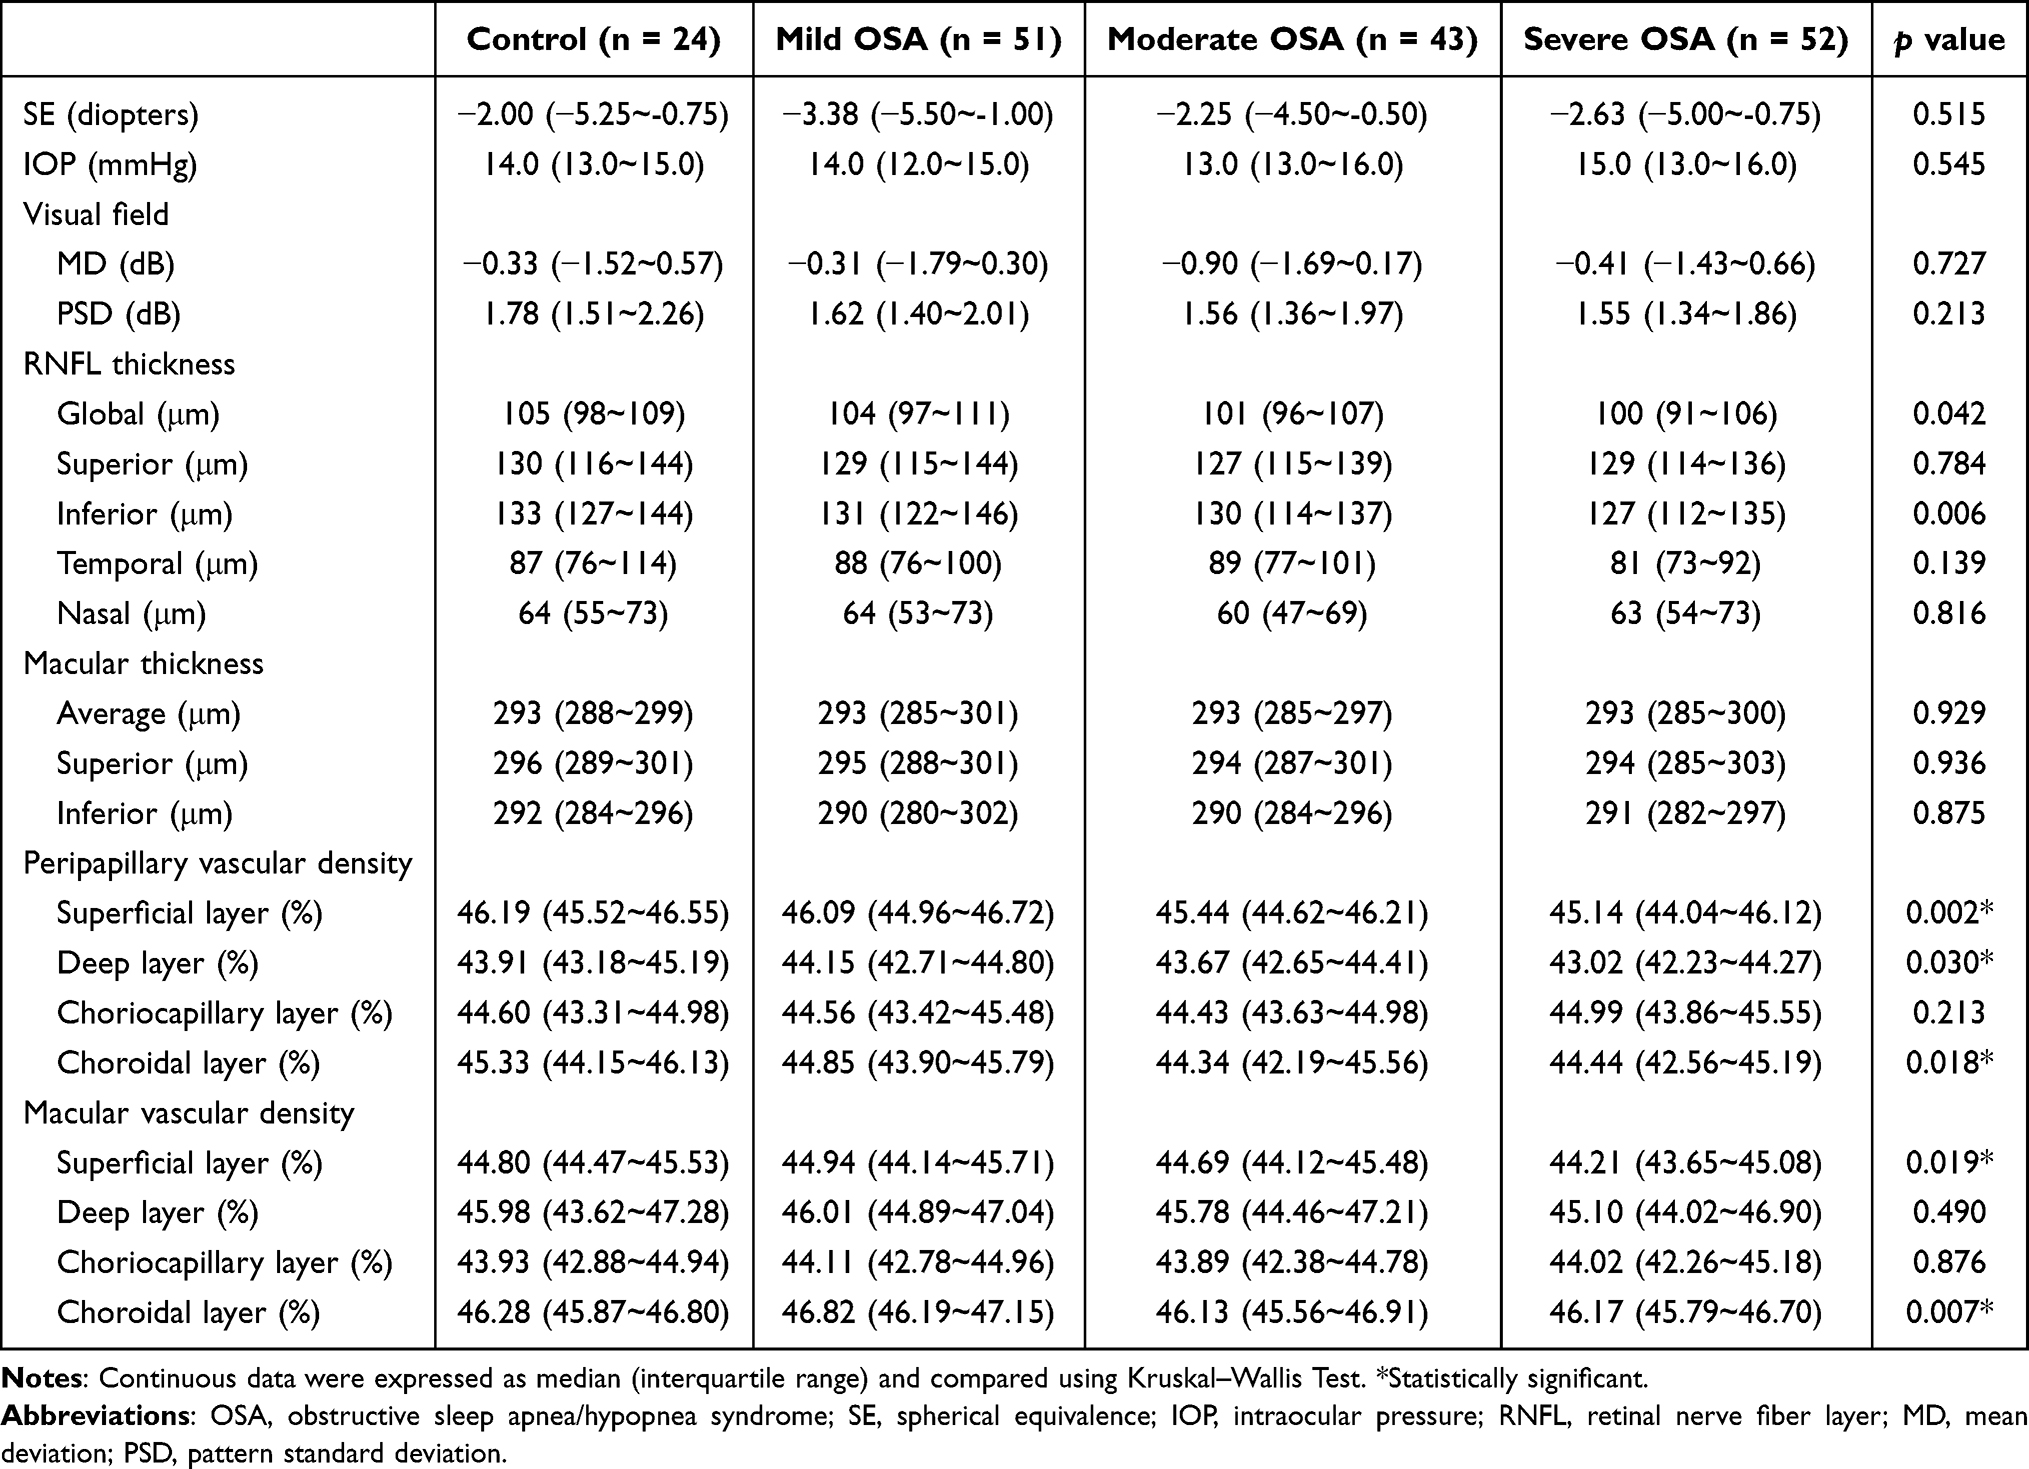 |
Table 2 Ophthalmologic Examination Data of All Participants Grouped According to the Apnea/Hypopnea Index (AHI, /hr) |
To determine whether OSA severity had some effects on OCTA variables, all participants were further divided into two groups: normal/mild OSA with an AHI < 15, and moderate/severe OSA with an AHI ≥ 15. The differences of major PSG parameters between these two groups are shown in Table 3. Based on OCT data for peripapillary RNFL thickness evaluation, significant differences in global and inferior quadrant were observed (p = 0.010 and 0.002, respectively). Regarding the PVDs, there were significant differences in the superficial layer (p = 0.0003), deep layer (p = 0.004), and choroidal layer (p = 0.003) between normal/mild OSA and moderate/severe OSA groups. Regarding the MVDs, there were significant differences in the superficial layer (p = 0.012) and choroidal layer (p = 0.004) between both groups. The data are shown in Table 4 and Figure 2. Figure 2 shows the box plots of vascular densities.
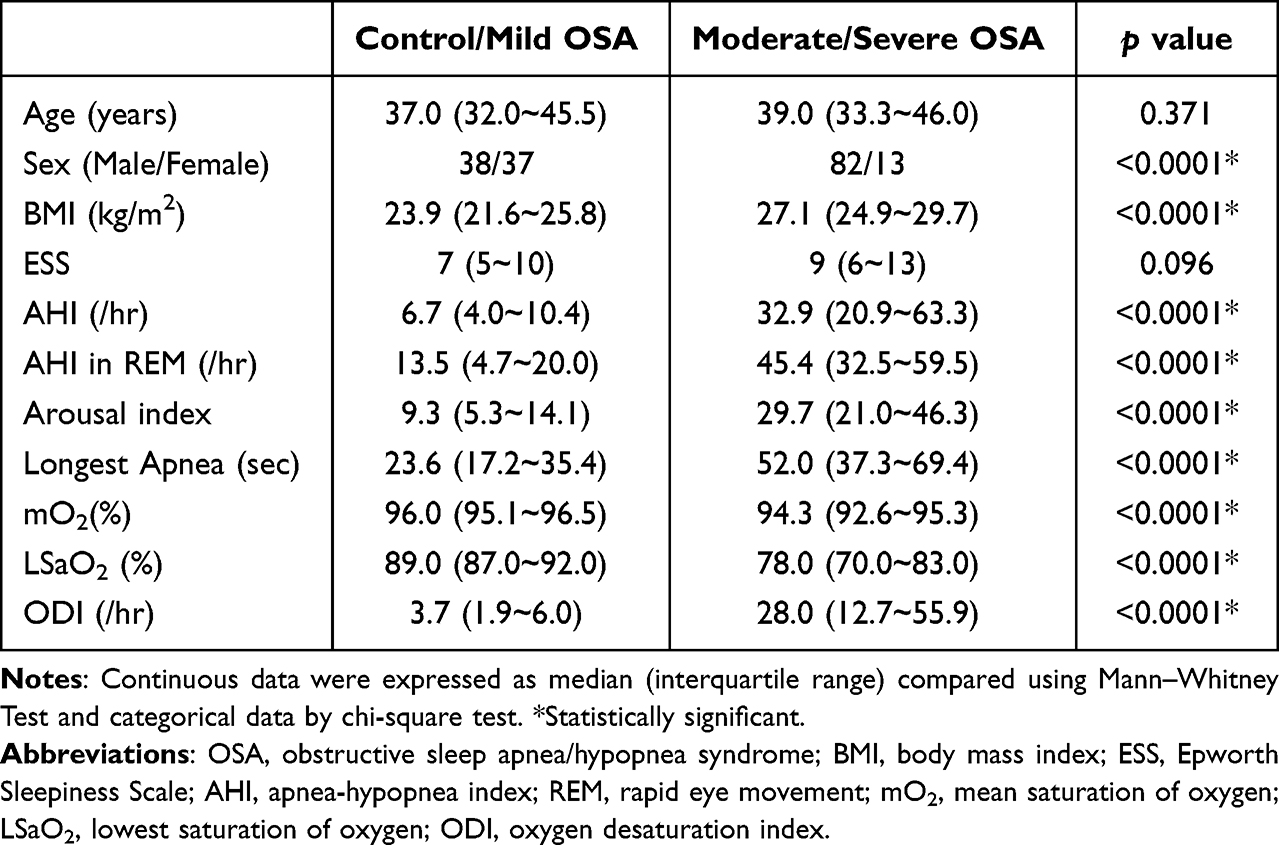 |
Table 3 Comparison of Polysomnographic Data Between Normal/Mild OSA (AHI < 15; N = 75) and Moderate/Severe OSA Patients (AHI ≥ 15; N = 95) |
 |
Table 4 Comparison of Ophthalmologic Examinations Between Normal/Mild OSA (AHI < 15; N = 75) and Moderate/Severe OSA Patients (AHI ≥ 15; N = 95) |
 |
Figure 2 (A) peripapillary vascular densities, superficial layer. (B) peripapillary vascular densities, choroidal layer. (C) macular vascular densities, superficial layer. (D) macular vascular densities, choroidal layer. |
In addition, Spearman’s rank correlation coefficients were used to determine the correlation between PSG variables and OCTA variables among the participants. The PVDs in the superficial layer, deep layer, and choroidal layer negatively correlated with AHI (ρ = −0.257, p = 0.0007; ρ = −0.197, p = 0.0102 and ρ = −0.220, p = 0.0039, respectively). The PVDs in the superficial layer and deep layer positively correlated with LSaO2 (ρ= 0.314, p < 0.0001 and ρ = 0.230, p = 0.0028, respectively). Besides, the MVDs in the superficial layer and choroidal layer negatively correlated with AHI (ρ = −0.199, p=0.0094 and ρ = −0.186, p = 0.0152, respectively). The MVDs in the superficial layer also positively correlated with LSaO2 (ρ = 0.245, p = 0.0014). Regarding the correlations between PSG variables and OCT parameters, the global peripapillary RNFL thickness negatively correlated with AHI and ODI (ρ = −0.214, p = 0.0054 and ρ = −0.188, p = 0.0158, respectively). These results are shown in Table 5 and Figure 3.
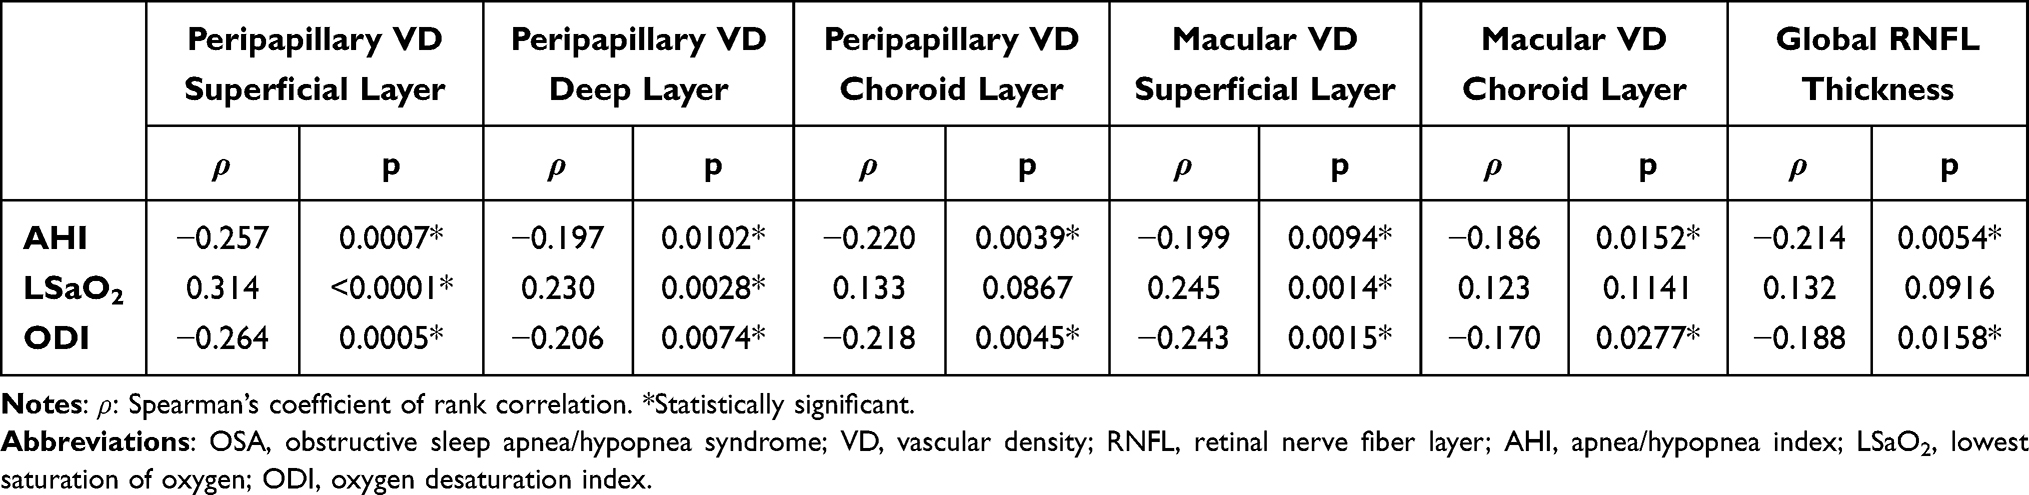 |
Table 5 Rank Correlation (ρ) Between Polysomnographic Variables and Ophthalmologic Variables in All Participants |
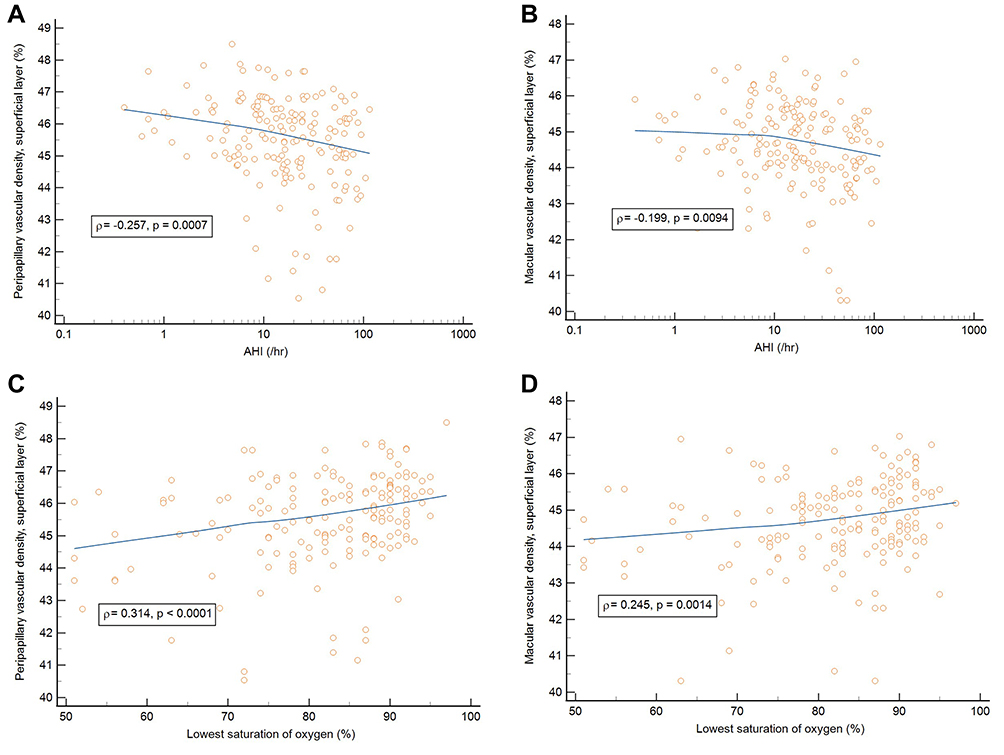 |
Figure 3 (A) Correlation between peripapillary vascular density in the superficial layer and AHI. (B) Correlation between macular vascular density in the superficial layer and AHI. (C) Correlation between peripapillary vascular density in the superficial layer and LSaO2. (D) Correlation between macular vascular density in the superficial layer and LSaO2. Abbreviations: AHI, apnea/hypopnea index (/hr.); LSaO2, lowest saturation of oxygen (%). |
The PVDs at superficial and deep layers positively correlated with the global peripapillary RNFL thickness (ρ = 0.322, p < 0.0001 and ρ = 0.289, p = 0.0002, respectively). The MVDs in the superficial and deep layers also positively correlated with the macular thickness (ρ = 0.246, p = 0.0014 and ρ = 0.214, p = 0.0054, respectively).
Discussion
Repeated upper airway obstructions during sleep in OSA patients can cause repetitive episodes of hypoxia and reoxygenation, which could induce inflammation, oxidative stress, and cellular apoptosis and further impair endothelial function as well as repairing capacity of endothelium in OSA patients.21–26 Moreover, excessive platelet activation and altered coagulation homeostasis were observed in OSA patients.27 Endothelial dysfunction and altered coagulation homeostasis in OSA patients can increase vascular resistance, decrease blood flow, and compromise the microcirculations of the retina, choroid, and optic nerve. In the present study, we found that the global peripapillary RNFL thickness and peripapillary RNFL thickness in the inferior quadrant were significantly lower in the moderate/severe OSA group than in the normal/mild OSA group. We firstly used SS-OCTA to evaluate retinal and choroidal vasculature in more detail, and noted that the PVDs in the superficial, deep, and choroidal layers were significantly decreased in the moderate/severe OSA group. MVDs in the superficial and choroidal layer were also significantly decreased in the moderate/severe OSA group.
The radial peripapillary capillary plexuses (RPCP) run in parallel with the RNFL axon and supply the RNFL bundles. Ucak et al reported that the vascular density of RPCP was decreased in patients with moderate and severe OSA.28 Yu et al also found that the vascular density of RPCP was decreased in moderate and severe OSA patients.29 Cai et al noted that the mild-to-moderate OSA patients had a significantly lower vascular density in the RPCP.30 In our study, we also found that the PVDs in the superficial, deep, and choroidal layers were significantly decreased in patients with moderate/severe OSA. Conversely, Moyal et al did not find significant difference in the vascular density of RPCP between normal and OSA groups.31 In their study, they measured RPCP by optic disc cubes software with an area of 3×3 mm, which might be too small to find significant differences between the normal and OSA groups. However, they found the vascular density in the inferior RPCP was significantly decreased in desaturating OSA patients. Autonomic innervations are not seen in retinal blood vessels, so effective autoregulation is crucial for retinal circulation.15 Recurrent episodes of oxygen desaturation in OSA patients lead to hypoxemia and tissue hypoxia, which can cause oxidative stress with free radical formation, and result in endothelial dysfunction.24,25 Endothelial dysfunction can further impair retinal autoregulation, increase vascular resistance, diminish blood flow, and decrease vascular densities in the retina.
In our previous study, we found that the average peripapillary RNFL thickness and superior peripapillary RNFL thickness were significantly lower in the severe OSA group than in the normal and mild OSA groups. The peripapillary RNFL thickness in the superior, inferior, and temporal quadrants was lower in patients with moderate/severe OSA than in normal/mild OSA patients.14 In this study, we noted that the global peripapillary RNFL thickness and inferior peripapillary RNFL thickness were significantly lower in the severe OSA group than in the normal and mild OSA groups. The global peripapillary RNFL thickness and inferior peripapillary RNFL thickness were also lower in the moderate/severe OSA group than in the normal/mild OSA group. Moreover, the global peripapillary RNFL thickness and the PVDs at superficial and deep layers negatively correlated with AHI and ODI. Intermittent apnea causes hypoxia and reoxygenation, which can induce oxidative stress and inflammation, decrease production and availability of nitric oxide, and result in endothelial dysfunction and atherosclerosis.24,25 Endothelial dysfunction and atherosclerosis can reduce the diameter of blood vessels, increase vascular resistance and affect retinal vasoreactivity, which may further decrease retinal vascular densities, reduce retinal microcirculation, and result in axonal degeneration with subsequent RNFL thinning in OSA patients.
The arterial circulation to the inner retina consists of superficial and deep vascular plexuses which are derived from the branches of central retinal artery. Previous studies showed that OSA patients had decreased MVDs. In 2020, Ucak et al noted that the superficial and deep vascular densities in the parafoveal area (3 x 3 mm2) decreased with the OSA severities.28 Yu et al reported that severe OSA patients had significantly lower vascular density in the parafoveal area than normal-to-mild OSA patients.29 Colak et al found that the vascular density of deep capillary plexus in the parafoveal region significantly decreased in OSA patients.32 In the present study, we measured the macular area 6×6 mm2 and found the MVD in the superficial layer was significantly decreased in the moderate/severe OSA group. Besides, the MVD at superficial layer negatively correlated with AHI and ODI. Intermittent hypoxia during sleep in OSA patients can cause higher plasma levels of epinephrine and cortisol. The reduction of MVD can be associated with vasoconstriction or loss of retinal vessels secondary to adrenocortical overactivation.33
The choroid is a highly vascularized tissue which offers 85% of intraocular blood flow.15 The choroidal circulation is controlled mainly by sympathetic innervation and is not autoregulated. The lack of autoregulation makes the choroidal circulation dependent on the ocular perfusion pressure.15,16 In this study, we prospectively used SS-OCTA to yield better detection of choroidal vessels and found both PVDs and MVDs in the choroidal layers were decreased in the moderate/severe OSA patients. Previous studies showed that the OSA patients had thinner choroidal thickness than normal subjects.34–36 The choroid is comprised of abundant blood vessels and the choroidal tissue is susceptible to hypoxia. The Satter and Haller vascular layers of the choroid consist of large, medium and small arteries that feed the choriocapillary network and account for more than four-fifths of the choroidal thickness.16 Repeat hypoxia can cause ocular hemodynamic changes and affect choroidal circulation, which may further decrease choroidal vascular density and reduce choroidal thickness in OSA patients.
Regarding the correlations between OCTA parameters and OSA severity, we found the PVDs in the superficial layer, deep layer and choroidal layer negatively correlated with AHI. The MVDs in the superficial layer and choroidal layer also negatively correlated with AHI. Besides, the PVDs and MVDs in the superficial layer positively correlated with LSaO2 and negatively correlated with ODI. Regarding the correlations between OCT parameters and OSA severity, the peripapillary RNFL thickness negatively correlated with AHI and ODI. Additionally, the PVDs at superficial and deep layers positively correlated with the peripapillary RNFL thickness, and the MVDs in the superficial and deep layers also positively correlated with the macular thickness. Accordingly, with the increasing of hypoxia and OSA severity, the vascular density was decreasing and the retinal thickness was also decreasing.
One of the limitations in this study is that participants of male gender predominated in the OSA group because OSA is more common among males than females. Further studies for age-matched and gender-matched subgroups with different OSA severities are needed. Additionally, OCTA examination could not be performed during sleep or supine position, so the dynamic vascular changes could not be measured while the episode of apnea occurred. Besides, all of the OSA patients were newly diagnosed and the duration of OSA was not known. OSA duration may have some effects on vascular densities, retinal RNFL thickness and choroidal thickness. Thus, longitudinal evaluation of the changes of retinal/choroidal thicknesses and vascular densities are necessary in patients with OSA.
Conclusions
We found the PVDs and MVDs in the superficial and choroidal layers were lower in moderate/severe OSA patients than control/mild OSA patients. The decrease of PVDs and MVDs in the superficial and choroidal layers significantly correlated with the increase of OSA severities. These changes could have the potential clinical significance and we suggest that OSA patients should be evaluated the status of ophthalmic microstructures, especially in patients with moderate/severe OSA.
Sponsorships
This study was sponsored by the grant from the Chang Gung Memorial Hospital (CMRPG8L0661), Kaohsiung, Taiwan.
Human Subjects
Human subjects were included in this study. The Institutional Review Board and Ethics Committee at the Chang Gung Memorial Hospital, Taiwan, approved the study (CGMH IRB: 201901741A3). All research adhered to the tenets of the Declaration of Helsinki. Informed consent was obtained from all participants. No animal subjects were used in this study.
Acknowledgments
The authors thank the research grant from Kaohsiung Chang Gung Memorial Hospital (CMRPG8L0661), Kaohsiung, Taiwan, and the Biostatistics Center, Kaohsiung Chang Gung Memorial Hospital for the assistance of statistical analysis.
Author Contributions
All authors made a significant contribution to the work reported, whether that is in the conception, study design, execution, acquisition of data, analysis and interpretation, or in all these areas; took part in drafting, revising or critically reviewing the article; gave final approval of the version to be published; have agreed on the journal to which the article has been submitted; and agree to be accountable for all aspects of the work.
Disclosure
Dr. Hsin-Ching Lin received two research grants from Intuitive Surgical Inc., Sunnyvale, CA. However, Intuitive Surgical Inc. had no role in the design or conduct of this study; collection, management, analysis, or interpretation of the data; preparation, review, or approval of the manuscript; or decision to submit the manuscript for publication. Dr. Pei-Wen Lin, Prof. Chun-Tuan Chang, Dr. Meng-Chih Lin, Dr. Michael Friedman, and Dr. Anna M. Salapatas declare no potential conflict of interest in this work. Also, the authors have no other proprietary or commercial interest in any materials discussed in this article.
References
1. Jelic S, Padeletti M, Higgins C, et al. Inflammation, oxidative stress and repair capacity of the vascular endothelium in obstructive sleep apnea. Circulation. 2008;117(17):2270–2278. doi:10.1161/CIRCULATIONAHA.107.741512
2. Vardhan V, Shanmuganandan K. Hypertension and catecholamine levels in sleep apnoea. Med J Armed Forces India. 2012;68(1):33–38. doi:10.1016/S0377-1237(11)60128-7
3. Phillips CL, Cistulli PA. Obstructive sleep apnea and hypertension: epidemiology, mechanisms and treatment effects. Minerva Med. 2006;97(4):299–312.
4. Wolf J, Lewicka J, Narkiewicz K. Obstructive sleep apnea: an update on mechanisms and cardiovascular consequences. Nutr Metab Cardiovasc Dis. 2007;17(3):233–240. doi:10.1016/j.numecd.2006.12.005
5. Lyons OD, Ryan CM. Sleep apnea and stroke. Can J Cardiol. 2015;31(7):918–927. doi:10.1016/j.cjca.2015.03.014
6. Waller EA, Bendel RE, Kaplan J. Sleep disorders and the eye. Mayo Clin Proc. 2008;83(11):1251–1261. doi:10.4065/83.11.1251
7. McNab AA. Floppy eyelid syndrome and obstructive sleep apnea. Ophthal Plast Reconstr Surg. 1997;13(2):98–114. doi:10.1097/00002341-199706000-00005
8. Purvin VA, Kawasaki A, Yee RD. Papilledema and obstructive sleep apnea syndrome. Arch Ophthalmol. 2000;118:1626–1630. doi:10.1001/archopht.118.12.1626
9. Mojon DS, Hedges TR, Ehrenberg B, et al. Association between sleep apnea syndrome and nonarteritic anterior ischemic optic neuropathy. Arch Ophthalmol. 2002;120(5):601–605. doi:10.1001/archopht.120.5.601
10. Mojon DS, Hess CW, Goldblum D, et al. High prevalence of glaucoma in patients with sleep apnea syndrome. Ophthalmology. 1999;106(5):1009–1012. doi:10.1016/S0161-6420(99)00525-4
11. Lin PW, Friedman M, Lin HC, et al. Normal tension glaucoma in patients with obstructive sleep apnea/hypopnea syndrome. J Glaucoma. 2011;20(9):553–558. doi:10.1097/IJG.0b013e3181f3eb81
12. Faridi O, Park SC, Liebmann JM, et al. Glaucoma and obstructive sleep apnoea syndrome. Clin Exp Ophthalmol. 2012;40(4):408–419. doi:10.1111/j.1442-9071.2012.02768.x
13. Kargi SH, Altin R, Koksal M, et al. Retinal nerve fibre layer measurements are reduced in patients with obstructive sleep apnoea syndrome. Eye. 2005;19(5):575–579. doi:10.1038/sj.eye.6701582
14. Lin PW, Friedman M, Lin HC, et al. Decreased retinal nerve fiber layer thickness in patients with obstructive sleep apnea/ hypopnea syndrome. Graefes Arch Clin Exp Ophthalmol. 2011;249(4):585–593. doi:10.1007/s00417-010-1544-1
15. Delaey C, Van De Voorde J. Regulatory mechanisms in the retinal and choroidal circulation. Ophthalmic Res. 2000;32(6):249–256. doi:10.1159/000055622
16. Nickla DL, Wallman J. The multifunctional choroid. Prog Retin Eye Res. 2010;29(2):144–168. doi:10.1016/j.preteyeres.2009.12.002
17. Told R, Ginner L, Hecht A, et al. Comparative study between a spectral domain and a high-speed single-beam swept source OCTA system for identifying choroidal neovascularization in AMD. Sci Rep. 2016;6:38132. doi:10.1038/srep38132
18. Miller AR, Roisman L, Zhang Q, et al. Comparison between spectral-domain and swept-source optical coherence tomography angiographic imaging of choroidal neovascularization. Invest Ophthalmol Vis Sci. 2017;58(3):1499–1505. doi:10.1167/iovs.16-20969
19. Flemons WW, Buysse D, Redline S, et al. Sleep-related breathing disorders in adults: recommendations for syndrome definition and measurement techniques in clinical research. The report of an American Academy of sleep medicine task force. Sleep. 1999;22(5):667–689.
20. Zudaire E, Gambardella L, Kurcz C, et al. A computational tool for quantitative analysis of vascular networks. PLoS One. 2011;6(11):e27385. doi:10.1371/journal.pone.0027385
21. Kohler M, Stradling JR. Mechanisms of vascular damage in obstructive sleep apnea. Nat Rev Cardiol. 2010;7(12):677–685. doi:10.1038/nrcardio.2010.145
22. Arden GB, Sivaprasad S. Hypoxia and oxidative stress in the causation of diabetic retinopathy. Curr Diabetes Rev. 2011;7(5):291–304. doi:10.2174/157339911797415620
23. De lima FF, Mazzotti DR, Tufik S, et al. The role inflammatory response genes in obstructive sleep apnea syndrome: a review. Sleep Breath. 2016;20(1):331–338. doi:10.1007/s11325-015-1226-7
24. Atkeson A, Yeh SY, Malhotra A, et al. Endothelial function in obstructive sleep apnea. Prog Cardiovasc Dis. 2009;51(5):351–362. doi:10.1016/j.pcad.2008.08.002
25. Atkeson A, Jelic S. Mechanisms of endothelial dysfunction in obstructive sleep apnea. Vasc Health Risk Manag. 2008;4(6):1327–1335. doi:10.2147/VHRM.S4078
26. Ii M, Nishimura H, Iwakura A, et al. Endothelial progenitor cells are rapidly recruited to myocardium and mediate protective effect of ischemic preconditioning via “imported” nitric oxide synthase activity. Circulation. 2005;111(9):1114–1120. doi:10.1161/01.CIR.0000157144.24888.7E
27. von Känel R, Dimsdale JE. Hemostatic alterations in patients with obstructive sleep apnea and the implications for cardiovascular disease. Chest. 2003;124(5):1956–1967. doi:10.1378/chest.124.5.1956
28. Ucak T, Unver E. Alterations in parafoveal and optic disc vessel densities in patients with obstructive sleep apnea syndrome. J Ophthalmol. 2020;2020:4034382. doi:10.1155/2020/4034382
29. Yu J, Xiao K, Huang J, et al. Reduced retinal vessel density in obstructive sleep apnea syndrome patients: an optical coherence tomography angiography study. Invest Ophthalmol Vis Sci. 2017;58(9):3506–3512. doi:10.1167/iovs.17-21414
30. Cai Y, Sun GS, Zhao L, et al. Quantitative evaluation of retinal microvascular circulation in patients with obstructive sleep apnea–hypopnea using optical coherence tomography angiography. Int Ophthalmol. 2020;40(12):3309–3321. doi:10.1007/s10792-020-01518-x
31. Moyal L, Blumen-Ohana E, Blumen M, et al. Parafoveal and optic disc vessel density in patients with obstructive sleep apnea syndrome: an optical coherence tomography angiography study. Graefes Arch Clin Exp Ophthalmol. 2018;256(7):1235–1243. doi:10.1007/s00417-018-3943-7
32. Çolak M, Özek D, Özcan KM, et al. Evaluation of retinal vessel density and foveal avascular zone measurements in patients with obstructive sleep apnea syndrome. Int Ophthalmol. 2021;41(4):1317–1325. doi:10.1007/s10792-020-01690-0
33. Chopra S, Rathore A, Younas H, et al. Obstructive sleep apnea dynamically increases nocturnal plasma free fatty acids, glucose, and cortisol during sleep. J Clin Endocrinol Metab. 2017;102(9):3172–3181. doi:10.1210/jc.2017-00619
34. He M, Han X, Wu H, et al. Choroidal thickness changes in obstructive sleep apnea syndrome: a systematic review and meta-analysis. Sleep Breath. 2016;20(1):369–378. doi:10.1007/s11325-015-1306-8
35. Bayhan HA, Bayhan SA, Intepe YS, et al. Evaluation of the macular choroidal thickness using spectral-domain optical coherence tomography in patients with obstructive sleep apnoea syndrome: response. Clin Exp Ophthalmol. 2016;44(1):74. doi:10.1111/ceo.12631
36. Xin C, Wang J, Zhang W, et al. Retinal and choroidal thickness evaluation by SD-OCT in adults with obstructive sleep apnea-hypopnea syndrome (OSAS). Eye. 2014;28(4):415–421. doi:10.1038/eye.2013.307
 © 2023 The Author(s). This work is published and licensed by Dove Medical Press Limited. The
full terms of this license are available at https://www.dovepress.com/terms
and incorporate the Creative Commons Attribution
- Non Commercial (unported, 3.0) License.
By accessing the work you hereby accept the Terms. Non-commercial uses of the work are permitted
without any further permission from Dove Medical Press Limited, provided the work is properly
attributed. For permission for commercial use of this work, please see paragraphs 4.2 and 5 of our Terms.
© 2023 The Author(s). This work is published and licensed by Dove Medical Press Limited. The
full terms of this license are available at https://www.dovepress.com/terms
and incorporate the Creative Commons Attribution
- Non Commercial (unported, 3.0) License.
By accessing the work you hereby accept the Terms. Non-commercial uses of the work are permitted
without any further permission from Dove Medical Press Limited, provided the work is properly
attributed. For permission for commercial use of this work, please see paragraphs 4.2 and 5 of our Terms.
Recommended articles
A Prediction Nomogram for Severe Obstructive Sleep Apnea in Snoring Patients: A Retrospective Study
Teng G, Zhang R, Zhou J, Wang Y, Zhang N
Nature and Science of Sleep 2023, 15:231-243
Published Date: 17 April 2023