")
Back to Journals » Drug Design, Development and Therapy » Volume 11
Decitabine reverses TGF-β1-induced epithelial–mesenchymal transition in non-small-cell lung cancer by regulating miR-200/ZEB axis
Authors Zhang N, Liu Y, Wang Y, Zhao M, Tu L, Luo F
Received 2 December 2016
Accepted for publication 31 January 2017
Published 28 March 2017 Volume 2017:11 Pages 969—983
DOI https://doi.org/10.2147/DDDT.S129305
Checked for plagiarism Yes
Review by Single anonymous peer review
Peer reviewer comments 3
Editor who approved publication: Dr Qiongyu Guo
Nan Zhang,* Yanyang Liu,* Yuyi Wang, Maoyuan Zhao, Li Tu, Feng Luo
Department of Medical Oncology, Cancer Center, Lung Cancer Center and State Key Laboratory of Biotherapy, West China Hospital, Sichuan University, Chengdu, Sichuan, People’s Republic of China
*These authors contributed equally to this work
Objective: Epithelial–mesenchymal transition (EMT) is a crucial driver of tumor progression. Tumor growth factor-beta 1 (TGF-β1) is an important factor in EMT induction in tumorigenesis. The targeting of EMT may, therefore, represent a promising approach in anticancer treatment.
Methods: In this study, we determined the effect of decitabine, a DNA methyltransferase inhibitor, on TGF-β1-induced EMT in non-small-cell lung cancer (NSCLC) PC9 and A549 cells. We also assessed the involvement of the miR-200/ZEB axis.
Results: Decitabine reversed TGF-β1-induced EMT in PC9 cells, but not in A549 cells. This phenomenon was associated with epigenetic changes in the miR-200 family, which regulated EMT by altering the expression of ZEB1 and ZEB2. TGF-β1 induced aberrant methylation in miR-200 promoters, leading to EMT in PC9 cells. Decitabine attenuated this effect and inhibited tumor cell migration in vitro and in vivo. In A549 cells, however, neither TGF-β1 nor decitabine exhibited an effect on miR-200 promoter methylation.
Conclusion: Our findings suggest that epigenetic regulation of the miR-200/ZEB axis is responsible for EMT induction by TGF-β1 in PC9 cells. Decitabine inhibits EMT in NSCLC cell PC9 through its epigenetic-based therapeutic activity.
Keywords: DNA methyltransferase inhibitor, EMT, miRNA, epigenetics, NSCLC
Corrigendum for this paper has been published
Introduction
Lung cancer has the highest incidence of malignancy and results in the highest mortality rates among all malignant diseases, with an incidence of 1.59 million deaths/year.1 Non-small-cell lung cancer (NSCLC), the most common type of lung cancer, comprises 80%–85% of all cases. Owing to the lack of major advancements in treatment, the prognosis for NSCLC patients remains poor, with a 5-year overall survival rate of 15% of all stages.2
In lung cancer progression, the occurrence of epithelial–mesenchymal transition (EMT) promotes invasiveness and metastasis.3 EMT refers to the physiological process by which cells gradually lose their epithelial characteristics while acquiring mesenchymal features, which facilitates detachment from primary tumors, invasion of adjacent stroma, entrance into systemic circulation, and extravasation.3–9 Tumor growth factor-beta 1 (TGF-β1) has been confirmed as a key factor in EMT induction.10 This cytokine is a member of the TGF-β superfamily and plays a dual role in tumorigenesis.11 While TGF-β1 inhibits cell proliferation in early tumor stages, initiating cell differentiation and inducing apoptosis, it can also stimulate tumor invasion and metastasis through several mechanisms during tumor progression. Further research into the molecular mechanisms of TGF-β1-induced EMT is needed to allow for the inhibition of the invasive phenotype while retaining the suppressive effects of TGF-β1 on tumor growth.
Recently, the epigenetic mechanisms involved in EMT regulation have been increasingly studied, including DNA methylation and miRNAs, which are both reported to participate in regulating EMT. Gregory et al12 found that miR-200 family members could suppress EMT by targeting ZEB1 and ZEB2, E-cadherin transcriptional repressors. Recent, evidence suggests the existence of interactions among DNA methylation, miRNAs, and the invasion of highly aggressive bladder and breast cancers.13–15 Therefore, we hypothesized that it may be possible to reverse EMT by epigenetic regulation, which is not currently well understood in NSCLC. Decitabine (DAC, 5-aza-2′-deoxycytidine) is a deoxyribonucleotide that is phosphorylated to 5-aza-2′-deoxycytidine monophosphate by deoxycytidine kinase, followed by further phosphorylation to 5-azadeoxycytidine triphosphate. It can be incorporated into DNA by DNA polymerase, leading to covalent capturing of the DNA methyltransferase enzyme and subsequent suppression of DNA methylation. Since DAC is in the form of deoxyribonucleoside, it can be more readily incorporated into DNA and is, therefore, considered to be more effective than azacitidine (5-azacytidine), a ribonucleoside DNA methylation inhibitor.16 Some studies have found that DAC may affect EMT in human cancers.17–19 To investigate this, we assessed the effect of DAC on TGF-β1-induced EMT in two NSCLC cell lines, PC9 and A549. We also determined the involvement of the miR-200/ZEB axis in this mechanism. In this study, we performed most experiments with two miR-200 family members, miR-200a and miR-200c, that together represent two subfamilies of miR-200; for the sake of simplicity, we refer to miR-200 family members collectively as miR-200 (Figure S1).20
Materials and methods
Tumor cell culture and treatment
The PC9 and A549 cell lines were obtained from the American Type Culture Collection (ATCC, Manassas, VA, USA). Cells were maintained in monolayer in Roswell Park Memorial Institute (RPMI) 1640 (Gibco/Invitrogen, Carlsbad, CA, USA) containing 10% heat-inactivated fetal bovine serum (FBS) in a humid atmosphere at 37°C with 5% CO2. The cells were harvested using 0.25% trypsin at 75% confluence, and then subcultured in 75 cm2 flasks or six-well plates. Before treated with drugs, cells were allowed to adhere to the substrate for 24 h. Two different treatments were designed and carried out after serum starvation for another 24 h: 1) 10 ng/mL human recombinant TGF-β1 (Biolegend, San Diego, CA, USA) for the TGF-β groups; 2) a combination of 10 ng/mL TGF-β1 and 10 μM DAC (Selleckchem, Houston, TX, USA) for the TGF-β+DAC groups. And the control groups were given the same amount of phosphate-buffered saline (PBS). All treatments lasted for 96 h.
Animal tumor models and treatment
Five- to six-week-old female NOD/SCID mice (Beijing HFK Bioscience Co. Ltd, Beijing, People’s Republic of China) were maintained in the specified pathogen-free conditions with animal food and water. The mice were injected subcutaneously into the right axillary fossa with PC9 or A549 cells (5×10⁶/100 μL). The criterion for successful model establishment is that tumors are palpable and have reached ~300–500 mm3 at 7–10 days after inoculation. Then mice were randomly assigned into four groups (n=3 per group), and euthanized, respectively, at day 0, 3, 6 and 12. After volume measurement, tumors were immediately collected for enzyme-linked immunosorbent assay (ELISA). For assessing lymph node metastasis and survival rate, PC9 tumor-bearing mice were randomly assigned into treatment and control groups (n=5 per group for lymph node metastasis assessment, n=10 per group for survival time record). Treatments were given through intraperitoneal injection. In this research, we utilized normal saline for the control group and DAC (Selleckchem) 2.5 mg/kg every day for 10 consecutive days for the treatment group. Two weeks after termination of treatment, mice were sacrificed, four lymph nodes from bilateral neck and inguinal of every mouse were collected, and the histological analysis was performed to determine the lymph node metastasis. The survival rate of each group was recorded at the start of the treatment, and residual mice in all groups were sacrificed 7 weeks after tumor establishment. All procedures regarding the care and use of animals followed the guidelines of and were approved by the Animal Ethics Committee of Sichuan University (Approval No 2017004A).
ELISA
The tumor tissue samples were prepared using liquid nitrogen grounding method and homogenized in radioimmunoprecipitation assay buffer (0.1% sodium dodecyl sulfate [SDS], 0.5% deoxycholate, 1% Triton X-100, 150 mM NaCl, and 50 mM Tris–HCl). After centrifugated at 13,300 rpm for 30 min at 4°C, the protein concentration of samples was quantified with Micro bicinchoninic acid (BCA) Protein Assay Kit (Pierce, Rockford, IL, USA). TGF-β1 level in the samples was assessed by mouse ELISA kits (eBioscience, San Diego, CA, USA) according to the manufacturer’s instructions, and the colorimetric reaction was measured at 450 nm using a microplate reader (Benchmark Electronics, Angleton, TX, USA).
Microscopy images
The cultured PC9 and A549 cells were treated with TGF-β1 or TGF-β1+DAC or PBS for 96 h. Images were captured using a digital microscope (Olympus UIS2, Tokyo, Japan) at a magnification of 20× objective.
Western blotting
PC9 and A549 cells were harvested and total protein was quantified with Micro BCA Protein Assay Kit (Pierce). Total protein (20 μg) from each sample was separated by electrophoresis using 10% SDS-polyacrylamide gel electrophoresis gels, transferred onto poly(vinylidene fluoride) membranes (Merck Millipore, Billerica, MA, USA), blocked with 5% skim milk, and incubated using the corresponding primary antibodies (1:1,000), E-cadherin (Cell Signaling Technology, Danvers, MA, USA) or vimentin (Cell Signaling Technology), overnight at 4°C. Glyceraldehyde 3-phosphate dehydrogenase (GAPDH) (Cell Signaling Technology) was used as a loading control. Blots were then incubated with the corresponding secondary antibodies (1:5,000, Cell Signaling Technology) for 1 h at room temperature. After exposed to ECL reagent (Merck Millipore) advanced luminescence, signals were developed on X-ray films (Kodak, NY, USA).
Transwell migration assays
The migration ability of PC9 cells was determined using the 24-well Transwell chambers (Corning Costar, NY, USA). After untreated or treated with TGF-β1 or TGF-β1+DAC for 96 h, the cells (1×10⁵) were seeded in the top chambers and incubated for 24 or 48 h. The migrating cells were counted using a light microscope (Olympus UIS2; magnification, ×20, three random fields per well were analyzed by ImageJ).21
Wound-healing assay
A549 cells were seeded in six-well plates at a density of 2×10⁵ cells/well in RPMI 1640 containing 10% FBS and cultured until 80%–90% confluence. The cells were then scraped with a 200-μm pipette tip to generate scratch wounds and washed twice with serum-free RPMI 1640 to remove cell debris. The experimental group cells were treated with TGF-β1 or TGF-β1+DAC at 37°C for 96 h. To record scratch wound closure, images were captured at 0- and 96-h time points in the same position using an Olympus IX71 microscope (Olympus UIS2; magnification, ×60 objective, three random fields per well were analyzed). Terminal time point image areas were normalized to the 0-h postscratch ones.
Quantitative real-time polymerase chain reaction (qRT-PCR)
Total RNA from PC9 and A549 cells was extracted using TRIzol reagent (KeyGEN, Nanjing, People’s Republic of China). RNA was reversed transcribed into cDNA using PrimeScript RT reagent Kit with gDNA Eraser (TaKaRa, Tokyo, Japan). For detecting ZEB1 and ZEB2, the cDNA template was amplified by RT-PCR using the SYBR Premix Ex TaqTM II (TaKaRa). RT-PCRs were performed in triplicate, and gene expression in each sample was normalized to GAPDH expression. The primer sequences used were listed in Table 1. qRT-PCRs reactions were performed by the CFX96 Real-Time PCR Detection System (Bio-Rad, Hercules, CA, USA). The relative expression fold change of mRNAs was calculated by the 2−ΔΔCt method. For detecting miR-200a and miR-200c expression, total RNA of each cell line was extracted and reversed transcribed into cDNA as mentioned earlier. Specific miR-200a and miR-200c primers and internal control U6 snRNA primers (Bulge-LoopT™ miRNA qPCR Primers) were designed and synthesized by RiboBio (RiboBio Co. Ltd., Guangzhou, People’s Republic of China). qRT-PCRs were performed in a 20-μL reaction volume containing 2 μL cDNA template, 9 μL SYBR-Green I mix (TaKaRa), 2 μL forward primers, 2 μL reverse primer, and 5 μL RNase-free H2O on the CFX96 Real-Time PCR Detection System (Bio-Rad) using the following protocol: 95°C for 30 s, followed by 40 cycles of 95°C for 5 s, 55°C for 30 s, and 72°C for 30 s. Each sample was detected in triplicate. The relative expression of miR-200a and miR-200c was analyzed using 2−ΔΔCt method.
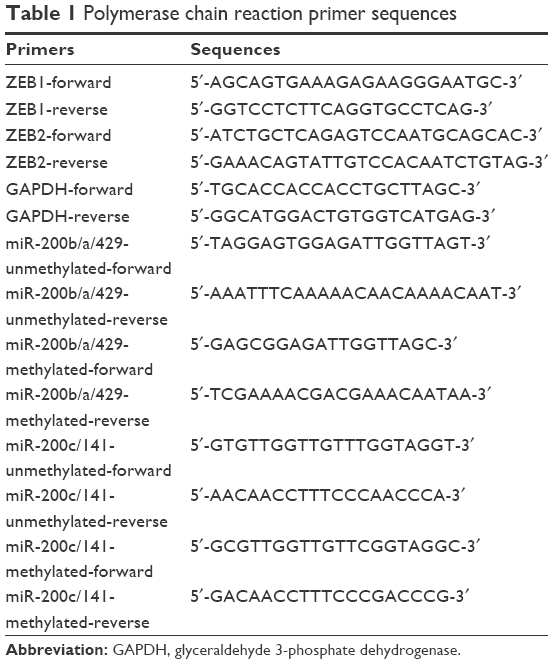 | Table 1 Polymerase chain reaction primer sequences |
Immunofluorescence staining
PC9 cells were fixed in 4 wt% paraformaldehyde (Sigma, St Louis, MO, USA) for 30 min and rinsed three times with PBS for 10 min each time. The samples were immersed in 0.2% Triton X-100 for 10 min, rinsed three times for 10 min each time with PBS, and then blocked in 4% goat serum for 1 h at room temperature. Then sample sections were incubated overnight in anti-E-cadherin rabbit monoclonal antibody (1:200, Cell Signaling Technology) and anti-vimentin rabbit monoclonal antibody (1:200, Cell Signaling Technology) at 4°C. After rinsed with PBS three times, the samples were subsequently incubated in anti-rabbit immunoglobulin G secondary antibody conjugated with fluorescein isothiocyanate (FITC) or APC (1:100, eBioscience) for 1 h in the dark. For nuclei observation, the samples were dipped in 4,6-diamidino-2-phenylindole dihydrochloride (DAPI) solution (Sigma, 3 μg/mL) and immediately rinsed with PBS. In the stained image, the E-cadherin displayed red fluorescence, the vimentin displayed green florescence, and the nuclei displayed blue fluorescence.
Methylation-specific PCR (MSP) analysis
Genomic DNA from PC9 and A549 cell lines was extracted using Blood/Cell/Tissue Genomic DNA Extraction Kit (Tiangen Biotech Co. Ltd, Beijing, People’s Republic of China). One microgram of DNA from each sample was subjected to bisulfite modification through the use of an EZ DNA Methylation-Gold Kit (Zymo Research, Irvine, CA, USA) following the manufacturer’s instructions. MSP analysis was performed on bisulfite-converted DNA to investigate methylation status. The sequences of PCR primers specific for methylated and unmethylated alleles of miR-200b/a/429 and miR-200c/141 are listed in Table 1. Each MSP reaction was carried out with 100 ng of bisulfite-modified DNA and 5 U of Taq Hot Start DNA polymerase (TaKaRa) in a final volume of 20 μL. A touch-down PCR amplification was conducted. Briefly, after an initial incubation at 94°C for 4 min, 35 cycles of denaturation at 94°C for 30 s, annealing at 57°C for 20 s, and annealing at 72°C for 30 s were performed, followed by 5 min of extension at 72°C. MSP products were then analyzed by 2% agarose gel electrophoresis.
Apoptosis assay
Cells (1×10⁶) were collected, washed, and resuspended in PBS. Annexin V-FITC (5 μL/mL; KeyGEN, Nanjing, Jiangsu, People’s Republic of China) and propidium iodide (KeyGEN) were added, and cells were incubated for 20 min at 4°C before analyzed by flow cytometry system (Beckman Coulter, Miami, FL, USA).
Cell viability determination (XTT assay)
We assessed PC9 cell viability using CellTiter 96 Aqueous One Solution (Promega, Madison, WI, USA). According to the manufacturer’s protocol, 104 cells per well were seeded into 96-well plates. Cells were incubated with concentrations as indicated for 48 or 72 h and analyzed by microplate reader. Experiments were analyzed in triplicate.
Histological analysis
Bilateral neck and inguinal lymph nodes were fixed overnight in 4 wt% paraformaldehyde and embedded in paraffin. Sections of 4-μm thickness were then stained with hematoxylin and eosin and examined using an Eclipse E600 microscope (Nikon, Tokyo, Japan).
Statistical analysis
Data are expressed as mean ± standard deviation. Statistical analyses were performed using the Statistical Package for the Social Sciences 24.0 (SPSS Inc., Chicago, IL, USA). Between-group statistical significance was determined using Dunnett’s t-test, Student’s t-test, or one-way analysis of variance with Student–Newman–Keuls multiple comparison. Significance was set at P<0.05.
Results
TGF-β1 increases with tumor growth in PC9 and A549 xenograft model
After the establishment of animal tumor models using the NSCLC cell lines PC9 and A549, transplanted tumors were resected at different time points − 0, 3, 6, and 12 days – for determination of TGF-β1 levels using ELISA. Results showed that TGF-β1 levels in tumor tissues significantly increased with tumor progression, both in PC9- and A549-transplanted tumors (Figure 1). This suggests that TGF-β1 plays a role in NSCLC progression.
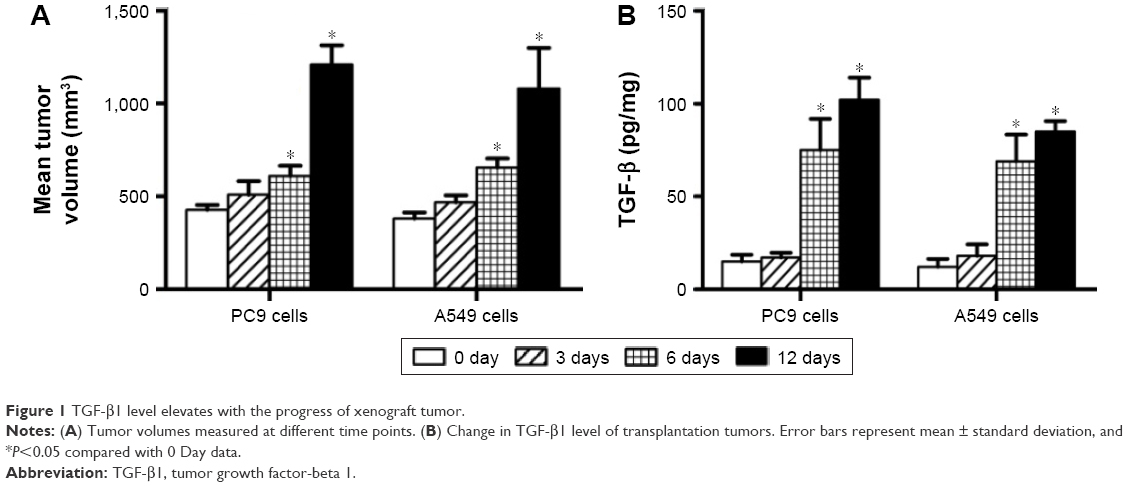 | Figure 1 TGF-β1 level elevates with the progress of xenograft tumor. |
TGF-β1 induces EMT in NSCLC in vitro
PC9 and A549 cells were cultured in medium with or without TGF-β1 (10 ng/mL) for 96 h. Upon TGF-β1 treatment, most PC9 and A549 cells elongated to become fibroblast-like spindle-shaped cells (Figure 2A and E). EMT-related proteins were measured by Western blot analysis. A dramatic decrease in E-cadherin and increase in vimentin were observed in both cell lines following TGF-β1 stimulation (Figure 2B and F). The cellular migration abilities of PC9 and A549 cells were assessed by Transwell migration and wound-healing assays, respectively. Data showed that TGF-β1 treatment significantly increased cell migration (Figure 2C, D, and G). These results demonstrate that NSCLC cells are induced to undergo EMT and exhibit enhanced migration abilities under TGF-β1 stimulation.
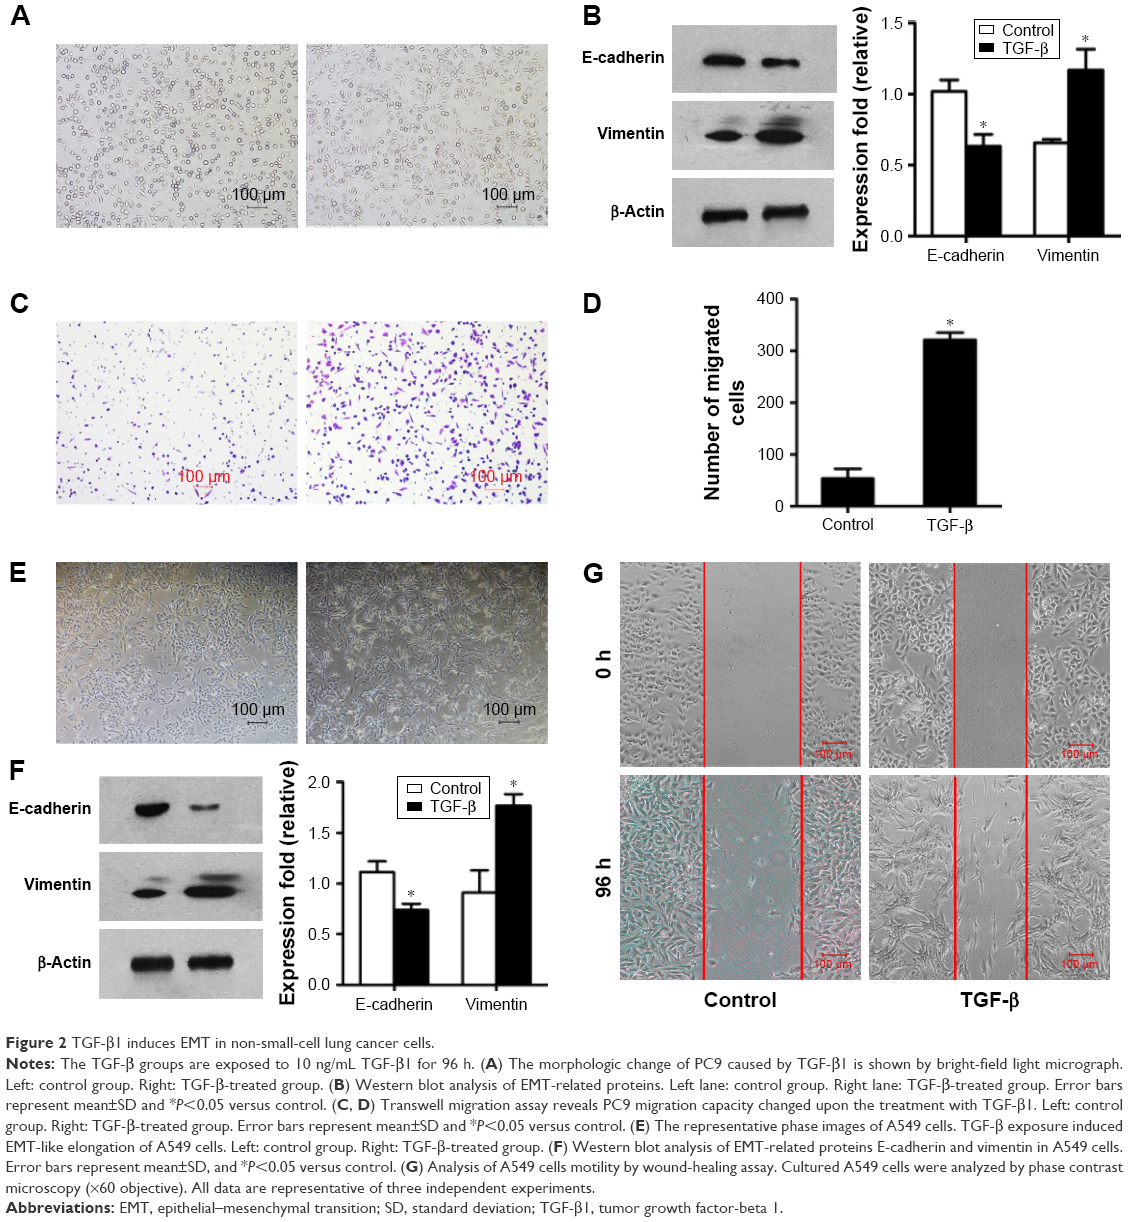 | Figure 2 TGF-β1 induces EMT in non-small-cell lung cancer cells. |
DAC inhibits TGF-β1-induced EMT in PC9 cells in vitro
To determine whether DAC inhibits TGF-β1-induced EMT in PC9 cells, TGF-β1-stimulated PC9 cells were treated with or without DAC. Immunofluorescence revealed that DAC treatment of TGF-β1-stimulated PC9 cells induced the re-expression of epithelial markers such as E-cadherin and reduced the expression of mesenchymal markers such as vimentin (Figure 3A). Consistent with this finding, Transwell migration assay revealed that DAC treatment led to the suppression of cell mobility (Figure 3B). Western blot analysis of E-cadherin and vimentin protein expression levels confirmed the immunofluorescence results (Figure 3C).
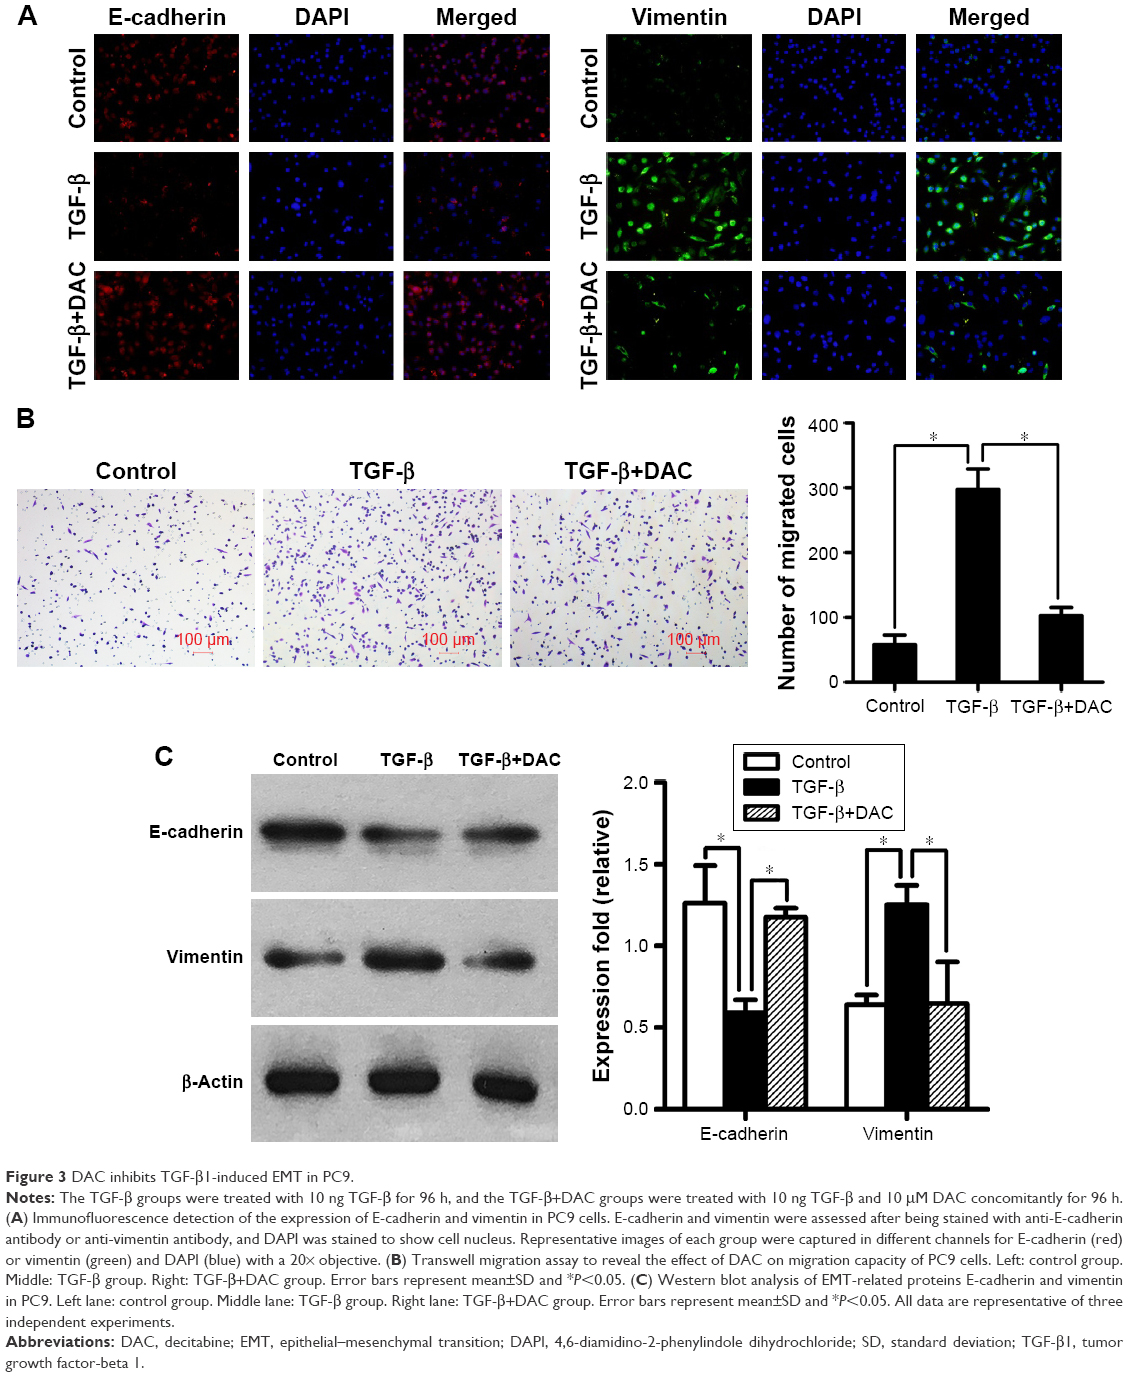 | Figure 3 DAC inhibits TGF-β1-induced EMT in PC9. |
DAC treatment does not affect EMT in A549 cells in vitro
While DAC inhibited TGF-β1-induced EMT in PC9 cells, a similar response was not observed in A549 cells. Experiments in A549 cells showed that DAC had no remarkable effect on the expression of E-cadherin or vimentin (Figure 4A). Similarly, DAC did not attenuate TGF-β1-induced enhancement of A549 cellular migration (Figure 4B).
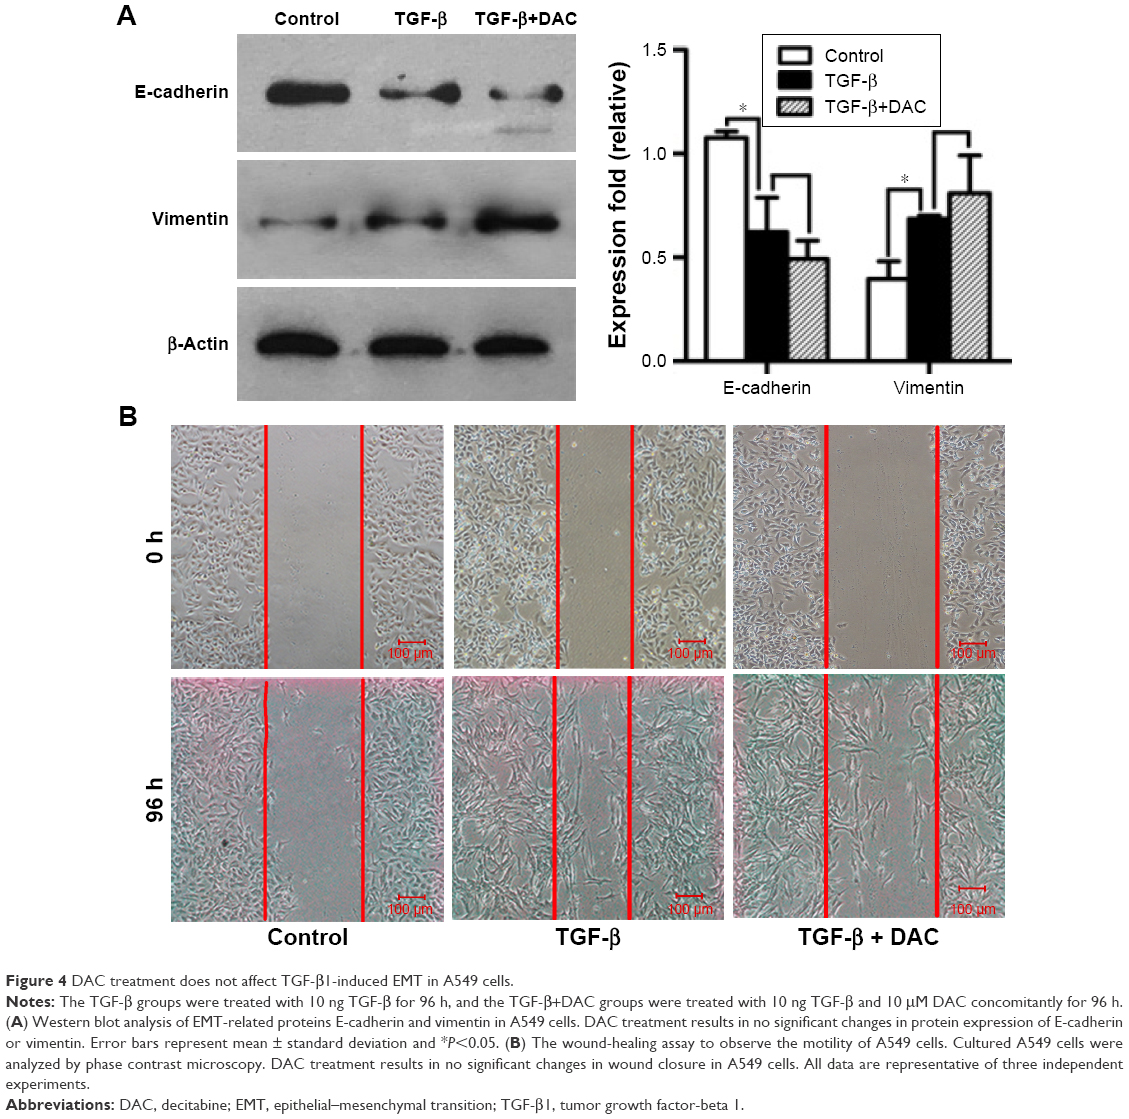 | Figure 4 DAC treatment does not affect TGF-β1-induced EMT in A549 cells. |
Epigenetic regulation of miR-200/ZEB axis is involved in TGF-β1-induced EMT
Further experiments were performed to explore the mechanism by which DAC reverses EMT in PC9 but not in A549 cells. Expression of ZEB1 and ZEB2 was determined by qRT-PCR analysis. Results indicated that TGF-β1 treatment upregulated ZEB1 and ZEB2 expression in both cell lines. DAC reduced this upregulation in PC9 cells (Figure 5A), but in A549 cells, ZEB1 and ZEB2 expression was not affected by DAC (Figure 5B). It has been suggested that ZEB1 and ZEB2 are the targets of the miR-200 family.12 We found that expression levels of miR-200a and miR-200c were downregulated by TGF-β1 treatment and upregulated by DAC treatment in PC9 cells, suggesting a strong association between expression of miR-200/ZEB and TGF-β1/DAC treatment in PC9 cells (Figure 5C). In contrast, in A549 cells, in which EMT is not reversed by DAC, expression levels of miR-200a and miR-200c were not altered by TGF-β1 or DAC treatment (Figure 5C). We, therefore, hypothesized that DAC increases miR-200 levels by inducing demethylation of miR-200 in PC9 but not in A549 cells. To test this, the miR-200 promoter methylation status of each cell line was detected by MSP. Results showed that TGF-β1 treatment induces hypermethylation of the miR-200 promoters, whereas DAC treatment induces demethylation in PC9 cells. In A549 cells, however, TGF-β1 and DAC treatments appear to have no effect on promoter methylation status (Figure 5D). To further verify the role of miR-200 in EMT, we performed miR-200 mimic transfection experiments and investigated the effect of miR-200 expression on cell mobility. Our results showed that TGF-β1-stimulated PC9 cell migration was significantly inhibited by the upregulation of miR-200a and miR-200c (Figure S2).
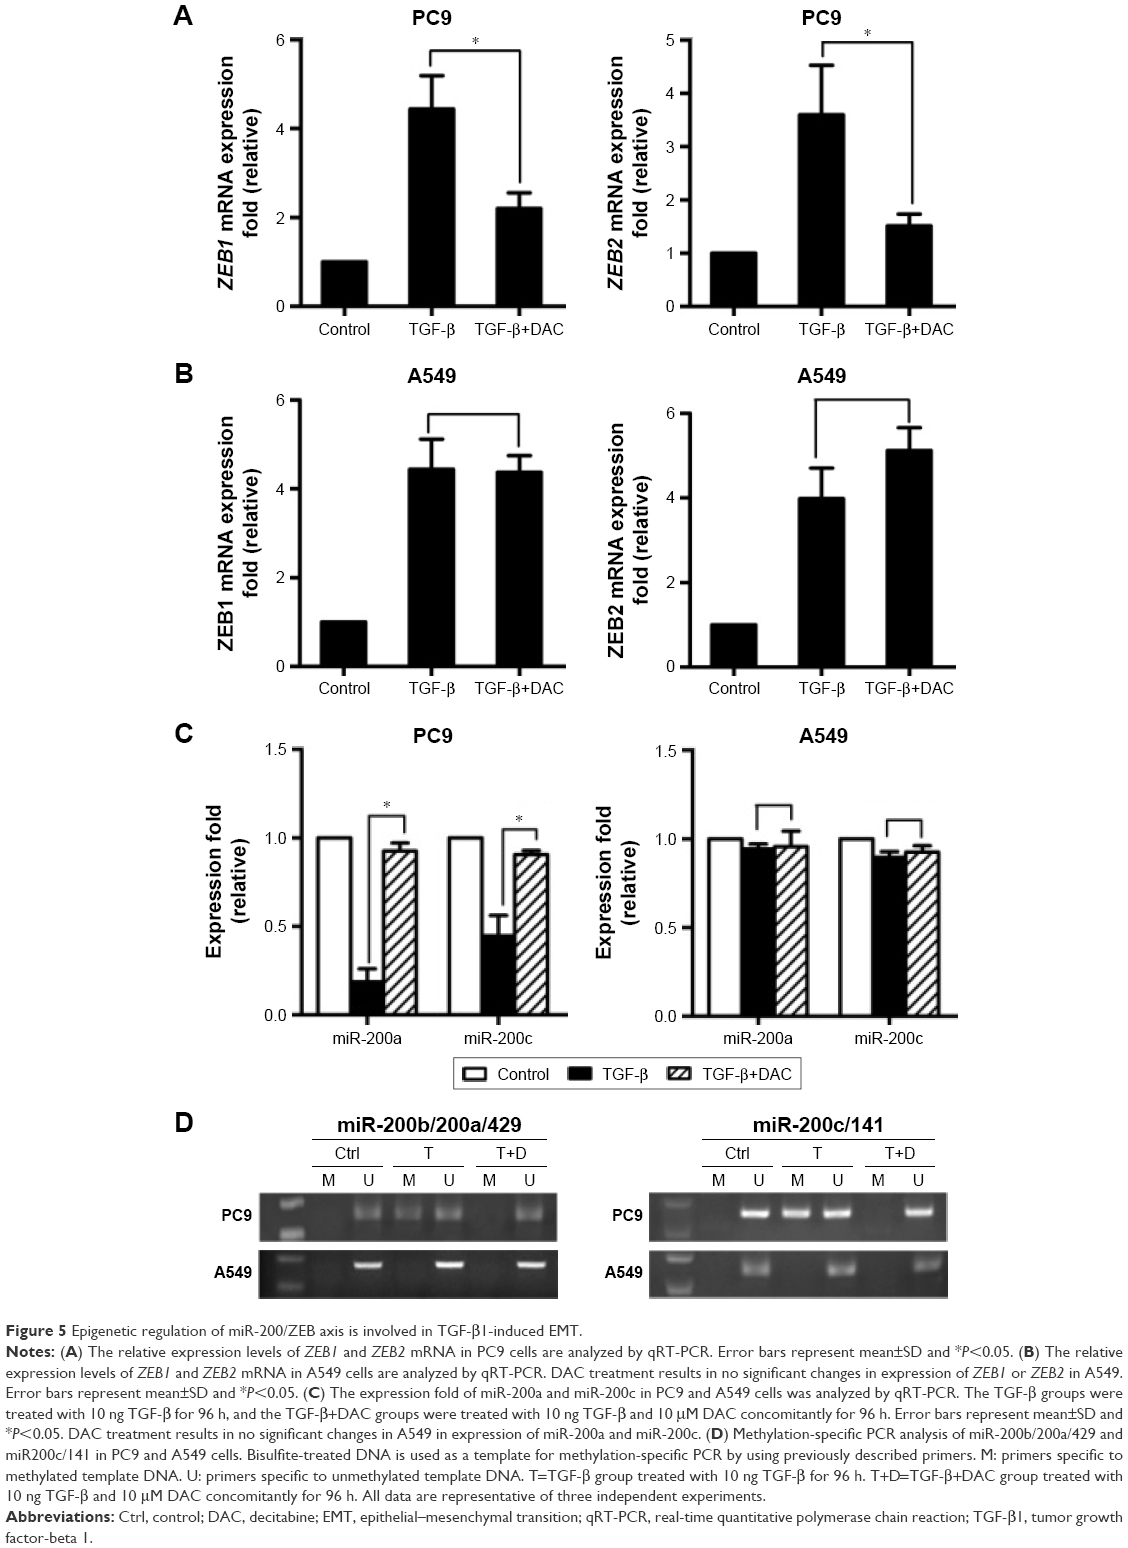 | Figure 5 Epigenetic regulation of miR-200/ZEB axis is involved in TGF-β1-induced EMT. |
DAC promotes TGF-β1-induced cell apoptosis
TGF-β1 exhibits a wide range of biological activities in vitro and in vivo. In addition to inducing EMT, TGF-β1 has also been shown to play a role in regulating cell growth, differentiation, and apoptosis.22 We performed flow cytometry and XTT assay to determine the effect of TGF-β1 on apoptosis and cell growth in PC9 and A549 cells. Flow cytometry data showed that TGF-β1 treatment promoted apoptosis in both cell lines, and this effect was enhanced when combined with DAC (Figure 6A and B). XTT assays revealed that the viabilities of the two cell lines were inhibited by TGF-β1. This effect was slightly enhanced when combined with DAC, but the difference was not statistically significant (Figure 6C).
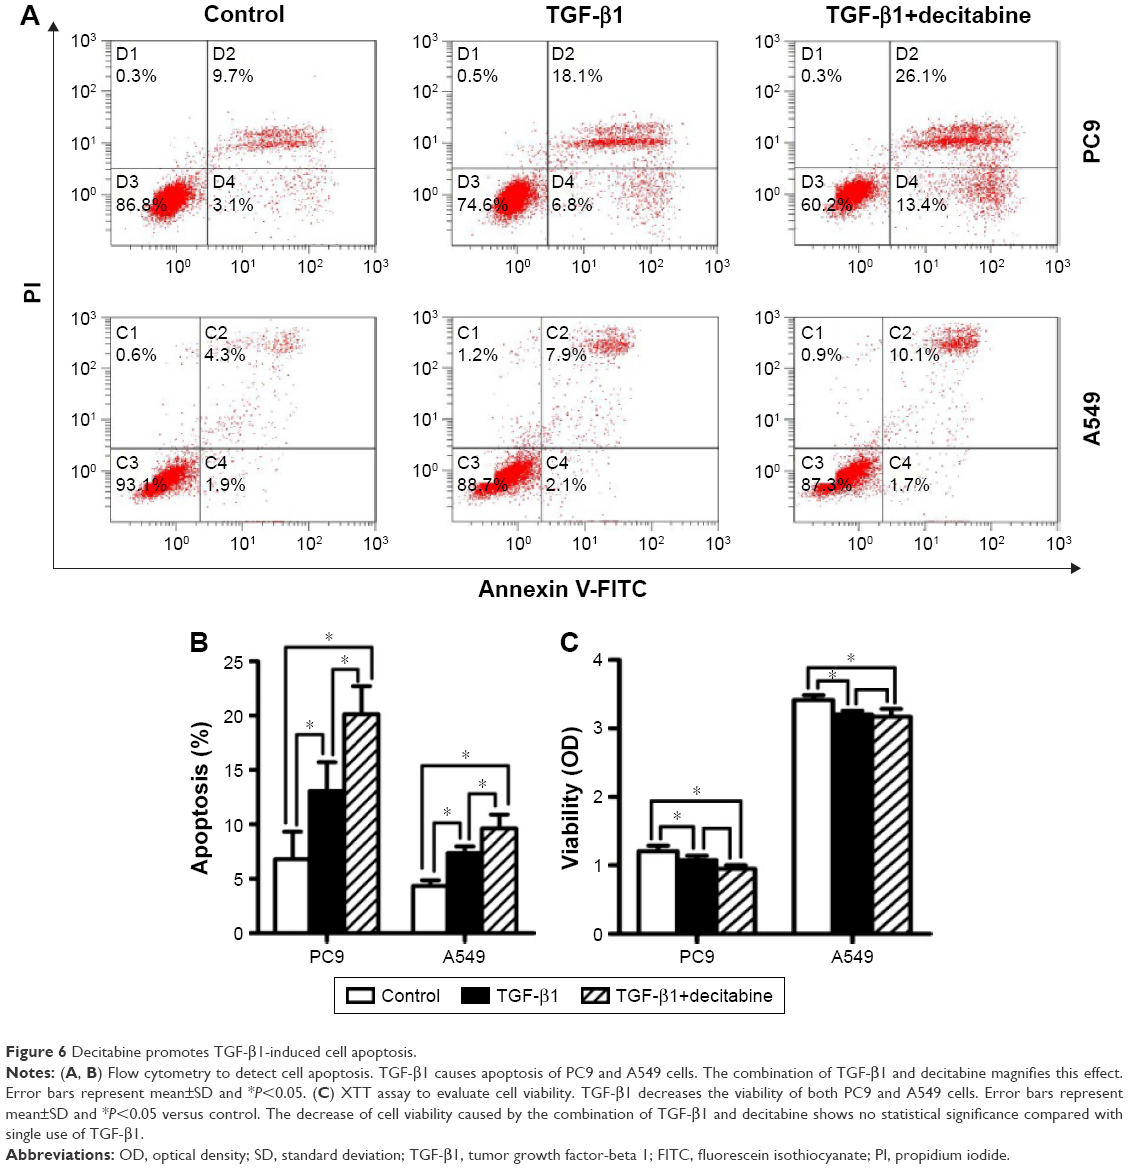 | Figure 6 Decitabine promotes TGF-β1-induced cell apoptosis. |
DAC reduces lymph node metastasis in PC9 tumor-bearing mice
To investigate whether DAC has an antimetastasis effect in vivo, PC9 tumor-bearing nude mice were treated with DAC (2.5 mg/kg) every day for 10 days. Two weeks after termination of treatment, mice were sacrificed and the formation of lymph node metastasis was observed (Figure 7C). Results were consistent with our in vitro findings with a reduced lymph node metastasis rate in DAC-treated mice (Figure 7B). However, survival rate was not significantly different between the control and DAC groups (Figure 7A).
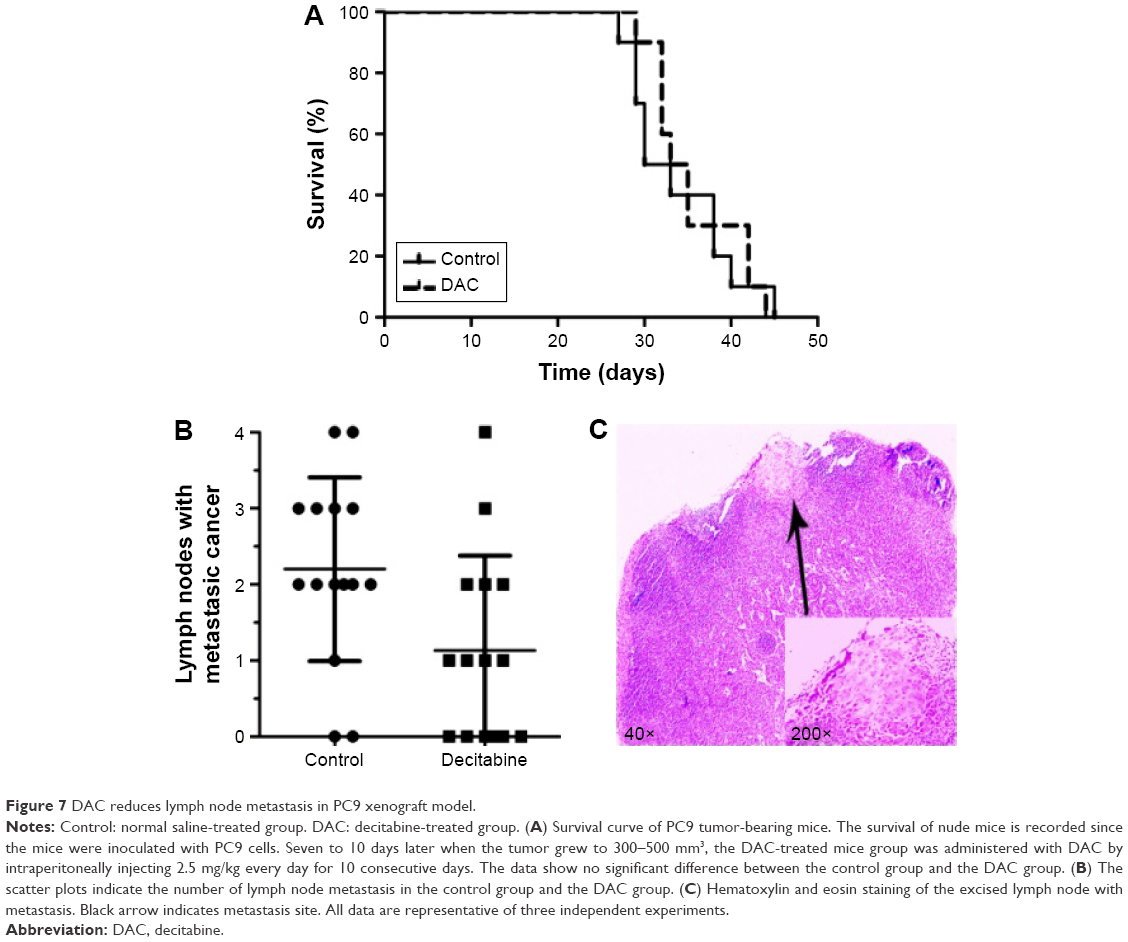 | Figure 7 DAC reduces lymph node metastasis in PC9 xenograft model. |
Discussion
In the present study, we investigated the effect of DAC on TGF-β1-induced EMT and the involvement of the miR-200/ZEB axis. According to our findings, DAC treatment interfered with the miR-200/ZEB axis, thus reversing TGF-β-induced EMT in the NSCLC cell line PC9.
We performed MSP and found that the miR-200 DNA promoters were hypermethylated during TGF-β1-induced EMT in PC9 cells. Treatment with DAC reversed this aberrant methylation, leading to an increase in miR-200, downregulation of ZEB1/2, and reversal of EMT. miR-200 transfection experiments showed that TGF-β1-stimulated PC9 cell migration was significantly inhibited by the upregulation of miR-200a (Figure S2). Our in vivo experiments showed that DAC inhibits lymph node metastasis of PC9 tumor-bearing mice. In addition, DAC enhances the proapoptotic effect of TGF-β1. These findings demonstrate that DAC represents a promising epigenetic therapy for NSCLC.
However, we also note that DAC failed to reverse TGF-β1-induced EMT in A549 cells. Unlike in PC9 cells, methylation of the miR-200 promoters was unaffected by TGF-β1 or DAC treatment in A549 cells. However, this does not necessarily rule out a role for the miR-200/ZEB axis in EMT of A549 cells. Gregory et al23 reported that A549 cells exhibit extremely low expression of miR-200c and that stable overexpression of miR-200c in A549 cells led to downregulation of ZEB1 and upregulation of E-cadherin. We speculate that other mechanisms may mediate TGF-β1-induced EMT in A549 cells. Histone modification is another typical epigenetic mechanism for EMT regulation. Specific deacetylation and methylation/demethylation patterns are thought to be responsible for gene repression.24 Researchers have shown that TGF-β1-induced EMT in A549 cells is accompanied by histone deacetylase 6 (HDAC6)-dependent deacetylation of α-tubulin, which correlates with the expression of EMT markers. Use of an HDAC inhibitor results in the restored expression of E-cadherin.25 In addition, histone modifications are also involved in miR-200 family-mediated regulation of EMT. Researchers have observed that the unmethylated CpG islands of the miR-200 loci are enriched in H3K4 trimethylation and H3K36 trimethylation (two marks of active transcription) and depleted in H3K27 trimethylation (a silencing transcriptional mark).26 Additional analyses are needed to further elucidate this issue.
TGF-β1 is a multifunctional polypeptide cytokine with pleiotropic effects on tumors. TGF-β1 can inhibit cell proliferation and initiate cell differentiation in early tumor stages but it can also promote tumor invasion and metastasis by inducing EMT during tumor progression.27,28 Our data confirm the bifunctional mode of action of TGF-β1 in NSCLC.
The interaction between miR-200/ZEB axis in NSCLC is a characteristic manifestation of epigenetic regulation of plasticity in lung cancer cells.29 Some researchers have suggested that TGF-β-induced NSCLC EMT is completely miR-200-dependent.30 Shien et al31 reported that EMT features were observed among the epidermal growth factor receptor inhibitor-resistant NSCLC cell lines. Resistant cells with EMT features showed decreased expression of miRNA-200c mediated by DNA methylation, and expression was restored following treatment with 5-aza-2′-deoxycytidine. Consistent with these findings, we found that DAC corrected the hypermethylation status of miR-200, interfered with the miR-200/ZEB axis, and inhibited TGF-β-induced EMT in the NSCLC cell line. Recently, treatment with DAC was successfully used to increase the expression of miR-200c/141 and inhibit migration and invasion induced by TGF-β in gastric cancer cell lines.32 These results suggest a potential application of DAC in the treatment of solid tumors.
It has been reported that DAC exhibits single-agent activity through growth arrest and apoptosis induction in hematological malignancies.33 Some researchers have reported that in melanoma and renal cell cancer cell lines, transcription of genes responsible for apoptosis was repressed by hypermethylation of CpG islands in regulatory regions,29,34–36 indicating that demethylation may play a role in promoting apoptosis in solid tumors. Our results demonstrated that DAC can enhance the proapoptotic effect of TGF-β (P<0.05) and inhibit NSCLC cell viability (although the difference is not statistically significant). According to these results, DAC achieved the goal of allowing for the inhibition of the invasive phenotype while retaining the suppressive effects of TGF-β1 on tumor growth.
Conclusion
We found that the DNA methyltransferase inhibitor DAC reverses TGF-β1-induced EMT by reversing the aberrant methylation of miR-200 promoters and regulating the miR-200/ZEB axis in NSCLC. To date, there is no clear clinical evidence that single-drug treatment with DAC prolongs the survival of patients with solid tumors. In our experiment, the survival rate of PC9 tumor-bearing mice treated with DAC was not significantly different from that of control mice. However, lymph node metastasis was lower in the treatment group than in the control group, which may reflect DAC-induced inhibition of EMT. Our findings suggest that a better understanding of the effect of epigenetic agents on EMT may improve treatment for NSCLC.
Acknowledgment
This study was supported by grants from the National Natural Science Foundation of China (Grant Nos 81372506 and 81401897).
Disclosure
The authors report no conflicts of interest in this work.
References
World Health Organization. Cancer fact sheet. [updated February 2015]. Available from: http://www.who.int/mediacentre/factsheets/fs297/en/. Accessed December 29, 2016. | ||
Siegel RL, Miller KD, Jemal A. Cancer statistics, 2016. CA Cancer J Clin. 2016;66(1):7–30. | ||
Kalluri R, Weinberg RA. The basics of epithelial-mesenchymal transition. J Clin Invest. 2010;120(5):1786. | ||
Thiery JP. Epithelial–mesenchymal transitions in tumour progression. Nat Rev Cancer. 2002;2(6):442–454. | ||
Yang J, Weinberg RA. Epithelial-mesenchymal transition: at the crossroads of development and tumor metastasis. Dev Cell. 2008;14(6): 818–829. | ||
Zeisberg M, Neilson EG. Biomarkers for epithelial-mesenchymal transitions. J Clin Invest. 2009;119(6):1429–1437. | ||
Thiery JP, Acloque H, Huang R, Nieto MA. Epithelial-mesenchymal transitions in development and disease. Cell. 2009;139(5):871–890. | ||
Acloque H, Adams MS, Fishwick K, Bronner-Fraser M, Nieto MA. Epithelial-mesenchymal transitions: the importance of changing cell state in development and disease. J Clin Invest. 2009;119(6):1438–1449. | ||
Polyak K, Weinberg RA. Transitions between epithelial and mesenchymal states: acquisition of malignant and stem cell traits. Nat Rev Cancer. 2009;9(4):265–273. | ||
Derynck R, Akhurst RJ. Differentiation plasticity regulated by TGF-β family proteins in development and disease. Nat Cell Biol. 2007;9(9): 1000–1004. | ||
Wakefield LM, Roberts AB. TGF-β signaling: positive and negative effects on tumorigenesis. Curr Opin Genet Dev. 2002;12(1):22–29. | ||
Gregory PA, Bert AG, Paterson EL, et al. The miR-200 family and miR-205 regulate epithelial to mesenchymal transition by targeting ZEB1 and SIP1. Nat Cell Biol. 2008;10(5):593–601. | ||
Vrba L, Jensen TJ, Garbe JC, et al. Role for DNA methylation in the regulation of miR-200c and miR-141 expression in normal and cancer cells. PLoS One. 2010;5(1):e8697. | ||
Neves R, Scheel C, Weinhold S, et al. Role of DNA methylation in miR-200c/141 cluster silencing in invasive breast cancer cells. BMC Res Notes. 2010;3:219. | ||
Wiklund ED, Bramsen JB, Hulf T, et al. Coordinated epigenetic repression of the miR-200 family and miR-205 in invasive bladder cancer. Int J Cancer. 2011;128(6):1327–1334. | ||
Choi SH, Byun HM, Kwan JM, Issa PJ, Yang AS. Hydroxycarbamide in combination with azacitidine or decitabine is antagonistic on DNA methylation inhibition. Br J Haematol. 2007;138(5):616–623. | ||
Yoshiura K, Kanai Y, Ochiai A, Shimoyama Y, Sugimura T, Hirohashi S. Silencing of the E-cadherin invasion-suppressor gene by CpG methylation in human carcinomas. Proc Natl Acad Sci U S A. 1995;92(16):7416–7419. | ||
Corn PG, Smith BD, Ruckdeschel ES, Douglas D, Baylin SB, Herman JG. E-cadherin expression is silenced by 5′ CpG island methylation in acute leukemia. Clin Cancer Res. 2000;6(11):4243–4248. | ||
Nam JS, Ino Y, Kanai Y, Sakamoto M, Hirohashi S. 5-Aza-2′-deoxycytidine restores the E-cadherin system in E-cadherin-silenced cancer cells and reduces cancer metastasis. Clin Exp Metastasis. 2004; 21(1):49–56. | ||
Park SM, Gaur AB, Lengyel E, Peter ME. The miR-200 family determines the epithelial phenotype of cancer cells by targeting the E-cadherin repressors ZEB1 and ZEB2. Genes Dev. 2008;22(7):894–907. | ||
Wang Z, Li Z, Wang Y, et al. Versican silencing improves the antitumor efficacy of endostatin by alleviating its induced inflammatory and immunosuppressive changes in the tumor. Oncol Rep. 2015;33(6): 2981–2991. | ||
Roberts AB, Sporn MB. The transforming growth factor-βs. Peptide Growth Fact Recept I. 1990;95(1):419–472. | ||
Gregory JH, Andrew JC, Simon DS, Graham JB. Overexpression of the microRNA hsa-miR-200c leads to reduced expression of transcription factor 8 and increased expression of E-cadherin. Cancer Res. 2007:67:7972–7976. | ||
Craene DB, Berx G. Regulatory networks defining EMT during cancer initiation and progression. Nat Rev Cancer. 2013;13(2):97–110. | ||
Shan B, Yao T, Nguyen HT, et al. Requirement of HDAC6 for transforming growth factor-β1-induced epithelial-mesenchymal transition. J Biol Chem. 2008;283(30):21065–21073. | ||
Davalos V, Moutinho C, Villanueva A, et al. Dynamic epigenetic regulation of the microRNA-200 family mediates epithelial and mesenchymal transitions in human tumorigenesis. Oncogene. 2012;31(16):2062–2074. | ||
Akhurst RJ, Derynck R. TGF-β signaling in cancer–a double-edged sword. Trends Cell Biol. 2001;11(11):S44–S51. | ||
Pardali K, Moustakas A. Actions of TGF-β as tumor suppressor and pro-metastatic factor in human cancer. Biochim Biophys Acta. 2007; 1775(1):21–62. | ||
Gollob JA, Sciambi CJ, Peterson BL, et al. Phase I trial of sequential low-dose 5-aza-2′-deoxycytidine plus high-dose intravenous bolus interleukin-2 in patients with melanoma or renal cell carcinoma. Clin Cancer Res. 2006;12(15):4619–4627. | ||
Gibbons DL, Lin W, Creighton CJ, et al. Contextual extracellular cues promote tumor cell EMT and metastasis by regulating miR-200 family expression. Genes Dev. 2009;23(18):2140–2151. | ||
Shien K, Toyooka S, Yamamoto H, et al. Acquired resistance to EGFR inhibitors is associated with a manifestation of stem cell–like properties in cancer cells. Cancer Res. 2013;73(10):3051–3061. | ||
Zhou X, Wang Y, Shan B, et al. The downregulation of miR-200c/141 promotes ZEB1/2 expression and gastric cancer progression. Med Oncol. 2015;32(1):428. | ||
Issa JJ, Gharibyan V, Cortes J, et al. Phase II study of low-dose decitabine in patients with chronic myelogenous leukemia resistant to imatinib mesylate. J Clin Oncol. 2005;23(17):3948–3956. | ||
Serrano A, Tanzarella S, Lionello I, et al. Rexpression of HLA class I antigens and restoration of antigen-specific CTL response in melanoma cells following 5-aza-2′-deoxycytidine treatment. Int J Cancer. 2001;94(2):243–251. | ||
Weiser TS, Sheng GZ, Ohnmacht GA, et al. Sequential 5-Aza-2′-deoxycytidine-depsipeptide FR901228 treatment induces apoptosis preferentially in cancer cells and facilitates their recognition by cytolytic T lymphocytes specific for NY-ESO-1. J Immunother. 2001; 24(2):151–161. | ||
Coral S, Sigalotti L, Altomonte M, et al. 5-aza-2′-deoxycytidine-induced expression of functional cancer testis antigens in human renal cell carcinoma: immunotherapeutic implications. Clin Cancer Res. 2002; 8(8):2690–2695. |
Supplementary materials
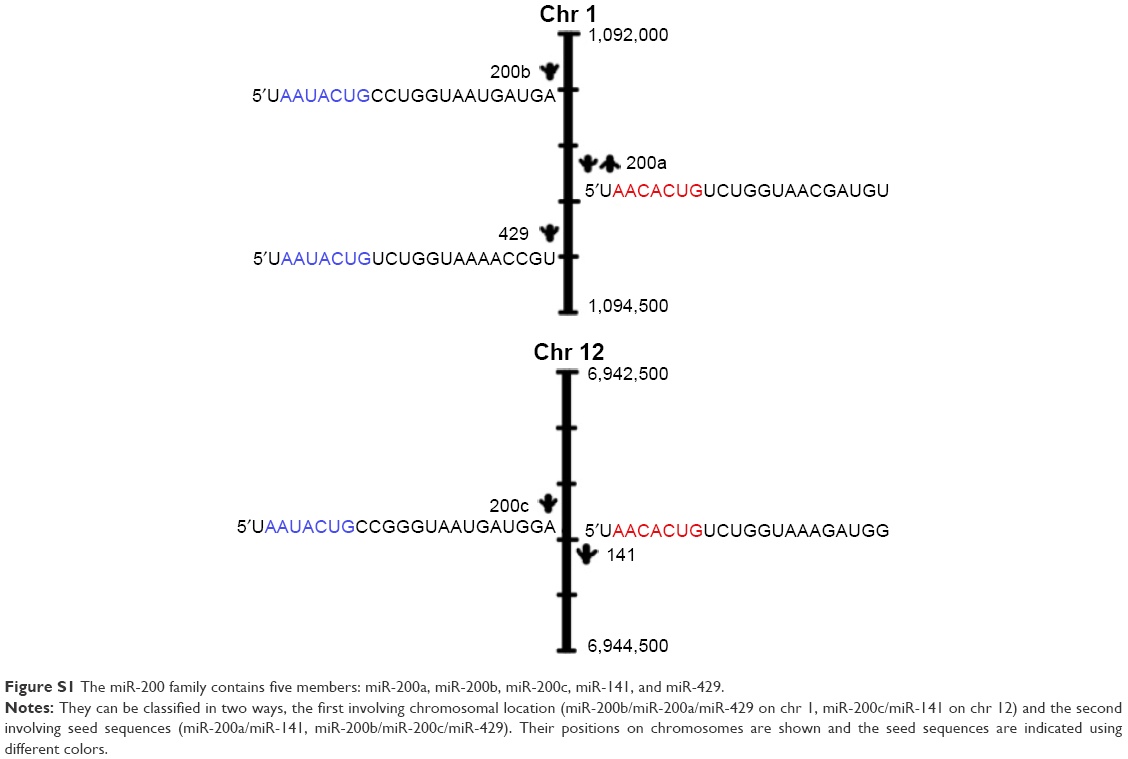 | Figure S1 The miR-200 family contains five members: miR-200a, miR-200b, miR-200c, miR-141, and miR-429. |
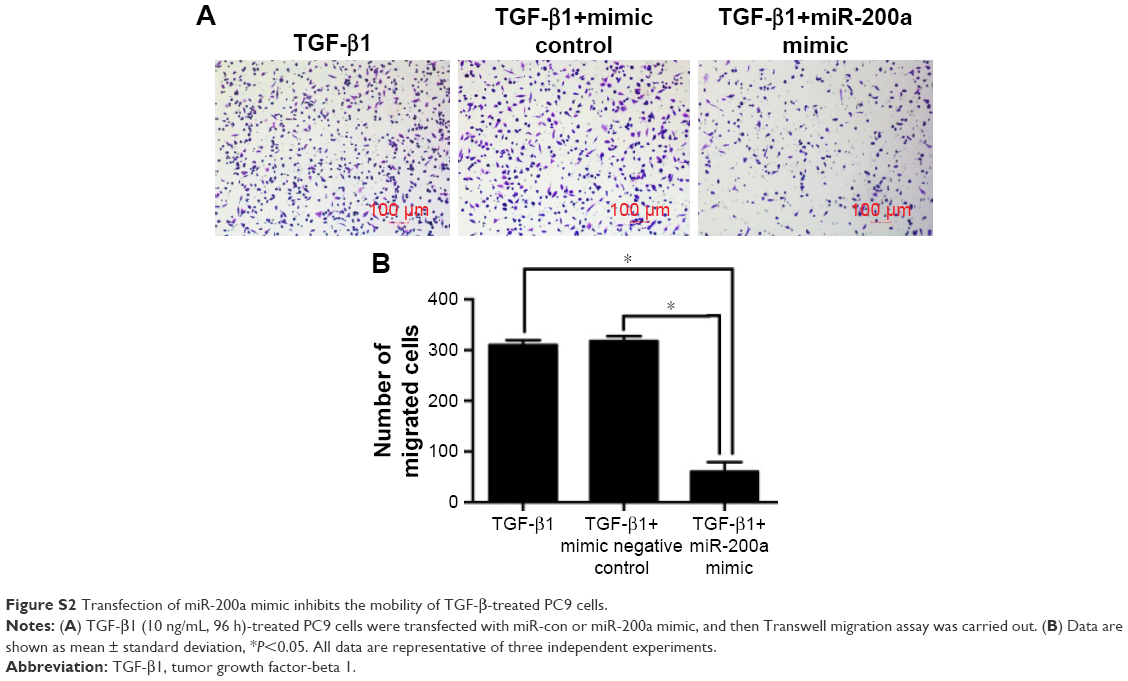 | Figure S2 Transfection of miR-200a mimic inhibits the mobility of TGF-β-treated PC9 cells. |
 © 2017 The Author(s). This work is published and licensed by Dove Medical Press Limited. The full terms of this license are available at https://www.dovepress.com/terms.php and incorporate the Creative Commons Attribution - Non Commercial (unported, v3.0) License.
By accessing the work you hereby accept the Terms. Non-commercial uses of the work are permitted without any further permission from Dove Medical Press Limited, provided the work is properly attributed. For permission for commercial use of this work, please see paragraphs 4.2 and 5 of our Terms.
© 2017 The Author(s). This work is published and licensed by Dove Medical Press Limited. The full terms of this license are available at https://www.dovepress.com/terms.php and incorporate the Creative Commons Attribution - Non Commercial (unported, v3.0) License.
By accessing the work you hereby accept the Terms. Non-commercial uses of the work are permitted without any further permission from Dove Medical Press Limited, provided the work is properly attributed. For permission for commercial use of this work, please see paragraphs 4.2 and 5 of our Terms.