")
Back to Journals » Journal of Inflammation Research » Volume 13
CytokineExplore: An Online Tool for Statistical Analysis of Cytokine Concentration Datasets
Authors Kassem O , Al-Saleh A , Azizieh F , Dingle K
Received 2 April 2020
Accepted for publication 17 July 2020
Published 31 July 2020 Volume 2020:13 Pages 401—410
DOI https://doi.org/10.2147/JIR.S253255
Checked for plagiarism Yes
Review by Single anonymous peer review
Peer reviewer comments 2
Editor who approved publication: Professor Ning Quan
Osama Kassem,1 Abdulwahab Al-Saleh,1 Fawaz Azizieh,2 Kamaludin Dingle2
1Department of Computer Science, Gulf University for Science and Technology, Hawally, Kuwait; 2Center for Applied Mathematics and Bioinformatics (CAMBIO), Department of Mathematics and Natural Science, Gulf University for Science and Technology, Hawally, Kuwait
Correspondence: Kamaludin Dingle
Center for Applied Mathematics and Bioinformatics (CAMBIO), Department of Mathematics and Natural Science, Gulf University for Science and Technology, Hawally 32093, Kuwait
Tel +965 2530 7488
Email [email protected]
Purpose: Cytokine data sets are increasing both in the number of different cytokines measured and the number of samples assayed. Further, typically data from different groups may be contrasted, eg, normal vs complication subjects. Many univariate and multivariate statistical techniques exist to study such cytokine datasets, but the ability to implement these techniques may be lacking for some practitioners, or may not be available quickly and conveniently. Here, we introduce CytokineExplore, an online tool for multi-cytokine and multi-group data analysis of user-provided Microsoft Excel data files.
Materials and Methods: In order to illustrate the tool features, we use data from intrauterine growth retardation (IUGR), a pregnancy complication, and normal healthy subjects as a control. The dataset contains levels for 10 cytokines, namely: IL-4, IL-6, IL-8, IL-10, IL-12, IL-13, IL-18, IL-23, interferon-gamma (IFN-γ) and tumour necrosis-alpha (TNF-α), obtained from 34 women with IUGR (further divided into 17 symmetric and 17 asymmetric cases) and 24 gestationally age-matched normal controls.
Results: The online tool automatically generates box-plots, histograms, PCA and PLSDA plots, t-tests and Mann–Whitney statistical tests, cytokine importance values for separating two groups, heatmaps for comparing multiple groups, and other functionalities. Figures generated can be directly downloaded for use in presentations or journal articles.
Conclusion: The tool facilitates quick and easy numerical exploration and multivariate analysis of cytokine datasets, to aid basic understanding and hypothesis generation.
Keywords: cytokines, data analysis, multivariate statistics, diagnostics, pregnancy complications, intrauterine growth retardation
Introduction
Cytokines are small protein signaling molecules produced by a variety of cells that have specific effects on interactions and communications. Within the immune system, cytokines play a pivotal role in the type and degree of immune response both in health and disease.1 Cytokines have also been proposed as potential biomarkers, with a lot of interest focused on finding their clinical cutoff levels.2 While it is known that cytokines are essential in many physiological processes such as pregnancy; a misbalance in their levels may contribute to a wide range of pathological conditions. Indeed, the range of pathological conditions reported with cytokine misbalances keeps expanding, with conditions ranging from rheumatoid arthritis, cancer, several pregnancy complications and many more.1–5 Thus cytokines have been proposed to be promising therapeutic agents. In fact, cytokines have been validated as being an effective and safe treatment method for several autoimmune diseases such as rheumatoid arthritis, inflammatory bowel diseases, multiple sclerosis, etc.5–8 It has also been suggested that cytokines can serve as disease markers or may be used to follow up on progression of the disease/therapy.2,5,8-10 Accordingly, there is enormous number of reports and studies that focuses on the level of single cytokines in a wide range of diseases.1,2,5,6,11-14
Th1 and Th2, the two major subsets of CD4+T helper cells have different patterns of cytokine production and different roles in immune responses.15 Th1 cells secrete interleukin-2 (IL-2), IL-6, IL-8, IL-12, IL-18, IL-23, interferon-gamma (IFN-γ), and tumour necrosis alpha (TNF-α); these inflammatory cytokines activate macrophages and cell-mediated immunologic reactions. Th2 cells secrete IL-4, IL-5, IL-10, and IL-13 which are predominantly anti-inflammatory cytokines and augment humoral immunity.15
Pregnancy is often referred to as “an immunological paradox” because tissue allograft are generally rejected by an immunocompetent host, while the conceptus in successful pregnancy, the so-called “fetal allograft”, is not only not rejected but further nourished by the maternal immune system.16,17
To ascertain the possible roles of cytokines in pregnancy, we and others have compared cytokine balances in unexplained pregnancy complications such as recurrent spontaneous miscarriage (RSM), pregnancy-induced hypertension (PIH), and intrauterine growth restriction (IUGR), to gestational-age-matched healthy normal pregnant women that ended with normal spontaneous vaginal delivery. Data both from human subjects as well as studies on animal models of pregnancy have led to the proposition that successful pregnancy is a T helper 2 phenomenon, while several unexplained pregnancy complications are associated with an elevated Th1-type cytokine profile.11–13,18–25
Intrauterine growth restriction (IUGR) refers to the condition where the fetus fails to grow normally during pregnancy (less than the 10th percentile of comparable normal gestational age as per the population growth charts). Such a condition puts the child under risk of many acute neonatal problems as well as many other long-term complications.26 Intrauterine growth restriction can be further classified as symmetric IUGR (without placental insufficiency) or asymmetric IUGR (with placental insufficiency). In symmetric IUGR, the antenatal scan shows head circumference, abdominal circumference, biparietal diameter and femur length all proportionally reduced, while in asymmetric IUGR only the abdominal circumference decreased while others are normal.26 The period of harm in symmetric IUGR is early in the gestation, with etiology proposed to be from a genetic disorder or infection intrinsic to the foetus, with placentas of such pregnancies usually small by weight, but having no other pathologies.27 On the other hand, asymmetric IUGR occurs later in gestation with uteroplacental insufficiency and significant placental pathological findings.28 It is further reported that a definite cause of IUGR is not identified in 40–50% of all cases,29 leaving a broad margin to search for immunological causes such as cytokine imbalance to be potential contributor in IUGR.4,11,13
Cytokine networks are among the densest and most complex networks studied in biology, which keep getting ever more complex as we discover new ones. Cytokines interact with one another via their signal transduction pathways with effects ranging from synergy to inhibitory actions. These cytokine connections and balances determine the immune response as well as its biological consequences. Efforts to uncover the underlying network architecture of the balance, therefore, remain ongoing. The number of studies that have reported levels of individual cytokines in different conditions is enormous, but may be insufficient unless data are further analysed to describe the full architecture as a “signed” by the profiles of the several cytokines produced simultaneously.10,30-33
Until recently, measuring multiple cytokines was both expensive and required analyzing relatively large volumes of biological fluid. Nowadays, however, multiplex arrays have made measuring tens and even hundreds of cytokines at the same time less expensive and easier. Due to these factors, increasingly in the literature, concentration values for many different cytokines are reported, and also for different groups. Despite this, analyzing and understanding these huge and complex datasets still requires much work, and in some cases a significant level of computational and statistical ability.
Despite the importance of cytokine data analysis, and frequency with which medical practitioners and researchers are required to implement such analysis, to our knowledge, there does not exist a convenient and freely available platform for quickly implementing these statistical techniques. Further, while many software packages have in-built functions for the kinds of techniques relevant to immunology, some practitioners may not be familiar with how to use these, via writing computer code programs.
With these points in mind, here we introduce a user-friendly statistical tool that can provide univariate and multivariate analysis to aid researchers in quantitative analysis of cytokine datasets. The online tool is called CytokineExplore and can be accessed via http://exabx.com/apps/cytokineexplore/, free of charge.
CytokineExplore automatically generates box-plots, histograms, PCA and PLSDA plots, t-tests and Mann–Whitney statistical tests, cytokine importance values for separating groups, heatmaps for comparing multiple groups, and other functionalities. After uploading a user-provided Microsoft Excel file of cytokine data, users can select the cytokines and groups they wish to analyse. Which graphs and calculations are implemented by the tool depends partly on how many groups are selected, ie, whether studying only one group, contrasting two groups, or comparing several groups at once.
We illustrate the use of the tool by using some previously published data relating to intrauterine growth retardation (IUGR) patients as an example dataset,11 and provide some example output figures also. This data is used here only for demonstration of some of the tool functionalities and features, hence we are not attempting to make any novel biological/medical research claims in relation to IUGR. In total, the example dataset comprises concentration values of 10 cytokines (IL-4, IL-6, IL-8, IL-10, IL-12, IL-13, IL-18, IL-23, interferon-gamma (IFN-γ) and tumour necrosis-alpha (TNF-α)) for 34 cases of IUGR pregnancies and 24 cases of gestationally age-matched normal pregnant women (controls). We use the normal and IUGR (combined cases) to illustrate two-group results. In order to illustrate multi-group comparisons, the IUGR samples are further divided into two groups, corresponding to 17 symmetric and 17 asymmetric IUGR case samples. Hence, normal, symmetric, and asymmetric groups are contrasted simultaneously.
In developing this tool, two avenues of use are envisioned: Firstly, it can be employed for exploratory analysis of small data sets (eg, in a pilot study), because the tool returns a large variety of different computations and figures, which may alert the user to some noteworthy aspect of the data. By viewing many different perspectives of the data, hypotheses may be generated, to be tested later with more data (which should be a different independent data set, to avoid “overfitting” or “p-hacking”34). Secondly, the tool may be used simply as a quick and convenient way to generate graphs and perform some basic statistical calculations, testing previously proposed hypotheses, thereby alleviating the need for the user to perform these time-consuming activities themselves.
Materials and Methods
IUGR Data
This is a repost of a previously published dataset,11 in which supernatants of mitogen-stimulated peripheral blood lymphocytes were analyzed for a selected panel of cytokines. The panel included Th1-type (IL-6, IL-8, IL-12, IL-18, IL-23, IFN-γ and TNF-α) and Th2-type (IL-4, IL-10, and IL-13) cytokines.
Data Analysis
The statistical analyses aspect of the underlying code of the tool was written using Python, and the Python machine learning library scikit-learn.35
Results
Data Files
On accessing CytokineExplore via the website, users are prompted to upload a file of numerical cytokine concentration data, which must be a Microsoft Excel file. Data in the file should be formatted such that the first column contains the group names (eg, “Normal”), and the following columns should contain the cytokine concentration values (assumed as pg/mL). The first row of each column should state the cytokine name, eg, “IL-6”. The rows of the file correspond to each data sample/subject. An example Excel data file is downloadable from the website, which can help the user to arrange their data appropriately. Also, a user guide is provided on the site for added instructions. Missing data values and zero/undetectable concentration values can also be handled (see below) in the uploaded file.
Selecting Cytokines and Groups
After submitting the file, users are prompted to select which of the cytokines in the file they wish to include in the statistical analysis. Typically, all would be included, but if the user already knows which cytokines are relevant to some given medical condition/investigation, then it would be better to reduce the number of cytokines in the analysis to only those. In general, even with sophisticated multivariate techniques, including fewer relevant variables increases the accuracy of statistical calculations, as compared to including a large range of mainly irrelevant variables, which can introduce unwanted “noise” into the results.
Additionally, either one, two, or multiple groups can be selected out of possibly many different groups in the dataset. This facilitates either studying one group, or contrasting two or more groups. After analyzing the data, users can select different cytokines and/or groups using the “change parameters” button at the top of the results page. Alternatively, a new file of data can be submitted via the “upload new file” button also on the results page.
Data Pre-Processing
The data is pre-processed in several ways before statistical analysis is performed and figures are generated:
If any negative (ie, mistaken/impossible values) concentration values are detected, then these are excluded, and the relevant row and value are displayed on the right side of the results page, so that the user can identify the erroneous value. Any non-numerical values (eg, text) are also excluded and similarly highlighted on the results page. If any values are missing, these are imputed with the median value of the relevant cytokine values of the relevant group.
Users can choose whether to perform calculations and display graphs for concentration values either in a log10 transformed scale, or a simple linear scale. We suggest that the log10 scale should be used, because it is a more natural scale on which to study concentrations which vary over many orders of magnitude. Log scales are also common in the literature. Despite these points, some users may be more familiar with a linear scale, and hence it is given as an option.
Due to the use of logarithms, zero concentration values cannot be handled. So, any concentration value recorded as zero (ie, below detectable level) is replaced with the minimum non-zero value for that cytokine within the dataset, which is quite common both in medicine and other areas of science.36,37 In principle, there can be cases in which replacing by minimum detectable levels may cause strong distortions to the data.36 However, this is very unlikely in our cytokine concentration datasets, because the range of concentration values is far larger than the minimum detectable levels, and hence only a very small perturbation to the data will result from replacing zeros. For example, in our IUGR data set for IL-4, the non-zero values range from 0.79 to 63.46, and so replacing 0 values with 0.79 is a very small modification of the data. For other cytokines, the concentration ranges are even larger, in the >1000 pg/mL or more, and hence the replacement is even less problematic.
For the principal component analysis (PCA) and partial least squares discriminant analysis (PLSDA) plots described below, the log10 transformed data are also centered and scaled in the standard way, by subtracting the mean value of each cytokine and dividing by the standard deviation. Note that it is especially important that the PCA and PLSDA plots should use logarithmically transformed data, to reduce the skew in concentration values. Hence, while other plots such as boxplots can be viewed on a linear scale, the tool only displays the PCA and PLSDA in a logarithmic transformed and scaled form.
Graphs Generated and Tool Features
The types of graphs generated and analyses performed by CytokineExplore depend partly on the number of groups which the user has chosen to study. We now outline the main functionalities implemented for different numbers of groups.
Single Group Analysis
After uploading a Microsoft Excel file, if only one group is selected for analysis, then the following are computed/generated:
Boxplots and histograms of concentration values are displayed, with summary statistics (mean, median, IQR, etc.) of the log10 or linear values. These plots can help to identify features of the distributions of concentrations, such as whether they look roughly uni- or multi-modal, whether there are outliers in the data, and whether the distributions are roughly normal or very skewed.
Correlation plots of pairs of cytokines are shown, with the Pearson linear correlation coefficient displayed in the titles of each plot. These can help to identify relations between cytokines. Because there are n(n-1)/2 pairs for n cytokines, the number of plots would become very large if n is large. Hence, correlation plots are only displayed for at most 15 pairs, in particular those ones with the strongest correlations.
A Principal Component Analysis (PCA) plot is generated which shows a projection (or “shadow”) of multivariate data onto only two axes/components, where the projection is chosen by the PCA method to maximize the variance in the data projection. The PCA plot may help to visually reveal clusters/subgroups in the data, possible outliers, or other noteworthy qualitative features of the multivariate data. In addition to the PCA plot, also the actual makeup of the first two components is given, ie, the contribution of each cytokine to the components.
Two-Group Analysis
If two groups are selected for analysis, then the following are computed/generated:
As in the single group case, a Principal Component Analysis (PCA) plot is made, showing the projection of the multi-cytokine data onto only two axes/components, with the two groups colored and symbolized differently.
A Partial Least Squares Discriminant Analysis (PLSDA) plot is made, showing the projection of the multi-cytokine data onto only two axes/components, with the two groups colored and symbolized differently. PLSDA is used when partial least squares regression is applied to problems with categorical outputs (eg, normal vs sick). A PLSDA plot is quite similar to a PCA plot, but differs in that the PLSDA plot projection is chosen by the algorithm to maximize the difference between the two groups (as opposed to maximizing the variance of the projected data, like in PCA). The axes are labelled LV1 (latent variable 1) and LV2 (latent variable 2). Hence, two groups may in principle look very similar in a PCA plot with points overlapping strongly, but possibly very different in a PLSDA plot with little overlap. Viewing this plot can help to identify whether and to what extent two groups differ: If the data points of the two groups overlap strongly, then this would suggest that the two groups have similar cytokine profiles. On the other hand, if the data points barely overlap, then this would indicate that the groups have very different profiles. As a cautionary note, if the number of samples is very low and the number of cytokines is large, then a PLSDA plot can tend to exaggerate the difference between the groups.
A variable/cytokine importance plot is also displayed when two groups are selected, which gives a quantitative measure of the relative contribution, or importance, of each cytokine in discriminating/separating two contrasted groups. Larger magnitude importance values indicate a greater contribution, and the importances are signed + or -, so that it is clear whether a cytokine is up or down regulated in each group, relative to the other. Because the importances are based on the PLSDA multivariate method, if groups are distinguished by multi-cytokine combinations of values and not simply individual value differences, then these can also be detected.
The importance values are derived from a linear PLSDA matrix model, via the equation Y=X*b +z, where X is the data matrix (ie, a matrix whose rows correspond to each subject, and whose columns represent the different cytokines), b is a column vector of the model coefficients (which represent the contribution of each cytokine to distinguishing the groups), and z the error term vector, which accounts for errors in the binary classification model predictions. The column vector Y of outputs represents the groups (e.g. healthy and sick), so that Y contains 0 and 1 value binary outputs only. The model coefficients vector b can be interpreted as variable importances, because if one cytokine is up-regulated for the group labelled `1ʹ, then the corresponding element of b will be positive, and negative if down-regulated. On the other hand, the corresponding element of b will be close to zero, in the case of a cytokine neither being up nor down-regulated between the two groups.
Finally, side-by-side boxplots comparing individual cytokines between the two groups are given to help visualize which cytokines differ, and how strongly, between the groups. Also displayed with each boxplot figure is the p-value from either a t-test or a Mann–Whitney U two-sided test, testing for a statistical difference between the cytokine concentration values of the two groups. The tool first performs a test to determine whether the concentration values follow normal distributions or not, and hence whether to use the t-test, or the non-parametric test Mann–Whitney U-test.
Multi-Group Analysis
If three or more groups are selected for analysis, then the following are computed/generated:
As in the previous group cases, a Principal Component Analysis (PCA) plot is made, showing the projection of the multi-cytokine data onto only two axes/components, with the two groups colored differently.
Side-by-side boxplots comparing individual cytokines between the groups are given to help visualize which cytokines differ, and how strongly, between the groups.
A heatmap is displayed, which offers a way to compare multiple groups simultaneously. In more detail, for each cytokine, a heatmap is generated which shows how strongly each group differs from all other groups in terms of the mean log10 concentration values in each group. The concentration differences are shown as a matrix of square panels, and colored such that the colors indicate how different each group is from another. If there are three groups, say, A, B and C, then the heatmap will depict a 3 by 3 grid of panels showing the concentration differences between all possible pairs, ie, A vs B, A vs C, etc.
Downloading Figures
The tool generates many figures, and users may wish to include some of these in presentations and/or journal articles, etc. Hence, figures can be downloaded in two ways. Firstly, the figures displayed in the results page can be downloaded directly via the “Download plot as png” button (shown as a camera sign) above each figure on the results page. Secondly, if journal publication-quality figures are required, then a.zip file of high resolution/production.jpg figures can be downloaded via the “Download analysis” button at the top of the results page.
Example Graphs and Output Using Some Sample IUGR Data
We now give some example output from CytokineExplore, illustrating some of the most noteworthy features only. Because we are only illustrating some features, and because this article is not attempting to make an immunological investigation into IUGR, we will examine only a small fraction of the possible group combinations, cytokines choices, and statistical results. Our choice of the groups, cytokines and results is motivated only by how best to demonstrate the tools features, not by biological/medical concerns. Alongside the sample output, we also highlight some inferences which can be made from the figures, and points which a user should consider when examining their own plots.
In the following, we use a previously published dataset for 10 cytokines (described above). We primarily look at contrasting two groups, namely data from 24 normal healthy pregnancies and from 34 women suffering IUGR (ie, symmetric and asymmetric cases combined). We also give an example of a heatmap which shows how to compare three groups at once, namely IUGR (symmetric), IUGR (asymmetric) and normal healthy pregnancies.
The following figures were obtained from the tool via the “download analysis” button, mentioned above. We used the logarithmic scaled data for these plots.
Example Contrasting IUGR and Normal Samples
Figure 1 shows a PCA plot of the combined IUGR and normal data samples. Note that the axes values have been centered, scaled, and log10 transformed (see Data pre-processing), and hence the values can be negative. There is no apparent evidence of clusters within the groups, although even in this PCA plot it is very clear that the two groups have different cytokine profiles, because their projected data points barely overlap. Nor is there evidence of any clear outliers, which might be identified as points that sit far away from the others of their group.
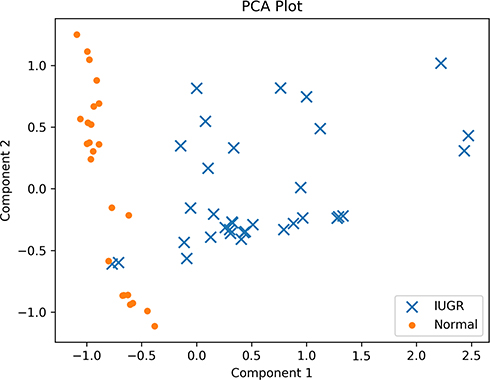 |
Figure 1 PCA plot of the IUGR and normal subjects’ data. There does not appear to be evidence of clusters within the groups, nor strongly outlying data values. |
In Figure 2, a PLSDA plot for the normal vs IUGR is presented. It is visually clear that the two groups have very different cytokine profiles, as evidenced by the fact that the data points of the two groups barely overlap. Indeed, except for one or two IUGR points which appear close to the normal points, the two groups are almost completely separable.
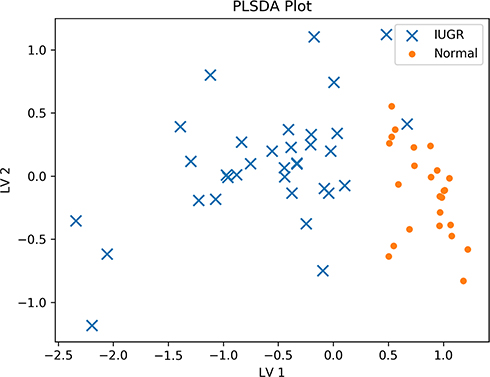 |
Figure 2 PLSDA plot of the IUGR and normal subjects’ data. The groups have strongly differing profiles, and the data samples barely overlap. |
Having seen that the two groups are different, it is natural to wonder which cytokines are most responsible for the difference. By examining Figure 2, it is not clear which cytokines, nor how many, differ between the groups. For example, it may be that only one cytokine differs strongly, or it may be that none are individually very different, but the combined multi-cytokine profile of all the cytokines yields the stark difference in Figure 2.
To address this question, we now turn to Figure 3 which shows a variable/cytokine importance plot, quantifying the contribution of each cytokine to separating the groups. It is clear that not all the cytokines contribute equally to separating the groups, but rather IL-23, IL-18 and IL-12 differ most strongly between the two groups (as inferred from the fact that they have the longest bars). Further, we can see that IL-23 and IL-18 tend to upregulated in the normal group, as compared to the IUGR group, while IL-12 is downregulated in the IUGR group. Note that the user can obtain the exact importance values themselves via the results page, by the user hovering their mouse pointer over the relevant figure.
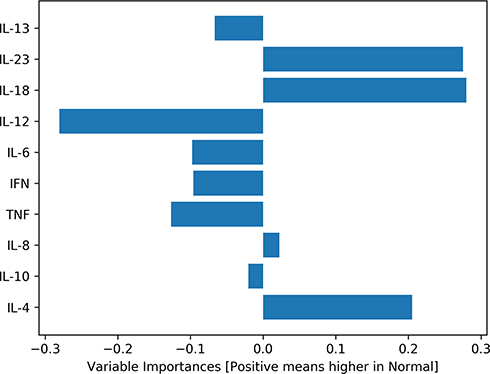 |
Figure 3 Variable/cytokine importance plot for IUGR and normal subjects’ data. Cytokines differ in their degree of contribution to separating the groups. |
We just saw that, among other cytokines, IL-23 is an important player in separating the groups. Hence, it will be interesting to look more closely at this cytokine. While the results page shows boxplots for all 10 cytokines included in this analysis, for this example, we display only IL-23’s boxplot in Figure 4. As expected from the variable importance analysis, the boxplots in Figure 4 show very pronounced differences for the two groups. Additionally, the tool returns p-value = 0.00 from the Mann–Whitney two-tailed test for IL-23, suggesting strong statistical significance for the difference in concentration values of this cytokine, between the two groups. Note that the distributions failed a test for normal distributions, and hence a t-test was not used.
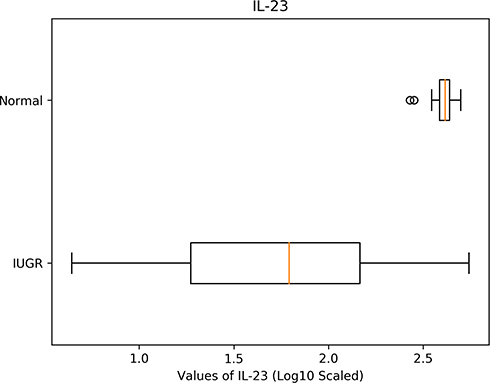 |
Figure 4 A boxplot for contrasting the log10 concentration values of IL-23 for normal and IUGR subjects. |
Example Contrasting Symmetric, Asymmetric and Normal Samples
If multiple groups are selected for comparison, several graphs and generated, including a PCA plot and boxplots, and heatmaps. Because we have already given a PCA and boxplot example above, here we will only present an example of a heatmap, obtained via comparing three groups, namely IUGR symmetric, IUGR asymmetric, and normal pregnancies. From among the 10 cytokines, we will choose IL-18 for the heatmap (chosen only for illustrative purposes). Figure 5 shows that for this cytokine, the asymmetric and symmetric IUGR groups have similar values average values (indicated by the dull green colors), while the normal group is very different to both the asymmetric and symmetric IUGR groups (as indicated by the strong bright yellow/green and very dark blue). In addition to the colorings, the actual differences in average log10 values are given in each panel. Note that the diagonal panels in the heatmap will always be zero, simply due to computing the difference between a group with itself, which is zero. As can be seen, the heatmap’s use of colors and panels make for easy visual comparison, which is especially beneficial if many groups are to be contrasted.
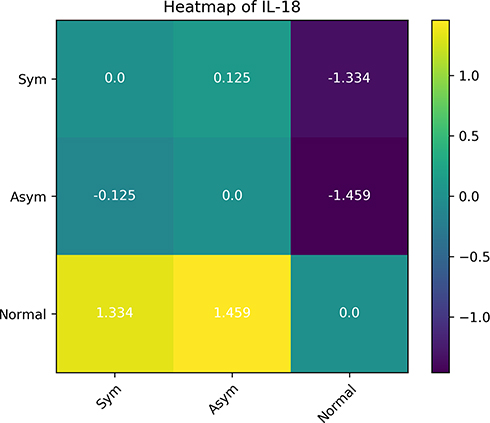 |
Figure 5 A heatmap for contrasting the mean log10 concentration values of IL-18 for normal, symmetric and asymmetric IUGR subjects. It is clear that the symmetric (Sym) and asymmetric (Asym) IUGR groups are similar for this cytokine, whereas the normal group is very different to the two IUGR groups. |
Discussion and Conclusion
We have introduced a tool for statistical analysis of cytokine data. The tool allows quick and easy calculations of a range of statistical techniques for user-provided data. While we used this tool for cytokines, the tool could be used for data with similar situations where parameters and groups may be studied via a comprehensive picture/balance of importance. Hence, the tool or extensions of it could in principle be used for other applications in quantitative medicine.
The example presented in this communication is intrauterine growth retardation (IUGR). This data has been previously published11 and is used here only for demonstration of some of the tool functionalities and features. In the earlier published communication,11 focusing on the level of single cytokines, we reported that IL-8 was produced at higher levels by blood cells of the IUGR group than normal pregnant women, while IL-13 and IL-23 were produced at lower levels.11 Using the CytokineExplore tool, several extra pieces of significant information can be obtained and used for further analysis or research. It worth highlighting that the findings from the CytokineExplore tool are based on the multivariate analysis of all cytokines studied rather than single ones. Also, we found earlier that IUGR vs normal samples were significantly different, while for symmetric vs asymmetric IUGR cases, we did not find a significant difference.11 This earlier finding was reflected in the heatmap multi-group comparison of normal, symmetric vs asymmetric IUGR cases examined here.
The PCA plot shows no clusters within the IUGR and normal delivery groups while showing clearly that the two groups have very different cytokine profiles, with no outliers. To further understand the use of this information, one may refer to the data earlier published where the PCA analysis showed cytokine profiles in pregnancy-induced hypertension (PIH) were made up of two clusters, one with multivariate cytokine profile that is similar to healthy controls, while the other is quite distinct.10 This method of analysis and the findings may help in explaining the long and wide controversy in literature about the association of different cytokines in different pregnancy complications or other conditions. Again with PIH as an example, while there is substantial evidence supporting a role of cytokines in the pathogenesis of PIH, the underlying pathophysiologic mechanisms are still unclear with several proposed pathways.38 In the example IUGR data used in this communication, the PCA plot shows no subgroups present. In other words, PCA analysis would help in further understanding if the group under study is made of one or more subsets, where contributing factors to the pathogenesis may be different.
Both the PCA and PLSDA show that the IUGR and normal delivery groups are different in the cytokine as a profile (Figure 2). In other datasets, it may be that none of the cytokines are individually very different, but the combined multi-cytokine profile of all the cytokines yields some difference, which again is worth further study.
What is more, and looking to the possibility of clinical applications, it would be interesting to uncover which of the cytokines involved most contribute to the deviation from the normal physiological cytokine balance. This information is not clear when analyzing data based on single cytokines. Figure 3 shows that IL-23, IL-18 and IL-12 differ most strongly between the two groups in the example data used. Such information may be valuable for further pathophysiological, diagnostic or even immunomodulation studies and may also suggest a pattern that can be used as a predictive tool to follow the progression and prognosis of the disease.3,10,17,31-33,39
Some limitations of the tool are that it performs only a battery of predetermined functions, whereas users may require more bespoke operations for some given investigation. If these are required, then the user would need to implement these themselves. There is also a risk of users not being familiar with the best practices for interpreting the results of the tool. However, this may be ameliorated by some further statistical education.
We hope that the introduction of CytokineExplore will motivate the development of other similar tools for other computational tasks in immunology and biology. For example, we recently showed33 that sophisticated multivariate tools for outlier analysis could be directly applied to cytokine data, detecting anomalous cytokine profiles, and developing signatures. Nonetheless, the potential inability to implement such tools would inhibit application of these findings. Hence, a similar tool for such to ours, for such analysis – and other analysis – would be beneficial to the immunological community, and medical researchers more generally.
Acknowledgments
We would like to thank E. Juaréz for comments on an early version of the tool. We acknowledge The Kuwait Foundation for the Advancement of Sciences (KFAS) for funding (grant number P115-12SL-06).
Disclosure
The authors report no conflicts of interest in this work.
References
1. O’Shea JJ, Gadina M, Siegel RM. Cytokines and cytokine receptors. Clin immunol. 2019;127–155. e121.
2. Monastero RN, Pentyala S. Cytokines as biomarkers and their respective clinical cutoff levels. Int J Inflam. 2017;2017.
3. Raghupathy R, Kalinka J. Cytokine imbalance in pregnancy complications and its modulation. Front Biosci. 2008;13(13):985–994. doi:10.2741/2737
4. Raghupathy R, Al-Azemi M, Azizieh F. Maternal cytokine profiles in intra-uterine growth restriction (IUGR). Placenta. 2013;34(2):A91–A91.
5. Burska A, Boissinot M, Ponchel F. Cytokines as biomarkers in rheumatoid arthritis. Mediators Inflamm. 2014;2014:545493. doi:10.1155/2014/545493
6. Burmester GR, Feist E, Dörner T. Emerging cell and cytokine targets in rheumatoid arthritis. Nat Rev Rheumatol. 2014;10(2):77–88. doi:10.1038/nrrheum.2013.168
7. Opdenakker G, Van Damme J. Probing cytokines, chemokines and matrix metalloproteinases towards better immunotherapies of multiple sclerosis. Cytokine Growth Factor Rev. 2011;22(5):359–365. doi:10.1016/j.cytogfr.2011.11.005
8. Thompson C, Davies R, Choy E. Anti cytokine therapy in chronic inflammatory arthritis. Cytokine. 2016;86:92–99. doi:10.1016/j.cyto.2016.07.015
9. Dingle K, Zimek A, Azizieh F, Ansari A. Establishing a many-cytokine signature via multivariate anomaly detection. Sci Rep. 2019;9(1):9684.
10. Azizieh F, Dingle K, Raghupathy R, Johnson K, VanderPlas J, Ansari A. Multivariate analysis of cytokine profiles in pregnancy complications. Am J Reproduct Immunol. 2018;79(3):
11. Al-Azemi M, Raghupathy R, Azizieh F. Pro-inflammatory and anti-inflammatory cytokine profiles in fetal growth restriction. Clin Exp Obstetrics Gynecol. 2017;44(1):98–103.
12. Azizieh FY, Raghupathy RG. Tumor necrosis factor-alpha and pregnancy complications: a prospective study. Med Princ Pract. 2015;24(2):165–170. doi:10.1159/000369363
13. Raghupathy R, Al-Azemi M, Azizieh F. Intrauterine growth restriction: cytokine profiles of trophoblast antigen-stimulated maternal lymphocytes. Clin Dev Immunol. 2012;2012:734865. doi:10.1155/2012/734865
14. Azizieh F, Raghupathy R. IL-10 and pregnancy complications. CLIN EXP OBSTETRICS GYNECOL. 2017;44(2):252–258.
15. Romagnani S. T cell subpopulations. Chem Immunol Allergy. 2014;100(1662–2898(Electronic)):2548.
16. Racicot K, Kwon JY, Aldo P, Silasi M, Mor G. Understanding the complexity of the immune system during pregnancy. Am j Reprod Immunol. 2014;72(2):107–116. doi:10.1111/aji.12289
17. Chen SJ, Liu YL, Sytwu HK. Immunologic regulation in pregnancy: from mechanism to therapeutic strategy for immunomodulation. Clin Dev Immunol. 2012;2012:258391. doi:10.1155/2012/258391
18. Makhseed M, Raghupathy R, Azizieh F, Al-Azemi MM, Hassan NA, Bandar A. Mitogen-induced cytokine responses of maternal peripheral blood lymphocytes indicate a differential Th-type bias in normal pregnancy and pregnancy failure. Am J Reprod Immunol. 1999;42(5):273–281. doi:10.1111/j.1600-0897.1999.tb00101.x
19. Makhseed M, Raghupathy R, El-Shazly S, Azizieh F, Al-Harmi JA, Al-Azemi MM. Pro-inflammatory maternal cytokine profile in preterm delivery. Am J Reprod Immunol. 2003;49(5):308–318. doi:10.1034/j.1600-0897.2003.00038.x
20. Raghupathy R, Makhseed M, Azizieh F, Omu A, Gupta M, Farhat R. Cytokine production by maternal lymphocytes during normal human pregnancy and in unexplained recurrent spontaneous abortion. Hum Reprod. 2000;15(3):713–718. doi:10.1093/humrep/15.3.713
21. Raghupathy R, Makhseed M, El-Shazly S, Azizieh F, Farhat R, Ashkanani L. Cytokine patterns in maternal blood after premature rupture of membranes. Obstet Gynecol. 2001;98(1):122–126. doi:10.1016/s0029-7844(01)01408-9
22. Azizieh F, Raghupathy R, Makhseed M. Maternal cytokine production patterns in women with pre-eclampsia. Am J Reprod Immunol. 2005;54(1):30–37. doi:10.1111/j.1600-0897.2005.00278.x
23. El-Shazly S, Makhseed M, Azizieh F, Raghupathy R. Increased expression of pro-inflammatory cytokines in placentas of women undergoing spontaneous preterm delivery or premature rupture of membranes. Am J Reprod Immunol. 2004;52(1):45–52. doi:10.1111/j.1600-0897.2004.00181.x
24. Marzi M, Vigano A, Trabattoni D, et al. Characterization of type 1 and type 2 cytokine production profile in physiologic and pathologic human pregnancy. Clin Exp Immunol. 1996;106(1):127–133. doi:10.1046/j.1365-2249.1996.d01-809.x
25. Piccinni MP. T-cell cytokines in pregnancy. Am J Reprod Immunol. 2002;47(5):289–294. doi:10.1034/j.1600-0897.2002.01104.x
26. Sharma D, Shastri S, Sharma P. Intrauterine growth restriction: antenatal and postnatal aspects. Clin Med Insights Pediatr. 2016;10(CMPed):S40070. doi:10.4137/CMPed.S40070
27. Roberts DJ, Post MD. The placenta in pre-eclampsia and intrauterine growth restriction. J Clin Pathol. 2008;61(12):1254–1260. doi:10.1136/jcp.2008.055236
28. Resnik R, Creasy R, editors. Intrauterine growth restriction. USA: Saunders, Philadelphia, Pa, USA: 2004; Maternal Fetal Medicine: Principles and Practice.
29. Seifer DB, Samuels P, Kniss DA. The Physiologic Basis of Gynecology and Obstetrics. Williams & Wilkins; 2001.
30. Davis JM, Knutson KL, Strausbauch MA, et al. Analysis of complex biomarkers for human immune-mediated disorders based on cytokine responsiveness of peripheral blood cells. J Immunol. 2010;184(12):7297–7304. doi:10.4049/jimmunol.0904180
31. Azizieh FY, Al Jarallah K, Shehab D, Gupta R, Dingle K, Raghupathy R. Patterns of circulatory and peripheral blood mononuclear cytokines in rheumatoid arthritis. Rheumatol Int. 2017;37(10):1727–1734. doi:10.1007/s00296-017-3774-6
32. Raphael I, Nalawade S, Eagar TN, Forsthuber TG. T cell subsets and their signature cytokines in autoimmune and inflammatory diseases. Cytokine. 2015;74(1):5–17. doi:10.1016/j.cyto.2014.09.011
33. Dingle K, Zimek A, Azizieh F, Ansari AR. Establishing a many-cytokine signature via multivariate anomaly detection. Sci Rep. 2019;9(1):9684. doi:10.1038/s41598-019-46097-9
34. Head ML, Holman L, Lanfear R, Kahn AT, Jennions MD. The extent and consequences of p-hacking in science. PLoS Biol. 2015;13(3):3. doi:10.1371/journal.pbio.1002106
35. Pedregosa F, Varoquaux G, Gramfort A, et al. Scikit-learn: machine learning in Python. J Mach Learn Res. 2011;12:
36. Martín-Fernández JA, Barceló-Vidal C, Pawlowsky-Glahn V. Dealing with zeros and missing values in compositional data sets using nonparametric imputation. Math Geol. 2003;35(3):253–278. doi:10.1023/A:1023866030544
37. Boerrigter D, Weickert TW, Lenroot R, et al. Using blood cytokine measures to define high inflammatory biotype of schizophrenia and schizoaffective disorder. J Neuroinflammation. 2017;14(1):188. doi:10.1186/s12974-017-0962-y
38. Raghupathy R. Cytokines as key players in the pathophysiology of preeclampsia. Med Princ Pract. 2013;22(Suppl 1):8–19. doi:10.1159/000354200
39. AbdulHussain G, Azizieh F, Makhseed M, Raghupathy R. Effects of progesterone, dydrogesterone and estrogen on the production of Th1/Th2/Th17 cytokines by lymphocytes from women with recurrent spontaneous miscarriage. J Reprod Immunol. 2020;140:103132. doi:10.1016/j.jri.2020.103132
 © 2020 The Author(s). This work is published and licensed by Dove Medical Press Limited. The
full terms of this license are available at https://www.dovepress.com/terms.php
and incorporate the Creative Commons Attribution
- Non Commercial (unported, v3.0) License.
By accessing the work you hereby accept the Terms. Non-commercial uses of the work are permitted
without any further permission from Dove Medical Press Limited, provided the work is properly
attributed. For permission for commercial use of this work, please see paragraphs 4.2 and 5 of our Terms.
© 2020 The Author(s). This work is published and licensed by Dove Medical Press Limited. The
full terms of this license are available at https://www.dovepress.com/terms.php
and incorporate the Creative Commons Attribution
- Non Commercial (unported, v3.0) License.
By accessing the work you hereby accept the Terms. Non-commercial uses of the work are permitted
without any further permission from Dove Medical Press Limited, provided the work is properly
attributed. For permission for commercial use of this work, please see paragraphs 4.2 and 5 of our Terms.