Back to Journals » Journal of Hepatocellular Carcinoma » Volume 8
CYP2C8 Suppress Proliferation, Migration, Invasion and Sorafenib Resistance of Hepatocellular Carcinoma via PI3K/Akt/p27kip1 Axis
Authors Zhou X, Li TM ![]() , Luo JZ
, Luo JZ ![]() , Lan CL, Wei ZL, Fu TH, Liao XW
, Lan CL, Wei ZL, Fu TH, Liao XW ![]() , Zhu GZ
, Zhu GZ ![]() , Ye XP, Peng T
, Ye XP, Peng T ![]()
Received 25 August 2021
Accepted for publication 18 October 2021
Published 3 November 2021 Volume 2021:8 Pages 1323—1338
DOI https://doi.org/10.2147/JHC.S335425
Checked for plagiarism Yes
Review by Single anonymous peer review
Peer reviewer comments 3
Editor who approved publication: Dr Laura A. Dawson
Xin Zhou,1,2,* Tian-Man Li,1– 3,* Jian-Zhu Luo,1,2,* Chen-Lu Lan,1,2 Zhong-Liu Wei,1,2 Tian-Hao Fu,1,2 Xi-Wen Liao,1,2 Guang-Zhi Zhu,1,2 Xin-Ping Ye,1,2 Tao Peng1,2
1Department of Hepatobiliary Surgery, The First Affiliated Hospital of Guangxi Medical University, Nanning, 530021, Guangxi Zhuang Autonomous Region, People’s Republic of China; 2Key Laboratory of Early Prevention & Treatment for Regional High Frequency Tumor (Guangxi Medical University), Ministry of Education, Nanning, 530021, Guangxi Zhuang Autonomous Region, People’s Republic of China; 3Department of Hepatobiliary Surgery, The Sixth Affiliated Hospital of Guangxi Medical University, Yulin, 537000, Guangxi Zhuang Autonomous Region, People’s Republic of China
*These authors contributed equally to this work
Correspondence: Tao Peng Email [email protected]
Background: Cytochrome P450 2C8 (CYP2C8) gene is one of the members of the cytochrome P450 enzymes (CYPs) gene family. The aim of this study was to reveal the function of CYP2C8 in hepatocellular carcinoma (HCC) and its effect on the sorafenib resistance.
Methods: Differential expression analysis in multiple HCC datasets all suggested that CYP2C8 expression was significantly decreased in HCC tissues, compared with para-carcinoma liver tissues. The expression level of CYP2C8 was subsequently compared between HCC tissues and para-carcinoma liver tissues of 70 patients form Guangxi, China, with the result consistent with the above. Survival analysis and ROC analysis indicated that CYP2C8 was equipped with satisfactory diagnostic and prognostic value in HCC. To examine the effect of CYP2C8 on the malignant phenotype of HCC cells, stable transcriptional cell lines with CYP2C8 over-expression were established, and then Cell Counting Kit-8 (CCK8) assay, colony formation assay, cell cycle assay, cell invasion assay and wound healing assay were performed.
Results: The results of aforementioned assays suggested that CYP2C8 over-expression restricted the proliferation, clonality, migration, invasion and cell cycle of HCC cells but had no significant effect on cell apoptosis. The enrichment analysis in terms of sequencing data of HCC cell lines with stable CYP2C8 over-expression suggested that CYP2C8 might be related to PI3K/Akt/p27Kip1 axis. The inhibition of CYP2C8 over-expression on PI3K/Akt/p27Kip1 axis was subsequently demonstrated with Western blot assay. In the rescue experiment, it was observed that both P27 inhibitor and PI3K agonist counteracted the repressed malignant phenotype caused by CYP2C8 over-expression, which further demonstrated that CYP2C8 played a role in HCC cells via PI3K/Akt/p27Kip1 axis.
Discussion: The results demonstrated that CYP2C8 enhances the anticancer activity of sorafenib in vitro assays and in tumor xenograft model, with Ki-67 down-regulation and PI3K/Akt/p27Kip1 axis inhibition. In conclusion, these findings hinted that CYP2C8 restricted malignant phenotype and sorafenib resistance in HCC via PI3K/Akt/p27kip1 axis.
Keywords: hepatocellular carcinoma, CYP2C8, sorafenib resistance, cell cycle
Introduction
Primary liver cancer is the sixth most common malignancy and third leading cause of malignant tumor-related death in the world.1 HCC is the main pathological subtype of primary liver cancer, accounting for more than 90% of all cases.2 Each year, nearly 900,000 people worldwide develop liver cancer and more than 800,000 patients pass away from it.1,3 Thus, when the mortality is close enough to morbidity, it indicates a high degree of malignancy. About half of these unfortunate cases and primary liver cancer–related deaths occur in China due to the high exposure to the hepatitis B virus.4–6 The early symptom of HCC is not obvious, and there is still a lack of screening methods with satisfactory diagnostic efficiency.7 Hence, more than 70% of the patients with liver cancer are observed in advanced stage.8 Patients with advanced HCC often miss the opportunity of surgical radical resection, and systemic treatment is their first choice.9 Although the existing systemic therapy drugs have a certain effect in improving the prognosis of patients and prolonging the survival of patients, the therapeutic effect of these drugs is far from meeting the requirements of patients. Drug resistance is the main cause of treatment failure in these advanced stage HCC patients.9 Systematic treatment resistance includes inherent resistance and acquired resistance. The tumor heterogeneity of some patients determines their resistance to systematic treatment agents.10 Some patients respond well to initial treatment but develop resistance over the course of treatment.11
Tyrosine kinase inhibitor (TKI), currently the most commonly used system therapy drug, is a class of compounds that inhibit tyrosine kinase activity and is highly selective for tumor cells with specific biomarkers (tyrosine kinase) expression.12 Since sorafenib was approved as the first-line systemic treatment for advanced HCC patients in 2007, numerous TKI drugs have successively been marketed as the first-line or second-line drugs for the palliative system treatment for HCC. TKIs inhibit the growth and proliferation of tumor cells and promote apoptosis by blocking tyrosine kinase activity and inhibiting cell signal transduction.13 The median survival time for patients with advanced HCC treated with sorafenib was about 10 months.14 Although TKI has prolonged the survival of some advanced HCC patients, the efficacy is still not satisfactory due to low therapeutic response and high drug resistance rate. Studies have shown that the objective response rate of advanced HCC patients to sorafenib is only 9%.15 Although some patients initially respond to sorafenib, they develop secondary resistance during treatment, leading to treatment failure.12,16 Abnormal activation of PI3K/AKT/mTOR pathway is common in sorafenib drug-resistant HCC cells, and inhibitors of PI3K/AKT/mTOR pathway significantly relieve sorafenib drug resistance.17 A large number of evidences suggest that abnormal activation of PI3K/AKT/mTOR pathway is an important reason for sorafenib drug resistance.18,19
Cytochrome P450 enzyme (CYP450) represents a large family of self-oxidizable heme proteins, involved in the metabolism of endogenous substances and exogenous substances, including drugs and environmental compounds.20 The 1-, 2- and 3-subfamilies of CYP450 belong to drug-metabolism-related CYPs, which mainly mediate the metabolism of clinical drugs, carcinogens and procarcinogens, and are closely related to liver diseases such as hepatitis, cirrhosis and HCC.21 CYP2C8 is a member of the CYP450 and plays an important role in oxidative metabolism. Compared with other CYP450 isomers, CYP2C8 has a unique active site, which determines its substrate selectivity and unique catalytic function.22 CYP2C8 could metabolize certain chemicals that contain steroids, arachidonic acids, retinoids and the anionic parts of some drugs.23 Several glucoside conjugates have been shown to interact with CYP2C8. When these conjugates become ligands (substrates or inhibitors) for CYP2C8, a specific drug–drug interaction (DDI) may occur.24 Although CYP2C8 is well known for its role in drug metabolism, there were no studies exploring the effect of CYP2C8 on drug resistance of HCC. Previous studies of our group found that the combination of cytochrome P450 family members including CYC2C8, CYP2C9, and CYP2C19 could effectively assessing the prognosis of HCC patients.25,26 Based on our previous discovery, this study further explored the influence of CYP2C8 on the malignant biological behavior and drug sensitivity of systemic therapy for HCC and the potential mechanisms.
Materials and Methods
Patients and Clinical Specimens
Paired carcinoma-adjacent tissues of 70 HCC patients were collected during surgery from June 2016 to July 2018 in the first affiliated hospital of Guangxi Medical University. Later, the tissues were immersed in RNA (Thermo Fisher Scientific, Shanghai, China) within 30 minutes of excision, and then stored in −80°C refrigerator. The tissue sections of these patients were obtained from the department of pathology of the first affiliated hospital of Guangxi Medical University. This study had acquired the approval of the Ethics Committee of the first affiliated hospital of Guangxi Medical University before specimen collection. Written informed consent was obtained from all the patients before surgery.
Cell Culture
The HCCM line and the HepG2 cell lines were purchased from Shanghai Institutes for Biological Sciences Cell Resource Center and cultured in DMEM culture medium (Gibco, CA, USA) with 10% fetal bovine serum (FBS, Gibco, CA, USA) in incubator at 37 °C with 5% CO2.
RNA Extraction and PCR
RNA extraction was accomplished with E.Z.N.A.® Total RNA Kit II (Omega, GA, USA) following the manufacturer’s protocol. PrimeScript™ RT reagent Kit (Takara, Dalian, China) was applied for reverse transcription according to the manufacturer’s protocol. The primers were designed and synthesized by Sangon Biotech. The sequences of PCR primers were displayed in Table S1. qRT-PCR was performed with FastStart Universal SYBR® Green Master Mix (Roche, Germany) in QuantStudio 6 Flex Real-Time PCR system (Thermo Fisher Scientific, USA).
Construction of Lentivirus and Stable Cell Lines
Over-expression lentiviral vector of CYP2C8 gene were designed and synthesized by GeneCopoeia (Guangzhou, China). CYP2C8-Lv201 vector and Empty-Lv201 vector were respectively transfected into 293T cells with Lipofectamine 3000 Reagent (Thermo Fisher Scientific, USA) for lentivirus package according to the manufacturer’s protocol. The CYP2C8-Flag-eGFP lentiviral and the Empty-Flag-eGFP lentiviral were used to transfect HepG2 and HCCM cells at an MOI of 30–50. Puromycin (Solarbio, Beijing, China) was used for screening stably transduced cells at the concentration range of 1–4 μg/mL. Transfection efficiency was evaluated by qRT-PCR assay and Western Blot assay.
Transcriptome Sequencing
RNA was extracted from previously constructed CYP2C8 overexpressed HCCM and HepG2 cells, and HepG2 and HCCM cells transfected with empty plasmid. Total RNA of each sample was quantified and identified with Agilent 2100 biological analyzer, Nanodrop 2000 spectrophotometer and electrophoresis. The specimens with RNA integrity value (RIN) higher than 6.5 were then sent to Novogene (Beijing, China) for library construction in Illumina sequencing platform.
Western Blot Assay (WB)
The proteins were extracted using RIPA Lysis and Extraction Buffer (Thermo Fisher Scientific, USA) mixed with a 1% PMSF (Thermo Fisher Scientific, USA). Protein concentration was determined with BCA Protein Assay Kit (Thermo Fisher Scientific, USA). The proteins were separated with SDS-PAGE gels and then electrically transferred on PVDF membrane. Then the PVDF membrane was blocked with Blocker™ BSA (Thermo Fisher Scientific, USA). The PVDF membrane was incubated in the primary antibody at 4°C overnight. After washing twice in PBST, the PVDF membrane was then incubated in the secondary antibody at room temperature for 90 min. The concentrations of primary antibodies were as follows: GAPDH 1:10000 (Proteintech, USA); CYP2C8 1:1000 (Abcam, USA); PI3K 1:1000 (Proteintech, USA); p-PI3K 1:2000 (Affbiotech, China); AKT, 1:3000 (Proteintech, USA); p-AKT, 1:3000 (Proteintech, USA); p27, 1:2000 (Proteintech, USA); CDK2 1:2000 (Proteintech, USA). After washing twice in PBST, the protein bands were visualized with Bio-Rad ChemiDoc MP Imaging System and quantified with Image Lab.
Cell Counting Kit-8 (CCK8) Assays
One hundred microliters of culture medium containing 2000 cells were planted in each well of 96-well plates, and four identical plates were additionally prepared for testing at different times. The plates containing cells were respectively added with 10 µl CCK8 solution (Dojindo, Japan) each well at 0h, 24h, 48h, 72h and 96h. After 2 hours of incubation, the absorbance at 450 nm was detected with Varioskan LUX (Thermo Fisher Scientific, USA). In cytotoxicity assay for sorafenib, 5 μM sorafenib or a placebo was added to the culture medium when the cells were planted into the culture plate. The plates containing cells were respectively added with 10 µl CCK8 solution (Dojindo, Japan) each well at 0h and 48h.
Colony Formation Assays
Two milliliters of culture medium containing 1500 cells were planted in each well of 6-well plates. After 2 weeks culture in an incubator at 37°C with 5% CO2, the cells were fixed in 4% paraformaldehyde (Biosharp, China), then stained with a crystal violet solution (Merck, Germany) and photographed.
Cell Cycle Assays
The adherent cells were digested into single suspension cells by Trypsin-EDTA (Thermo Fisher Scientific, USA) and fixed overnight with pre-cooled 70% ethanol. After centrifuged at 1000g for 3 min, ethanol was discarded and 500 µl PI (50mg/mL)/RNase-A stain was added according to the manufacturer’s protocol. After 30 minutes of incubation at room temperature in the dark, fully stained cells were put into flow cytometry for detection, and the red fluorescence at the excitation wavelength of 488nm was recorded. FlowJo V10.0 was applied to assess cell cycle distribution.
Cell Invasion Assays
DMEM (Thermo Fisher Scientific, USA) was mixed with Matrigel™ Basement Membrane Matrix (BD, USA) in a ratio of 1:3 on ice, and then the diluted Matrigel was added to the 6.5 mm Transwell® with 8.0 µm Pore Polycarbonate Membrane Inserts (Corning, USA) and placed in an incubator at 37°C for 30 minutes. Two hundred milliliters of FBS-free medium containing 5×10⁴ single suspension cells was added to the Transwell® Inserts, and the Inserts were then placed into a 24-well plate preloaded with 600 mL DMEM with 20% FBS. After 36 hours in an incubator at 37°C with 5% CO2, the insert was taken out and immersed in 4% methanol for 20min for fixation. Cells on the upper layer of the inserts are gently scraped off with a cotton swab. Crystal violet solution (Merck, Germany) was used to stain the cells beneath the inserts. Cells penetrating the basement membrane were observed and photographed under an inverted microscope.
Cell Wound Healing Assays
When cell density was around 90%, a 200-µl suction tip was used to quickly scratch the bottom of the culture plate, creating a straight scratch. The adherent cells were gently washed twice with sterile PBS, and 1% FBS DMEM was added to the cell culture plate. The same number of cells were planted in each well. Admittedly, the width of the scratches was affected by anthropogenic factors, only scratches with the same initial width were used for subsequent data analysis. At the same time, the proliferation of cells was basically limited by low serum medium, and the reduction of scratch width was mainly caused by cell migration. The morphology of the scratches was observed and photographed at 0 h, 24 h and 48 h, respectively.
Immunohistochemistry
Tissue paraffin sections were immersed in xylene for dewaxing and then successively placed in ethanol at a gradient concentration for hydration. Antigen was retrieved using 0.01M citrate buffer (pH 6.0) at 100°C for 10 min. Endogenous peroxidase was devitalized using 100 µl 3% H2O2 at room temperature for 10 min. Three percent BSA was used to block tissue section at room temperature for 1 hour. The primary antibody CYP2C8 (Abcam, USA) and Ki67 (Proteintech, USA) were respectively diluted according to the manufacturer’s instructions, and the sections were incubated overnight in primary antibody diluent at 4 °C. After washing thrice within PBS, the sections were incubated with corresponding secondary antibodies (ZSGB-Bio, China) at room temperature for 30 min. After washing twice in PBS to get rid of residual secondary antibodies, the tissue sections were dripped with an appropriate amount of the detection system V9000 (ZSGB-Bio, China) and incubated at 37°C for 20 min. After washing twice in PBS, the tissue sections were dripped with freshly prepared DAB solution (ZSGB-Bio, China) and incubated at room temperature for 5–10 min. When showing positive stain, the tissue sections were immediately washed to stop the chromogenic reaction. Then, the sections were counterstained with hematoxylin solution.
Cell Apoptosis Assay
The cell apoptosis was tested with Annexin V-PE/7AAD kit (BD, USA). Cells were stained with Annexin V conjugated PE dye and 7AAD dye following the manufacturer's protocol and then put into flow cytometry for detection. Cells with 7AAD (−) and PI (−) were considered as viable cells; 7AAD (-) PE (+) was considered as early apoptosis; 7AAD (+) PE (+) were deemed late apoptosis. FlowJo V10.0 was applied to assess cell apoptosis rate.
Tumor Xenograft Models
The cells were diluted to 5×10⁷ cells/mL with precooled PBS buffer. Two hundred microliters of cell suspension (107 cells) were injected under the skin of the nude mice behind the right armpit. Since the cell suspension was inoculated, the survival status and tumorigenesis of the mice were closely observed and recorded. After the tumor volume was grown to the appropriate size (0.400–0.600 cm3), nude mice were intraperitoneally injected with sorafenib solution at a concentration of 5mg/kg intraperitoneal injection (i.p.) or equivalent volume of placebo once every other day for 2 weeks. Tumor growth of nude mice was kept under observation and recorded. Volumes of tumors were calculated with the formula: V = length × width2× π/6.
Statistical Analysis
Each experiment was repeated at least three times, and samples in each group were set for at least three replicates. Experimental results were displayed as mean ± standard error. IBM SPSS Statistics software (version 24.0, SPSS) was used for data analysis. Student’s t-test was applied to compare the differences between two groups. Multiple comparisons were performed with two-way analysis of variance (ANOVA). Kaplan–Meier method was used in survival analysis. ROC analysis was performed for assessing diagnostic significance, and AUC >0.900 was considered as satisfactory performance. P < 0.05 was considered statistically significant.
Results
CYP2C8 Was Downregulated in HCC
Expression of CYP2C8 between para-carcinoma tissues and HCC tissues was respectively analyzed in multiple public datasets, including TCGA liver hepatocellular carcinoma (LIHC) dataset (Figure 1A), GSE136247 (Figure 1B) dataset, GSE14520 dataset (Figure 1C) and GSE76427 (Figure 1D), with the results consistently indicating that the expression level of CYP2C8 was significantly decreased in HCC tissues (P<0.0001 in all). The expression of CYP2C8 was further explored in 70 patients from The First Affiliated Hospital of Guangxi Medical University, with the baseline information shown in Table 1. Consistent with the conclusion in the public databases, qPCR assay result of these 70 patients from Guangxi cohort also suggested that the expression of CYP2C8 was significantly down-regulated in HCC, compared with paired para-carcinoma tissues (Figure 1E). Besides, immunohistochemical staining for these 70 patients from Guangxi cohort also exhibited that CYP2C8 was down-regulated in HCC tissues (Figure 1F). The expression of CYP2C8 was significantly different between para-carcinoma tissues and HCC tissues at both the mRNA level and the protein level. This suggested that CYP2C8 might be closely related to the occurrence and development of HCC.
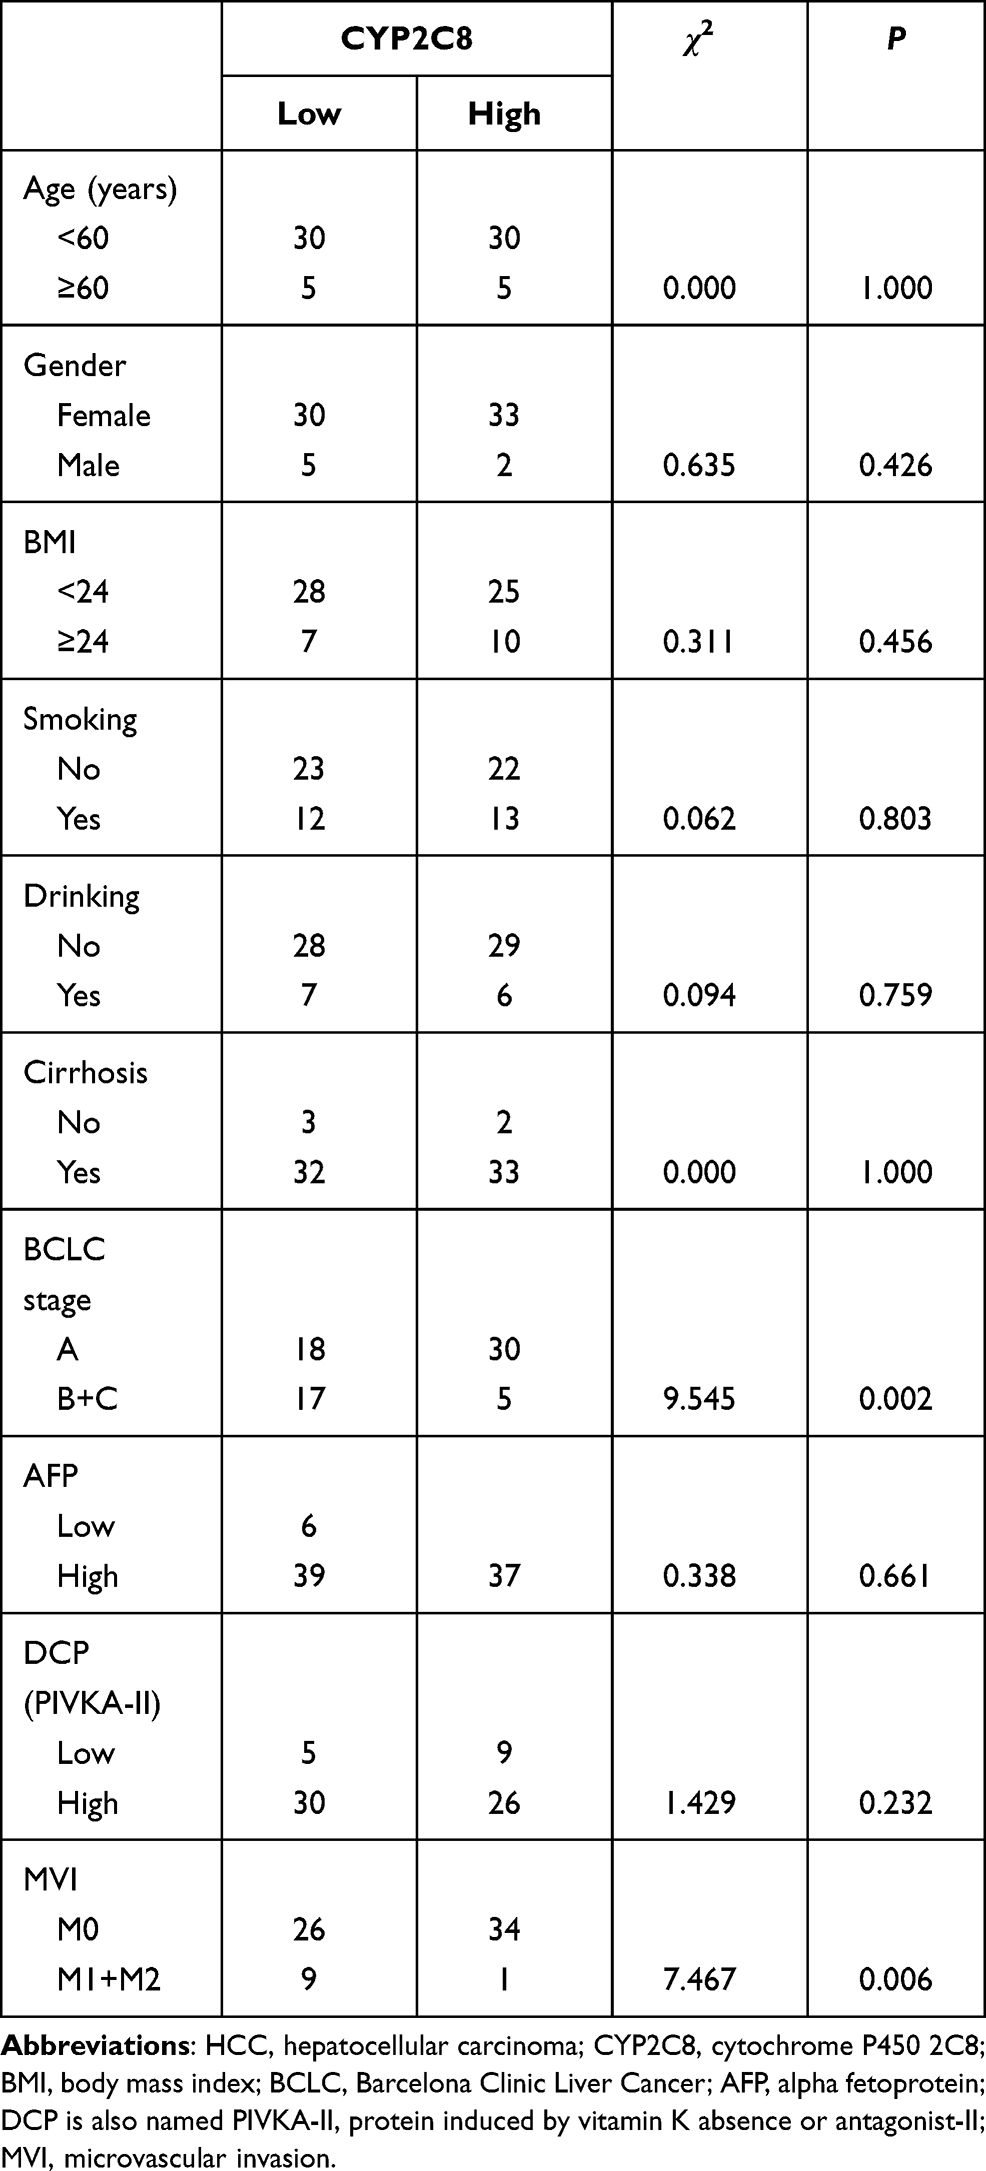 |
Table 1 Clinical Information of 70 HCC Patients from the First Affiliated Hospital of Guangxi Medical University |
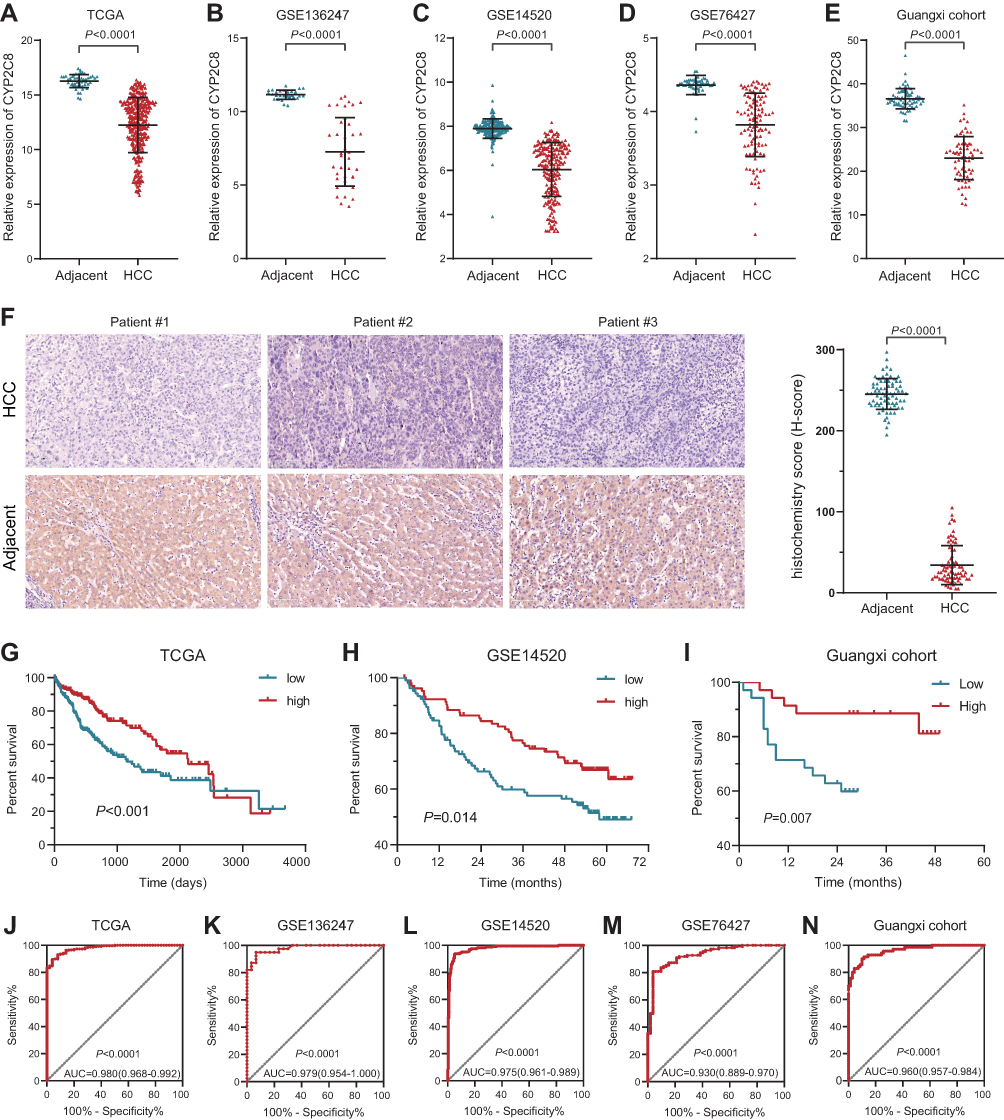 |
Figure 1 Expression and clinical significance of CYP2C8 in HCC. (A–D) Expression of CYP2C8 between adjacent liver tissue and HCC tissues in TCGA LIHC dataset, GSE136247 dataset, GSE14520 dataset and GSE76427 dataset. (E) Expression of CYP2C8 between adjacent liver tissue and HCC tissues of 70 patients in Guangxi cohort examined with qRT-PCR. (F) Representative immunostaining images of CYP2C8 in HCC and adjacent liver tissues, with the results quantified by H-score displayed in the histogram. (G–I) Survival curve for high and low expression of CYP2C8 in TCGA LIHC dataset (P<0.0001), GSE14520 dataset (P=0.014) and Guangxi cohort (P=0.007). (J–N) ROC curve for CYP2C8 in TCGA LIHC dataset (ACU=0.980, P<0.0001), GSE136247 dataset (ACU=0.979, P<0.0001), GSE14520 dataset (ACU=0.975, P<0.0001) GSE76427 dataset (ACU=0.930, P<0.0001) and Guangxi cohort (ACU=0.960, P<0.0001). Data are presented as the mean ± SD, ****P<0.0001. |
To further explore the relationship between CYP2C8 and prognosis in patients with HCC, the multi-dataset survival analysis was performed. Survival analysis in TCGA LIHC dataset (P<0.001, Hazard ratio (HR)=0.566, 95% CI (confidence interval) =0.399–0.798, Figure 1G), GSE14520 dataset (P=0.014, HR=0.578, 95% CI=0.374–0.894, Figure 1H) and Guangxi cohort (P=0.007, HR=0.306, 95% CI=0.107–0.694, Figure 1I) all indicated that low expression of CYP2C8 was associated with bad outcome of HCC patients. In addition, Cox Proportional Hazard regression models were used to perform multivariate survival analysis in order to compare the effects of OS-related clinical factors. Survival analysis in TCGA LIHC dataset (adjusted P=0.008, adjusted for tumor stage), GSE14520 dataset (adjusted P=0.014, adjusted for BCLC stage, tumor stage and AFP) and Guangxi cohort (adjusted P=0.009, adjusted for BCLC stage and microvascular invasion) all indicated that expression of CYP2C8 was associated with the OS of HCC. The absence of survival analysis results for GSE1362427 and GSE763427 data sets was due to the absence of survival data.
Considering the great CYP2C8 expression difference between HCC and para-carcinoma tissues, diagnostic efficiency of CYP2C8 was assessed with ROC analysis. It suggested that HCC might be precisely screened out by CYP2C8 in view of the excellent performance of CYP2C8 in ROC analysis in TCGA LIHC dataset (AUC=0.980, Figure 1J), GSE136247 dataset (AUC=0.979, Figure 1K) dataset, GSE14520 dataset (AUC=0.975, Figure 1L), GSE76427 dataset (AUC=0.930, Figure 1M) and Guangxi cohort (AUC=0.960, Figure 1N). The area under curve for the ROC curve of CYP2C8 in all aforementioned cohorts was greater than 0.900.
CYP2C8 Inhibit Malignant Phenotypes of HCC Cells
Before identifying the impact of CYP2C8 on the malignant phenotype of HCC cells, CYP2C8 expression was analyzed in multiple HCC cell lines and normal liver cells. As shown in Figure S1A, HCCM and HepG2 cell lines had the lowest CYP2C8 expression among these HCC cell lines, therefore we retrovirally established the stable over-expression of CYP2C8 in HepG2 and HCCM cells (designated as HepG2-CYP2C8 and HCCM-CYP2C8) and control HepG2 and HCCM cells (designated as HepG2-GFP and HCCM-GFP) (Figure S1B and C). The successfully established stable over-expression of CYP2C8 in HCCM and HepG2 cell lines was inspected by qPCR assay and WB assay (Figure S1D–G). Subsequently, a series of phenotypic assays were performed to explore the biological role of CYP2C8. It was observed in CCK-8 assays that the cell viability of HepG2-CYP2C8 cells rose more slowly than that of HepG2-GFP cells (Figure 2A). Analogously, the cell viability of HCCM-CYP2C8 cells was lower than that of HCCM-GFP cells at 96h (Figure 2B). It indicated that CYP2C8 over-expression inhibited HepG2 and HCCM cells proliferation. The results of wound healing assay indicated that CYP2C8 over-expression reduced the ability of migration of HepG2 and HCCM cells (Figure 2C and D). The result of colony formation assays demonstrated that CYP2C8 over-expression inhibits long-term proliferation and clonality of HepG2 and HCCM cells (Figure 2E). In cell invasion assays, the cells passed through the stromal gel in HepG2-CYP2C8 group and HCCM-CYP2C8 group was corresponding less than that of HepG2-GFP group and HCCM-GFP group (Figure 2F). It suggested that CYP2C8 over-expression significantly restricted HCC cells’ invasion ability. In conclusion, CYP2C8 up-regulation restricts several malignant phenotypes of HCC cells, including proliferation, migration, clonality and invasion.
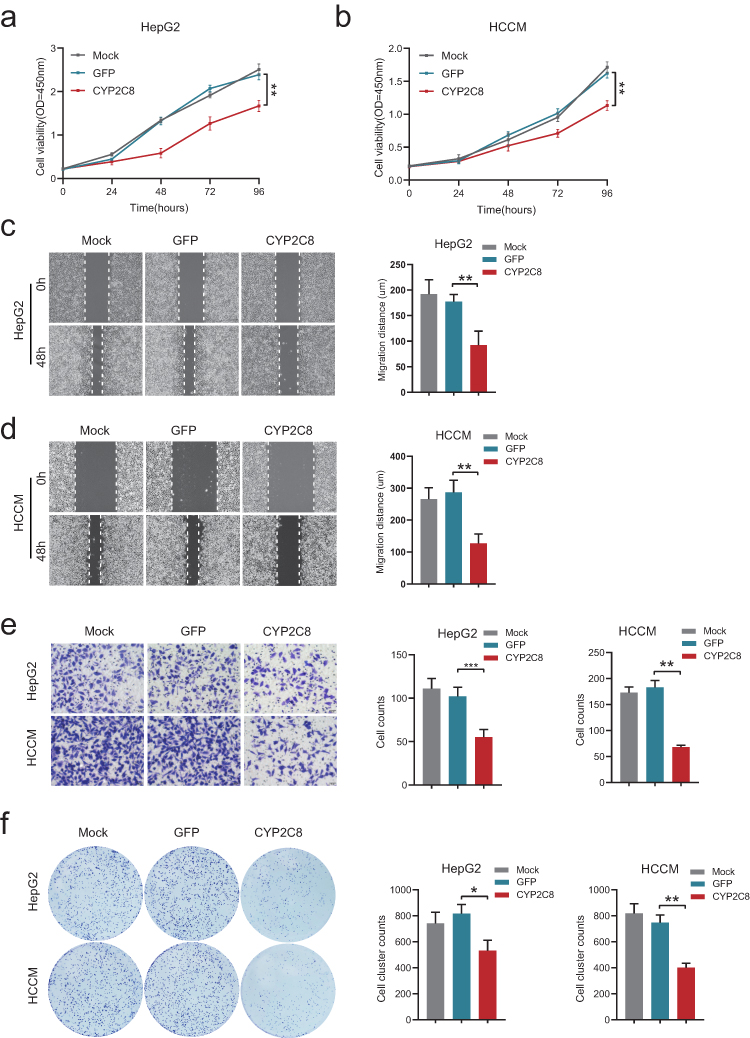 |
Figure 2 The effect of CYP2C8 on the malignant phenotype of HCC cells. (A and B) The effect of CYP2C8 over-expression on proliferation of HepG2 cells (A) and HCCM cells (B) was assessed by CCK8 assay. (C and D), The effect of CYP2C8 over-expression on HepG2 cells (C) and HCCM cells (D) migration was assessed by wound healing assays. (E) The effect of CYP2C8 over-expression on colony formation in HepG2 and HCCM cells. (F) The effect of CYP2C8 over-expression on HepG2 and HCCM cells invasion assessed by cell invasion assays. Data are presented as the mean ± SD, *P<0.05, **P<0.01, ***P<0.001. |
CYP2C8 Inhibit HCC Cells Proliferation via PI3K/Akt/p27Kip1 Axis
In order to reveal the mechanisms by which CYP2C8 influences HCC cell proliferation, RNA-seq for HepG2-CYP2C8, HCCM-CYP2C8, HepG2-GFP and HCCM-GFP cells were performed. The profiles of differentially expressed genes are shown in the heat map (Figure 3A). Enrichment analysis for differential expression genes in HepG2 cell line suggested that CYP2C8 might be involved in the P53 signaling pathway, p27-cell cycle G1/S, cell cycle, autophagy, PI3K-Akt signaling pathway, etc. (Figure 3B). Besides, p27-cell cycle G1/S, cellCycle and PI3K-Akt signaling pathway also occurred in the enrichment analysis result of HCCM-CYP2C8 cell line (Figure 3C).
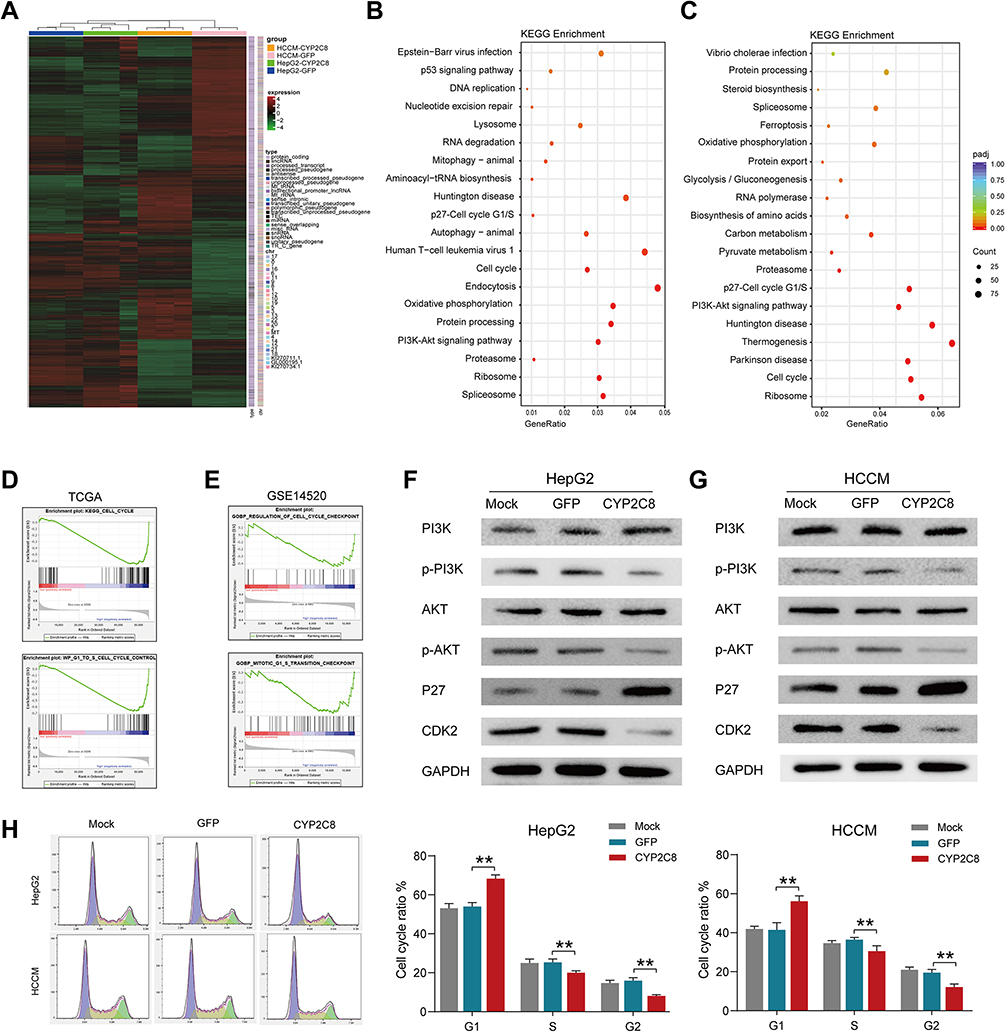 |
Figure 3 The potential mechanism of CYP2C8 regulating the malignant phenotype of HCC cells. (A) Heatmap summarizing the differentially expressed genes in CYP2C8 overexpressed HepG2 and HCCM cells. (B) the KEGG pathways CYP2C8 enriched in terms RNA-seq data of HepG2 cells. (C) the KEGG pathways CYP2C8 enriched in terms RNA-seq data of HCCM cells. (D) GSEA result in GSE14520. (E) GSEA result in TCGA LIHC dataset. (F) Expression of total and phosphorylated PI3K, AKT3, P27 and CDK2 in HepG2 cells following CYP2C8 over-expression. (G) Expression of total and phosphorylated PI3K, AKT3, P27 and CDK2 in HCCM cells following CYP2C8 over-expression. (H) The effect of CYP2C8 over-expression on cell cycle of HepG2 and HCCM cells. Cell cycle distributions of the HepG2 and HCCM cells measured by flow cytometry was shown in the left with the ratio of indicated stages displayed in histogram. Data are presented as the mean ± SD, **P<0.01. |
Gene Set Enrichment Analysis (GSEA)27 was performed using the whole transcriptome sequencing data from TCGA LIHC dataset and GSE14520 dataset, with the expression of CYP2C8 serving as grouping basis. GSEA in TCGA (Figure 3D) and GSE14520 (Figure 3E) both indicated that CYP2C8 was negative associated with cell cycle, particularly the G1/S phase transition.
Based on the results of bioinformatics, we further explored the relationship between CYP2C8 and the PI3K/Akt/p27 Kip1 axis. The WB assay was used to assess the expression of total and/or phosphorylated PI3K, AKT3, P27 and CDK2 in HepG2 cells and HCCM cells. Compared with HepG2-GFP cells and HCCM-GFP cells, phosphorylated PI3K, phosphorylated Akt and CDK2 were significantly reduced, but P27 was significantly increased in HepG2-CYP2C8 and HCCM-CYP2C8 cells. It revealed that CYP2C8 negatively regulated the PI3K/Akt signal pathway, thus disinhibiting P27 and resulting expression decline of CDK2 (Figure 3F and G).
Subsequently, cell cycle assay was performed. Compared with HepG2-GFP cells and HCCM-GFP cells, the proportion of cells in G1 phase was increased in HepG2-CYP2C8 cells and HCCM-CYP2C8 cells (Figure 3H). It indicated that CYP2C8 over-expression arrest the cell cycle, particularly the G1/S transition. In order to rule out the possibility that CYP2C8 induces cell cycle inhibition by affecting TP53, we detected the expression level of TP53 in the control group of CYP2C8-overexpressing cell lines, and the results showed that CYP2C8 had no significant effect on TP53 expression (Figure S1H and I).
CYP2C8 Inhibit Sorafenib Resistance in vitro
Sorafenib is one of the most widely used TKIs in HCC, but its therapeutic effects were limited by resistance.16 Exploring feasible approach to inhibit resistance of sorafenib might improve outcomes of HCC patients. To assess the effect of CYP2C8 on the HCC cells’ resistance of sorafenib, several phenotype assays were performed in vitro. The effect of CYP2C8 on the treatment effect of sorafenib was evaluated by comparing the differences in proliferation, clonality, cycle, apoptosis, migration and invasion of HCC cells between the CYP2C8 over-expression group and the control group under the same concentration of sorafenib. It was observed that CYP2C8 over-expression dwindled IC50 of sorafenib in HepG2 cell line (IC50 for HepG2-GFP= 8.289±0.331μM; IC50 for HepG2-CYP2C8=5.783±0.647μM) and HCCM cell line (IC50 for HCCM-GFP = 2.288±0.157μM; IC50 for HCCM-CYP2C8=1.456±0.296μM) (Figure 4A). It was observed in the colony formation assays that the numbers of colonies formed by HepG2-CYP2C8 cell and HCCM-CYP2C8 cell were less than that of HCCM-GFP cells and HCCM-GFP cells; It indicated that CYP2C8 over-expression inhibited HCC cells’ clonality and long-term proliferation following sorafenib intervention (5uM) (Figure 4B). It was observed in the cell cycle assays that CYP2C8 further enhanced the cell cycle arrest effect of 'sorafenib (5μM) in HepG2 and HCCM cells (Figure 4C). The cells apoptosis assay indicated that CYP2C8 enhanced the apoptotic ability of sorafenib (5μM) in HepG2 and HCCM cells (Figure 4D). It is worth mentioning that in the apoptosis assay, CYP2C8 had no significant effect on HepG2 or HCCM apoptosis without the intervention of sorafenib. In addition, the wound healing assays and Transwell assays showed that CYP2C8 over-expression also enhanced the inhibition of cell migration (Figure S2A and B) and invasion (Figure S2C and D) by sorafenib in HepG2 cells and HCCM cells. In conclusion, CYP2C8 enhanced the therapeutic effect of sorafenib in proliferation, clonality, migration and invasion restriction, cell cycle arrest and apoptosis induction.
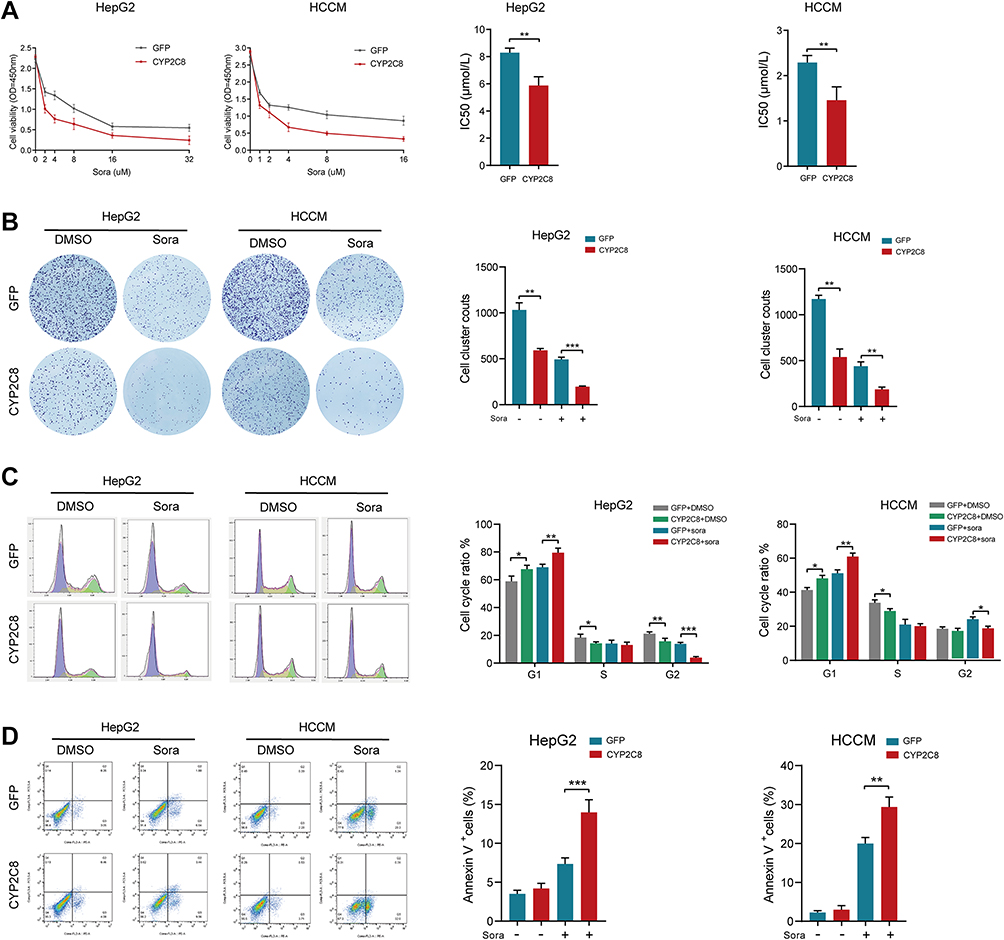 |
Figure 4 CYP2C8 over-expression enhanced the therapeutic effect of sorafenib in vitro. (A) CYP2C8 over-expression enhanced the proliferation inhibition of sorafenib in HepG2 and HCCM cells. (B) CYP2C8 over-expression enhanced the colony formation inhibition of sorafenib in HepG2 and HCCM cells. (C) CYP2C8 over-expression enhanced the cell cycle arrest of sorafenib in HepG2 and HCCM cells. (D) CYP2C8 over-expression enhanced the apoptosis induction of sorafenib in HepG2 and HCCM cells. Data are presented as the mean ± SD, *P<0.05, **P<0.01, ***P<0.001. |
P27 Inhibitors Reversed the Effect of CYP2C8 on HCC Cells
PI3K/Akt/P27 axis is a biological pathway that has been identified by plenty of researches. Aforementioned transcriptome sequencing and WB assays both suggested that CYP2C8 might impact the proliferation and cell cycle of HCC cells via PI3K/Akt/P27 axis suppression. Moreover, enrichment analyses in HCC cells and datasets consistently suggested that CYP2C8 might be implicated in the G1/S phase transition. P27 is a recognized cell cycle inhibitor, specifically inhibiting the transition of cells from G1 phase to S phase via competitively inhibit CDK2. Therefore, P27 inhibitors SJ572403 (SJ403; MCE, Shanghai, China) and PI3K activator with cell permeability 740YPDGFR (740YP; MCE, Shanghai, China) were used to further examine the mechanism of CYP2C8 in HCC cells. CCK-8 assay was performed to compare the growth rate in CYP2C8 over-expression and control HCC cells, with or without SJ403 (2uM). In HepG2 and HCCM cells, the addition of SJ403 significantly reversed the inhibition of cell proliferation caused by CYP2C8 (Figure 5A and B). The similar effect was observed at 740YP (2uM) that reversed the inhibition of cell proliferation and clonality caused by CYP2C8 in HepG2 and HCCM cells (Figure S2E–H). It was observed in colony formation assays that SJ403 (2uM) reversed the effects of CYP2C8 on long-term cell proliferation and clonality in HepG2 and HCCM cells (Figure 5C and D). Similarly, 740YP (2uM) reversed the effects of CYP2C8 on long-term cell proliferation and clonality in HepG2 and HCCM cells. It is similar to the results above, HepG2 and HCCM cell cycle arrest induced by CYP2C8 was also reversed by SJ403 (2uM) (Figure 5E and F).
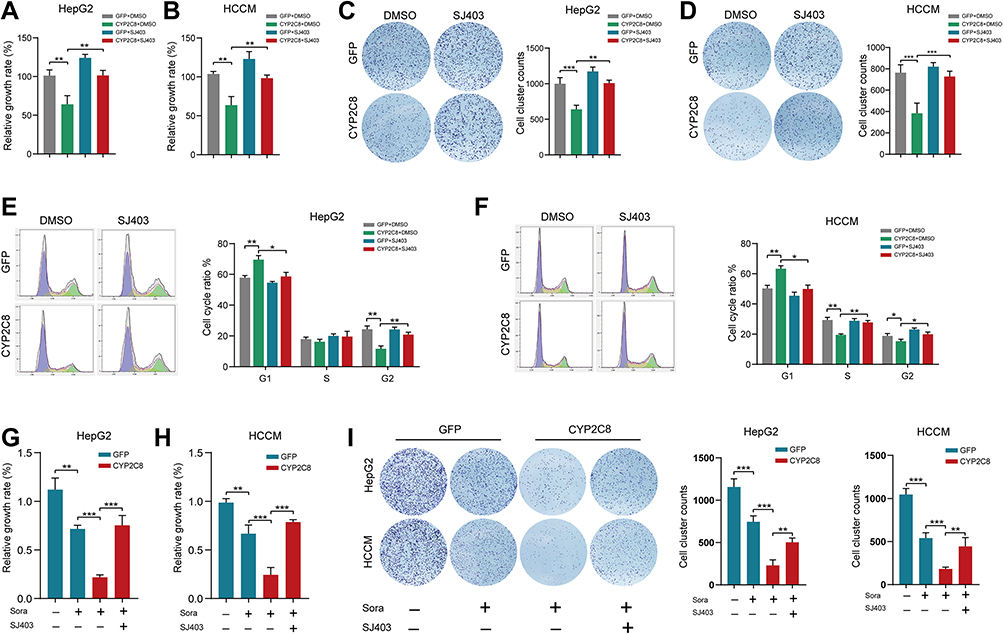 |
Figure 5 SJ403 (P27 inhibitor) reversed the effect of CYP2C8 on HCC cells. (A and B) The effect of CYP2C8 over-expression on proliferation of HepG2 (A) and HCCM (B) cells was offset by SJ403 assessed by CCK8 assays. (C and D) The effect of CYP2C8 over-expression on colony formation of HepG2 (C) and HCCM (D) cells was offset by SJ403 assessed by colony formation assays. (E and F) The effect of CYP2C8 over-expression on cell cycle of HepG2 (E) and HCCM (F) cells was offset by SJ403 assessed by cell cycle assay. (G and H) The effect of CYP2C8 over-expression in enhancing the proliferation inhibition of sorafenib in HepG2 (G) and HCCM (H) cells was offset by SJ403 assessed by CCK8 assays. (I) The effect of CYP2C8 over-expression in enhancing the colony formation inhibition of sorafenib in HepG2 and HCCM cells was offset by SJ403 assessed by colony formation assays. Data are presented as the mean ± SD, *P<0.05, **P<0.01, ***P<0.001. |
To further explore the mechanisms by which CYP2C8 influences the therapeutic effect of sorafenib, SJ403 or equivalent solvent was added following the sorafenib/placebo intervention. In CCK-8 assays, compared with the HepG2-GFP or HCCM-GFP cells, CYP2C8 up-regulation significantly enhanced the proliferation inhibition effect of sorafenib, while this effect was offset by SJ403 (Figure 5G and H). Subsequently, the role of SJ403 that reverse the effect of CYP2C8 in enhancing the therapeutic effect of sorafenib was also observed in colony formation assay (Figure 5I). In conclusion, PI3K/Akt/P27 axis, especially P27, was an important mediator for CYP2C8 to enhance the therapeutic effect of sorafenib.
CYP2C8 Inhibit Tumor Growth and Sorafenib Resistance in in vivo
The enhanced therapeutic effect of CYP2C8 on sorafenib had been observed in HCC cells in vitro. To further explore the role of CYP2C8 in vivo, we construct tumor xenograft models with HepG2 cells. About 1×10⁷ HepG2-CYP2C8 cells or HepG2-GFP cells were respectively implanted into the subcutaneous space of nude mice. When the tumors had grown to the suitable size (0.400–0.600 cm3) at 4 weeks, sorafenib or placebo was intraperitoneally injected into nude mice. In the nude mice under sorafenib treatment, it was observed that the tumors’ volumes formed with HepG2-CYP2C8 cells decreased more rapidly than those formed with HepG2-GFP cells (Figure 6A). It suggested that CYP2C8 significantly sensitized HCC cells to sorafenib. All the transplanted tumors were dissected and weighed at 6 weeks when the mice executed for the ethical requirements. Under 2 weeks’ treatment with sorafenib, the tumors weights of HepG2-CYP2C8 group were significantly lighter than those of HepG2-GFP group (Figure 6B).
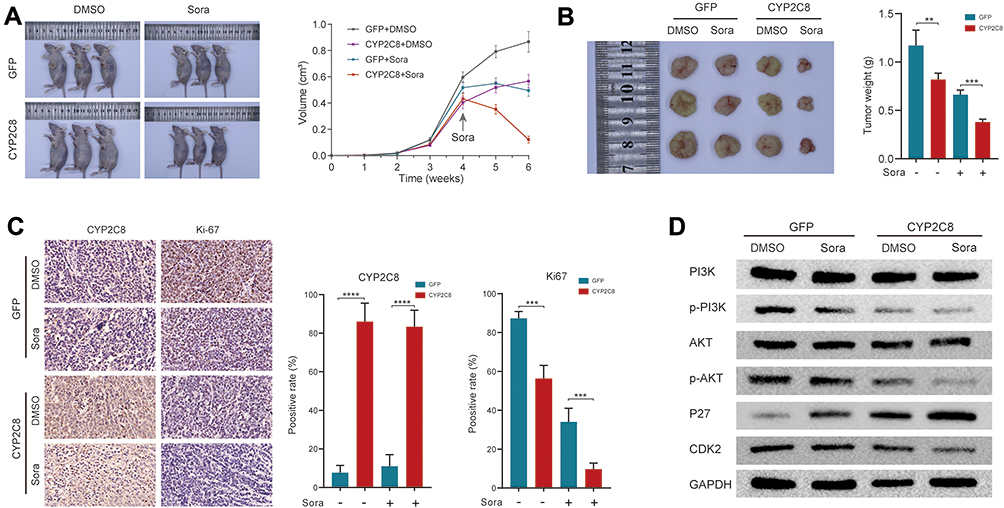 |
Figure 6 CYP2C8 over-expression suppressed drug resistance of HCC in vivo. (A) Representative images of xenograft mice and tumor growth curves, sorafenib or equivalent volume of placebo were injected at 4 weeks and once every other day for 2 weeks. (B) Tumors derived from HepG2-CYP2C8 cells or HepG2-GFP cells, with sorafenib or equivalent volume of placebo injection. The tumor weights were quantified and shown in the histogram. (C) Representative immunostaining images of CYP2C8 and Ki-67 in tumors. The expression richness of CYP2C8 and Ki-67 were quantified by positive rate and displayed in the histograms. (D) Expression of total and phosphorylated PI3K, AKT3, P27 and CDK2 in tumors. Data are presented as the mean ± SD, **P<0.01, ***P<0.001, ****P<0.0001. |
After fixation with formaldehyde solution, the tumor tissues were embedded in paraffin and then sliced into tissue sections. The expression of Ki67 was measured by IHC assay. Compared with any single intervention, the joint of HepG2-CYP2C8 and sorafenib results in a sharp expression decline of the proliferation marker ki67 (Figure 6C).
In order to verify the mechanisms that CYP2C8 enhance therapeutic effect of sorafenib, WB assay was performed to detect the expression of total/phosphorylated PI3K, AKT3, P27 and CDK2 in xenograft tumor tissues. As suggested by the discovery of preceding in vitro assays, it was observed that the combination of CYP2C8 over-expression and sorafenib treatment strongly suppressed the PI3K/Akt/P27 axis, with PI3K and Akt phosphorylation reduction, P27 inhibition release, and CDK2 down-regulation (Figure 6D).
Discussion
Currently, the incidence of HCC is high and is on the rise.28 With the high degree of malignance and the subtle early symptoms,29 most of the patients were at the advanced stage when diagnosed with HCC, and the prognosis was often bleak.11 Another reason for the poor prognosis is that the therapeutic effects of currently available drugs were not satisfactory.30 The efficacy of sorafenib has been demonstrated in plenty of clinical studies since it was approved by the FDA as the first-line treatment of HCC in 2007.9,31,32 Sorafenib inhibits retrovirus-associated DNA sequence protein (RAS)/rapidly accelerated fibrosarcoma protein (RAF)/mitogen activation and extracellular signal-regulated kinase (MEK)/extracellular signal-regulated kinase (ERK) signaling pathways.33,34 However, the resistance of sorafenib limits its long-term anticancereffect. The 1-year survival rate of unresectable HCC treated with sorafenib was less than 60%, and the median survival time is about 12 months,35–37 which is far from satisfactory. The major neuronal isoform of RAF, BRAF and MEK pathways play a critical and central role in HCC escape from TKIs activity. In addition, the mammalian target of oncogenic PI3K/AKT/mTOR pathway is a classic dysfunctional pathway involved in the pathogenesis of HCC, and abnormal activation of PI3K/AKT/mTOR pathway is one of the important mechanisms of HCC drug resistance.19,38,39
In this study, we found that the over-expression of CYP2C8 contributes to the relieving of sorafenib resistance in HCC. In cell phenotype assays, CYP2C8 over-expression restrained activation of the PI3K/AKT/P27kip axis and promoted sorafenib-induced cycle arrest and apoptosis triggering. Similarly, over-expression of CYP2C8 silenced the PI3K/Akt/P27 axis and assisted sorafenib in suppressing tumor growth in vivo. Thus, CYP2C8 enhances the anti-cancer activity of sorafenib by inducing PI3K/ Akt /P27 axis inhibition in vitro and in vivo (Figure S3).
CYP2C8 enzyme is a member of the CYP450 family and is encoded by the CYP2C8 gene, which is located on chromosome 10q24.23 CYP2C8 induces drug response variation through drug–drug interactions and drug genetic polymorphisms.40 CYP2C8 is generally considered to be a metabolism-related gene. It is currently known that CYP2C8 is involved in the metabolism of more than 200 drugs including anticancer, antidiabetic, antimalarial, and lipid-lowering agents, such as imatinib, paclitaxel, rosiglitazone etc.41–44
The role of CYP2C8 in malignancies was rarely explored or reported, and the current researches to follow were mainly about the prognostic significance in HCC. Previous study of our team has reported that CYP2C8 was related to the long-term prognosis of HCC after resection. Ren et al have reported that the down-regulation of CYP2C8 expression was positively correlated with the poor prognosis of HCC patients.45 Li et al also demonstrated that CYP2C8 is a potential prognostic biomarker for HCC.46 On the basis of the above researches, investigation of expression difference and prognostic significance was extended to multiple datasets and the Guangxi cohort. Interestingly, the results of the several cohorts were almost identical, with the expression of CYP2C8 in mRNA level between HCC and adjacent liver tissues forming a sharp contrast. Compared with the high-expression richness in liver tissues, CYP2C8 is rarely transcribed in HCC. This discovery is further validated by IHC assay results: the positive rate is high in liver tissues, but extremely low in HCC tissues. It suggested that aberrant CYP2C8 down-expression is a frequent event in the occurrence of HCC. The results of survival analysis in the GSE1450, TCGA and Guangxi cohorts all showed that patients with low CYP2C8 expression had a worse prognosis compared to patients with high expression of CYP2C8. This further suggested that the CYP2C8 plays a crucial role in the occurrence and development of HCC. Therefore, the role of CYP2C8 may not only be metabolic enzyme but also be involved in the regulation of cancerous signaling pathways.
The effect of CYP2C8 expression on the malignant phenotype was explored in HCC cell lines. Our test results suggested that CYP2C8 altered the biological behavior of HCC, including proliferation, migration, invasion and cell cycle arrest. However, the effect of CYP2C8 on cell apoptosis was not significant, without statistically different proportion of apoptosis observed between CYP2C8 group and GFP group. Li et al had reported that GAS5 sponges miR-382-3p and up-regulate the expression of CYP2C8, thereby inhibiting the proliferation of Huh7 and HepG2 cells.47 Their description of CYP2C8 in proliferation is in full agreement with our experimental results. However, Li et al did not further explore the mechanism of CYP2C8 function. The RNA seq in this study revealed the transcriptomic changes behind the biological behavior altering in HCC. The enrichment analyses for HepG2 cells and HCCM cells both indicated that CYP2C8 is closely related to the PI3K pathway and the G1/S transition in cell cycle. The enriched biological process or pathway was consistent with the discovery in phenotype assays.
The results of Western blot assay showed that the aberrant over-expression of CYP2C8 restrained the phosphorylation of AKT, thereby inducing the enhancement of P27, and finally leading to the weakening of CDK2. It has been clarified that Akt phosphorylates P27, weakens nuclear import of P27kip and opposes P27-mediated G1/S block.48 P27 was widely accepted to be is crucial negative regulator in the G1/S transition by weakening CDK2.49 Besides cyclin/CDK kinase activity mediation, P27 was also involved in cytoskeletal dynamics, cell motility and cell invasion. It was observed in this study that SJ403 (special inhibitor of P27) intervention reverses the CYP2C8-induced proliferation/clonal inhibition and cell cycle arrest in HCC cells. It further demonstrated that P27 is indispensable in CYP2C8-mediated HCC proliferation suppression.
Even though the combination of TKI and ICI has produced unexpected anticancer effects, sorafenib is still indispensable in the treatment of liver cancer. Given the difficulty of new drug development, reducing the resistance of sorafenib is a hopeful approach to improve the prognosis of patients with unresectable HCC. Sorafenib, as the first-line drug in the treatment of liver cancer, prolongs the survival period of patients with advanced liver cancer for 3–4 months.9 The resistance mechanism of sorafenib contained aberrant activation of PI3K/Akt pathway, stemness and the epithelial-mesenchymal transition.16,50 It is practical for clinical therapy to understand the essence of sorafenib resistance and develop potential strategy to eliminate it. In this research, we observed that CYP2C8 might be a potential biomarker to relieve sorafenib resistance. In theory, CYP2C8-mediated PI3K/Akt pathway inhibition can effectively enhance the anticancer effect of sorafenib. In fact, both in vivo and in vitro assays confirmed that CYP2C8 over-expression significantly enhanced sorafenib-induced cell death, accompanied by a decrease in Ki-67 and inhibition of PI3K/AKT/P27 axis. There were no studies suggesting that CYP450 induce resistance by accelerating metabolism of sorafenib so far. Therefore, the development of CYP2C8 activating agents is expected to enhance the anticancer effect of sorafenib. Moreover, activation of CYP2C8 might be helpful to improve the metabolism of sorafenib and alleviate the toxic and side effects induced by sorafenib.
In conclusion, CYP2C8 is an antioncogene influencing HCC cells’ proliferation, clonality, migration and invasion via PI3K/Akt/p27kip1 axis, and CYP2C8 might also serve as a diagnostic and prognostic marker for HCC. In addition, the up-regulated expression of CYP2C8 significantly enhances the therapeutic effect of sorafenib. Our study suggests that the regulation of CYP2C8 may contribute to the improvement of prognosis in patients with HCC.
Ethics Approval and Consent to Participate
The animal tests in this study complied with ethical guidelines of Laboratory Animal Care International Council for Science (ICLAS) and NC3Rs ARRIVE Guideline, and this study had acquired the approval of the Ethics Committee of the first affiliated hospital of Guangxi Medical University before specimen collection and animal tests. Approval Number: 2021 (KY-E-105). The collection of clinical samples was conducted in accordance with the Declaration of Helsinki.
Patient Consent for Publication
Written informed consent was obtained from all the patients.
Acknowledgments
The authors thank the contributors of GSE136247, GSE76428, GSE14520 and TCGA database for sharing the HCC dataset on open access. Xin Zhou, Tian-Man Li and Jian-Zhu Luo share first authorship.
Author Contributions
All authors made a significant contribution to the work reported, whether that is in the conception, study design, execution, acquisition of data, analysis and interpretation, or in all these areas; took part in drafting, revising or critically reviewing the article; gave final approval of the version to be published; have agreed on the journal to which the article has been submitted; and agree to be accountable for all aspects of the work.
Funding
Key Laboratory of High-Incidence-Tumor Prevention & Treatment (Guangxi Medical University), Ministry of Education (grant nos. GKE2018-01, GKE2019-11 and GKE-ZZ202009); Guangxi Key Laboratory for the Prevention and Control of Viral Hepatitis (No. GXCDCKL201902); Natural Science Foundation of Guangxi Province of China (grant no. 2020GXNSFAA159127).
Disclosure
The authors declared that they have no competing interests.
References
1. Sung H, Ferlay J, Siegel RL, et al. Global cancer statistics 2020: GLOBOCAN estimates of incidence and mortality worldwide for 36 cancers in 185 countries. CA Cancer J Clin. 2021;71(3):209–249. doi:10.3322/caac.21660
2. Villanueva A. Hepatocellular carcinoma. N Engl J Med. 2019;380(15):1450–1462. doi:10.1056/NEJMra1713263
3. Cao W, Chen HD, Yu YW, Li N, Chen WQ. Changing profiles of cancer burden worldwide and in China: a secondary analysis of the global cancer statistics 2020. Chin Med J. 2021;134(7):783–791. doi:10.1097/CM9.0000000000001474
4. Zeng H, Chen W, Zheng R, et al. Changing cancer survival in China during 2003–15: a pooled analysis of 17 population-based cancer registries. Lancet Glob Health. 2018;6(5):e555–e567. doi:10.1016/S2214-109X(18)30127-X
5. Yip TC-F, Wong VW-S, Chan HL-Y, Tse Y-K, Lui GC-Y, Wong GL-H. Tenofovir is associated with lower risk of hepatocellular carcinoma than entecavir in patients with chronic HBV infection in China. Gastroenterology. 2020;158(1):215–225.e6. doi:10.1053/j.gastro.2019.09.025
6. Terrault NA, Lok ASF, McMahon BJ, et al. Update on prevention, diagnosis, and treatment of chronic hepatitis B: AASLD 2018 hepatitis B guidance. Hepatology. 2018;67(4):1560–1599. doi:10.1002/hep.29800
7. Kanwal F, Singal AG. Surveillance for hepatocellular carcinoma: current best practice and future direction. Gastroenterology. 2019;157(1):54–64. doi:10.1053/j.gastro.2019.02.049
8. Llovet JM, Zucman-Rossi J, Pikarsky E, et al. Hepatocellular carcinoma. Nat Rev Dis Primers. 2016;2(1):16018. doi:10.1038/nrdp.2016.18
9. Llovet JM, Montal R, Sia D, Finn RS. Molecular therapies and precision medicine for hepatocellular carcinoma. Nat Rev Clin Oncol. 2018;15(10):599–616. doi:10.1038/s41571-018-0073-4
10. Cabral LKD, Tiribelli C, Sukowati CHC. Sorafenib resistance in hepatocellular carcinoma: the relevance of genetic heterogeneity. Cancers. 2020;12(6):1576. doi:10.3390/cancers12061576
11. Craig AJ, von Felden J, Garcia-Lezana T, Sarcognato S, Villanueva A. Tumour evolution in hepatocellular carcinoma. Nat Rev Gastroenterol Hepatol. 2020;17(3):139–152.
12. Jiao Q, Bi L, Ren Y, Song S, Wang Q, Wang Y-S. Advances in studies of tyrosine kinase inhibitors and their acquired resistance. Mol Cancer. 2018;17(1):36. doi:10.1186/s12943-018-0801-5
13. Rimassa L, Danesi R, Pressiani T, Merle P. Management of adverse events associated with tyrosine kinase inhibitors: improving outcomes for patients with hepatocellular carcinoma. Cancer Treat Rev. 2019;77:20–28. doi:10.1016/j.ctrv.2019.05.004
14. Cheng A-L, Kang Y-K, Chen Z, et al. Efficacy and safety of sorafenib in patients in the Asia-Pacific region with advanced hepatocellular carcinoma: a Phase III randomised, double-blind, placebo-controlled trial. Lancet Oncol. 2009;10(1):25–34. doi:10.1016/S1470-2045(08)70285-7
15. Assenat E, Pageaux G-P, Thézenas S, et al. Sorafenib alone vs. sorafenib plus GEMOX as 1-line treatment for advanced HCC: the Phase II randomised PRODIGE 10 trial. Br J Cancer. 2019;120(9):896–902. doi:10.1038/s41416-019-0443-4
16. Tang W, Chen Z, Zhang W, et al. The mechanisms of sorafenib resistance in hepatocellular carcinoma: theoretical basis and therapeutic aspects. Signal Transduct Target Ther. 2020;5(1):87. doi:10.1038/s41392-020-0187-x
17. Cao W, Liu X, Zhang Y, et al. BEZ235 increases the sensitivity of hepatocellular carcinoma to sorafenib by inhibiting PI3K/AKT/mTOR and inducing autophagy. Biomed Res Int. 2021;2021:5556306. doi:10.1155/2021/5556306
18. Zhang PF, Li KS, Shen YH, et al. Galectin-1 induces hepatocellular carcinoma EMT and sorafenib resistance by activating FAK/PI3K/AKT signaling. Cell Death Dis. 2016;7(4):e2201. doi:10.1038/cddis.2015.324
19. Zhu Y-J, Zheng B, Wang H-Y, Chen L. New knowledge of the mechanisms of sorafenib resistance in liver cancer. Acta Pharmacol Sin. 2017;38(5):614–622. doi:10.1038/aps.2017.5
20. Stout SM, Cimino NM. Exogenous cannabinoids as substrates, inhibitors, and inducers of human drug metabolizing enzymes: a systematic review. Drug Metab Rev. 2014;46(1):86–95. doi:10.3109/03602532.2013.849268
21. van Schaik RHN. CYP450 pharmacogenetics for personalizing cancer therapy. Drug Resist Updat. 2008;11(3):77–98. doi:10.1016/j.drup.2008.03.002
22. Lai X-S, Yang L-P, Li X-T, Liu J-P, Zhou Z-W, Zhou S-F. Human CYP2C8: structure, substrate specificity, inhibitor selectivity, inducers and polymorphisms. Curr Drug Metab. 2009;10(9):1009–1047. doi:10.2174/138920009790711832
23. Kirchheiner J, Thomas S, Bauer S, et al. Pharmacokinetics and pharmacodynamics of rosiglitazone in relation to CYP2C8 genotype. Clin Pharmacol Ther. 2006;80(6):657–667. doi:10.1016/j.clpt.2006.09.008
24. Kaspera R, Naraharisetti SB, Tamraz B, et al. Cerivastatin in vitro metabolism by CYP2C8 variants found in patients experiencing rhabdomyolysis. Pharmacogenet Genomics. 2010;20(10):619–629. doi:10.1097/FPC.0b013e32833ecace
25. Wang X, Yu T, Liao X, et al. The prognostic value of CYP2C subfamily genes in hepatocellular carcinoma. Cancer Med. 2018;7(4):966–980. doi:10.1002/cam4.1299
26. Wang X, Liao X, Yang C, et al. Identification of prognostic biomarkers for patients with hepatocellular carcinoma after hepatectomy. Oncol Rep. 2019;41(3):1586–1602.
27. Subramanian A, Tamayo P, Mootha VK, et al. Gene set enrichment analysis: a knowledge-based approach for interpreting genome-wide expression profiles. Proc Natl Acad Sci U S A. 2005;102(43):15545–15550. doi:10.1073/pnas.0506580102
28. Kulik L, El-Serag HB. Epidemiology and management of hepatocellular carcinoma. Gastroenterology. 2019;156(2):477–491 e471. doi:10.1053/j.gastro.2018.08.065
29. Bruix J, Reig M, Sherman M. Evidence-based diagnosis, staging, and treatment of patients with hepatocellular carcinoma. Gastroenterology. 2016;150(4):835–853. doi:10.1053/j.gastro.2015.12.041
30. Couri T, Pillai A. Goals and targets for personalized therapy for HCC. Hepatol Int. 2019;13(2):125–137. doi:10.1007/s12072-018-9919-1
31. Chow PKH, Gandhi M, Tan SB, et al. SIRveNIB: Selective Internal Radiation Therapy versus sorafenib in Asia-Pacific patients with hepatocellular carcinoma. J Clin Oncol. 2018;36(19):1913–1921. doi:10.1200/JCO.2017.76.0892
32. Ricke J, Klumpen HJ, Amthauer H, et al. Impact of combined selective internal radiation therapy and sorafenib on survival in advanced hepatocellular carcinoma. J Hepatol. 2019;71(6):1164–1174. doi:10.1016/j.jhep.2019.08.006
33. Pascual S, Herrera I, Irurzun J. New advances in hepatocellular carcinoma. World J Hepatol. 2016;8(9):421–438. doi:10.4254/wjh.v8.i9.421
34. Wilhelm SM, Carter C, Tang L, et al. BAY 43-9006 exhibits broad spectrum oral antitumor activity and targets the RAF/MEK/ERK pathway and receptor tyrosine kinases involved in tumor progression and angiogenesis. Cancer Res. 2004;64(19):7099–7109. doi:10.1158/0008-5472.CAN-04-1443
35. Casadei-Gardini A, Scartozzi M, Tada T, et al. Lenvatinib versus sorafenib in first-line treatment of unresectable hepatocellular carcinoma: an inverse probability of treatment weighting analysis. Liver Int. 2021;41(6):1389–1397. doi:10.1111/liv.14817
36. Kim JJ, McFarlane T, Tully S, Wong WWL. Lenvatinib versus sorafenib as first-line treatment of unresectable hepatocellular carcinoma: a cost-utility analysis. Oncologist. 2020;25(3):e512–e519. doi:10.1634/theoncologist.2019-0501
37. Xie F, Feng S, Sun L, Mao Y. The first-line treatment for unresectable hepatocellular carcinoma patients: lenvatinib versus sorafenib, or beyond? Hepatobiliary Surg Nutr. 2018;7(3):221–224. doi:10.21037/hbsn.2018.06.06
38. Wu Y, Zhang Y, Qin X, Geng H, Zuo D, Zhao Q. PI3K/AKT/mTOR pathway-related long non-coding RNAs: roles and mechanisms in hepatocellular carcinoma. Pharmacol Res. 2020;160:105195. doi:10.1016/j.phrs.2020.105195
39. Wu B, Li A, Zhang Y, et al. Resistance of hepatocellular carcinoma to sorafenib can be overcome with co-delivery of PI3K/mTOR inhibitor BEZ235 and sorafenib in nanoparticles. Expert Opin Drug Deliv. 2020;17(4):573–587. doi:10.1080/17425247.2020.1730809
40. Backman JT, Filppula AM, Niemi M, Neuvonen PJ. Role of cytochrome P450 2C8 in drug metabolism and interactions. Pharmacol Rev. 2016;68(1):168–241. doi:10.1124/pr.115.011411
41. Neuvonen PJ, Niemi M, Backman JT. Drug interactions with lipid-lowering drugs: mechanisms and clinical relevance. Clin Pharmacol Ther. 2006;80(6):565–581. doi:10.1016/j.clpt.2006.09.003
42. Del Re M, Fogli S, Derosa L, et al. The role of drug-drug interactions in prostate cancer treatment: focus on Abiraterone acetate/prednisone and enzalutamide. Cancer Treat Rev. 2017;55:71–82. doi:10.1016/j.ctrv.2017.03.001
43. Rodriguez-Antona C, Ingelman-Sundberg M. Cytochrome P450 pharmacogenetics and cancer. Oncogene. 2006;25(11):1679–1691. doi:10.1038/sj.onc.1209377
44. Seefelder C, Leeder JS. Cytochrome P450 pharmacogenetics and anaesthesia. Paediatr Anaesth. 2002;12(9):810–811. doi:10.1046/j.1460-9592.2002.00997_3.x
45. Ren X, Ji Y, Jiang X, Qi X. Downregulation of CYP2A6 and CYP2C8 in tumor tissues is linked to worse overall survival and recurrence-free survival from hepatocellular carcinoma. Biomed Res Int. 2018;2018:5859415. doi:10.1155/2018/5859415
46. Li C, Zhou D, Jiang X, Liu M, Tang H, Mei Z. Identifying hepatocellular carcinoma-related hub genes by bioinformatics analysis and CYP2C8 is a potential prognostic biomarker. Gene. 2019;698:9–18. doi:10.1016/j.gene.2019.02.062
47. Li K, Chen Y. CYP2C8 regulated by GAS5/miR-382-3p exerts anti-cancerous properties in liver cancer. Cancer Biol Ther. 2020;21(12):1145–1153. doi:10.1080/15384047.2020.1840886
48. Liang J, Zubovitz J, Petrocelli T, et al. PKB/Akt phosphorylates p27, impairs nuclear import of p27 and opposes p27-mediated G1 arrest. Nat Med. 2002;8(10):1153–1160. doi:10.1038/nm761
49. Razavipour SF, Harikumar KB, Slingerland JM. p27 as a transcriptional regulator: new roles in development and cancer. Cancer Res. 2020;80(17):3451–3458. doi:10.1158/0008-5472.CAN-19-3663
50. Zhu M, Wu M, Bian S, et al. DNA primase subunit 1 deteriorated progression of hepatocellular carcinoma by activating AKT/mTOR signaling and UBE2C-mediated P53 ubiquitination. Cell Biosci. 2021;11(1):42. doi:10.1186/s13578-021-00555-y
 © 2021 The Author(s). This work is published and licensed by Dove Medical Press Limited. The
full terms of this license are available at https://www.dovepress.com/terms
and incorporate the Creative Commons Attribution
- Non Commercial (unported, 3.0) License.
By accessing the work you hereby accept the Terms. Non-commercial uses of the work are permitted
without any further permission from Dove Medical Press Limited, provided the work is properly
attributed. For permission for commercial use of this work, please see paragraphs 4.2 and 5 of our Terms.
© 2021 The Author(s). This work is published and licensed by Dove Medical Press Limited. The
full terms of this license are available at https://www.dovepress.com/terms
and incorporate the Creative Commons Attribution
- Non Commercial (unported, 3.0) License.
By accessing the work you hereby accept the Terms. Non-commercial uses of the work are permitted
without any further permission from Dove Medical Press Limited, provided the work is properly
attributed. For permission for commercial use of this work, please see paragraphs 4.2 and 5 of our Terms.