")
Back to Journals » Diabetes, Metabolic Syndrome and Obesity » Volume 13
Cyclophilin A (CyPA) as a Novel Biomarker for Early Detection of Diabetic Nephropathy in an Animal Model
Authors El-Ebidi AM , Saleem TH , Saadi MGE, Mahmoud HA , Mohamed Z , Sherkawy HS
Received 4 May 2020
Accepted for publication 4 September 2020
Published 20 October 2020 Volume 2020:13 Pages 3807—3819
DOI https://doi.org/10.2147/DMSO.S260293
Checked for plagiarism Yes
Review by Single anonymous peer review
Peer reviewer comments 4
Editor who approved publication: Prof. Dr. Antonio Brunetti
Abdallah Mahmoud El-Ebidi,1 Tahia H Saleem,2 Mohamed Gamal El-din Saadi,3 Hala Abdallah Mahmoud,4 Zeinab Mohamed,5 Hoda S Sherkawy1
1Department of Medical Biochemistry and Molecular Biology, Faculty of Medicine, Aswan University, Aswan, Egypt; 2Department of Medical Biochemistry and Molecular Biology, Faculty of Medicine, Assuit University, Assuit, Egypt; 3Department of Internal Medicine and Nephrology, Kasr Al-Aini School of Medicine, Cairo University, Cairo, Egypt; 4Department of Internal Medicine and Nephrology, Aswan University, Aswan, Egypt; 5Department of Zoology, Faculty of Science, Aswan University, Aswan, Egypt
Correspondence: Hoda S Sherkawy Tel +20 1150733888
Fax +20 2433767
Email [email protected]
Background and Aim: Type 2 diabetes mellitus (DM) is the most common single cause of the end-stage renal disease (ESRD). Cyclophilin A (CyPA) is an 18-kD protein. The connection between diabetic nephropathy (DN) and the secreted form of CyPA (sCyPA) has been elucidated in this study that aims to investigate sCyPA correlation with renal dysfunction.
Materials and Methods: Thirty-four male adult Wistar rats weighing 180– 220 g were used. Animals were divided into a study group and a control group, 17 rats in each. Streptozotocin (STZ) and nicotine amide were used to damage some pancreatic cells for induction of type 2 DM. Comparison was made between the study and the control groups. Moreover, a comparison was made between the members of the study group before and after induction of DN.
Results: The rat model that exhibited a higher concentration of urinary sCyPA was detected early in the eighth week. There was a significantly higher level of 24-h urinary CyPA in the study group compared to the control group (p-value=0.004) and there was a significant elevation in the 24-h urinary Cyp-A in the study group after injection of STZ compared to the values before injection (p-value < 0.001). Immunohistochemical analysis of renal tissue revealed that the mean expression of CyPA was higher in the study group than in the control group. For the urinary 24-h CYP-A, using a cutoff of 1.15 ng/mL, the accuracy was 72.4%, sensitivity was (77.8%) and specificity was (67%).
Conclusion: According to this animal study, we proved that CyPA is a valuable marker for DN. It is a more sensitive, noninvasive and rapid biomarker for early detection of any renal affection in human diabetic patients.
Keywords: cyclophilin A, hyperglycemia, type 2 diabetes, diabetic nephropathy early detection, albuminuria
Introduction
Diabetes is a group of metabolic diseases characterized by hyperglycemia resulting from defects in insulin secretion, insulin action, or both. The chronic hyperglycemia of diabetes is associated with long-term damage, dysfunction, and failure of different organs, especially the eyes, kidneys, nerves, heart, and blood vessels.1
Type 2 diabetes mellitus (DM) is the most common cause of the end-stage renal disease.2
Diabetic nephropathy (DN) is a kidney disease characterized by persistent albuminuria due to kidney injury that is caused by prolonged exposure to hyperglycemia and exacerbated by hypertension. Diagnosis relies on urinary albumin to creatinine ratio of 30 mg/g or higher and GFR of less than 60 mL/min/1.73 m2 (which can occur with normal urinary albumin excretion).3
The Joint Committee of Diabetic Nephropathy is trying to develop a new classification of dDN combining both glomerular filtration rate and albuminuria systems.4 There are several markers to predict the onset and progression of DN. Albuminuria is the most commonly used marker. However, it lacks both sensitivity and specificity to detect the early stage of DN.5
ESRD in almost half the patients is due to DN, and these cases have the worst outcome compared to patients with other causes of ESRD. Although there are many novel drugs for DM, there are no specific curative treatments yet for DN. Reasons for a poor outcome include inadequate markers and the complicated mechanisms of DN.
Different markers of DN were reviewed,6–8 including fibroblast growth factor9 tubular markers10 (kidney injury molecule 1; neutrophil gelatinase-associated lipocalin; and liver type fatty acid-binding protein, L-FABP),11 inflammatory markers (interleukin 6, IL-6; IL-8; monocyte chemoattractant protein 1; and interfering–inducible protein),12 urinary 8-hydroxy-20-deoxyguanosine,13 serum cystatin C14 and so on. Among these, genetic susceptibility almost always leads to irreversible DN, and detection of the clinical markers mostly occurs too late to diagnose and monitor the progression of DN.
Cyclophilins (CyPs) comprise the family of peptidyl-prolyl isomerases (PPIases), which were ubiquitously expressed in every prokaryotic as well as eukaryotic cells.15 Cyclophilin A (CyPA) is a ubiquitous immunophilin that physiologically regulates protein folding, trafficking, and interaction16,17 and is localized in every major cellular compartment.18 All the members of this family have a common conserved domain of peptidyl-prolyl cis-trans isomerases bordered by a unique domain, which functionally sequesters each member.19 The PPIase is an enzymatic process involved in the interconversion between the cis and trans isomers of the N-terminal amide bond of the amino acid proline,17,20 which particularly induces the folding process of proteins.21
The kidney contains a relatively high level of CyPA in its cells,22 which is highly expressed in proximal tubular epithelial cells (PTECs) relative to other kidney cells.23 The study by Tasi et al was the first to demonstrate the relationship between CyPA and pathogenesis of DN.24
Tsai et al24 showed that the CyPA was detectable in patients with stage 2 DN, with high sensitivity and specificity, and the level increased as DN progressed. Furthermore, high glucose treatment increased sCyPA expression in cultured mesangial cells and PTECs.
sCyPA was also detected in diabetic patient's plasma25 and was shown to be secreted by monocytes in response to hyperglycemia,26 indicating that sCyPA could be a potential secretory marker in type 2 DM. Furthermore, a relatively high expression level of CyPA in normal kidneys22 has led to the speculation that sCyPA may be associated with solid organ damage. As a product directly produced by kidney, urine could be a good measure for renal injury detection. Therefore, we postulated that CyPA level in urine would be the most suitable indicator of DN so we validated the urinary level of (CyPA) of diabetic rats as an early noninvasive detector of renal impairment.
Research Approach and Methodology
Animals
Male adult Wistar rats weighing 180–220 g, obtained from the animal house of the faculty of Medicine, Aswan University were used in all experiments. These animals are used after one week of proper acclimatization to the animal house conditions (12-h light/dark cycle) at 25°C temperature. The rats are housed in stainless steel cages, four-to-five per cage and allowed free access to standard rodent food and water. The experiments were carried out according to the protocol approved by the Ethics Committee of the University in accordance with the ethical guidelines for pain research in conscious animals.27
Eight out of the 48 rats died, some of them died accidentally without any cause and others due to complication of diabetes and some due to very hot weather although air conditioning was provided, and six rats were excluded from the experiment because they had returned to normal blood glucose level. So only 34 out of 48 rats were suitable for the experiment.
Experimental Protocol
1) Experimental Induction of Diabetic Nephropathy:
- Type II diabetes is induced in overnight fasted rats by an intraperitoneal injection (i.p.) of 110 mg/kg nicotinamide (NA) followed after 15 min by i.p. injection of 60 mg/kg freshly prepared streptozotocin (STZ).28 STZ dissolved in 0.1 M citrate buffer (pH=4.5).29,30 The STZ-NA treated animals are allowed to drink 5% glucose solution instead of drinking water for the first 72 h after NA-STZ challenge to overcome initial hypoglycemia induced by STZ. Blood-glucose level (nonfasting) was determined at 72 h post-STZ injection, through tail snipping31 using Accu-Chek Sensor Comfort (Roche Diagnostics, Berlin, Germany).
- Hyperglycemia is confirmed by elevated blood glucose levels at 72 h, on the seventh day and every four weeks after NA-STZ injection. Rats with fasting blood glucose level above 200 mg/dL after 72 h and on the seventh day after treatment are considered diabetic and used for diabetic nephropathy study.28 After eight weeks, the blood and urine samples from these rats were tested for hyperglycemia and proteinuria. The urine protein was estimated by the biuret method using a commercial kit.32 Rats with hyperglycemia <200 mg/dL and proteinuria at the end of eight weeks post-NA-STZ injection are selected for DN studies.
Experimental Design
Animals are divided into two groups, 17 rats in each.
Group 1: Nondiabetic control rats receiving citrate buffer and saline only.
Group 2: Diabetic rats injected with NA-STZ.
Blood and urine samples were collected from all the rats of the study and control groups at the beginning and the end of the experiment. A comparison was made between the study and control groups, and another comparison between the rats of the study group before and after NA-STZ injection for induction of DN. All the rats are placed in metabolic cages for 24-h urine collection before their sacrifice.
Biochemical Measurements
Twenty-four-hour urinary sCyPA (ng/mL): The amount of daily urine was collected from the metabolic cage on three successive days and the average volume was used. We used the rat CyPA ELISA Kit Glory Science Co., Ltd, CATALOG #:30,674 for determining sCyPA. All data of urinary CyPA were double-checked at least twice. Urine was immediately stored in an ice package within four hours and then restocked under −80°C until analysis.
- Blood samples were collected for biochemical measurements from the orbital sinus of veins of the overnight fasted rats before the experiment. At the end of the experimental duration, the overnight fasted rats are sacrificed by decapitation. Blood and kidney tissues were obtained from each rat for biochemical measurements, histopathology and immunohistochemistry. After centrifugation of blood samples for 10 min, the serum was collected for estimating the level of urea and creatinine (ie, kidney function tests). The serum samples could be used directly or stored at −20°C until assay.
- Serum creatinine mg/dL level was estimated by the standard alkaline-picrate method using a commercially available creatinine estimation kit.
- The serum level of urea mg/dL was measured by the urease-colorimetric method using a commercially available kit according to the manufacturer’s instructions.
- Twenty-four-hour urinary creatinine (mg/kg/24 h) level and microalbumin (mg/24 h) were collected for the A/C ratio (mg albumin/g creatinine). All biochemical tests were performed by Chem-7 Erba Diagnostics, Germany.
- We confirmed the occurrence of DN on the diabetic group (after induction of diabetes type 2 after two months) by spectrophotometer using 24-hurinary protein sample and a micrototal protein biochemical kit. We also also conducted a histopathological microscopic examination of the affected rats We confirmed the nephropathy by renal tissue pathological changes and then selected the best results for immunohistochemical analysis for expression of the intended marker.
Histopathology
Renal tissue samples were dissected from both kidneys. There was no difference in weight or size of both kidneys fixed in 10% neutral buffered formalin for 72 h. Samples were trimmed and processed by dehydration in serial grades of ethanol, cleared in xylene, tissue infiltration and embedded in Paraplast tissue embedding media. Then 4μN thick tissue sections were cut by a rotatory microtome.
The sections were stained with:-
- Harris' H&E as a general tissue examination staining method
- Periodic acid and Schiff (PAS) technique for demonstration of glomerular basement membranes according to Bancroft and Stevens.33
Cyclophilin A Immunohistochemical Staining
Depraffinized five-micron thick tissue sections were prepared, treated by 3% hydrogen peroxide for 20 min, washed with PBS and then incubated with anti-CyPA according to manufacturer’s guide by using anti-CyPA rabbit polyclonal antibody (NBP1-30,993) Novus Biologicals Co. (1:100) for 30 min. Then the tissue sections were washed with PBS followed by incubation with secondary antibody HRP Envision kit (DAKO) for 20 min and washed with PBS then incubated with diaminobenzidine (DAB) for 10 minutes. The tissue sections were washed with PBS then counterstained with hematoxylin, dehydrated and cleared in xylene then cover slipped for microscopic analysis.
Microscopic Analysis
Seven random nonoverlapping fields per tissue section per sample were selected for determination of glomerular basement membrane thickness in PAS stained tissue sections and immune expression percentage of CyPA in immunostained tissue sections. All data and micrographs were obtained by using full HD microscopic camera operated by the Leica application module for tissue sections analysis (Leica Microsystems GmbH, Wetzlar, Germany).
Statistical Methods
Statistical analysis was carried out using IBM-SPSS® Statistics version 22 (IBM Corp., Armonk, NY, USA). Numerical data were expressed as means and standard deviations or medians and ranges as appropriate. Data were tested for normality using the Kolmogorov–Smirnov test/Shapiro–Wilk test. For non-normally distributed quantitative data, a comparison between the study and control groups was conducted using the Mann–Whitney test (nonparametric t-test). Wilcoxon-signed ranks test was used to compare two consecutive measures of numerical variables. Due to multiple comparisons, the p-value was corrected using the Bonferroni method. Spearman-rho method was used to test the correlation between numerical variables. The receiver operating characteristic (ROC) curve was used for determining the area under the curve (AUC) and the prediction of the cutoff values. All tests were two-tailed. A p-value of <0.05 was considered significant.
Results
The current study is a case–control one, including two groups, a diabetic (study group) and a healthy (control group). The study group included 17 rats injected with single dose of STZ following nicotinamide for induction of type 2 diabetes and the control group (n=17) received a single injection of citrate buffer and saline. All biochemical parameters in the control group were measured before and after injection of saline and all were within the normal range and did not show any statistical difference.
Table 1 showed the biochemical parameters (urine creatinine mg/kg/24 h, 24 h protein mg/24 h, A:C ratio (mg albumin/g creatinine), S Cr mg/dL, S urea mg/dL, 24-h urinary CyPA ng/mL, blood glucose mg/dl, U volume mL/24hour and weight/gm.), differences in the study vs the control group. There was statistically significant difference in the levels of urine creatinine, 24-h protein, A:C ratio, serum creatinine, 24-h urinary CYP-A and blood glucose between groups. However, there was a nonsignificant difference between the study and control groups concerning the serum urea.
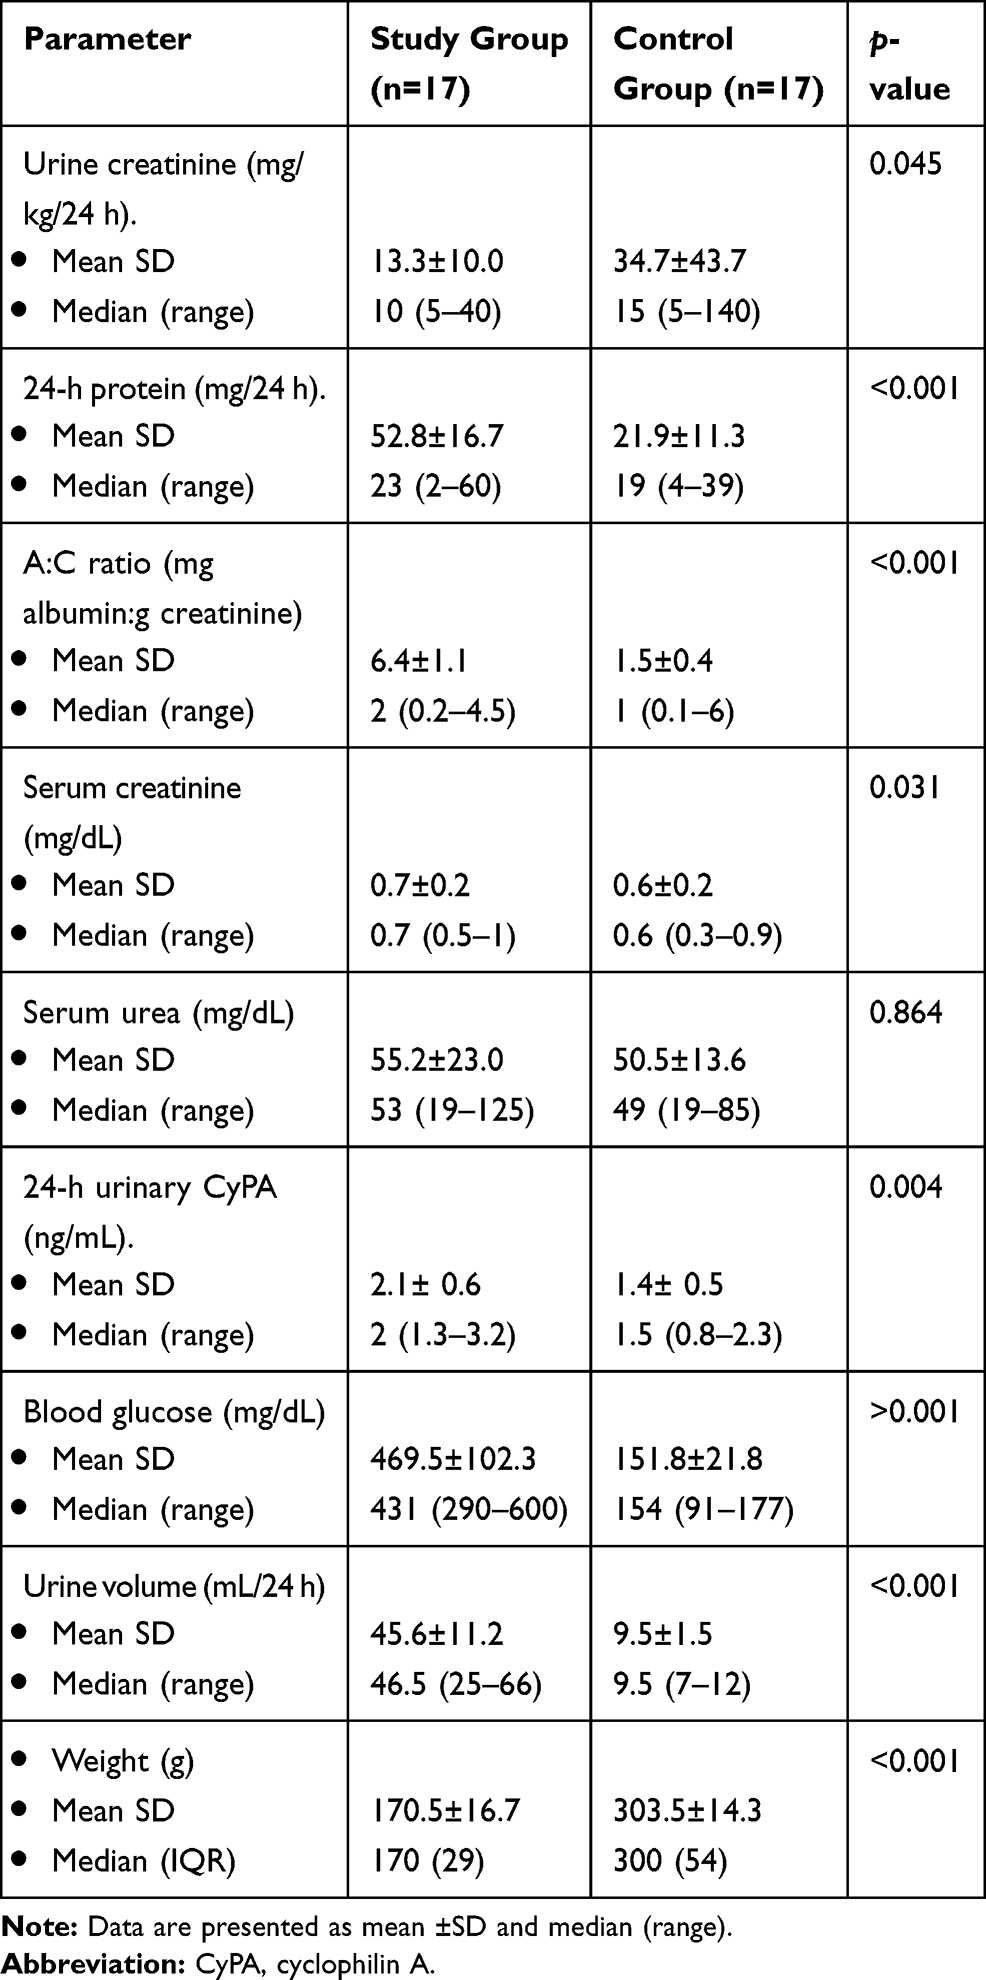 |
Table 1 Biochemical Parameters in the Study and Control Groups After Injection Readings |
In other words, the mean level of urine creatinine significantly decreased in the study group after the induction of diabetes compared to the control group (13.3±10.0 vs 34.7±43.7) with p-value 0.045. In addition, 24-h urine protein was significantly higher in the study group after the induction of diabetes compared to the control group (52.8±16.7 vs 21.9±11.3) with p-value of >0.001. The mean level of A:C ratio as significantly higher in the study group than the control group (6.4±1.1 vs.1.5±0.4) with p-value of >0.001. The mean level of serum creatinine was significantly higher in the study group after the induction of diabetes compared to the control group (0.6±0.1 vs 0.7±0.2) with p-value =0.032.
Moreover, there was a significantly higher level of 24-h urinary CyPA in the study group compared to the control group (2.1±0.6 vs 1.4±0.5) with p-value=0.004 (Figure 1). Likewise, the level of blood glucose was significantly higher in the study group compared to the control group (469.5±102.3 vs 151.8±21.8) with a p-value <0.001.
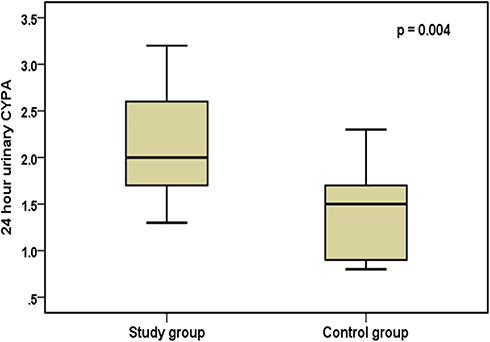 |
Figure 1 Median Urinary CyPA Comparison between Groups. |
Concerning the comparison between the two groups in the urine volume and weight, there was a significantly higher urine volume/24 h in the study group compared to the control group (45.6±11.2 vs 9.5±1.5) with a p-value <0.001. In addition, there was a significantly lower weight in the study group compared to the control group (170.5±16.7 vs 303.5±14.3) with a p-value <0.001.
Table 2 illustrated the comparison between the study group before and after the injection of STZ/nicotinamide where the values before injection act as reference values for each rat.
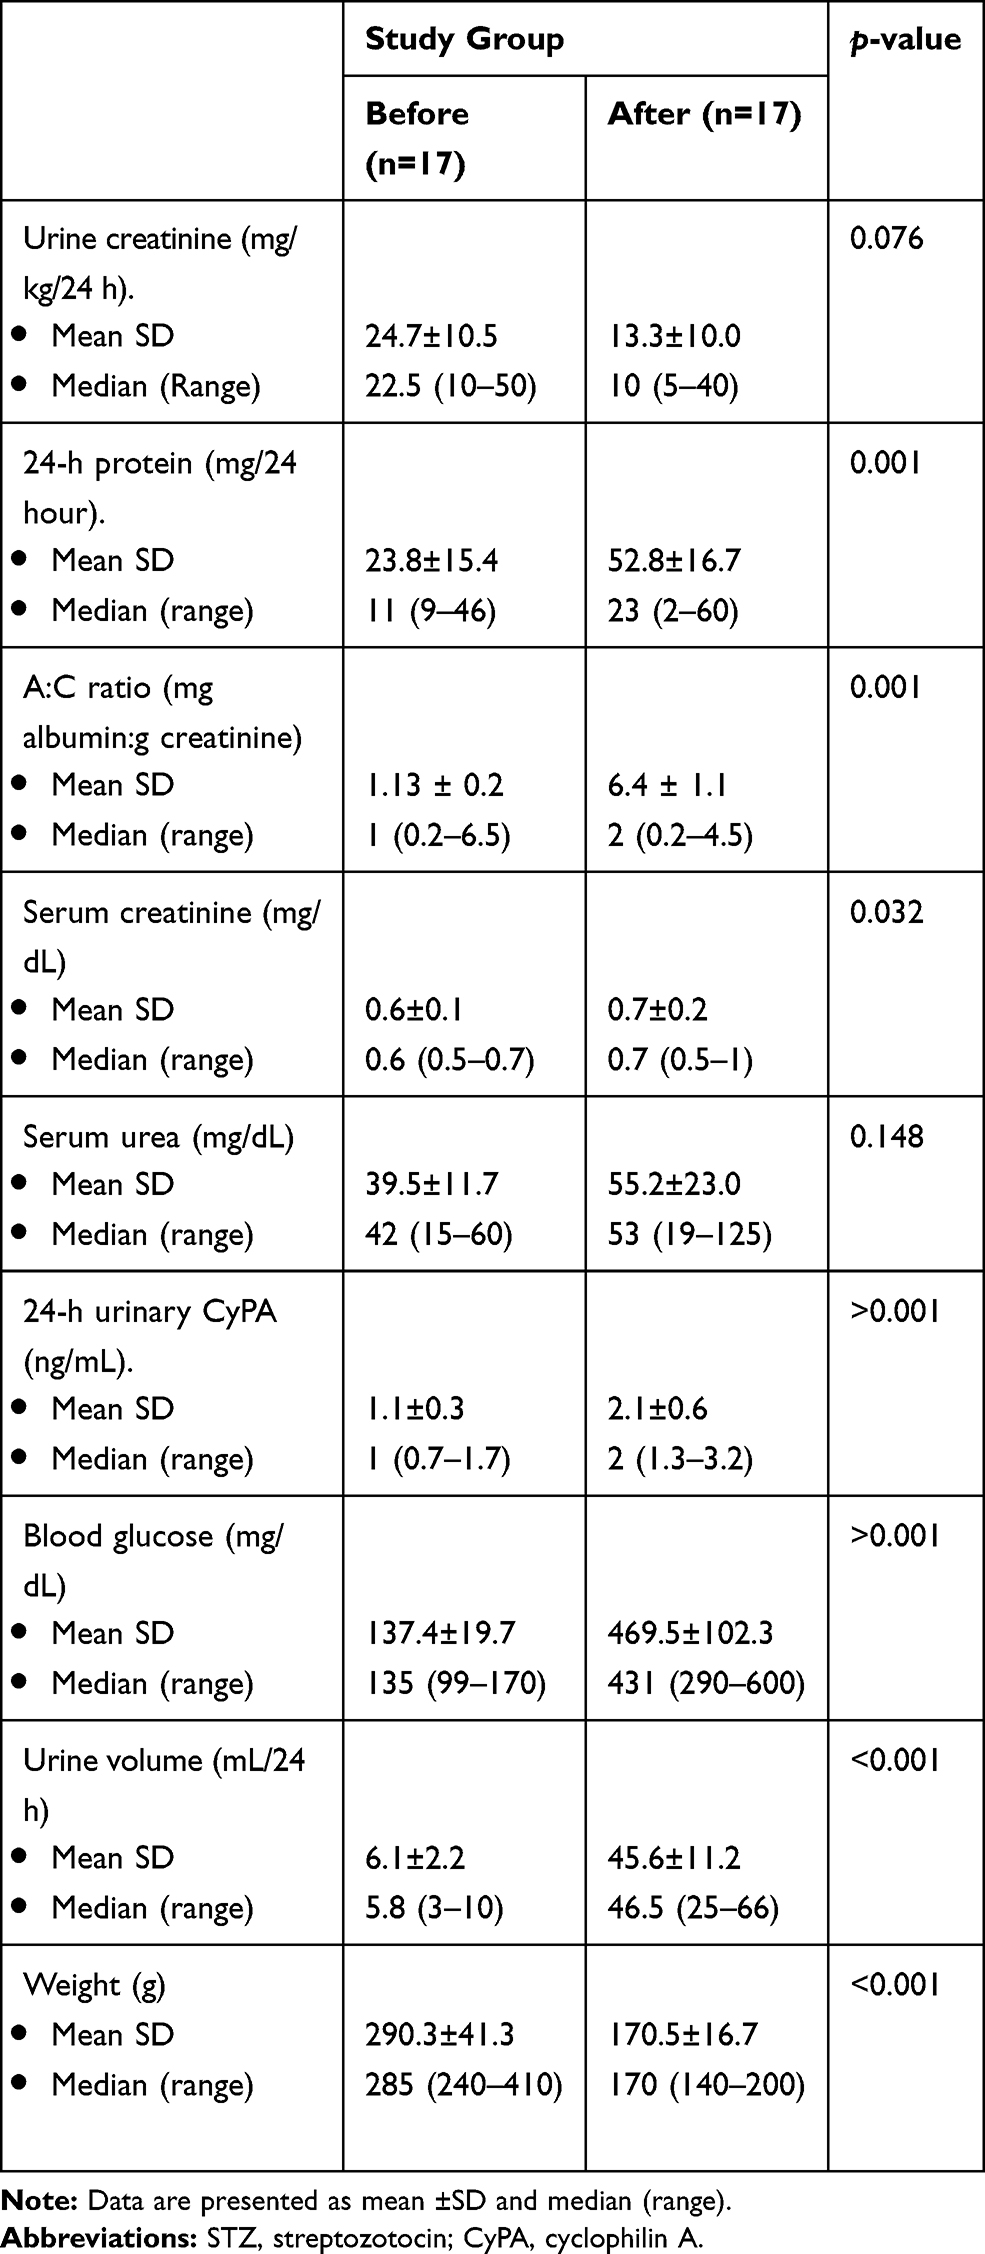 |
Table 2 Comparison Between Study Group Before and After the Injection of STZ/Nicotinamide According to Biochemical Parameters |
Regarding the biochemical parameters of (urine creatinine mg/kg/24 h, 24 h protein mg/24 h A:C ratio (mg albumin/g creatinine), S Cr mg/dL, S urea mg/dL, 24 h urinary CyPA ng/mL, blood glucose mg/dL, U volume mL/24 h and weight/g), there was a significantly higher difference in 24-h urinary protein in the study group after injection compared to the values before injection (52.8±16.7 vs 23.8±15.4) with a p-value=0.001. Moreover, there was a significant difference regarding the comparison between A:C ratios in the same study group before and after injection of STZ (1.13±0.2 vs 6.44±1.1) with a p-value=0.001.
Furthermore there was a significant difference in the level of serum creatinine in the study group after injection of STZ compared to the levels before injection (0.6±0.1 vs 0.7±0.2) with a p-value=0.032. There was also a significant elevation in the 24-h urinary CyPA in the study group after injection of STZ compared to the values before injection (1.1±0.3 vs 2.1±0.6) with a p-value <0.001 (Figure 2). In the same way, there was a significant elevation in the blood glucose level in the study group after injection of STZ compared to the values before (137.4±19.7 vs 469.5±102.3) with a p-value <0.001.
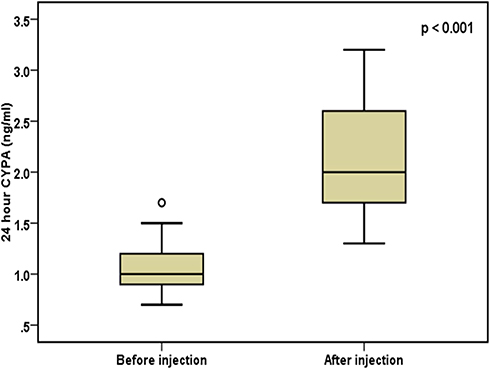 |
Figure 2 Twenty-four-hour CyPA in the study group after injection and control group. |
Likewise, there was a significant increase in urine volume/24 h in the study group after injection of STZ compared with the same group before injection (45.6±11.2 vs 6.1±2.2) with a p-value <0.001. Moreover, there was a significant decrease in weight in grams of the study group after the injection of STZ compared with the same group before injection (290.3±41.3 vs 170.5±16.7) with a p-value <0.001.
Histopathological examination of renal tissue from both control and diabetic group was performed as illustrated in (Figure 3A and B) then PSA (Figure 4Aand B) and antigen detection via immunohistochemistry were performed (Figure 5A and B) to show the degree of CyPA expression and its correlation with histopathological affection of the kidney.
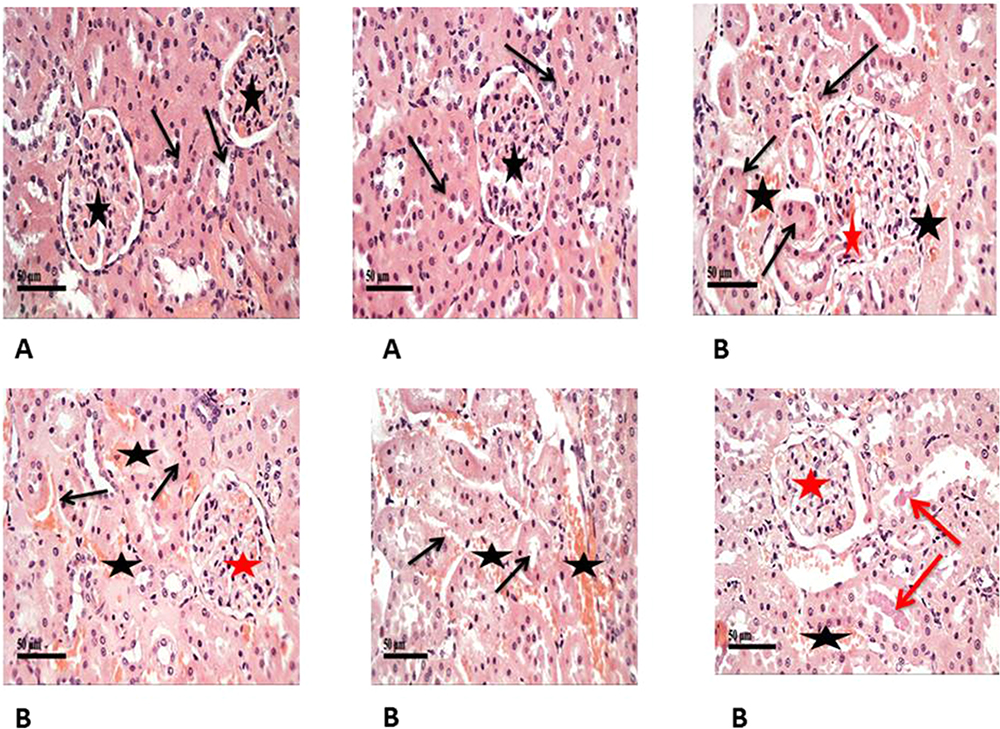 |
Figure 3 Shows H&E staining of histopathological changes in the groups of kidney tissues (400×). (A) Control samples had normal morphological features of renal parenchyma with apparent intact renal corpuscles (stars) and different nephron segments displaying apparent intact renal tubular epithelium (arrows) as well as intact vasculature. (B) Model samples showed the effect of STZ on histological structure of kidneys showed marked congestion of renal glomeruli (red stars) as well as many dilated and congested intertubular blood vessels (black stars). Frequent records of degenerative or necrotic changes of renal tubular epithelium in proximal and distal convoluted tubules with significant records of pyknotic nuclei (black arrows) and occasional intraluminal eosinophilic casts (red arrows). |
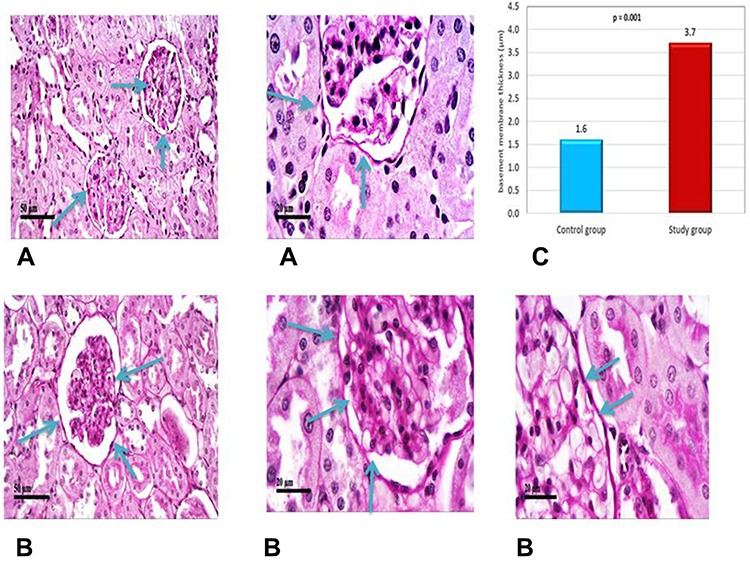 |
Figure 4 (A) Intact Glomerular basement membranes in PAS stain (blue arrows). (B) Higher records of glomerular basement membrane thickening (blue arrows). (C) Basement membrane thickness in model group (diabetic) in PSA staining is statistically significant higher 3.7±0.7 µm than control group 1.6±0.5 µm with p-value=0.001. |
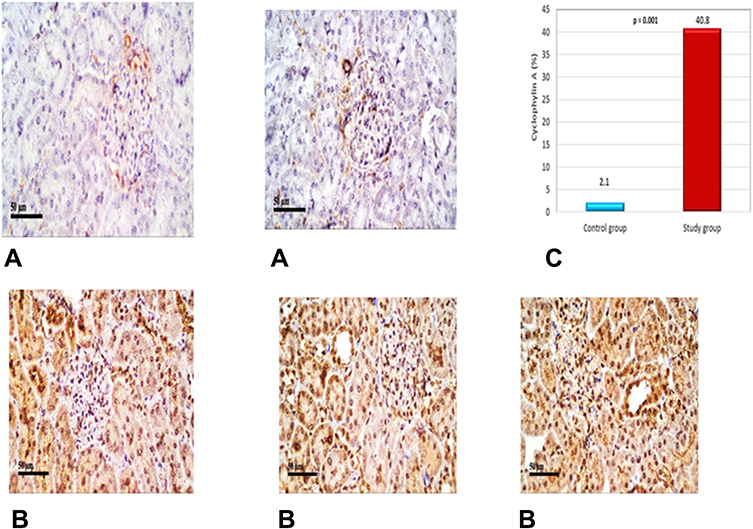 |
Figure 5 (A) Cyclophilin A IHC (400×) expression in control group. (B) Cyclophilin A IHC expression in the study group. The mean expression of CyPA in the control group is 2.1± 0.8% in contrast to the model where the mean expression was 10-folds (40.8±3.0%) which was statistically significantly higher than the control group (p>0.001) (C). |
Table 3 demonstrated the basement membrane thickness and mean expression of cyclophilin in the study group compared with the control group. In the current study, we found that the basement membrane was thicker in the study group compared with the control one (3.7±0.7 vs 1.6±0.5, p=0.001) (Figure 4). Likewise, the mean expression of CyPA was higher in the study group than in that of the control one (40.8±3.0 vs 2.1±0.8, p >0.001) (Figure 5).
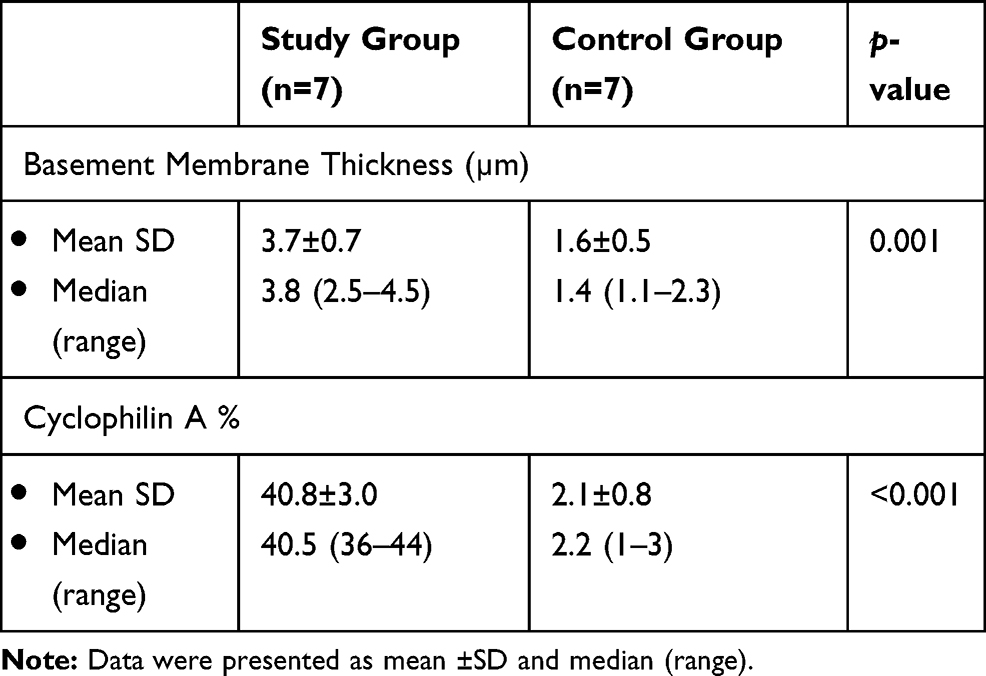 |
Table 3 Comparison Between Study Diabetic Group and Control Group as Concerned with Basement Membrane Thickness and Cyclophilin A Expression Percent |
Diagnostic performance criteria of the renal and urinary biomarkers for prediction of positive cases were illustrated in Table 4, the findings showed that AUC for kidney CyPA% was perfect (1.000; 95%CI: 1.000–1.000, p=0.002). Likewise, AUC for urinary 24-h CyP-A% was very high (0.778; 95%CI: 0.619–0.937, p=0.005). Besides, for BM thickness it was perfect (1.000; 95%CI: 1.000–1.000, p=0.002).
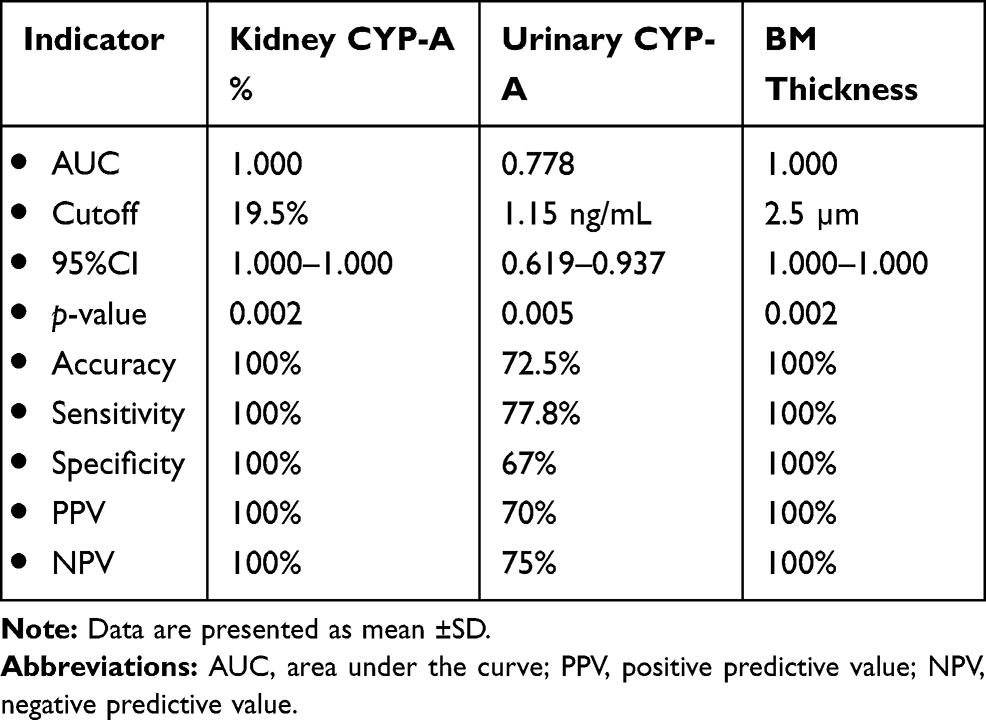 |
Table 4 Diagnostic Performance of Urinary Biomarkers and Basement Membrane Thickness for Prediction of Positive Cases Analyzed as the Area Under the Curve (95%CI) |
For the kidney CyPA%, using a cutoff of 19.5%, the accuracy was 100%, sensitivity was 100% and specificity was 100%. In addition, the positive predictive value (PPV) was 100% and negative predictive value (NPV) was 100%.
For the 24-h urinary CyPA; using a cutoff of 1.15 ng/mL, the accuracy was 72.4%, a sensitivity was 77.8% and specificity was 67%. The, PPV was 70% and NPV was 75% (Figure 6).
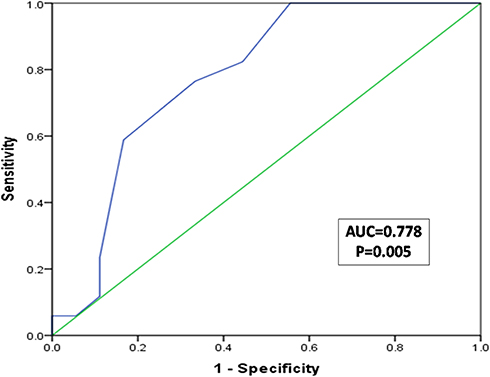 |
Figure 6 ROC curve for detection the cutoff value of positive cases according to urinary CyPA ng/mL. |
Concerning the BM thickness, using a cutoff of 2.5 mm, the accuracy was 100%, sensitivity was 100% and specificity; was 100%. The PPV was 100% and NPV was 100%.
Table 5 illustrates the univariate correlation between urinary CyPA and the other variables. There was a significant positive moderate to high moderate correlation between CyPA and 24-h protein (rho=0.456, p=0.043), A:C ratio (rho=0.426, p=0.011), blood glucose (rho=0.445, p=0.007), urine volume (rho=0.565, p=<0.001).
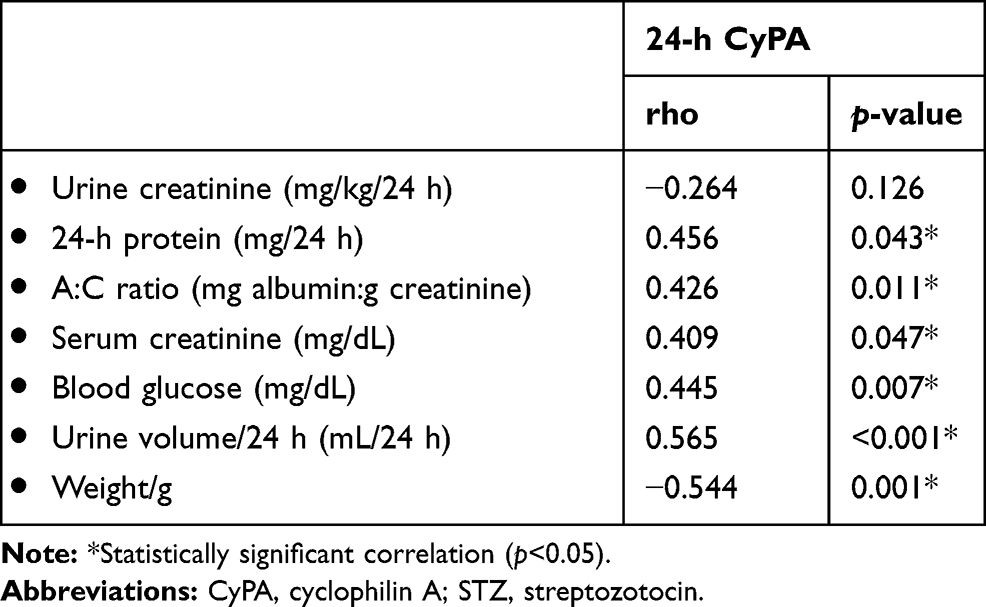 |
Table 5 Correlations Between Urinary CyPA and Other Variables in the Studied Group After Injection of STZ (n=17) |
Conversely, there was a significant negative moderate to high moderate correlation between CyPA and weight (rho= −0.544, p=0.001).
Table 6 showed the multivariate linear regression analysis of the significant factors affecting 24-h urinary CyP-A. The intercept (level of urinary 24-h CyP-A) was 1.12ng/mL (0.95–1.28) after adjusting for all correlates (p<0.001). Moreover, with one mg/L increase in 24-h protein there was 0.1 (0.01–1.4 points) increase in the level of urinary 24-h CyP-A and this was statistically significant (p=0.048). All other correlates were insignificant (p>0.05).
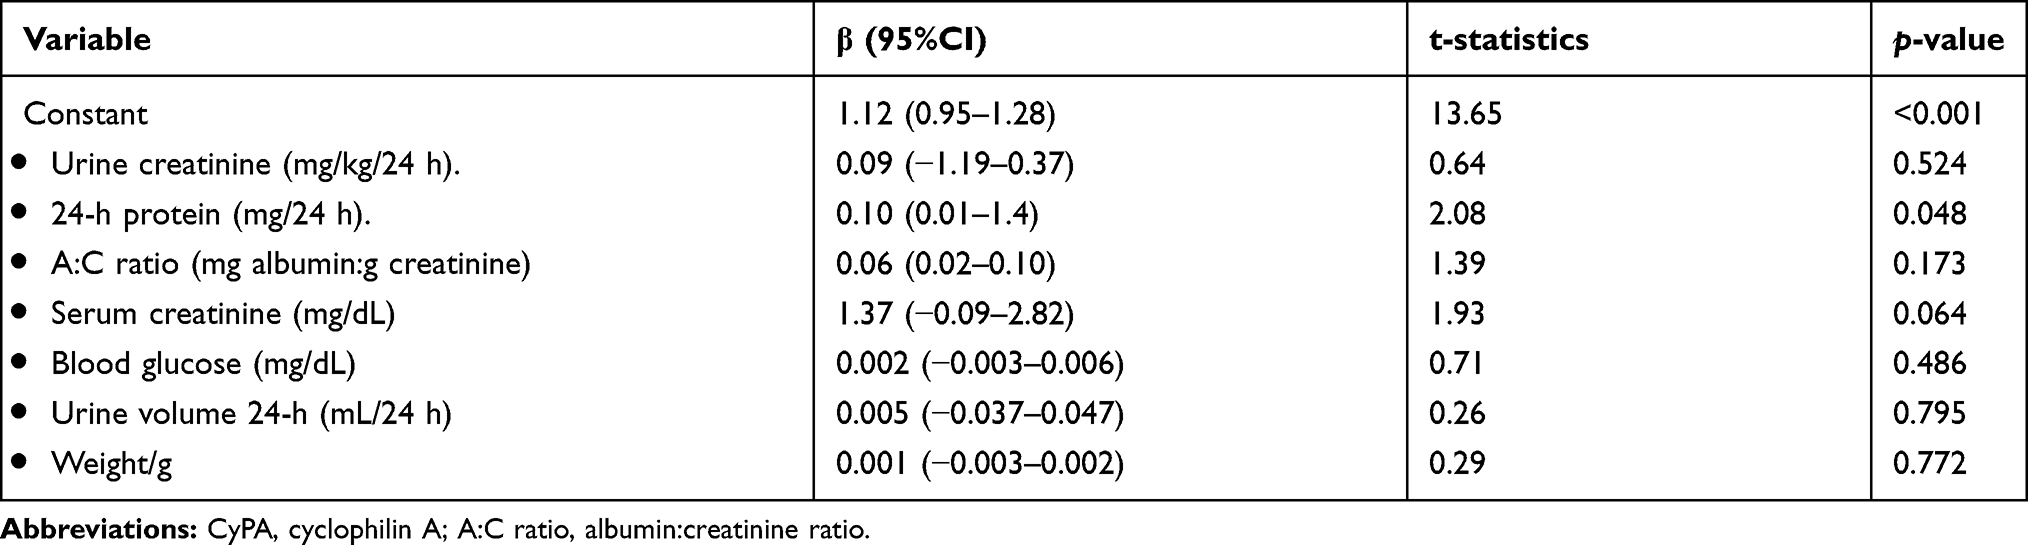 |
Table 6 Independent Correlates of Urinary 24-h CyPA |
Discussion
DN is a clinical syndrome characterized by persistent albuminuria (>300 mg/d or >200 μg/min), which is confirmed on at least two occasions (three-to-six months apart), progressive deterioration in the glomerular filtration rate and elevated arterial blood pressure.34
In the DN animal model, our results demonstrated that sCyPA is an early indicator for DN, according to the findings of Tasi et al, who reported that there were 12.7 folds of increase of sCyPA concentration at the eighth week in the diabetic mice group, so sCyPA was a more sensitive and specific indicator.35 Furthermore, the sCyPA detected in the eighth week was an early marker for DN since the blood sugar began to rise slightly from the fourth week to the eighth36 (this period corresponded to the duration of early-stage DN when mesangial matrix expansion was still not detectable microscopically).
Previous studies demonstrated that CyPA was a good marker for early detection of renal changes in DN.5,24,36–39
The present study describes the rising urinary CyPA in diabetic rats. We tried to find out the possibility of using the urinary CyPA as a new marker for diagnosis of DN as early as possible.
Regarding urinary 24-h protein (microalbumin) and ACR, the present data showed that there was a higher statistically significant difference between the diabetic study group before and after injection of STZ/nicotinamide. Besides there was a statistically significant difference between the study and the control groups after injection readings regarding protein in urine. That proteinuria was mild representing early affection of kidney due to diabetes. The obtained results agree with Ye et al,40 who showed that urinary micro albumin significantly increased in diabetic patients with microalbuminuria diabetic patients than in normoalbuminuric diabetic patients.
Tsai et al,35 reported that the increased sCyPA should not be considered as a general effect due to increased proteinuria in the diabetic mice, because among the four groups of mice, there was no significant upsurge in albuminuria in the sixteenth week compared to that in the eighth from induction of diabetic nephropathy and his data were consistent with previous reports that albuminuria or proteinuria was not the variable to represent the severity of DN in the db/db and db/m groups.41
Our results showed that the degree of albuminuria increased with prolonged duration of DM in the study group after injection of STZ/nicotinamide in contrary to the same group before injection of the drug. This result was consistent with Molitch et al,42 who showed that there was a statistically significant increase in the duration of DM with advancing stages of DN. Although the albuminuria slightly increased in mild early stages, Vestra et al,43 found no difference in the duration of diabetes between the stages of nephropathy.
Amer et al,37 found that the urinary CyPA in GIII (diabetics with albuminuria DN) was higher than in GII (diabetics without albuminuria) and GI (control). In GII the urinary CyPA was higher than in GI. It was also found that the level of urinary CyPA was higher in GIIIb (diabetics with macro albuminuria) than in GIIIa (diabetics with microalbuminuria). Increased serum creatinine level and BUN along with decreased excretion of creatinine in the urine are indicators of the development of diabetic nephropathy.44
Likewise, we found that there was a significant difference regarding urine creatinine between the study and control groups where urine creatinine was higher in control in comparison with study group with p-value where it was decreased in the study group after injection than before injection but did not reach the level of significance. This may be due to a small sample size. Our results go with Mestry et al,45 and Naowaboot et al,46 who reported that The STZ-diabetic rats showed a significant decrease in the level of creatinine in urine compared to the normal control group.
Serum creatinine and BUN levels are important parameters to examine kidney function.47 Elevated levels of serum creatinine and BUN are associated with interstitial atrophy, epithelial necrosis as well as atrophic changes in the glomeruli and thus DN.48 In this study, diabetic rats have shown a significant increase in serum creatinine.
The current study shows a significant difference between the two groups, study and control group after injection of STZ to the study group according to serum creatinine level vs the control group but it is a very slight increase reflecting early affection of kidney tissue. We found the same results in the study group before and after injection of STZ/nicotinamide. There is a statistically significant difference between the two groups concerning serum creatinine. Similarly, El-Saeed et al,49 showed a significant increase of serum creatinine in microalbuminuria and macroalbuminuria diabetic group compared with the normalbuminuria diabetic group.
Jain and Saha,50 Naowaboot et al,46 Mestry et al,45 also found an increased level of serum creatinine in the diabetic rats more than in the control group. Moreover, there was a positive significant correlation between CyPA and serum creatinine blood glucose 24-h urinary protein and A:C ratio respectively, and negative correlation with eGFR (creatinine clearance). Our study is compatible with Tsai et al,24 and Amer et al,37 who found a significant increase in the level of urinary CyPA in the diabetic group compared to the control group and showed that the urinary CyPA increased by a calculated constant rate for each elevated serum creatinine, urinary ACR level and reduced eGFR level.
The diagnostic accuracy of CyPA for prediction of incipient DN was 72.5% and the optimal cutoff value was 1.15 ng/mL with 77.8%, sensitivity and 70.6%, specificity. This finding suggests that CyPA exhibits a high diagnostic accuracy for early detection of DN and could be used as a potential urinary marker. For the CyPA% using a cutoff of 19.5%, the accuracy was 100% with 100% sensitivity and 100% specificity. Concerning the BM thickness using a cutoff of 2.5 µm the accuracy was 100% with 100% sensitivity and 100% specificity.
Tsai et al,35 demonstrated that when the concentration of urinary CyPA was more than 0.7250 ng/mL, we could diagnose the silent stage of DN with a sensitivity of 90.0% and specificity of 72.7%. The area under the curve was up to 0.85, indicating that urinary CyPA is used for the diagnosis of the silent stage of DN.
Abdel Ghafar et al,51 also found that the diagnostic accuracy of CyPA for prediction of incipient DN was 0.914 and the optimal cutoff value was >2.1 ng/mg creatinine with 84.2% sensitivity and 86% specificity. This finding suggests that CyPA exhibits a high diagnostic accuracy for early detection of DN and could be used as a potential urinary marker.
It was concluded that urinary CyPA could provide information about earlier glomerular impairment in patients with diabetes and can be used as earlier markers for DN than micro albuminuria with higher sensitivity. Following results found by Tsai et al,35 we found that CyPA increased in 24-h urine collection in the study group vs control group after injection of STZ/nicotinamide, which is a statistically significant difference. We obtained the same results in the study group before and after injection. Likewise, Tsai et al,35 found that CyPA was a stronger, earlier, and more sensitive marker.
The extent to which the value of the indicator has increased 12.7 folds of increase of sCyPA concentration in the eighth week in the diabetic mice first suggested that sCyPA is a more sensitive and specific indicator. Second, the sCyPA detected in the eighth week is an early marker for DN since the blood sugar in the diabetic mice began to rise slightly from the fourth to the eighth weeks—this period corresponds to the duration of early-stage DN when mesangial matrix expansion is still not detectable microscopically.36 The early stage DN is characterized by hyper filtration, resulting in a more increase in 23% of the glomerular surface (eg hypertrophy or hemodynamic hyper filtration).51 Hence urinary sCyPA is an early DN marker because there is an obvious increase of sCyPA at the eighth week when there are few pathological changes.
Intraperitoneal injection of STZ had a necrotic effect on insulin-producing pancreatic β-cells leading to hyperglycemia and a significant decrease in insulin secretion within 48 h after injection.53 In our study, there was a significant elevation in blood glucose in the study group compared to the control group. The same thing happened in the study group before and after injection of STZ in accordance with El-Baz et al,54 who found that animals injected with STZ exhibited a significant elevation in glucose blood levels after 30 days by 2.7-folds, when compared to normal animals. Moreover, Jelodar et al55 evaluated blood glucose level and found hyperglycemia in different study groups.
Concerning the histopathological study of kidney tissue in the diabetic and control groups we found that control samples demonstrated normal morphological features of renal parenchyma with apparent intact renal corpuscles contrary to the study group that showed marked congestion of renal glomeruli as well as many dilated and congested intertubular blood vessels and so IHC study: the mean expression of CyPA in the control group is (2.1±.8%) in contrast to the model where the mean expression is 10-fold or (40.8±3.0%) that is statistically significantly higher than the control group.
Consistently with a previous study by Tsai et al,35 the increased IHC staining for CyPA was also detected in mesangial cells and tubular cells in DN. The above findings in animal models are all consistent with previous human studies that human urinary CyPA can be detected since stage 2 DN. According to the above reasons, we believe that urinary sCyPA is a much earlier and stronger marker for DN.
Concerning weight, our results showed that there was a weight loss in the study group after injection rather than before injection, and also in the control group. These results are similar to that of Cheng et al,56 Mestry et al,45 Jelodar et al,55 and Jain and Saha50 who found that STZ-induced diabetes is associated with a significant reduction in the body weight due to hyperglycemia, hypoinsulinemia, increased muscle wasting and loss of tissue proteins.
Alternatively, Ishibashi et al,57 and Tsai et al,35 found that their study groups had weight gain within the period of the study. This may be due to unrestricted food or due to progression of insulin resistance.
Our results revealed that there was a statistically significant difference between the study and the control groups after injection concerning urine volume and also with the study group before and after injection. These results go with Jain and Saha50 who observed a significant rise in urine volume in diabetic rats compared to the normal rats. This may be due to the polyuria induced effect of hyperglycemia and diabetes mellitus.
Multivariate linear regression analysis revealed that every unit increased in 24-h protein was associated with 0.1 unit increase in 24-h urinary CyPA. Our result was supported by Tsai et al,35 they found that when ACR increased by 1 mg/g, the concentration of urinary CyPA increased by 0.030 ng/mL and they established an equation to link between them (CyPA=2.461+ACR*0.001).
Urinary 8-hydroxy-2′-deoxyguanosine (8-OHdG) is a reliable and early marker of reactive oxidative stress (ROS) and DN because it can represent DNA damage in early DN.58 Compared to 8-OHdG, cyclophilin A was a stronger, earlier, and more sensitive marker for detection of DN.35
Conclusion
Our study showed that there was a highly significant difference in the level of 24-h urinary CyPA between the study group and the control group. This result was confirmed by immunohistochemical detection of the marker in the kidney tissue after induction of DN to be highly expressed in the study group more than the control group.
In this animal study, sCyPA was shown to be a marker of DN and play a pathological role for DN. The possibility of using sCyPA as a rapid, easy, simple and noninvasive biomarker for detection of any renal affection as early as possible in diabetic nephropathy patients. The sCyPA may have potential as a treatment target and thus further study is needed.
Recommendations
Future research using human subjects and cell lines for more conformation of the current study findings is recommended.
Ethical Considerations
The initial plan of the study was approved by the Ethics Committee of Aswan University with IRB No. 307/3/2019.
Disclosure
The authors report no conflicts of interest in this work.
References
1. Genuth S, Alberti K, Bennett P, et al. Follow-up report on the diagnosis of diabetes mellitus. Diabetes Care. 2003;26(11):3160–3168.
2. Arora MK, Singh UK. Molecular mechanisms in the pathogenesis of diabetic nephropathy: an update. Vascul Pharmacol. 2013;58(4):259–271. doi:10.1016/j.vph.2013.01.001
3. Association AD. 10. Microvascular complications and foot care: standards of medical care in diabetes—2018. Diabetes Care. 2018;41(Supplement 1):S105–S18. doi:10.2337/dc18-S010
4. Haneda M, Utsunomiya K, Koya D, et al. A new classification of diabetic nephropathy 2014: a report from joint committee on diabetic nephropathy. J Diabetes Investig. 2015;6(2):242–246. doi:10.1111/jdi.12319
5. Halimi J-M. The emerging concept of chronic kidney disease without clinical proteinuria in diabetic patients. Diabetes Metab. 2012;38(4):291–297. doi:10.1016/j.diabet.2012.04.001
6. Tramonti G, Kanwar YS. Review and discussion of tubular biomarkers in the diagnosis and management of diabetic nephropathy. Endocrine. 2013;43(3):494–503. doi:10.1007/s12020-012-9820-y
7. Kamijo-Ikemori A, Sugaya T, Kimura K. Novel urinary biomarkers in early diabetic kidney disease. Curr Diab Rep. 2014;14(8):513–515. doi:10.1007/s11892-014-0513-1
8. MacIsaac RJ, Ekinci EI, Jerums G. Markers of and risk factors for the development and progression of diabetic kidney disease. Am J Kidney Dis. 2014;63(2):S39–S62.
9. Titan SM, Zatz R, Graciolli FG, et al. FGF-23 as a predictor of renal outcome in diabetic nephropathy. Clin J Am Soc Nephrol. 2011;6(2):241–247. doi:10.2215/CJN.04250510
10. Nielsen SE, Andersen S, Zdunek D, Hess G, Parving -H-H, Rossing P. Tubular markers do not predict the decline in glomerular filtration rate in type 1 diabetic patients with overt nephropathy. Kidney Int. 2011;79(10):1113–1118. doi:10.1038/ki.2010.554
11. Tramonti G, Kanwar YS. Tubular biomarkers to assess progression of diabetic nephropathy. Kidney Int. 2011;79(10):1042–1044. doi:10.1038/ki.2011.9
12. Wolkow PP, Niewczas MA, Perkins B, et al. Association of urinary inflammatory markers and renal decline in microalbuminuric type 1 diabetics. J Am Soc Nephrol. 2008;19(4):789–797. doi:10.1681/ASN.2007050556
13. Hinokio Y, Suzuki S, Hirai M, Suzuki C, Suzuki M, Toyota T. Urinary excretion of 8-oxo-7, 8-dihydro-2′-deoxyguanosine as a predictor of the development of diabetic nephropathy. Diabetologia. 2002;45(6):877–882. doi:10.1007/s00125-002-0831-8
14. Krolewski AS, Warram JH, Forsblom C, et al. Serum concentration of cystatin C and risk of end-stage renal disease in diabetes. Diabetes Care. 2012;35(11):2311–2316. doi:10.2337/dc11-2220
15. Wang P, Heitman J. The cyclophilins. Genome Biol. 2005;6(7):226–231. doi:10.1186/gb-2005-6-7-226
16. Nigro P, Pompilio G, Capogrossi M. Cyclophilin A: a key player for human disease. PLoS Biol. 2013;5(2):64–69.
17. Davis TL, Walker JR, Campagna-Slater V, et al. Structural and biochemical characterization of the human cyclophilin family of peptidyl-prolyl isomerases. PLoS Biol. 2010;8(7):17–21. doi:10.1371/journal.pbio.1000439
18. Pemberton TJ, Kay JE. Identification and comparative analysis of the peptidyl-prolyl cis/trans isomerase repertoires of H. sapiens, D. melanogaster, C. elegans, S. cerevisiae and Sz. pombe. Int J Genomics. 2005;6(5–6):277–300.
19. Kaul A, Stauffer S, Berger C, et al. Essential role of cyclophilin A for hepatitis C virus replication and virus production and possible link to polyprotein cleavage kinetics. PLoS Pathog. 2009;5(8):54–59. doi:10.1371/annotation/29dffb2a-5d37-4196-b166-b0b15bc2f3fd
20. Lu KP, Finn G, Lee TH, Nicholson LK. Prolyl cis-trans isomerization as a molecular timer. Nat Chem Biol. 2007;3(10):619–629. doi:10.1038/nchembio.2007.35
21. Kern G, Kern D, Schmid FX, Fischer G. Reassessment of the putative chaperone function of prolyl‐cis/trans‐isomerases. FEBS Lett. 1994;348(2):145–148. doi:10.1016/0014-5793(94)00591-5
22. Ryffel B, Woerly G, Greiner B, Haendler B, Mihatsch M, Foxwell B. Distribution of the cyclosporine binding protein cyclophilin in human tissues. Immunology. 1991;72(3):399–402.
23. Demeule M, Laplante A, Sepehr-Araé A, Murphy GM, Wenger RM, Béliveau R. Association of cyclophilin A with renal brush border membranes: redistribution by cyclosporine A. Kidney Int. 2000;57(4):1590–1598. doi:10.1046/j.1523-1755.2000.00003.x
24. Tsai S-F, Su C-W, Wu M-J, et al. Urinary cyclophilin A as a new marker for diabetic nephropathy: a cross-sectional analysis of diabetes mellitus. Medicine. 2015;94(42):115–119. doi:10.1097/MD.0000000000001802
25. Ramachandran S, Venugopal A, Kutty VR, et al. Plasma level of cyclophilin A is increased in patients with type 2 diabetes mellitusand suggests presence of vascular disease. Cardiovasc Diabetol. 2014;13:38. doi:10.1186/1475-2840-13-38
26. Ramachandran S, Venugopal A, Sathisha K, et al. Proteomic profiling of high glucose primed monocytes identifies cyclophilin A as a potential secretory marker of inflammation in type 2 diabetes. Proteomics. 2012;12:2808–2821. doi:10.1002/pmic.201100586
27. Zimmermann M. Ethical guidelines for investigations of experimental pain in conscious animals. Pain. 1983;16:109–110. doi:10.1016/0304-3959(83)90201-4
28. Maheshwari RA, Balaraman R, Sen AK, Seth A. Effect of coenzyme Q10 alone and its combination with metformin on streptozotocin-nicotinamide-induced diabetic nephropathy in rats. Indian J Pharmacol. 2014;46(6):627–629. doi:10.4103/0253-7613.144924
29. Stevens MJ, Li F, Drel V, et al. Nicotinamide reverses neurological and neurovascular deficits in streptozotocin diabetic rats. J Pharmacol Experiment Therap. 2007;320(1):458–464. doi:10.1124/jpet.106.109702
30. Waer HF, Helmy SA. Cytological and histochemical studies on rat liver and pancreas during progression of streptozotocin induced diabetes and possible protection using certain natural antioxidants. Egypt J Hosp Med. 2012;48(1):452–471.
31. Lechuga-Sancho AM, Arroba AI, Frago LM, et al. Reduction in the number of astrocytes and their projections is associated with increased synaptic protein density in the hypothalamus of poorly controlled diabetic rats. Endocrinology. 2006;147(11):5314–5324. doi:10.1210/en.2006-0766
32. Godkar P. Clinical biochemistry: principles and practice. Bhalani Publ. 1994;118(32):233–238.
33. Bancroft OD, Stevens A. Theory and practice of histological technique. Churchill Living Stone. 2010;8(6):11–13.
34. Agarwal R. Vitamin D, proteinuria, diabetic nephropathy, and progression of CKD. Clin J Am Soc Nephrol. 2009;4(9):1523–1528. doi:10.2215/CJN.02010309
35. Tsai S-F, Hsieh -C-C, Wu M-J, Chen C-H, Lin T-H, Hsieh M. Novel findings of secreted cyclophilin A in diabetic nephropathy and its association with renal protection of dipeptidyl peptidase 4 inhibitor. Clinica Chimica Acta. 2016;463:181–192. doi:10.1016/j.cca.2016.11.005
36. Lee SM, Bressler R. Prevention of diabetic nephropathy by diet control in the db/db mouse. Diabetes. 1981;30(2):106–111. doi:10.2337/diab.30.2.106
37. Amer HMA, Sabry IM, Bekhet MMM, Mohammed RNS. The role of urinary cyclophilin A as a new marker for diabetic nephropathy. Egypt J Hosp Med. 2018;70(9):1431–1439. doi:10.12816/0044664
38. Ramachandran S, Anandan V, Kutty V, Mullasari A, Pillai MR, Kartha CC. Metformin attenuates effects of cyclophilin A on macrophages, reduces lipid uptake and secretion of cytokines by repressing decreased AMPK activity. Clin Sci. 2018;132(6):719–738. doi:10.1042/CS20171523
39. Chiu P-F, Su S-L, Tsai -C-C, et al. Cyclophilin A and CD147 associate with progression of diabetic nephropathy. Free Radic Res. 2018;52(11–12):1456–1463. doi:10.1080/10715762.2018.1523545
40. Ye H, Bai X, Gao H, et al. Urinary podocalyxin positive-element occurs in the early stage of diabetic nephropathy and is correlated with a clinical diagnosis of diabetic nephropathy. J Diabetes Complications. 2014;28(1):96–100.
41. Ziyadeh FN, Hoffman BB, Han DC, et al. Long-term prevention of renal insufficiency, excess matrix gene expression, and glomerular mesangial matrix expansion by treatment with monoclonal antitransforming growth factor-β antibody in db/db diabetic mice. Proc Natl Acad Sci. 2000;97(14):8015–8020. doi:10.1073/pnas.120055097
42. Molitch ME, DeFronzo RA, Franz MJ, Keane WF. Nephropathy in diabetes. Diabetes Care. 2004;27:S79–S82.
43. Vestra DM, Mussap M, Gallina P, et al. Acute-phase markers of inflammation and glomerular structure in patients with type 2 diabetes. J Am Soc Nephrol. 2005;16(3 suppl 1):S78–S82. doi:10.1681/ASN.2004110961
44. Wang GG, Lu XH, Li W, Zhao X, Zhang C. Protective effects of luteolin on diabetic nephropathy in STZ-induced diabetic rats. Evid Based Complement Alternat Med. 2011;11(6):95–101.
45. Mestry SN, Dhodi JB, Kumbhar SB, Juvekar AR. Attenuation of diabetic nephropathy in streptozotocin-induced diabetic rats by Punica granatum Linn. leaves extract. J Tradit Complement Med. 2017;7(3):273–280. doi:10.1016/j.jtcme.2016.06.008
46. Naowaboot J, Somparn N, Saenthaweesuk S. Renoprotective effect of umbelliferone in high-fat diet/streptozotocin-induced type 2 diabetic rats. Asian Pac J Trop Biomed. 2020;10(1):11–16. doi:10.4103/2221-1691.273089
47. Liu L-H, Guo Q-Y, Li C-Y, Dong W-P, Sun G-D. Novel biomarkers for early diagnosis and progression of diabetic nephropathy. ARC J Diabetes Endocrinol. 2015;1(1):14–30.
48. Kern EF, Erhard P, Sun W, Genuth S, Weiss MF. Early urinary markers of diabetic kidney disease: a nested case-control study from the Diabetes Control and Complications Trial (DCCT). Am J Kidney Dis. 2010;55(5):824–834. doi:10.1053/j.ajkd.2009.11.009
49. El-Saeed GK, El-Deen WAS, Montasr BA, Omar TA, Mohamed DS. Urinary podocalyxin and cyclophilin A: markers for early detection of type 2 diabetic nephropathy. Menoufia Med J. 2019;32(3):996–999. doi:10.4103/mmj.mmj_223_18
50. Jain D, Saha S. Antioxidant and antihyperglycaemic effects of naringenin arrest the progression of diabetic nephropathy in diabetic rats. Egypt Pharm J. 2017;16(3):144–149. doi:10.4103/epj.epj_24_17
51. Abdel Ghafar MT, Shalaby KH, Okda HI, Abo El Gheit RE, Soliman NA, Keshk WA. Assessment of two novel renal tubular proteins in type 2 diabetic patients with nephropathy. J Investig Med. 2020;68(3):748–755. doi:10.1136/jim-2019-001135
52. Cohen MP, Chen S, Ziyadeh FN, et al. Evidence linking glycated albumin to altered glomerular nephrin and VEGF expression, proteinuria, and diabetic nephropathy. Kidney Int. 2005;68(4):1554–1561. doi:10.1111/j.1523-1755.2005.00567.x
53. Strugała P, Dzydzan O, Brodyak I, et al. Antidiabetic and antioxidative potential of the blue Congo variety of purple potato extract in streptozotocin-induced diabetic rats. Molecules. 2019;24(17):3126–3129. doi:10.3390/molecules24173126
54. El-Baz FK, Salama A, Salama RA. Dunaliella salina attenuates diabetic neuropathy induced by STZ in rats: involvement of thioredoxin. Biomed Res Int. 2020;20(5):17–21.
55. Jelodar G, Mohammadi M, Akbari A, Nazifi S. Cyclohexane extract of walnut leaves improves indices of oxidative stress, total homocysteine and lipids profiles in streptozotocin‐induced diabetic rats. Physiol Rep. 2020;8(1):e14348. doi:10.14814/phy2.14348
56. Cheng D, Liang B, Li Y. Antihyperglycemic effect of Ginkgo biloba extract in streptozotocin-induced diabetes in rats. Biomed Res Int. 2012;3(7):52–59.
57. Ishibashi Y, Matsui T, Maeda S, Higashimoto Y, Yamagishi S-I. Advanced glycation end products evoke endothelial cell damage by stimulating soluble dipeptidyl peptidase-4 production and its interaction with mannose 6-phosphate/insulin-like growth factor II receptor. Cardiovasc Diabetol. 2013;12(1):125–129. doi:10.1186/1475-2840-12-125
58. Wu LL, Chiou CC, Chang PY, Wu JT. Urinary 8-OHdG: a marker of oxidative stress to DNA and a risk factor for cancer, atherosclerosis and diabetics. Clin Chim Acta. 2004;339(1–2):1–9. doi:10.1016/j.cccn.2003.09.010
 © 2020 The Author(s). This work is published and licensed by Dove Medical Press Limited. The full terms of this license are available at https://www.dovepress.com/terms.php and incorporate the Creative Commons Attribution - Non Commercial (unported, v3.0) License.
By accessing the work you hereby accept the Terms. Non-commercial uses of the work are permitted without any further permission from Dove Medical Press Limited, provided the work is properly attributed. For permission for commercial use of this work, please see paragraphs 4.2 and 5 of our Terms.
© 2020 The Author(s). This work is published and licensed by Dove Medical Press Limited. The full terms of this license are available at https://www.dovepress.com/terms.php and incorporate the Creative Commons Attribution - Non Commercial (unported, v3.0) License.
By accessing the work you hereby accept the Terms. Non-commercial uses of the work are permitted without any further permission from Dove Medical Press Limited, provided the work is properly attributed. For permission for commercial use of this work, please see paragraphs 4.2 and 5 of our Terms.