Back to Journals » Journal of Inflammation Research » Volume 18
Cuproptosis and Immune Microenvironment Interplay in Temporal Lobe Epilepsy: Identification of Key Molecular Signatures and Therapeutic Targets
Authors Li W, Guo Q, Li X, Huang L ![]() , Liu H, Liu S
, Liu H, Liu S ![]()
Received 19 August 2025
Accepted for publication 27 October 2025
Published 5 December 2025 Volume 2025:18 Pages 17089—17112
DOI https://doi.org/10.2147/JIR.S561184
Checked for plagiarism Yes
Review by Single anonymous peer review
Peer reviewer comments 2
Editor who approved publication: Dr Adam Bachstetter
Weida Li,1 Qi Guo,1 Xinxin Li,1 Limin Huang,1 Haiyan Liu,2 Songyan Liu1
1Department of Neurology, China-Japan Union Hospital, Jilin University, Changchun, People’s Republic of China; 2The Key Laboratory of Pathobiology Ministry of Education, Department of Anatomy, College of Basic Medical Sciences, Jilin University, Changchun, 130061, People’s Republic of China
Correspondence: Haiyan Liu, Email [email protected] Songyan Liu, Email [email protected]
Background: Temporal lobe epilepsy (TLE), the predominant drug-resistant focal epilepsy, involves neuroinflammation and neuronal hyperexcitability. Cuproptosis—a copper-dependent cell death pathway triggered by mitochondrial copper overload and lipoylated protein aggregation—remains unexplored in epilepsy. This study investigates its molecular basis, neuroinflammatory crosstalk, and therapeutic implications in TLE.
Methods: Bulk RNA-seq and single-cell RNA-seq datasets from GEO were analyzed using weighted gene co-expression network analysis (WGCNA) and consensus clustering to stratify cuproptosis-associated TLE subtypes. Ten machine learning algorithms identified hub genes linked to cuproptosis-immune crosstalk. Experimental validation in a pilocarpine-induced TLE mouse model confirmed gene expression changes via Western blot and immunohistochemistry.
Results: Two TLE subtypes were stratified: cuproptosis-related gene (CRG) -high with upregulated cuproptosis drivers, heightened macrophage/T-cell infiltration, and NF-κB-mediated neuroinflammation, and CRG-low exhibiting disrupted copper homeostasis. Hub genes (CD44, PDE5A, TUBA1A) linked cuproptosis to astrocyte-driven immune interactions, endothelial dysfunction, and neuronal stress. Single-cell analysis localized CD44 to astrocytes interacting with microglia, while PDE5A and TUBA1A correlated with blood-brain barrier leakage and neuronal hyperexcitability. Experimental validation confirmed decreased CD44 and elevated PDE5A/TUBA1A in TLE mice, aligning with seizure severity.
Conclusion: This study firstly establishes cuproptosis as a mechanistic bridge between copper dysregulation and TLE pathology, driving neuroinflammation via NF-κB and neuronal-glial dysfunction. The CRG-based subtyping offers novel disease classification, while CD44, PDE5A, and TUBA1A emerge as therapeutic targets to mitigate copper-mediated neurotoxicity. These findings reposition cuproptosis as a key pathway in epilepsy, providing a roadmap for precision therapy in drug-resistant TLE.
Keywords: temporal lobe epilepsy, cuproptosis-related gene, cuproptosis
Introduction
Epilepsy is a neurological disorder characterized by spontaneous and recurrent seizures, mainly occurring in the hippocampus or cerebral cortex,1 with over 68 million people affected worldwide.2 Temporal Lobe Epilepsy (TLE) is the main type of intractable epilepsy in adults, with typical pathological features of hippocampal sclerosis,3 manifested as selective loss of pyramidal neurons in CA1 and CA3 regions, reactive gliosis (predominantly astrocytic proliferation) in the dentate gyrus granular layer, and mossy fiber sprouting.4 Although antiepileptic drugs targeting ion channels (sodium channel SCN1A) can control seizures in some patients,5 many still require surgical resection due to drug resistance,6 with significant risks of postoperative cognitive and emotional dysfunction and only a 50% chance of sustained seizure freedom.7 Recent studies have found that TLE lesions have impaired mitochondrial oxidative phosphorylation function,8 reactive oxygen species accumulation, and iron/zinc metabolism disorders,9 suggesting that metal ion homeostasis imbalance may drive epileptic network remodeling. However, the role of copper metabolism abnormalities and the novel form of cell death they induce (cuproptosis) has not been fully elucidated.
Cuproptosis is a new form of cell death. It is a process in which copper ions directly bind to the fatty acylated components of the mitochondrial respiratory chain and the tricarboxylic acid cycle, causing fatty acylated proteins to stick together, reducing iron-sulfur cluster proteins, and ultimately leading to cell death.10,11 Notably, copper is not only a cofactor of oxidative phosphorylation enzymes but also affects neuronal excitability by regulating NMDA receptor gating and synaptic plasticity.12 Currently, multiple diseases are associated with cuproptosis. Menkes disease is an X-linked genetic disorder of copper metabolism caused by ATP7A gene mutations,13 and copper overload can lead to Wilson disease.14 In the nervous system, copper homeostasis imbalance is closely related to Alzheimer’s disease15 and Parkinson’s disease.16 Clinical evidence shows that ceruloplasmin levels in the cerebrospinal fluid of drug-resistant epilepsy patients are abnormally elevated,17 but whether copper overload causes irreversible damage to hippocampal neurons through the cuproptosis pathway remains unknown. Additionally, some neurological diseases have a high degree of correlation with the immune system. For example, demyelination in multiple sclerosis is directly mediated by peripheral infiltrating Th17 cells and activated microglia in the central nervous system,18 and inflammation plays an important role in the pathogenesis of immune-mediated epilepsy.12 Considering the role of cuproptosis and immune cell infiltration in neurodegenerative diseases, we hypothesize the relationship between them and TLE, which may provide insights into potential therapeutic targets.
In this study, we employed a multi-omics integration strategy to systematically analyze the mechanism of cuproptosis in the occurrence and development of TLE. Based on large-scale transcriptome data, we constructed a co-expression network through WGCNA, screened hub modules highly related to TLE clinical phenotypes and cuproptosis, and further identified core genes related to cuproptosis using machine learning. We revealed the reprogramming characteristics of immune cell subsets in the TLE lesion microenvironment and their regulatory associations with cuproptosis genes through immune infiltration. We also used single-cell to parse the expression patterns of these genes in specific populations, clarifying the dynamic interaction network between cuproptosis-related molecules and neuroinflammation and related pathways. This study for the first time establishes a multi-dimensional correlation between cuproptosis and TLE heterogeneity, providing a new perspective and potential intervention targets for the development of precise therapeutic strategies targeting copper metabolism imbalance.
Methods
Study Design
Five datasets were retrieved from the GEO database, comprising four bulk RNA-seq datasets (GSE256068, GSE71058, GSE217726, GSE190451) and one single-cell RNA-seq dataset (GSE190452). The GSE256068 dataset, annotated using platform GPL24676, included 13 hippocampal samples (Control Hippocampus 1–13) as controls. The GSE71058 dataset, annotated using platform GPL11154, comprised 14 hippocampal samples from TLE patients. The GSE217726 dataset, annotated using platform GPL16791, included 15 hippocampal samples from TLE patients. The GSE190451 dataset, annotated using platform GPL24676, contained three TLE samples and three control samples. The GSE190452 single-cell dataset included four TLE samples and four control samples. GSE71058 and GSE256068 were merged as the training set using the ComBat function from the “sva” R package to adjust for batch effects. The merged GSE217726 and GSE190451 datasets served as an external validation set.
Differential Expression Gene Analysis
We employed the “DESeq2” R package, tailored for differential expression analysis of genomic data, to identify genes with significant differential expression across distinct comparison groups, thereby elucidating molecular mechanism variations in TLE. Differentially expressed genes (DEGs) were determined between control and TLE samples, as well as between TLE subtypes clustered based on cuproptosis-related gene (CRG) expression. Genes meeting the criteria of p-value < 0.05 and |log2FC| > 1 were selected as DEGs. To visualize their distribution, volcano plots were generated using the “ggplot2” R package, and heatmaps were produced using the “pheatmap” R package to illustrate the expression patterns of DEGs and CRG-related genes (FDX1, LIASLIPT1, DLD, PDHA1, PDHB, MTF1, GLS, CDKN2A, ATP7B, SLC31A1, ATP7A, DLST, DBT, GCSH).
Consensus Clustering Analysis
The human bulk RNA-seq datasets GSE256068 and GSE71058, comprising hippocampal samples from TLE patients, were merged for primary analysis. Consensus clustering was performed using the “ConsensusClusterPlus” R package. Based on the expression levels of cuproptosis-related genes (CRGs), TLE samples were stratified into two clusters (k=2), characterized by high and low CRG expression, respectively. The optimal cluster number (k=2) was determined by evaluating cumulative distribution function (CDF) curves of consensus scores and the consensus matrix heatmap.
Enrichment and Gene Set Variation Analysis
We performed Gene Ontology (GO) and Kyoto Encyclopedia of Genes and Genomes (KEGG) enrichment analyses on DEGs identified from the merged GSE256068 and GSE71058 datasets, comprising hippocampal samples from TLE patients, using the “clusterProfiler” R package. Results with a p-value < 0.05 were selected, and the top 10 pathways ranked by GeneRatio were visualized. Gene Set Enrichment Analysis (GSEA) was conducted on all genes using the “GSEABase” R package, with pathways having a p-value < 0.05 and the top five ranked by enrichment score selected as significant. Additionally, Gene Set Variation Analysis (GSVA), an unsupervised and non-parametric method, was employed to evaluate pathway enrichment in the transcriptomes of TLE samples stratified into two clusters (k=2; high and low CRG expression). Gene sets were retrieved from the Molecular Signatures Database (MSigDB) v7.0, and the GSVA algorithm was applied to transform gene-level changes into pathway-level scores, assessing the biological functions of the three hub genes (CD44, PDE5A, and TUBA1A). GSVA results with p.adjust < 0.05 were filtered and visualized to elucidate potential alterations in TLE cuproptosis-related biological processes.
Weighted Gene Co-Expression Network Analysis
To identify co-expression gene modules associated with TLE and CRGs, we conducted weighted gene co-expression network analysis (WGCNA) using the “WGCNA” R package. The merged bulk RNA-seq datasets GSE256068 and GSE71058, comprising hippocampal samples from TLE patients and controls, were preprocessed to filter out low-expression genes (average FPKM < 1). Outlier samples were removed using hierarchical clustering with a height threshold of h = 80, and batch effects were adjusted using the ComBat function from the “sva” R package. A signed co-expression network was constructed by calculating Pearson’s correlation coefficients for all gene pairs to generate a similarity matrix. The soft-thresholding power was set to β = 10 based on the scale-free topology criterion (R² > 0.8) to optimize network connectivity. Topological overlap matrices (TOMs) were computed, and hierarchical clustering with dynamic tree cutting identified 13 co-expression modules (minimum module size = 30 genes). Module eigengenes (MEs) were calculated to represent each module’s expression profile and correlated with clinical traits (clinc), including TLE subtypes (k=2; high and low CRG expression) and immune infiltration scores for macrophages and T cells. The MEyellow module showed the highest correlation with TLE clinical traits (r = 1, p < 0.05). Hub genes within the MEyellow module, particularly those overlapping with CRGs, were identified based on high module membership (MM > 0.8) and gene significance (GS > 0.5). Module-CRG relationships and immune infiltration patterns were visualized using heatmaps and network plots generated with the “WGCNA” and “ggplot2” R packages.
Machine Learning
Gene set for LASSO analysis was derived from the intersection of DEGs identified through WGCNA, consensus clustering of TLE subtypes, and DEGs between TLE and control samples. The LASSO algorithm was applied to select the most relevant features, yielding hub genes strongly associated with cuproptosis in TLE.
Multiple Immune Infiltration Analysis
To characterize the immune microenvironment in TLE, we quantified immune cell infiltration in the merged bulk RNA-seq datasets GSE256068 and GSE71058, comprising hippocampal samples from TLE patients and controls, using multiple deconvolution algorithms implemented in the “immunedeconv” R package. Specifically, EPIC and CIBERSORT were applied to estimate the relative proportions of immune cell types, including T cells, B cells, macrophages, and other immune subpopulations. Each algorithm was used to infer cell-type composition, with samples filtered for analysis based on a significance threshold of p < 0.05. To explore associations between immune infiltration and TLE subtypes (k=2; high and low CRG expression), correlation analyses were performed to assess the relationships between immune cell proportions and CRG expression levels. Results were visualized using heatmaps and correlation plots generated with the “ggplot2” R package to highlight differences in immune infiltration patterns across TLE subtypes.
Single-Cell RNA Sequencing Analysis
Sample Preparation and Sequencing
Brain tissues from four TLE patients and four healthy controls (GSE190452) were processed for scRNA-seq. Tissues were rapidly extracted, flash-frozen on dry ice, and RNA was isolated using Trizol reagent (Invitrogen, Carlsbad, CA, USA). Sequencing libraries were constructed from 1 μg total RNA using the Illumina TruSeq RNA Sample Prep Kit (Cat#FC-122-1001, Illumina, San Diego, CA, USA). Single nuclei were captured using the 10×Genomics Chromium Single Cell 3′ Solution (10×Genomics, Pleasanton, CA, USA), and libraries were prepared according to the manufacturer’s protocol. High-throughput sequencing was performed on an Illumina Novaseq6000 platform, generating 150-bp paired-end reads.
Data Processing and Quality Control
Downstream analysis was conducted using the Seurat R package (v5.3.0). Quality control (QC) was performed by calculating the percentage of mitochondrial and ribosomal gene expression. Cells with >15% mitochondrial gene content or ribosomal gene expression below the first quartile (Q1) were excluded (Figure S1). Additional filters included a minimum of 300 features and presence in at least three cells (min.cells = 3, min.features = 300). Doublets were removed using the DoubletFinder R package (v2.0.6), and ambient RNA contamination was corrected with the decontX R package (v1.6.0). After QC, 23,098 cells were retained for further analysis (Figure S2).
Data Integration and Dimensionality Reduction
Gene expression data were normalized via log-transformation with a scale factor of 10,000. A total of 2000 highly variable genes were identified, and data were scaled using Seurat’s Scale Data function, regressing out the effect of total unique molecular identifiers (UMIs). Principal component analysis (PCA) was conducted, and the top 30 principal components (PCs) were selected. To integrate TLE and control samples, multiple methods (CCA, RPCA, JointPCA, and Harmony) were evaluated using Seurat’s IntegrateLayers function. Harmony demonstrated superior performance in clustering resolution and was selected for final integration, yielding a unified dataset. Subsequent correction for cell cycle analysis (Figure S3). This dataset was used to investigate cell-type heterogeneity and differential expression of CRGs in the hippocampal microenvironment.
Pseudotime Analysis
Build Monocle Project
To explore dynamic cellular transitions in TLE, pseudotime analysis was conducted on the integrated scRNA-seq dataset using Monocle (v2.36.0). A CellDataSet object was constructed with the newCellDataSet function, utilizing the log-normalized gene expression matrix from the previously integrated Seurat dataset. Genes expressed in at least 10 cells with a minimum expression threshold of 0.05 were retained. Cell metadata, including cluster annotations and TLE/control conditions, were incorporated.
Dimensionality Reduction and Cell Ordering
Dimensionality reduction was performed using the reduceDimension function with the DDRTree method to project cells into a low-dimensional space. Cells were ordered along pseudotime trajectories using the orderCells function, with the root state determined by expression of marker genes for hippocampal cell types. Trajectories were visualized using Monocle’s plotting functions to depict branching patterns and pseudotime progression in the hippocampal microenvironment.
Differential Gene Analysis and Visualization
DEGs along pseudotime trajectories were detected using the differentialGeneTest function, applying a q-value threshold of <0.05 for statistical significance. Genes associated with CRGs, such as CD44, PDE5A, and TUBA1A, were prioritized. A branched heatmap of significant genes was generated using the plot_genes_branched_heatmap function to illustrate expression dynamics at developmental nodes, highlighting regulatory genes driving TLE cellular transitions.
Cell-Cell Communication Analysis
Following scRNA-seq analysis of the GSE190452 (four TLE patients and four healthy controls), key cellular subpopulations were identified, as described previously. Cells highly expressing hub genes (CD44, PDE5A, TUBA1A) associated with CRGs were extracted for further analysis. To explore intercellular signaling within the hippocampal microenvironment, CellChat (v1.6.1) was applied with default parameters to infer ligand-receptor interactions based on a curated database of signaling molecule pairs. Particular emphasis was placed on communication networks between Astrocytes and immune cell populations. Interaction strengths were quantified, and significant signaling pathways were visualized using CellChat’s integrated plotting tools to elucidate their contributions to TLE pathogenesis.
Statistical Analysis
All statistical analyses were conducted using R (v4.2.2). For comparisons between two groups, Student’s t-test or Wilcoxon rank-sum test was applied, depending on data distribution. Relationships between variables, such as CRG expression and immune cell proportions, were evaluated using Pearson or Spearman correlation coefficients. Statistical significance was defined at P < 0.05, with the following notation: *P < 0.05; **P < 0.01; ***P < 0.001; ****P < 0.0001.
Pilocarpine-Induced TLE Mouse Model
Reagent Preparation
Pilocarpine solution (30 mg/mL) was freshly prepared by dissolving 100 mg pilocarpine in 3.333 mL of 0.9% sterile saline. Scopolamine stock solution (10 mg/mL) was prepared by dissolving 100 mg scopolamine in 10 mL of 0.9% sterile saline, aliquoted, and stored at −80°C. The working solution (0.1 mg/mL) was made by diluting 100 μL stock in 10 mL of 0.9% sterile saline, aliquoted, and stored at −20°C. Diazepam solution (1 mg/mL) was prepared by diluting 1 mL of 5 mg/mL diazepam with 4 mL of 0.9% sterile saline, aliquoted, and stored at −20°C in the dark.
Animals
Specific pathogen-free C57BL/6N male mice (18–22 g, 6–8 weeks old) were obtained from Beijing Vital River Laboratory Animal Technology Co., Ltd. All procedures were approved by the Institutional Animal Care and Use Committee. Mice received an intraperitoneal (i.p.) injection of scopolamine (1 mg/kg) to reduce peripheral cholinergic effects, followed 30 minutes later by an i.p. injection of pilocarpine (340 mg/kg). Mice were placed in a transparent chamber for behavioral observation. Seizure severity was evaluated using the Racine scale: 0, normal; I, facial twitching (chewing, blinking), immobility, whisker trembling; II, rhythmic head nodding; III, unilateral limb clonus; IV, bilateral forelimb clonus with rearing; V, generalized tonic-clonic seizures with loss of balance. If seizures did not reach stage IV or higher, additional pilocarpine doses (60 mg/kg, i.p.) were administered every 30 minutes (up to two doses) until stage IV or higher was achieved. Status epilepticus (SE) was defined as stage IV or higher seizures persisting for >30 minutes or recurring without full recovery. Diazepam (4 mg/kg, i.p.) was administered 90 minutes after SE onset to reduce mortality. Mice that died or failed to reach stage IV were excluded. The control (CON) group received saline instead of pilocarpine, with identical handling. After SE, the mice were returned to their home cages and continuously video–EEG monitored. Only animals that exhibited spontaneous recurrent seizures (SRS) between days 7 and 15 post-SE were enrolled in the chronic TLE model. Mice were euthanized by CO₂ asphyxiation (30–70% chamber volume min−¹) followed by cervical dislocation in accordance with the AVMA Guidelines; animal procedures are reported following the ARRIVE guidelines.
Tissue Preparation
Following anesthesia, the abdominal cavity was opened to expose the heart. A perfusion needle was inserted into the cardiac apex, and a small incision was made in the right auricle. Mice were perfused with 0.9% saline until the liver turned pale. Brains were rapidly extracted, and bilateral hippocampal tissues were dissected, snap-frozen in liquid nitrogen, and stored at −80°C for Western blot and biochemical assays.
Western Blot Analysis
Hippocampal tissues were homogenized in RIPA lysis buffer (Beyotime, Shanghai, China) containing protease and phosphatase inhibitors (Roche, Basel, Switzerland). Protein concentrations were determined using a BCA Protein Assay Kit (Thermo Fisher Scientific, Waltham, MA, USA). Equal amounts of protein (30 μg) were separated by 10% SDS-PAGE and transferred onto PVDF membranes (Millipore, Burlington, MA, USA). Membranes were blocked with 5% non-fat milk in TBST for 1 hour at room temperature and incubated overnight at 4°C with primary antibodies against CD44 (1:1000, Abcam, Cambridge, UK), PDE5A (1:1000, Abcam), TUBA1A (1:2000, Abcam), and GAPDH (1:5000, Sigma-Aldrich, St. Louis, MO, USA) as a loading control. After washing with TBST, membranes were incubated with HRP-conjugated secondary antibodies (1:5000, Jackson ImmunoResearch, West Grove, PA, USA) for 1 hour at room temperature. Protein bands were visualized using an enhanced chemiluminescence kit (Thermo Fisher Scientific) and quantified by densitometry with ImageJ software (NIH, Bethesda, MD, USA). Relative protein expression was normalized to GAPDH.
Immunohistochemistry Analysis
Paraffin-embedded brain sections (5 μm) were deparaffinized in xylene and rehydrated through a graded ethanol series. Antigen retrieval was performed by heating sections in citrate buffer (pH 6.0) at 95°C for 20 minutes. Endogenous peroxidase activity was blocked with 3% H2O2 for 10 minutes, and non-specific binding was blocked with 5% bovine serum albumin (BSA) for 1 hour at room temperature. Sections were incubated overnight at 4°C with primary antibodies against CD44 (1:300), PDE5A (1:300), and TUBA1A (1:300). After washing with PBS, sections were incubated with HRP-conjugated secondary antibodies (1:500, Jackson ImmunoResearch) for 1 hour at room temperature, followed by visualization with 3,3’-diaminobenzidine (DAB) (Dako, Glostrup, Denmark). Sections were counterstained with hematoxylin, dehydrated, and mounted. Images were captured using a light microscope (Olympus, Tokyo, Japan) and analyzed with ImageJ software to quantify staining intensity in the hippocampal CA1 and dentate gyrus regions.
Results
Functional and Molecular Alterations in Temporal Lobe Epilepsy
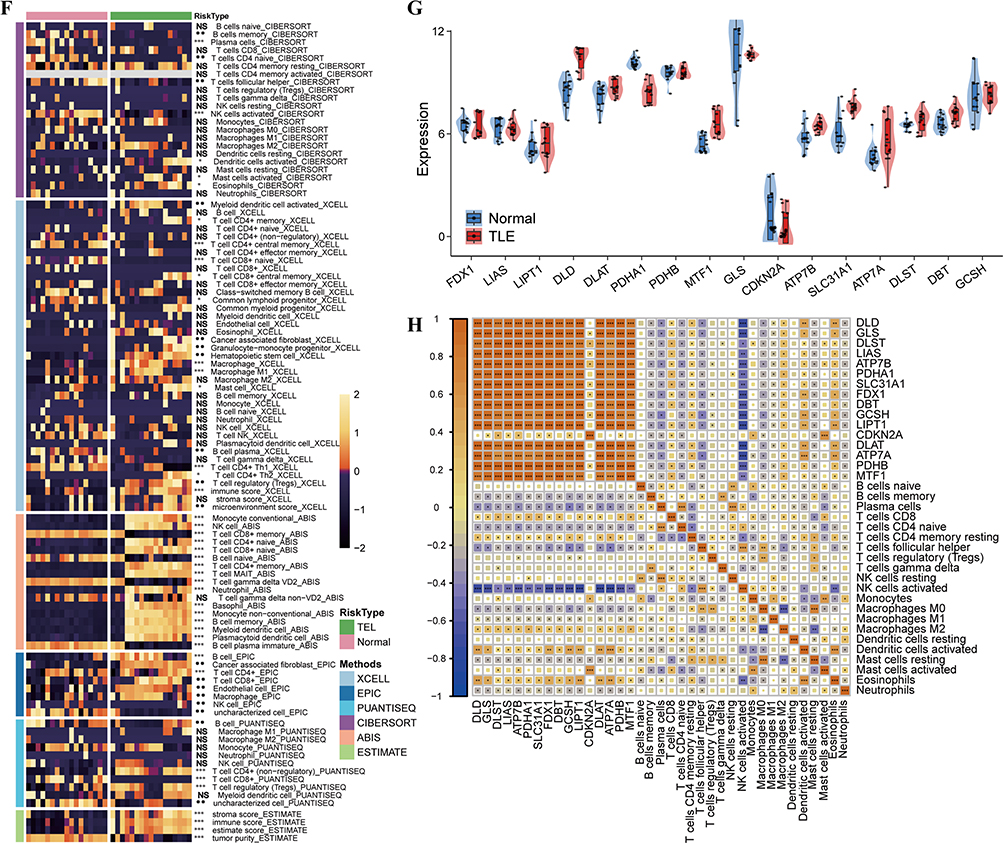
We analyzed gene expression profiles from hippocampal tissue samples of TLE patients and healthy controls (14 cases each) obtained from the GEO. Differential expression analysis revealed 1190 upregulated and 872 downregulated genes in TLE compared to controls (Figure 1A). Reactome enrichment analysis (Figure 1B) suggested that TLE progression is linked to metabolic pathways, including the tricarboxylic acid (TCA) cycle and oxidative phosphorylation. Notably, CRGs exhibited significantly elevated expression in TLE (Figure 1C and D). GO enrichment analysis (Figure 1E) indicated that TLE pathogenesis is associated with biological processes including the external side of the plasma membrane, metal ion transmembrane transporter activity, immune response-regulating cell surface receptor signaling pathways, and immune response-regulating signaling pathways. Immune infiltration analysis identified macrophages and T cells as key immune cell types involved in TLE development (Figure 1F). Specific CRGs, including DLD, PDHA1, ATP7B, ATP7A, and DBT, showed marked differential expression (Figure 1G). In particular, M2 macrophages, activated dendritic cells, and CD8+ T cells displayed strong positive correlations with CRG expression (Figure 1H), highlighting their potential roles in mediating cuproptosis-associated immune responses in TLE. Figure 1 Contiune. Figure 1 Functional and Molecular Alterations in Temporal Lobe Epilepsy. (A) Volcano plot illustrating differential gene expression in hippocampal tissue from TLE patients (n=14) versus healthy controls (n=14), with 1190 upregulated and 872 downregulated genes. (B) Bar plot of Reactome pathway enrichment analysis (C) Heatmap displaying the expression profiles of selected DEGs and CRGs in TLE patients compared to healthy controls. (D) Volcano plot highlighting significant differential expression of CRGs in TLE versus control samples. [Alternative: Bar plot comparing expression levels of CRGs between TLE patients and controls. (E) Bar plot of GO enrichment analysis. (F) Combined heatmap immune cell infiltration in TLE, inferred using multiple computational methods, with macrophages and T cells as predominant cell types. (G) Violin plot showing marked differential expression of specific CRGs in TLE versus control samples. (H) Correlation heatmap demonstrating strong positive correlations between CRG expression and immune cell subsets, including M2 macrophages, activated dendritic cells, and CD8+ T cells, in TLE. *, **, ***, and **** indicate P < 0.05, P < 0.01, P < 0.001, and P < 0.0001, respectively; NS, not significant.
Molecular Function Analysis of the CRGs High-Expression TLE
Consensus Clustering Analysis: TLE disease samples were divided into CRGs high-expression and low-expression groups based on consensus clustering (Figure 2A). DEGs between CRGs high- and low-expression groups revealed 554 upregulated and 430 downregulated genes (Figure 2B). GO enrichment analysis of these differentially expressed genes (Figure 2C) indicated that the CRGs high-expression TLE group was primarily associated with biological processes such as the external side of the plasma membrane, immune response-regulating cell surface receptor signaling pathway, and DNA-binding transcription activator activity (RNA polymerase II-specific). In the CRGs high-expression TLE subtype, copper-related ferroptosis genes, including DLD, DLAT, PDHA1, MTF1, CDKN2A, SLC31A1, ATP7B/A, and DBT, were prominently enriched (Figure 2D). KEGG pathway analysis (Figure 2E) highlighted the activation of key pathways, including the Chemokine signaling pathway and the PI3K-Akt signaling pathway. WGCNA was performed on the normalized expression matrix of TLE samples. The results identified the MEyellow module (comprising 1271 genes) as having the strongest correlation with copper-related ferroptosis gene expression, TLE disease progression, and T cell/macrophage activity (Figure 2F and G).
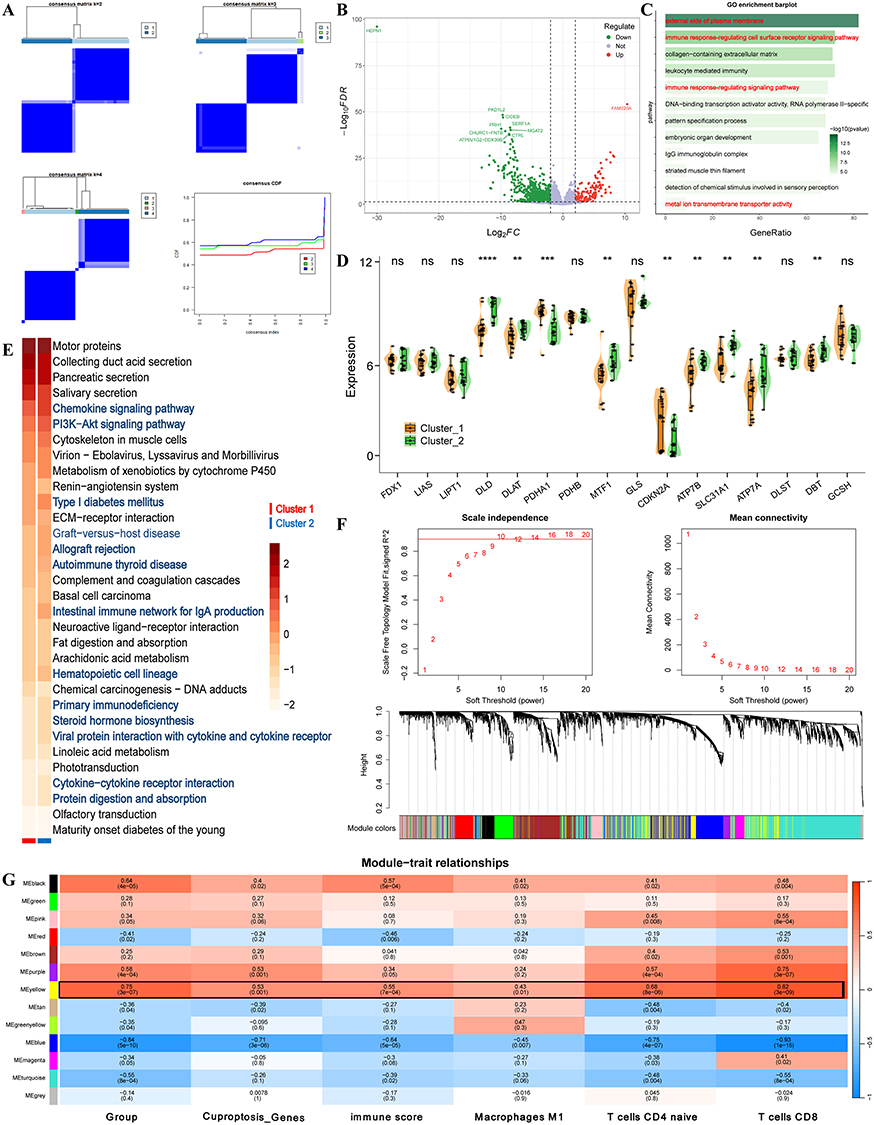 |
Figure 2 Molecular Function Analysis of the CRGs High-Expression TLE. (A) Consensus Clustering of TLE Samples Based on CRGs Expression (Cluster 1 Vs Cluster 2). (B) DEGs between CRGs High- and Low-Expression Groups, with 554 genes upregulated and 430 genes downregulated (adjusted p-value < 0.05). (C) GO Enrichment Analysis of DEGs. Bar plot showing enriched GO biological process terms for DEGs in the CRGs high-expression TLE group. (D) Enrichment of Copper-Related Ferroptosis Genes in CRGs High-Expression TLE Subtype. Heatmap depicting the expression levels of key copper-related ferroptosis genes in the CRGs high-expression TLE compared to the low-expression group. (E) KEGG Pathway Analysis of DEGs. Bar plot of enriched KEGG pathways in the CRGs high-expression TLE group, highlighting significant activation of the Chemokine signaling pathway and PI3K-Akt signaling pathway. (F and G) WGCNA Module-Trait Correlation Analysis. Heatmap showing the correlation between WGCNA modules and traits, including copper-related ferroptosis gene expression, TLE disease progression, and T cell/macrophage activity. The MEyellow module exhibits the strongest correlations. Gene Composition of the MEyellow Module. Network visualization of the MEyellow module (1271 genes) identified by WGCNA. *, **, ***, and **** indicate P < 0.05, P < 0.01, P < 0.001, and P < 0.0001, respectively; ns, not significant. |
Identification of Hub Genes Driving Cuproptosis in Temporal Lobe Epilepsy
To identify key genes associated with cuproptosis in TLE, we performed an integrative analysis of gene expression data. DEGs in TLE, genes from the MEyellow module identified by WGCNA, and DEGs between TLE CRG subtypes (Cluster 1 vs Cluster 2) were intersected, yielding 77 overlapping genes (Figure 3A). A machine learning approach using LASSO regression was applied to the 77 genes, further narrowing down to 55 candidate genes (Figure 3B). These 77 genes were subjected to Cox multivariate regression analysis, identifying 53 genes as prognostic factors, with 26 as risk factors (HR > 1, p < 0.05) and 27 as protective factors (HR < 1, p < 0.05) for TLE progression (Figure 3C). A nomogram model was constructed based on these genes, achieving a total point score of 550 and a predicted risk probability of 0.692 (Figure 3D). Among these, three hub genes—CD44 (HR < 1, p < 0.05), PDE5A (HR > 1, p < 0.05), and TUBA1A (HR > 1, p < 0.05)—were identified as critical regulators potentially driving cuproptosis-mediated mechanisms in TLE (Figure 3E).
 |
Figure 3 Identification of Hub Genes Regulating Cuproptosis in TLE. (A) Venn diagram illustrating the intersection of DEGs in TLE, MEyellow module genes from WGCNA, and genes differentially expressed between TLE CRG subtypes (Cluster 1 vs Cluster 2), yielding 77 overlapping genes. (B) LASSO regression coefficient plot showing the selection of 55 candidate genes from the 77 intersecting genes associated with TLE prognosis. (C) Forest plot of Cox multivariate regression analysis, identifying 53 prognostic genes from the 77 intersecting genes, including 26 risk factors (HR > 1, p < 0.05) and 27 protective factors (HR < 1, p < 0.05). (D) Nomogram predicting TLE progression risk based on the 55 candidate genes, with a total point score of 550 corresponding to a risk probability of 0.692. (E) Circle plot of Hub Genes chromosomal locations. |
Functional Roles of Hub Genes in Temporal Lobe Epilepsy Pathogenesis
To elucidate the biological roles of hub genes in TLE, we investigated the functional implications of TUBA1A, PDE5A, and CD44, which exhibited high expression in TLE. TUBA1A upregulation was associated with activation of the P53 pathway, apoptosis, and TGF-β signaling, while suppressing fatty acid metabolism, oxidative phosphorylation, unfolded protein response, and E2F target genes. Additionally, TUBA1A high expression correlated with biological processes linked to TLE progression, including inflammatory response, locomotion, response to bacterium, regulation of response to external stimulus, and secretory granule activity (Figure 4A). PDE5A overexpression was found to activate myogenesis and apical junction pathways, while inhibiting WNT/β-catenin signaling and G2M checkpoint. PDE5A high expression showed synergistic relationships with processes such as anchoring junction, cell morphogenesis, cell motility, locomotion, regulation of cell junction assembly, and regulation of locomotion in TLE (Figure 4B). Conversely, CD44 upregulation activated Notch signaling, IL2/STAT5 signaling, unfolded protein response, and oxidative phosphorylation. CD44 was also implicated in TLE-related processes, including cellular response to biotic stimulus, defense response, locomotion, cellular response to lipid, and cellular response to organic substance (Figure 4C). These findings suggest that TUBA1A, PDE5A, and CD44 play distinct yet complementary roles in driving cuproptosis-associated mechanisms and disease progression in TLE.
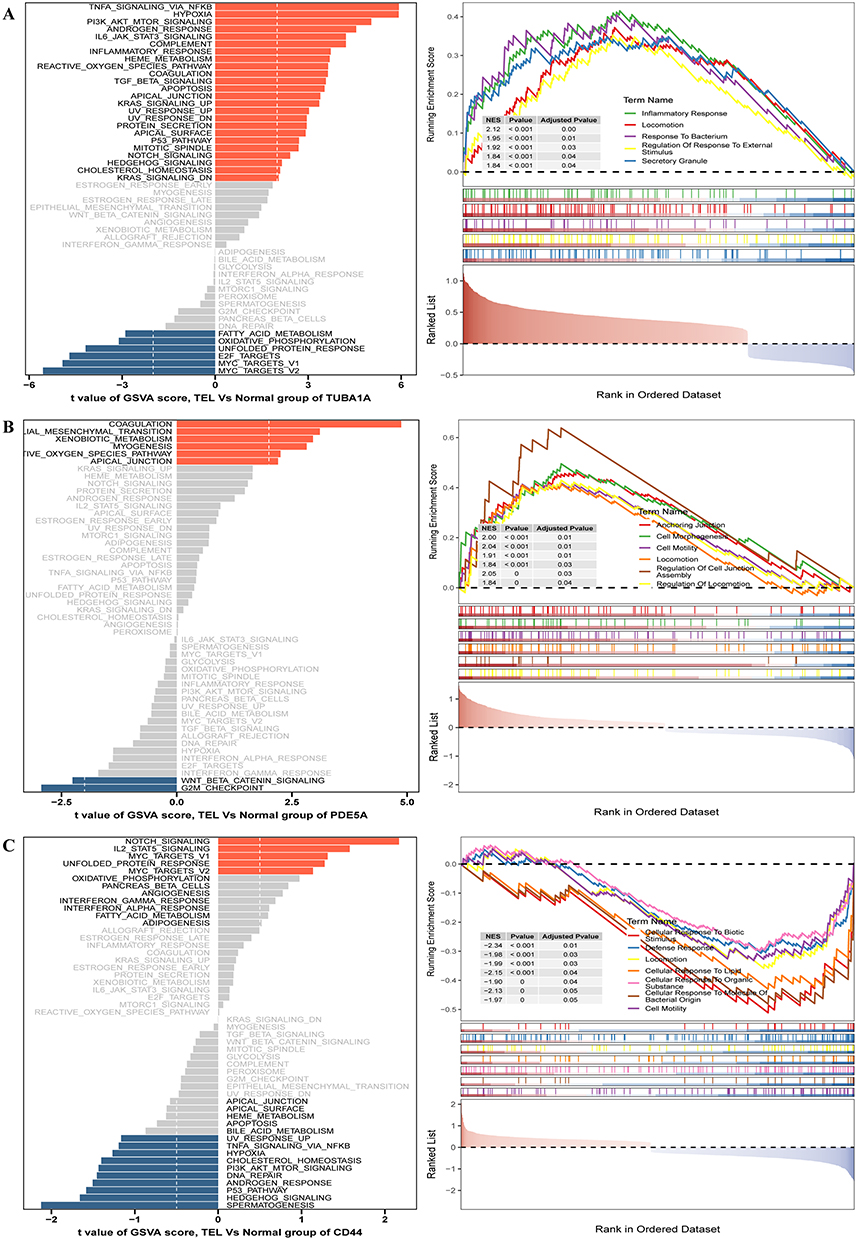 |
Figure 4 Functional Roles of Hub Genes in Temporal Lobe Epilepsy Pathogenesis. (A-C) GSEA and GSVA Analysis Results of TUBA1A, PDE5A, and CD44 in TLE. |
Validation of Cuproptosis-Related Genes and Immune Infiltration in TLE
To validate our findings, we analyzed gene expression profiles from an independent TLE validation cohort. Differential expression analysis confirmed that CRGs exhibited significantly higher expression in TLE compared to healthy controls (Figure 5A). GO enrichment analysis of differentially expressed genes revealed enrichment in biological processes such as metal ion transmembrane transporter activity, external side of the plasma membrane, and immune response-regulating cell surface receptor signaling pathways (Figure 5B). The expression of hub genes TUBA1A, PDE5A, and CD44 was significantly elevated in the TLE validation cohort compared to controls (Figure 5C–E). Analysis of hippocampal tissue samples revealed significant differential expression of genes between TLE and healthy groups. Specifically, a subset of differentially expressed genes, including key CRGs such as DLD, PDHA1, ATP7B, ATP7A, and DBT, was examined. Results demonstrated significantly higher expression of CRGs in the TLE group compared to the normal group. Validated previous research findings (Figure 5F). The validation dataset further confirmed that cuproptosis-related genes are associated with the degree of immune cell infiltration, particularly showing a significant positive correlation with M1 macrophages, activated T cells, and other immune cell types (Figure 5G).
 |
Figure 5 Validation of Cuproptosis-Related Genes and Immune Characteristics in TLE. (A) Volcano plot highlighting differential expression of CRGs between TLE and control samples. (B) Bar plot of GO enrichment analysis. (C–E) Violin plots depicting significantly higher expression of hub genes expression in the validation cohort. (F) Heatmap illustrating the expression profiles of selected DEGs. (G) Correlation heatmap demonstrating strong positive correlations (p < 0.01) between CRG expression and infiltration levels of T cells and macrophages in TLE. *, **, and *** indicate P < 0.05, P < 0.01, and P < 0.001, respectively; ns, not significant. |
Immune Infiltration Analysis and CRG Correlations in the Validation Set
Immune infiltration analysis of the RNA-seq validation dataset for TLE was performed using multiple methods (CIBERSORT and EPIC). Results revealed significantly higher infiltration of CD4+ T cells, macrophages, NK cells, and granulocytes in the TLE group compared to the healthy control group (p < 0.05) (Figure 6A and B). These findings are highly consistent with the immune infiltration results from the RNA-seq test set. Comparative analysis of CRG expression between the two groups further confirmed that most CRGs, including DLD, PDHB, PDHA1, MTF1, SLC31A1, ATP7A, DLST, and DBT, were significantly upregulated in the TLE group (Figure 6C). Correlation analysis between hub genes and CRGs indicated significant associations: TUBA1A showed positive correlations with ATP7A (Rs = 0.55, p < 0.05) and SLC31A1 (Rs = 0.43, p < 0.05); PDE5A exhibited positive correlations with DBT (Rs = 0.42, p < 0.05), DLST (Rs = 0.32, p < 0.05), PDHA1 (Rs = 0.31, p < 0.05), and PDHB (Rs = 0.49, p < 0.05); conversely, CD44 displayed negative correlations with DBT (Rs = −0.65, p < 0.05), DLAT (Rs = −0.29, p < 0.05), DLD (Rs = −0.17, p < 0.05), DLST (Rs = −0.30, p < 0.05), PDHA1 (Rs = −0.32, p < 0.05), and PDHB (Rs = −0.76, p < 0.05) (Figure 6D). These correlation results align closely with those observed in the test set.
 |
Figure 6 Immune Infiltration and Correlation Analysis of Hub Genes with CRGs. (A) CIBERSORT Analysis. (B) EPIC Analysis. (C) CRGs Expression in the TLE Validation Cohort. (D) Correlation Analysis of Hub Genes (TUBA1A, PDE5A, and CD44) with CRGs. *, **, ***, and **** indicate P < 0.05, P < 0.01, P < 0.001, and P < 0.0001, respectively; ns, not significant. |
Single-Cell Analysis of TLE and Functional Enrichment
Single-cell RNA sequencing of TLE samples was conducted to explore cellular heterogeneity and differential expression profiles. UMAP plots visualized cell clustering and group comparisons between TLE and control samples (Figure 7A and B). Cell abundance distribution analysis revealed significantly higher proportions of astrocytes, macrophages, and microglial cells in TLE samples compared to controls (Figure 7C). Biological function enrichment analysis of cell subpopulations confirmed their distinct functional roles (Figure 7D). ClusterTree analysis determined the optimal clustering resolution (Figure 7E). Cell populations were annotated using classical markers, identifying the following cell types: oligodendrocytes, radial glial cells, astrocytes, macrophages, inhibitory neurons, neurons, microglial cells, endothelial cells, and T cells (Figure 7F). FeaturePlot and violin plots further demonstrated that hub genes TUBA1A, PDE5A, and CD44 exhibited significantly elevated expression in astrocytes compared to other cell subpopulations, highlighting their prominent biological roles in astrocytes (Figure 7G and H).
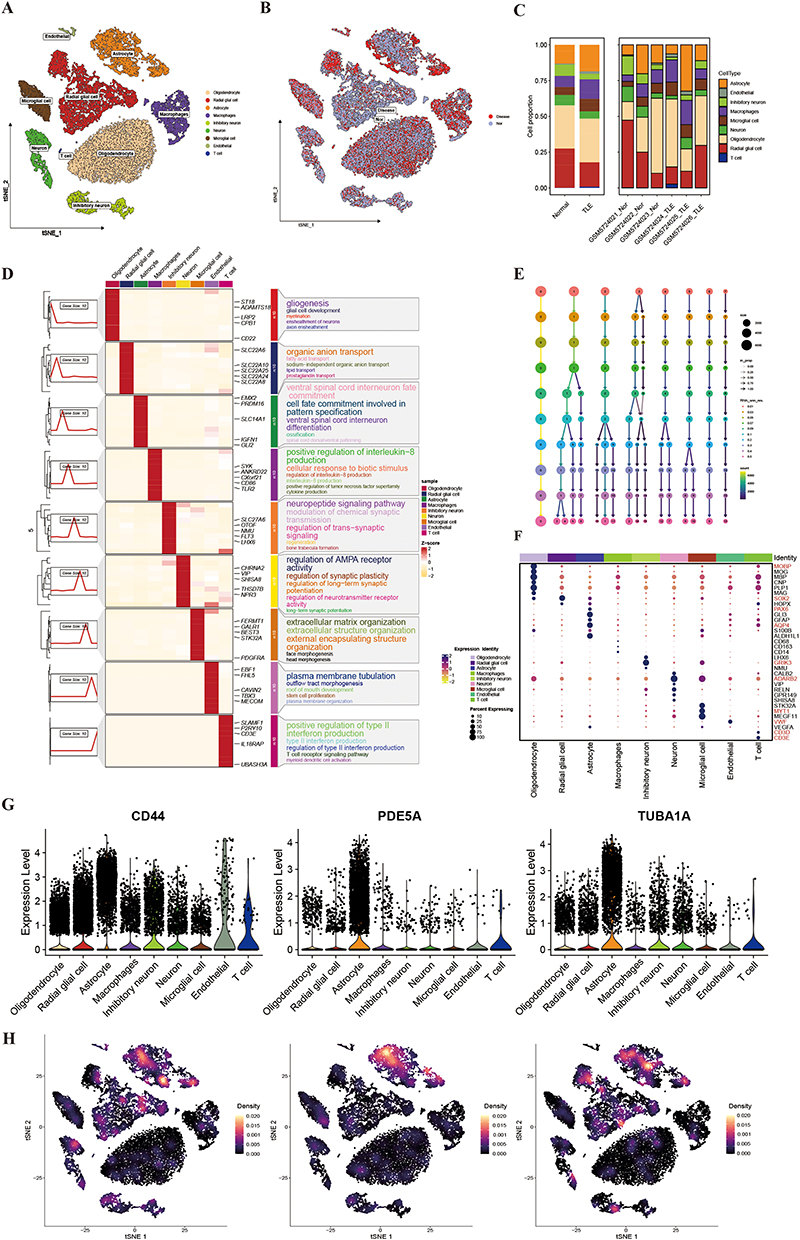 |
Figure 7 Single-Cell Analysis of TLE and Functional Enrichment. (A) UMAP Visualization of TLE Cell Clustering. (B) UMAP Comparison of TLE and Control Groups. (C) Cell Abundance Distribution in TLE vs Control. (D) Biological Function Enrichment of Cell Subpopulations. Dot plot showing enriched biological functions for each annotated cell subpopulation in TLE samples, validating the cell type annotations. (E) ClusterTree Analysis for Optimal Clustering Resolution. ClusterTree dendrogram identifying the optimal clustering resolution for TLE single-cell data. (F) Cell Type Annotation Using Classical Markers. (G) Expression of Hub Genes Across Cell Subpopulations. (H) Expression of Hub Genes in TSNE plot. |
Single-Cell Analysis of Astrocyte Subpopulations in TLE
Single-cell analysis of astrocytes identified seven distinct subtypes based on gene expression profiles: ADAMTS18+ Astrocyte, GADD45G+ Astrocyte, HBB+ Astrocyte, KDM5D+ Astrocyte, PLCG2+ Astrocyte, SLC9A7+ Astrocyte, and ZIC1+ Astrocyte (Figure 8A). Comparative analysis of astrocyte subtype distribution between TLE and control groups revealed significantly higher proportions of GADD45G+ Astrocyte, HBB+ Astrocyte, and KDM5D+ Astrocyte subtypes in the TLE group compared to controls (Figure 8B and C). The astrocyte population was extracted and re-annotated into subpopulations based on their gene expression profiles (Figure 8D). Expression analysis of hub genes showed that PDE5A and CD44 were predominantly expressed in the GADD45G+ Astrocyte subtype, while TUBA1A exhibited higher expression in the ZIC1+ Astrocyte subtype (Figure 8E and F).
 |
Figure 8 Detailed Analysis of Astrocyte Subpopulations in TLE. (A) Annotation of Astrocyte Subtypes. (B) UMAP Comparison of Astrocyte Subtypes Between TLE and Control Groups. (C) Cell Abundance of Astrocyte Subtypes in TLE vs Control. Bar plot showing the proportional abundance of Astrocyte subtypes in TLE and control samples. (D) Gene Expression Profiles for Astrocyte Subtype Re-Annotation. Heatmap depicting the gene expression profiles used for re-annotation of Astrocyte subpopulations in TLE samples, supporting the identification of distinct subtypes. (E) Hub Gene Expression Across Astrocyte Subtypes. Violin plot illustrating the expression levels of hub genes (TUBA1A, PDE5A, and CD44) across Astrocyte subtypes. (F) FeaturePlot visualizing the expression of hub genes (TUBA1A, PDE5A, and CD44) across Astrocyte subtypes, with PDE5A and CD44 predominantly expressed in GADD45G+ Astrocyte, and TUBA1A enriched in ZIC1+ Astrocyte. |
Pseudotime Analysis of Astrocyte Subpopulations in TLE
To identify astrocyte subpopulations critically associated with TLE progression, we performed pseudotime analysis on astrocyte subsets. By integrating the distribution of astrocyte subpopulations, cellular developmental states, and pseudotime developmental trajectories (Figure 9A), we identified GADD45G+ Astrocytes (State 1) as the terminal differentiation state in TLE progression. Other astrocyte subpopulations diverged from Node 1, progressively differentiating toward the GADD45G+ astrocyte state as TLE advanced. To further investigate the cellular differentiation dynamics following Node 1, we conducted pseudotime analysis and identified three distinct gene expression patterns (Clusters 1, 2, and 3) associated with the progression toward GADD45G+ Astrocytes (Figure 9B). The purple module (Cluster 1) exhibited a progressive increase in gene expression during TLE development, including key genes such as TUBA1A and PDE5A. Functional enrichment analysis revealed activation of the AMPK signaling pathway, TGF-beta signaling pathway, and related biological processes in this module (Figure 9C). In contrast, the blue module (Cluster 3) displayed a decreasing expression trend, with CD44 as a representative gene, and was associated with activation of the NF-kappa B signaling pathway, p53 signaling pathway, and apoptosis (Figure 9C).
 |
Figure 9 Pseudotime Analysis of Astrocyte Subpopulations in TLE. (A) Pseudotime Developmental Trajectory Analysis. (B) Heatmap of Developmental Trajectories from Node 1. (C) Pseudotime Analysis of TUBA1A, PDE5A, and CD44. |
Cell-Cell Communication Analysis in TLE
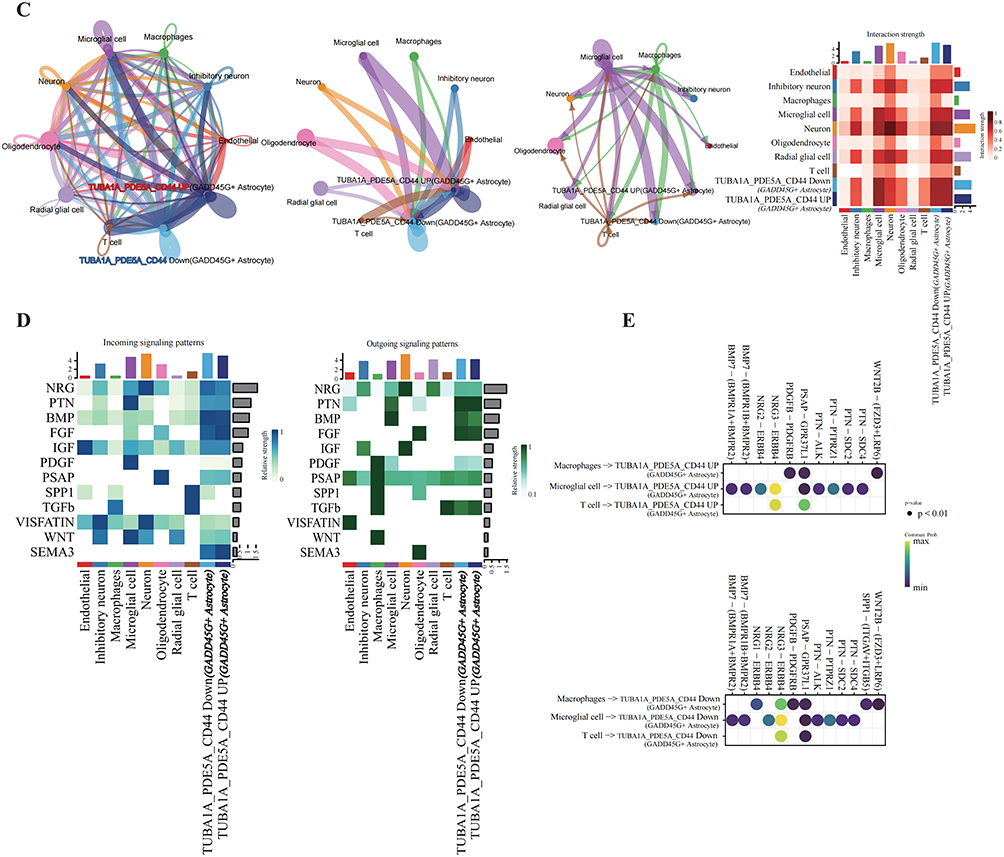
To elucidate the role of the immune microenvironment in TLE progression, single-cell cell-cell communication analysis was performed using CellChat. Compared to controls, TLE samples exhibited enhanced interactions between T cells and astrocytes (Figure 10A). Further analysis of interactions between astrocyte subpopulations and immune cells revealed that GADD45G+ astrocytes displayed stronger communication with T cells and macrophages compared to other astrocyte subtypes (Figure 10B). Additional characterization of immune microenvironment interactions across astrocyte subpopulations supported these findings (Figure 10C). Within the GADD45G+ astrocyte population, representing a terminally differentiated state in TLE, cells were stratified based on hub gene expression (TUBA1A, PDE5A, and CD44) into TUBA1A_PDE5A_CD44 Up and TUBA1A_PDE5A_CD44 Down GADD45G+ astrocytes (Figure 10D). TUBA1A_PDE5A_CD44 Up GADD45G+ astrocytes showed significantly stronger interactions with macrophages, microglia, and T cells, mediated predominantly by BMP, FGF, and SEMA3 signaling pathways (Figure 10E). Figure 10 Contiune. Figure 10 Cell-Cell Communication Analysis in TLE. (A) Circle plot and heatmap illustrating cell-cell communication patterns in TLE compared to the control group. (B) Circle plot and heatmap depicting interactions between astrocyte subpopulations and immune cells. (C) Dot plot highlighting differences in the immune microenvironment between GADD45G+ Astrocytes with high and low expression of CRGs. (D) Results of cell-cell communication pathways among different CRG-based subtypes of GADD45G+Astrocytes. (E) Results of cell-cell communication pathways between macrophages, microglia, and T cells with different CRG-based subtypes of GADD45G+ Astrocytes.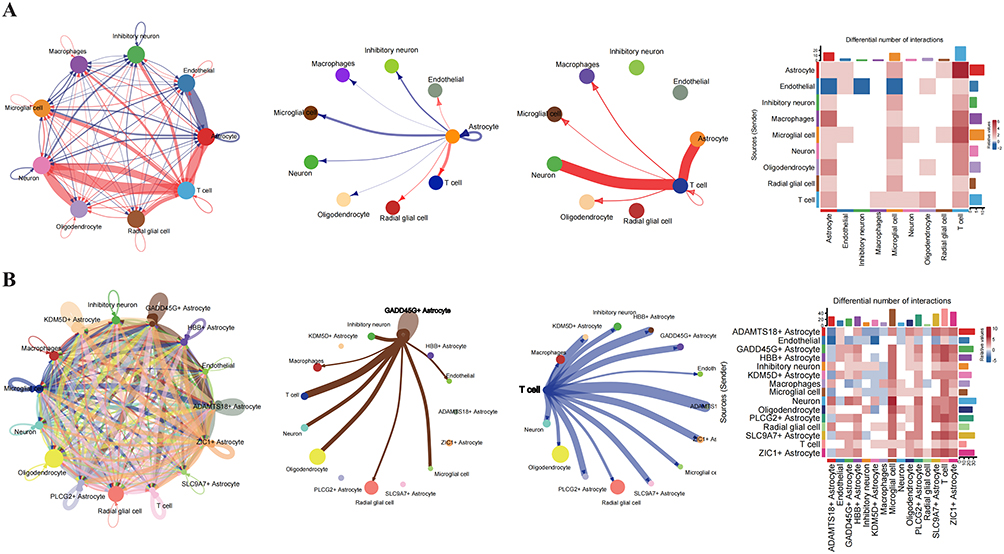
Validation of Hub Gene Expression in a TLE Mouse Model
To validate the tissue expression of hub genes (TUBA1A, PDE5A, and CD44), we established a mouse model of TLE (Figure 11A). Hippocampal tissues were extracted for WB analysis, which revealed that TUBA1A and PDE5A expression levels were significantly higher in the TLE model group compared to the control group, while CD44 expression was lower (Figure 11B). IHC experiments confirmed consistent expression trends with the WB results (Figure 11C).
 |
Figure 11 Validation of Hub Gene Expression in a TLE Mouse Model. (A) Schematic diagram illustrating the experimental workflow for establishing the TLE mouse model. (B) WB analysis of TLE and control groups. (C) Immunohistochemistry staining of hippocampal tissues from TLE and control groups, showing expression patterns of TUBA1A, PDE5A, and CD44. |
Discussion
TLE, the most common drug-resistant focal epilepsy, poses a significant challenge for the development of effective treatment strategies due to its complex pathophysiological mechanisms.19 This study, by integrating multiple bioinformatics analysis methods, aims to deeply explore the molecular landscape of TLE, identify key driver genes, and reveal their potential cellular and molecular mechanisms. Our research not only confirmed extensive transcriptomic alterations and significant neuroinflammatory features in TLE but also successfully screened and validated TUBA1A, PDE5A, and CD44 as key molecules in TLE, and preliminarily explored their potential roles in specific cell types and cell communication networks.
Our bulk transcriptome analysis revealed a large number of differentially expressed genes between TLE patients and controls, which were enriched in key pathways such as neuronal function, inflammatory response, and extracellular matrix remodeling. This is highly consistent with previous research results, indicating that the pathological core of TLE involves neuronal excitability imbalance, persistent neuroinflammation, and tissue structural changes.1,19 Notably, although the direct role of ferroptosis in TLE is not yet clear, metal ion homeostasis imbalance, especially copper and zinc, has been confirmed to be related to the occurrence and development of epilepsy.20–22 To explore the potential mechanism of ferroptosis in TLE, we analyzed the expression patterns of ferroptosis-related genes in patients. Our findings suggest that further research is needed to determine whether these key genes are involved in TLE pathology by affecting copper metabolism or other metal ion-dependent cellular processes.
A large number of studies have shown that neuroinflammation, including the activation of microglia/macrophages and the infiltration of peripheral immune cells into the brain, is a key factor in the occurrence and maintenance of TLE.19,23 Similarly, we further confirmed and refined the complex immune microenvironment in TLE tissues. We observed changes in the infiltration patterns of various immune cells, especially macrophages and T cell subsets, in TLE tissues. The dynamic changes of these immune cells and their potential associations with key genes suggest the importance of immune regulation in TLE and may provide targets for immunotherapy. In addition, in addition to the diseases we mentioned earlier, tuberculosis, cancer, and cardiovascular diseases are also associated with ferroptosis, and immune responses play an important role in them.24–26 Through WGCNA and consensus clustering analysis, we identified two different molecular subtypes that may exist in TLE, which differ in specific pathway activities and immune features, such as chemokines, protein absorption and degradation, cytokine receptor interactions, and PI3K-AKT signaling pathways. This provides a potential direction for precise classification and personalized treatment of TLE. Interestingly, type 1 diabetes and autoimmune thyroid disease were also enriched, suggesting a potential comorbidity mechanism with TLE.
We screened out three key genes, TUBA1A, PDE5A, and CD44, through machine learning and validated them in an independent external dataset.
TUBA1A, as one of the main subtypes of α-tubulin, is crucial for neuronal development, morphological maintenance, and axonal transport.27 Its role in neurodevelopmental disorders has been reported.28 In this study, TUBA1A was found to be upregulated in TLE tissues, and GSVA analysis indicated that its high expression was significantly associated with inflammatory response pathways, such as TNF-α and IL-6 signaling pathways. We discovered that TUBA1A is expressed in multiple cell types, suggesting that its role in TLE may involve neuronal stress responses, structural remodeling of glial cells, or inflammation-mediated cytoskeletal alterations. Dynamic changes in the microtubule network have been shown to affect the assembly and activation of inflammasomes,29 and the upregulation of TUBA1A may be involved in the neuroinflammatory process of TLE through such mechanisms.
PDE5A is a cGMP-specific phosphodiesterase that mainly regulates intracellular cGMP levels and plays a role in vascular dilation and neurotransmission.30 PDE5A inhibitors, such as sildenafil, have been used to treat various cardiovascular diseases31 and have shown potential neuroprotective effects.32 Our study found that PDE5A was upregulated in TLE and was enriched in endothelial cells or specific neuronal subpopulations. GSVA analysis also suggested that it was mainly associated with angiogenesis pathways. Considering that TLE is often accompanied by blood-brain barrier dysfunction and changes in cerebral blood flow,33 the upregulation of PDE5A may reflect adaptive or decompensatory changes in the vascular system in TLE lesions. The cGMP signaling pathway is also involved in regulating neuronal excitability and synaptic plasticity,34 so the alteration of PDE5A may directly or indirectly affect the epileptic susceptibility in TLE.
CD44 is a well-known cell surface adhesion molecule that acts as the main receptor for hyaluronic acid and plays a central role in inflammation, immune responses, cell migration, and tissue repair.35 In the nervous system, CD44 is a marker of reactive Astrocytes and is deeply involved in neuroinflammation and glial scar formation.36,37 Our study consistently observed a significant upregulation of CD44 in TLE tissues, and it was localized in reactive Astrocytes and microglia/macrophages. GSVA analysis showed that high expression of CD44 was closely related to key inflammatory and fibrotic pathways such as cell adhesion, ECM interaction, IL-6/JAK/STAT3, and TGF-β. This further solidified the position of CD44 as a core participant in neuroinflammation and glial cell activation in TLE. Our cell communication analysis also revealed that CD44 may mediate interactions between Astrocytes and immune cells such as T cells through its ligands, thereby amplifying the inflammatory cascade and promoting the formation and maintenance of epileptic networks.
We dissected the complexity of TLE through single-cell analysis, not only identifying the main cell types in TLE brain tissues and their proportion changes, but more importantly, through the subpopulation segmentation of Astrocytes, revealing their high heterogeneity in TLE. Different astrocyte subpopulations may have different functional phenotypes; for example, subpopulations with high expression of CD44 may exhibit stronger pro-inflammatory characteristics, while others may be involved in neuroprotection or repair processes. Understanding this heterogeneity is crucial for targeted astrocyte therapy in TLE.38 Pseudo-temporal analysis further simulated the state transitions of Astrocytes during the pathological process of TLE and identified the key genes and pathways driving these transitions, providing clues for understanding the dynamic process of disease progression. Additionally, we found that the interactions of specific ligand-receptor pairs between different cell types were enhanced or weakened, and these changes may collectively shape the pathological microenvironment of TLE. For instance, the enhanced communication pathways involving CD44, cytokines (TNF and IL-1β) and their receptors among Astrocytes, microglia and infiltrating immune cells may drive the persistent inflammatory response and neuronal damage.23
Our findings suggest potential translational opportunities for TLE therapeutics through three exploratory pathways. First, targeting prioritized hub genes—such as CD44 and PDE5A—may offer subtype-specific intervention via small-molecule inhibitors or CRISPR-based modulation. Second, drug repositioning strategies targeting copper homeostasis—such as trientine, an FDA-approved copper chelator—could be explored for cuproptosis-high subtypes showing ATP7A downregulation and mitochondrial copper overload. Lastly, emerging technologies like siRNA-loaded nanoparticles or CRISPR-interference may offer avenues to locally modulate hub genes, with preclinical studies needed to assess their efficacy in disrupting the cuproptosis-NF-κB-NLRP3 axis. Future clinical investigations integrating multi-omics profiling would be valuable to evaluate these hypotheses in subtype-specific cohorts.
Although this study has achieved many valuable findings, there are still some limitations. Firstly, our research is mainly based on transcriptome data, and changes in gene expression levels do not necessarily fully correspond to changes at the protein level and function. Subsequent proteomic and functional experiments are needed for verification. Secondly, an inherent limitation is that control specimens were obtained from non-epileptic surgical patients rather than truly healthy brains. These samples may harbor occult comorbidities, peri-operative medications, or chronic systemic disease that can subtly shift gene-expression profiles, ion-channel function, or synaptic protein levels. Additionally, the surgically resected TLE tissues usually come from drug-resistant patients, which may represent the late stage of the disease. Whether their molecular characteristics can be generalized to the early stage of TLE or other subtypes requires further research. Finally, although we have conducted in-depth analyses of key genes and pathways, the exact causal relationship and specific regulatory mechanisms of these genes in the occurrence and development of TLE still need to be functionally verified through in vitro cell models and in vivo animal models in the future.
In summary, through multi-integration analysis, this study successfully screened and verified TUBA1A, PDE5A and CD44 as potential key biomarkers and therapeutic targets for TLE. We systematically depicted the immune infiltration characteristics, cellular heterogeneity (especially the diversity of Astrocytes) and cell communication networks of TLE, providing new insights into the pathogenesis of TLE. These findings not only enrich our understanding of the molecular pathology of TLE, but also lay an important theoretical foundation for the future development of precise diagnostic tools and innovative therapeutic strategies for TLE. Future research should focus on in-depth functional verification of these key genes and explore the therapeutic potential of targeting these molecules or their related pathways.
Data Sharing Statement
A detailed description of the data sources is in methods section. Any additional information required to reanalyze the data reported in this paper is available from the corresponding author upon request.
Ethics
Our study was performed in accordance with the principles of the Declaration of Helsinki. The research did not involve the private data of the original data participants, but was based on publicly released data and did not require ethical approval from the original participants. And the human public database data and animal experiments were approved by the Institutional Review Board of the School of Basic Medical Sciences, Jilin University (2024-616) which has an animal facility license (SYXK(Ji)2023-0010), and all applicable institutional and governmental regulations regarding the ethical use of animals were strictly followed.
Author Contributions
Conceptualization, H.L. and S.L.; Data curation, W.L.; Formal analysis, Q.G., X.L. and L.H.; Investigation, W.L.; Methodology, W.L.; Resources, L.W.; Software, W.L.; Validation, Q.G., X.L. and L.H.; Visualization, W.L.; Writing original draft, W.L.; Writing review & editing, All Authors; Supervision, H.L. and S.L.; Funding acquisition, S.L.; Project administration, H.L. and S.L.
All authors took part in drafting, revising or critically reviewing the article; gave final approval of the version to be published; have agreed on the journal to which the article has been submitted; and agree to be accountable for all aspects of the work.
Funding
This work was supported by the Health Research Talent Special Project of Jilin Province (2023SCZ34).
Disclosure
The authors declare no competing interests.
References
1. Pitkänen A, Lukasiuk K. Molecular and cellular basis of epileptogenesis in symptomatic epilepsy. Epilepsy Behav. 2009;14 Suppl 1:16–25.
2. Pfisterer U, Petukhov V, Demharter S, et al. Identification of epilepsy-associated neuronal subtypes and gene expression underlying epileptogenesis. Nat Commun. 2020;11:5038. doi:10.1038/s41467-020-18752-7
3. Salmenperä T, Kälviäinen R, Partanen K, Pitkänen A. Hippocampal damage caused by seizures in temporal lobe epilepsy. Lancet. 1998;351:35. doi:10.1016/S0140-6736(05)79416-2
4. Bote RP, Blázquez-Llorca L, Fernández-Gil MA, et al. Hippocampal sclerosis: histopathology substrate and magnetic resonance imaging. Seminars Ultrasound CT MR. 2008;29:2–14. doi:10.1053/j.sult.2007.11.005
5. Buainain RP, Sodré AR, Dos Santos JS, et al. Single-base gene variants in MIR-146A and SCN1A genes related to the epileptogenic process in drug-responsive and drug-resistant temporal lobe epilepsy-a preliminary study in a brazilian cohort sample. Int J Mol Sci. 2024;25:6005. doi:10.3390/ijms25116005
6. Englot DJ, Morgan VL, Chang C. Impaired vigilance networks in temporal lobe epilepsy: mechanisms and clinical implications. Epilepsia. 2020;61:189–202. doi:10.1111/epi.16423
7. de Tisi J, Bell GS, Peacock JL, et al. The long-term outcome of adult epilepsy surgery, patterns of seizure remission, and relapse: a cohort study. Lancet. 2011;378:1388–1395. doi:10.1016/S0140-6736(11)60890-8
8. Kudin AP, Zsurka G, Elger CE, Kunz WS. Mitochondrial involvement in temporal lobe epilepsy. Exp Neurol. 2009;218:326–332. doi:10.1016/j.expneurol.2009.02.014
9. Zimmer TS, David B, Broekaart DWM, et al. Seizure-mediated iron accumulation and dysregulated iron metabolism after status epilepticus and in temporal lobe epilepsy. Acta Neuropathologica. 2021;142:729–759. doi:10.1007/s00401-021-02348-6
10. Tsvetkov P, Coy S, Petrova B, et al. Copper induces cell death by targeting lipoylated TCA cycle proteins. Science. 2022;375:1254–1261. doi:10.1126/science.abf0529
11. Tang D, Chen X, Kroemer G. Cuproptosis: a copper-triggered modality of mitochondrial cell death. Cell Res. 2022;32:417–418. doi:10.1038/s41422-022-00653-7
12. Langenbruch L, Bleß L, Schulte‐Mecklenbeck A, et al. Blood and cerebrospinal fluid immune cell profiles in patients with temporal lobe epilepsy of different etiologies - PubMed. Epilepsia. 2020;61(10):e153–e158.
13. Møller LB, Mogensen M, Horn N. Molecular diagnosis of menkes disease: genotype-phenotype correlation. Biochimie. 2009;91:1273–1277. doi:10.1016/j.biochi.2009.05.011
14. Członkowska A, Litwin T, Dusek P, et al. Wilson disease. Nat Rev Dis Primers. 2018;4:21. doi:10.1038/s41572-018-0018-3
15. Chen -L-L, Fan Y-G, Zhao L-X, Zhang Q, Wang Z-Y. The metal ion hypothesis of Alzheimer’s disease and the anti-neuroinflammatory effect of metal chelators. Bioorg Chem. 2023;131:106301. doi:10.1016/j.bioorg.2022.106301
16. Huang M, Zhang Y, Liu X. The mechanism of cuproptosis in Parkinson’s disease - PubMed. Ageing Res Rev. 2024;95:102214.
17. Chen H-Y, Pan Y-X, Li X-B, et al. Expression of ceruloplasmin in the peripheral blood of patients with drug-resistant epilepsy. J Clin Pharmacol. 2023;63:466–472. doi:10.1002/jcph.2183
18. Garton T, Gadani SP, Gill AJ, Calabresi PA. Neurodegeneration and demyelination in multiple sclerosis. Neuron. 2024;112:3231–3251. doi:10.1016/j.neuron.2024.05.025
19. Rana A, Musto AE. The role of inflammation in the development of epilepsy. J Neuroinflamm. 2018;15:144. doi:10.1186/s12974-018-1192-7
20. Sande R, Doshi G, Godad A. Deciphering the role of metal and non-metals in the treatment of epilepsy. Neurochem Int. 2023;167:105536. doi:10.1016/j.neuint.2023.105536
21. Tavasoli A, Afsharkhas L, Parvini B. Evaluating the serum levels of zinc, copper, magnesium, and 25-hydroxy vitamin D in children with idiopathic drug-resistant epilepsy; a cross-sectional study. BMC Pediatrics. 2024;24:518. doi:10.1186/s12887-024-04968-9
22. Mathie A, Sutton GL, Clarke CE, Veale EL. Zinc and copper: pharmacological probes and endogenous modulators of neuronal excitability. Pharmacol Therapeut. 2006;111:567–583. doi:10.1016/j.pharmthera.2005.11.004
23. Liddelow SA, Guttenplan KA, Clarke LE, et al. Neurotoxic reactive astrocytes are induced by activated microglia - PubMed. Nature. 2017;541(7638):481–487.
24. Li J, Zhang W, Ma X, et al. Cuproptosis/ferroptosis-related gene signature is correlated with immune infiltration and predict the prognosis for patients with breast cancer - PubMed. Front Pharmacol. 2023;14:1192434.
25. Li S, Long Q, Nong L, et al. Identification of immune infiltration and cuproptosis-related molecular clusters in tuberculosis. Front Immunol. 2023;14:1205741. doi:10.3389/fimmu.2023.1205741
26. Zhao M, Yu W-X, Liu S-J, et al. Identification and immuno-infiltration analysis of cuproptosis regulators in human spermatogenic dysfunction. Front Genet. 2023;14:1115669. doi:10.3389/fgene.2023.1115669
27. Janke C, Magiera MM. The tubulin code and its role in controlling microtubule properties and functions. Nat Rev Mol Cell Biol. 2020;21:307–326. doi:10.1038/s41580-020-0214-3
28. Maillard C, Roux CJ, Charbit-Henrion F, et al. Tubulin mutations in human neurodevelopmental disorders. Seminars Cell Dev Biol. 2023;137:87–95. doi:10.1016/j.semcdb.2022.07.009
29. Zhao S, Li X, Wang J, Wang H. The role of the effects of autophagy on NLRP3 inflammasome in inflammatory nervous system diseases. Front Cell Dev Biol. 2021;9:657478. doi:10.3389/fcell.2021.657478
30. Francis SH, Busch JL, Corbin JD. cGMP-dependent protein kinases and cGMP phosphodiesterases in nitric oxide and cGMP action - PubMed. Pharmacolog Rev. 2010;62(3):525–63
31. Bermejo J, Yotti R, García-Orta R, et al. Sildenafil for improving outcomes in patients with corrected valvular heart disease and persistent pulmonary hypertension: a multicenter, double-blind, randomized clinical trial - PubMed. Eur Heart J. 2018;39(15):1255–64
32. Zinni M, Pansiot J, Léger P-L, El Kamouh M, Baud O. Sildenafil-mediated neuroprotection from adult to neonatal brain injury: evidence, mechanisms, and future translation. Cells. 2021;10:2766. doi:10.3390/cells10102766
33. Marchi N, Granata T, Ghosh C, Janigro D. Blood-brain barrier dysfunction and epilepsy: pathophysiologic role and therapeutic approaches. Epilepsia. 2012;53:1877–1886. doi:10.1111/j.1528-1167.2012.03637.x
34. Feil R, Hofmann F, Kleppisch T. Function of cGMP-dependent protein kinases in the nervous system - PubMed. Rev Neurosci. 2005;16(1):23–42
35. Misra S, Hascall VC, Markwald RR, Ghatak S. Interactions between hyaluronan and its receptors (CD44, RHAMM) regulate the activities of inflammation and cancer. Front Immunol. 2015;6:201. doi:10.3389/fimmu.2015.00201
36. Yong VW, Wells J, Giuliani F, et al. The promise of minocycline in neurology. Lancet. 2004;3:744–751. doi:10.1016/S1474-4422(04)00937-8
37. van Hijfte L, Geurts M, de Heer I, et al. Gemistocytic tumor cells programmed for glial scarring characterize T cell confinement in IDH-mutant astrocytoma. Nat Commun. 2025;16:1156. doi:10.1038/s41467-025-56441-5
38. Khakh BS, Sofroniew MV. Diversity of astrocyte functions and phenotypes in neural circuits. Nat Neurosci. 2015;18:942–952. doi:10.1038/nn.4043
 © 2025 The Author(s). This work is published and licensed by Dove Medical Press Limited. The
full terms of this license are available at https://www.dovepress.com/terms
and incorporate the Creative Commons Attribution
- Non Commercial (unported, 4.0) License.
By accessing the work you hereby accept the Terms. Non-commercial uses of the work are permitted
without any further permission from Dove Medical Press Limited, provided the work is properly
attributed. For permission for commercial use of this work, please see paragraphs 4.2 and 5 of our Terms.
© 2025 The Author(s). This work is published and licensed by Dove Medical Press Limited. The
full terms of this license are available at https://www.dovepress.com/terms
and incorporate the Creative Commons Attribution
- Non Commercial (unported, 4.0) License.
By accessing the work you hereby accept the Terms. Non-commercial uses of the work are permitted
without any further permission from Dove Medical Press Limited, provided the work is properly
attributed. For permission for commercial use of this work, please see paragraphs 4.2 and 5 of our Terms.