Back to Journals » Journal of Inflammation Research » Volume 14
CTLA4-Mediated Immunosuppression in Glioblastoma is Associated with the Infiltration of Macrophages in the Tumor Microenvironment
Authors Guan X, Wang Y, Sun Y, Zhang C, Ma S, Zhang D, Li D, Jia W
Received 29 September 2021
Accepted for publication 10 December 2021
Published 23 December 2021 Volume 2021:14 Pages 7315—7329
DOI https://doi.org/10.2147/JIR.S341981
Checked for plagiarism Yes
Review by Single anonymous peer review
Peer reviewer comments 3
Editor who approved publication: Professor Ning Quan
Xiudong Guan,1,2,* Yangyang Wang,1,2,* Yueqian Sun,2,3 Chuanbao Zhang,1,2 Shunchang Ma,2,4 Dainan Zhang,1,2 Deling Li,1,2 Wang Jia1,2,4
1Department of Neurosurgery, Beijing Tiantan Hospital, Capital Medical University, Beijing, People’s Republic of China; 2China National Clinical Research Center for Neurological Diseases (NCRC-ND), Beijing, People’s Republic of China; 3Department of Neurology, Beijing Tiantan Hospital, Capital Medical University, Beijing, People’s Republic of China; 4Beijing Neurosurgical Institute, Beijing, People’s Republic of China
*These authors contributed equally to this work
Correspondence: Wang Jia
Department of Neurosurgery, Beijing Tiantan Hospital, Capital Medical University, No. 119 South 4th Ring West Road, Fengtai District, Beijing, 100070, People’s Republic of China
Tel +86 18810671839
Fax +86-10-67051377
Email [email protected]
Purpose: CTLA4, the immune checkpoint, has been widely reported to contribute to immune evasion in anti-tumor activity. The inhibitors of CTLA4 provide a novel strategy to improve the outcome of peripheral cancer, but their clinical effects are limited in glioblastoma (GBM), thus the comprehensive role of CTLA4 needs to be addressed.
Patients and Methods: A total of 471 GBM cases were enrolled in this study from 5 cohorts. In our works, the Cancer Genome Atlas (TCGA) cohort was divided into the training set, and the Chinese Glioma Genome Atlas (CGGA), REMBRANDT, and GSE84465 cohorts were divided into validation sets. Tissues from our cohort were collected for histopathologic validation. Then, the role of CTLA4 in the TME of GBM was comprehensively investigated.
Results: Significant differences exist in immunological characteristics between the low and high CTLA4 expression groups. Mutation analysis found different genomic patterns associated with CTLA4 expression. Next, network analysis found the module named c1-1562 including CTLA4 correlated with over survival (OS) in GBM. We also developed a predictive model to calculate the risk score for every GBM case and the risk score was independently related to OS. Furthermore, the expression of CTLA4 was positively related to the infiltration level and function of macrophage in GBM TME based on seven independent algorithms, single-cell RNA-seq data and immunohistochemistry.
Conclusion: These findings implicate that CTLA4 could serve as a novel target for prognosis and therapy in GBM patients. CTLA4-mediated immune suppression may be attributed to the infiltration of macrophages in the tumor microenvironment.
Keywords: glioblastoma, tumor microenvironment, CTLA4, macrophage, multi‐omics
Graphical Abstract:

Introduction
Glioblastoma (GBM) is the most common malignant primary brain tumor in adults.1 Despite numerous efforts, patients with GBM show poor outcome with a short median overall survival (OS), about 15–17 months with the current comprehensive treatment, due to its aggressiveness, resistance to chemotherapy, and recurrence.2,3
Immunotherapy, which enhances the immune system to attack the tumor, has provided unexpectedly beneficial clinical responses to patients suffering from other cancers, such as melanoma.4,5 In particular, checkpoint blockade therapies such as targeting cytotoxic T lymphocyte antigen 4 (CTLA4) have achieved significant success in treating many kinds of tumors.6,7 Expressing on the cell surface such as the regulatory T cell, CTLA4 competes CD28 for binding to costimulatory molecules (CD80 and CD86) on antigen-presenting cells, thereby inhibiting the activation of T cells.8 This results in the immune system not killing tumor cells well. Immune checkpoint inhibitors (ICIs) can decrease the inhibition of immune cells and reactivate the cytocidal immune response, by blocking the interaction between the ligands and the repressive receptors.9 However, the efficacy of ICIs for GBM has been limited to this day.10–12 Possibly for these reasons, the brain was always considered an immune-privileged organ, due to the lack of dedicated lymphatic channels, which shows fundamental differences between peripheral tissues and the central nervous system (CNS).12 On the other hand, hugely different and complicated mechanisms exist between peripheral tissues and the CNS.13 Thus, further investigations of the immune status of the CNS are needed.
Previous works revealed CTLA4 correlates with immune and clinical characteristics mainly in lower-grade glioma (LGG).14,15 However, the tumor microenvironment (TME) is a complex and heterogeneous environment composed of tumor cells, a mixture of tissue-resident and infiltrating immune cells, cytokine, and extracellular matrix proteins.16 GBM remodels a unique and complex brain microenvironment in many aspects. CNS-invading phagocytes in the TME of GBM were predominantly composed of higher relative frequencies of tissue-invading monocyte-derived macrophages, whereas tissue-resident monocytes were more infiltrating the LGG.17 Principal-component analysis (PCA) of the relative abundance of all investigated populations in the brain TME landscape showed principal component 1 (PC1) separated LGG from GBM, which indicated TME between GBM and LGG is obviously different.18 The CTLA4 related genetic functions in GBM are still open for further interpretation. In this study, we gathered 471 GBM cases from the Cancer Genome Atlas (TCGA), Chinese Glioma Genome Atlas (CGGA), REMBRANDT database, and the Gene Expression Omnibus database (GEO). These data included RNA sequencing (RNA-seq) data, DNA-seq data, single-cell RNA-seq (scRNA-seq) data, and corresponding clinical data. Tissues from our cohort were collected for histopathologic validation. This study revealed the overall landscape of the GBM microenvironment related to CTLA4 based on a large sample size and provided a novel insight toward immunotherapy for GBM patients.
Materials and Methods
Data Retrieval and Pre-Processing
Sequencing data and corresponding clinical information on patients diagnosed with GBM were obtained from TCGA, CGGA19 and REMBRANDT. In this study, 463 GBM cases were collected from three databases, including 168 cases from TCGA database, 85 cases from CGGA database, and 210 cases from REMBRANDT database. The RNA sequencing data of TCGA and CGGA were normalized and computed using the RPKM method (reads per kilobase transcriptome per million reads).20 Data from REMBRANDT were normalized by the affy package. If a dataset had multiple rows for the same gene, the mean value of all rows was chosen by limma package. We collected 20,099, 24,326 and 22,408 genes from each database above, respectively. The scRNA-seq data of human GBM cases were collected from the GEO database with accession number GSE84465.21 The time period from the date of diagnosis to the date of the last follow-up or death was defined as OS. We grouped cases from TCGA into a training cohort, whereas all cases from CGGA and REMBRANDT were used for validation. The cases were divided into high- and low-expression groups based on the median RPKM value of CTLA4. This study was approved by Capital Medical University’s Institutional Review Board.
Immunological Role of the CTLA4 in GBM TME
Immunological characteristics of the TME in GBM were evaluated in four ways. It included the immunomodulators expression, the cancer immunity cycle, the expression of inhibitory immune checkpoints, and the infiltration level of tumor-infiltrating immune cells (TIICs). At first, we acquired 122 immunomodulators according to the previous study,22 including MHC, receptors, chemokines, and immunostimulators. Second, as shown in the previous study,23 the status of anti-cancer immunity including seven-step Cancer-Immunity Cycle and more details were shown in Supplementary Method. Third, we also acquired 22 inhibitory therapeutic potential immune checkpoints.24 Finally, some effector genes of TIICs were obtained from Hu J’s study.25 Subsequently, a differential analysis of the four parts above was performed between the high and low CTLA4 expression groups. To further explore the relationship between the CTLA4 expression in GBM and TME, stromal, immune scores, tumor purity level, and cell proportions were computed using the GSEABase, GSVA R, and ESTIMATE R packages. As shown in the previous study, a pan-cancer T cell-inflamed score model was established to assess the extent of T cell infiltration.26 This T cell-inflamed score model is shown in Supplementary Methods. Next, the T cell inflamed score for each GBM case was computed using the mentioned model. Exploration of the proportion of TIICs is one of the most important parts of the assessment of TME. Following this, to avoid any error or bias by using a single algorithm, we comprehensively inferred the infiltration level of TIICs using seven independent algorithms: TIMER, CIBERSORT-ABS, QuanTIseq, XCELL, EPIC, MCP-COUNTER, and TIP,23,27 which can play the role of mutual verification. We further validated the result in the CGGA cohort.
Mutation Analysis of CTLA4 in GBM
One hundred and forty-eight cases with somatic mutations and 164 cases with somatic copy number alterations (CNAs), which corresponded to the cases with RNA-seq data, were downloaded from TCGA database. We used the R software package “maftool” to identify the different driver genes between two high and low CTLA4 expression groups and listed the 20 driver genes with the highest mutational frequencies. GISTIC2.0 was used to assess CNAs associated with CTLA4. Genes with GISTIC value greater than 1 or less than −1 was defined as amplification or deletion, respectively.
Co-Expression Network Analysis and Development of a Predictive Model by Cox Regression and LASSO Analysis
Gene co-expression networks were constructed using multiscale embedded gene co-expression network analysis (MEGENA).28 The gene expression matrix of 168 GBM patients from TCGA was sent to MEGENA analysis to generate the enriched functional modules using R packages MEGENA. In brief, three steps were included in this analysis. (1) construction of a planar filtered network; (2) multi-scale clustering analysis; (3) downstream analysis. Significant hubs were identified based on the topology of networks using multiscale hub analysis. A module named c1_1562 including CTLA4 was identified. We further evaluated whether c1_1562 module was associated with OS or not. The univariate Cox analysis with “survival” R package, the least absolute shrinkage and selector operation (LASSO) algorithm with “glmnet” R package, and multivariable Cox regression were applied to screen out 5 genes and calculate the coefficients. The formula was constructed as: Risk Score = sum [coefficient(genei) × expr(genei)].
Processing and Analysis of the GBM scRNA-Seq Data
A total of 3589 single cells from 4 GBM cases were obtained in this study. ScRNA-seq data analysis was performed with Seurat R package.29 Quality control filtering was performed to exclude low-quality genes detected in less than 3 cells and low-quality cells with less than 100 total detected genes or cells with more than 10% of mitochondria-expressed genes. Then, the remaining data were normalized using the SCTransform method. PCA was used for scRNA-seq data dimension reduction.30 First 30 principal components were used for T-distributed stochastic neighbor embedding (tSNE). Afterward, the macrophage cluster was annotated and identified according to the CellMarker database.31 The mean value of CTLA4 gene expression for each sample was calculated based on the normalized value. Subsequently, two samples were assigned to the high CTLA4 gene expression group, and the others were assigned to the low group. We analyzed cell composition between the two groups.
Immunohistochemical Staining
We further collected 4 GBM paraffin-embedded tissues to support the relationship of CTLA4 and macrophage. Immunohistochemistry (IHC) of paraffin sections was performed as previously described.32 Briefly, the sections were incubated with primary antibodies against CTLA4 (Abcam, ab237712, 1:500 dilution) and CD68 (Abcam, ab955, 1:3000 dilution), which is a well-recognized marker of macrophage in the CNS, the sections were incubated with primary antibody over-night at 4°C and then incubated with respective secondary antibody (GB23303 against ab237712; GB23301 against ab955, 1:200) at room temperature for 1 hour. After washing with PBS buffer, the sections were stained with DAB for 5 minutes, rinsed in water, and counterstained with hematoxylin. Quantitative evaluation was performed by examining five random fields at × 20 magnification from each section. Then, the H-score33 of CD68 and the number of CTLA4 expression cells were calculated, respectively. Stained cells were manually counted 3 times for each field at × 20 magnification independently by two investigators. H-score of CD68 and the number of stained cells were determined by the average method.
Statistical Analysis
Test of normality was performed using the Shapiro–Wilk normality test. T-test was used to compare the normally distributed quantitative variables. Variables that were not normally distributed were assessed for significance using the Wilcoxon rank-sum test. Categorical variables were tested using the chi-square test. Log rank test was used for Kaplan-Meier (KM) analyses to assess survival differences. “timeROC” package was applied to plot the receiver operating characteristic (ROC) curve and calculate the area under the curve (AUC) at 1- and 3-year. The Pearsons’ correlation coefficient between the H-score of CD68 and the number of CTLA4 expression cells was then computed in IHC analysis. All analyses were performed using R language version 4.0.1. A two-tailed p-value was adopted, and P ≤ 0.05 or Q ≤ 0.05 was considered to be statistically significant.
Results
Role of CTLA4 in Microenvironment Immunity
After removing the unexpressed immunomodulators, we obtained 121 and 108 related genes from TCGA cohort and CGGA cohort, respectively, including MHC molecules, chemokines, immunostimulators and receptors. Most of the immunomodulators were upregulated in the high CTLA4 group (Figure 1A). Furthermore, upregulated immunomodulators are related to the effect of antigen-presenting and the recruitment of TIICs. The cancer immunity cycle plays an important role in TME.23,34 Compared with the low-CTLA4 group, as shown in Figure 1B, most of the steps were upregulated. Specifically, Step 1, Step 2, Step 4_1, Step 4_5, Step 4_7, Step 4_8, Step 4_9, Step 4_10, Step 4_12, Step 4_13, Step 4_15, Step 4_17, and Step 5. Nevertheless, Step 3, Step 4_14, and Step 6 were downregulated. Similar results were also observed in CGGA database (Figure S1A and B). This analysis showed that CTLA4 plays a critical role in facilitating immune activities. Consistently, we found CTLA4 is significantly positively related to most of the ICIs and effector genes of TIICs in both TCGA and CGGA cohorts (Figure 1C and D, S1C and S1D). In the ssGSEA analysis, the majority of TIICs were upregulated in the high CTLA4 group (Figure 2A and D). Meanwhile, the estimate score, immune score, and stromal score were higher in the high CTLA4 group than in the low CTLA4 group. However, tumor purity showed the opposite result (Figure 2B and E), which was in agreement with a previous study.32 What is more, CTLA4 was found to be significantly positively associated with T cell inflamed score of pan-cancer (r = 0.32, P < 0.001 in TCGA cohort and r = 0.29, P = 0.006 in CGGA cohort) (Figure 2C and F).
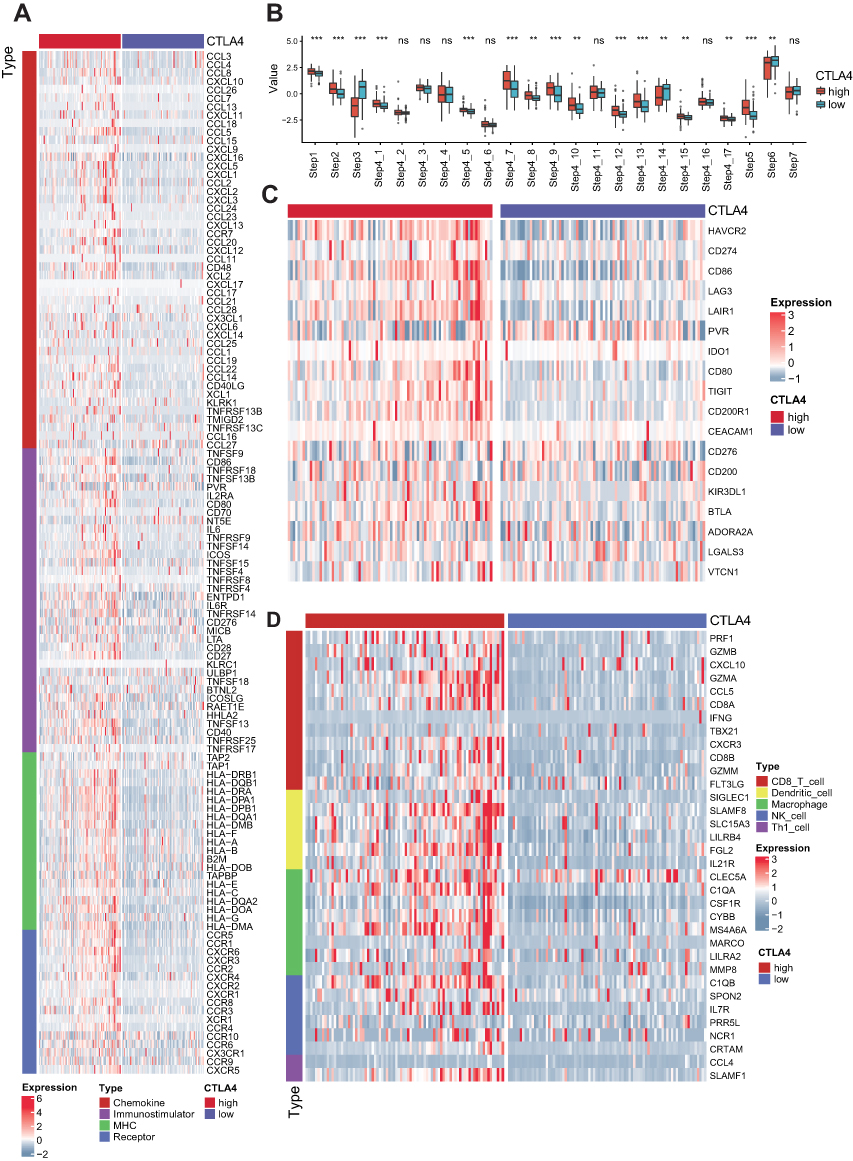 |
Figure 1 CTLA4 shapes a non-inflamed TME in TCGA GBM cohort. (A) Differences in the expression of 121 immunomodulators (chemokines, receptors, MHC, and immunostimulators) between high- and low-CTLA4 groups in GBM. (B) Differences in the various steps of the cancer immunity cycle between high- and low-CTLA4 groups. Step 1: release of cancer cell antigens; Step 2: cancer antigen presentation; Step 3: priming and activation; Step 4_1- Step 4_17: B cell, Basophil, CD4+ T cell, CD8+ T cell, Dendritic cell, Eosinophil, Macrophage, Myeloid derived suppress cell, Monocyte, Neutrophil, NK cell, T cell, Th1 cell, Th17 cell, Th2 cell, Th22 cell, Treg cell recruiting, respectively; Step 5: infiltration of immune cells into tumors; Step 6: recognition of cancer cells by T cells; Step 7: killing of cancer cells. (C) Differences in the expression of 18 inhibitory immune checkpoints between high- and low-CTLA4 groups. (D) Differences in the effector genes of the tumor-associated immune cells between high- and low-CTLA4 groups. **P < 0.01, ***P < 0.001. Abbreviation: ns, non-significant. |
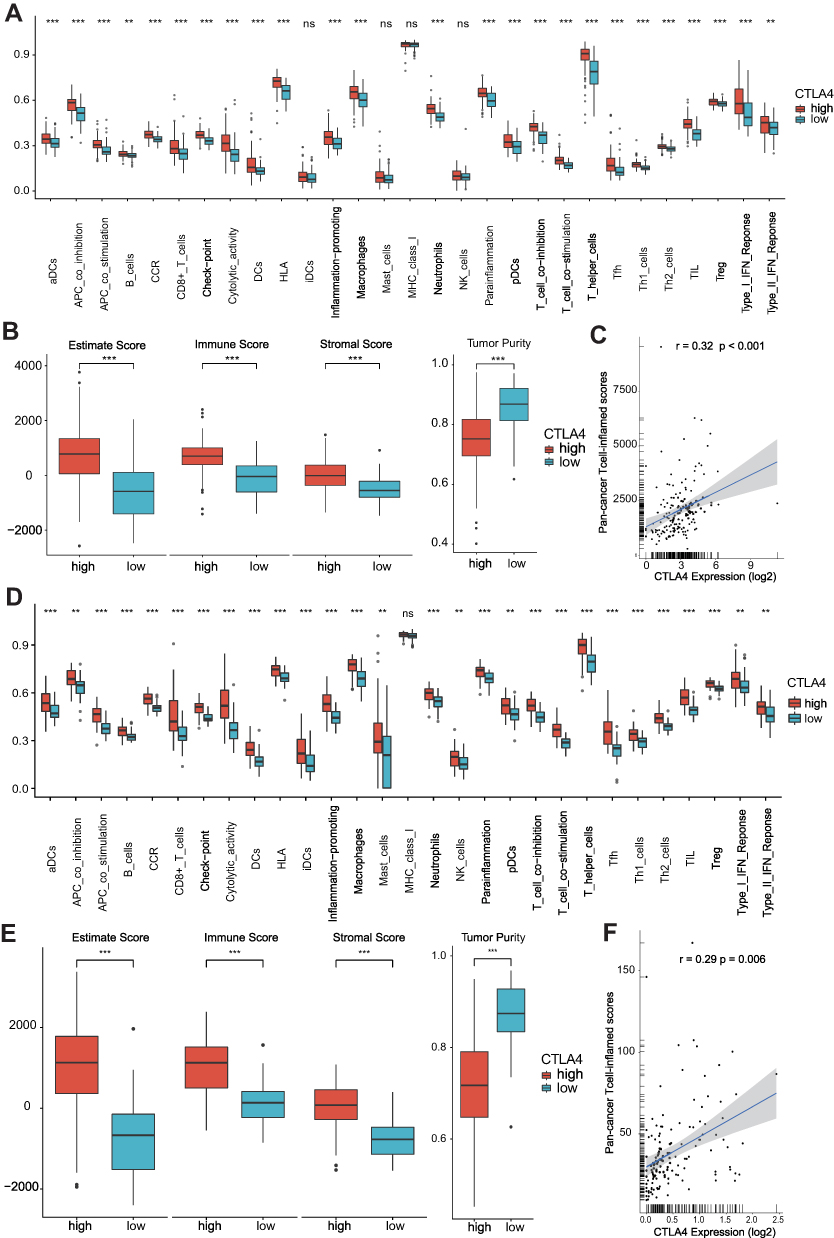 |
Figure 2 CTLA4 plays a key role in TME. Differences in the level of TIICs, three different scores, and tumor purity based on ssGSEA algorithm between high- and low-CTLA4 groups in TCGA GBM cohort (A and B) and in CGGA GBM cohort (D and E). Correlations between CTLA4 and the pan-cancer T cell inflamed score in TCGA GBM cohort (C) and in CGGA GBM cohort (F). **P < 0.01, ***P < 0.001, ns non-significant. |
Correlation Between CTLA4 and Genomic Alterations
According to CTLA4 expression from low to high, cases were ranked and separated into four groups. To begin with, gene mutation frequencies in the 1st quarter (lower) CTLA4 expression group were compared with the 4th quarter (higher) CTLA4 expression group. Mutations in DOCK5, SPTA1, AHNAK2, CDH9, SETD2, and AFF2 occurred more frequently in the lower CTLA4 expression group. On the contrary, mutations in PTEN, EGFR, TTN, ARHGEF5, DNAH17, RB1, COL6A2, COL6A3, FLG, GRM3, and NF1 were evidently enriched in the higher CTLA4 expression group (Figure 3A). As for CNAs analysis, CNA events of EGFR, GSX2, CDKN2A, CDK4, and MDM2 occurred both in lower and higher groups, and no significant difference was observed (Figure 3B). Besides, the G score of several genes did not reach the threshold for defining abnormal CNAs events, yet the statistical significances of them did exist, such as MUC4 (3q29, q = 0.05), QKI (6q26, q = 2.25E-05), PTEN (10q23.31, q = 1.06E-07) in the cases with lower CTLA4 expression (1st quarter) and TBX3 (12q24.21, q = 0.03), MYB (6q25.1, q = 0.05), PTEN (10q23.31, q = 3.11E-05) in the cases with higher CTLA4 expression (4th quarter).
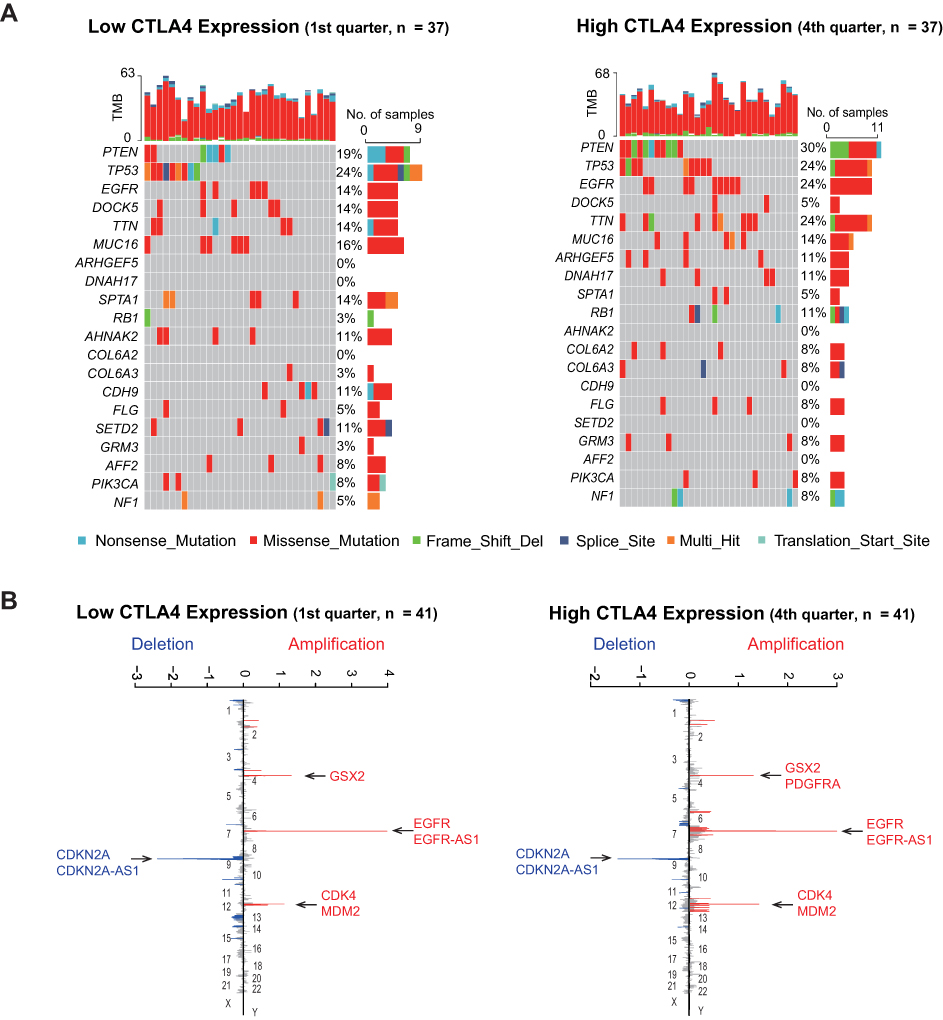 |
Figure 3 Different genomic profiles is associated with CTLA4 expression. (A) Differential somatic mutations were detected by comparing GBM with low and high CTLA4 groups. (B) A different CNAs profile could be observed between low and high CTLA4 groups. Chromosomal locations of peaks of significantly focal amplification (red) and deletions (blue) were presented. |
Identification and Validation of a Predictive Model
As gene networks rather than individual genes govern physiological responses, we employed MEGENA to characterize functionally co-expressed gene modules. MEGENA identified 893 modules for GBM. The smallest module containing CTLA4 and other 124 genes, named c1-1562, was found. In this module, the analysis identified 8 hub genes including CTLA4, ADH1C, ABCA9, KERA, TNNT3, KRTAP10−1, CERS3, and PRG4 (Figure 4A). Some of them correlated with the prognosis in GBM (Figure S2A-S2S). Interestingly, CERS3, TNNT3, and ADH1C were associated with OS in two different databases. However, few studies on their roles in GBM have been reported at this time. Next, we further explored whether the c1-1562 module is related to the prognosis of GBM or not. Overall, after calculating using the method above, five genes were screened out, and the risk scores of both TCGA and CGGA cohorts were calculated (Figure 4B). This is a calculation formula including five genes and the corresponding coefficients. Risk Score = 0.068 × EXPHOXB13 + (−0.524) × EXPBTBD3 + 0.094 × EXPFCN3 + 0.298 × EXPHAR1B + 0.314 × EXPSLC16A13.
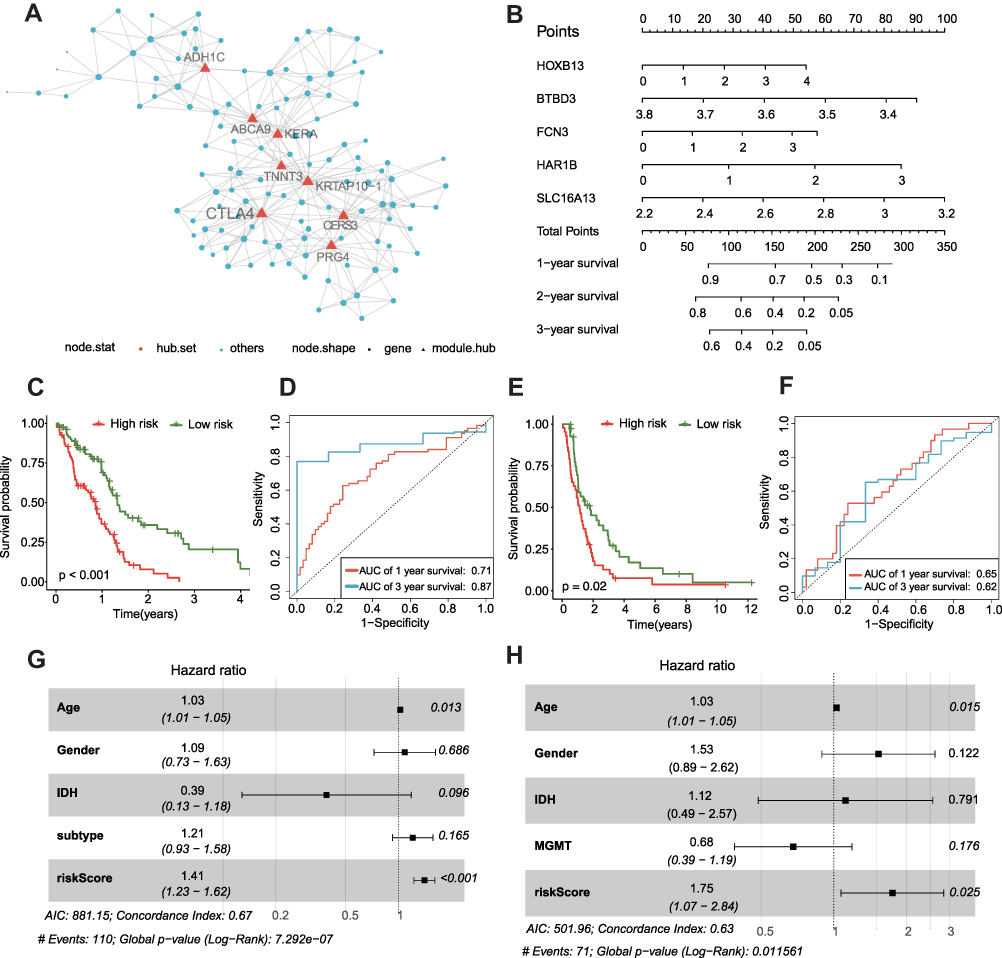 |
Figure 4 CTLA4-related genes signature is constructed for survival prediction. (A) Visualization of the CTLA4 related to network of c1-1562 based on MEGENA algorithm. (B) Nomogram to predict the 1-, 2-, 3-year OS. Kaplan–Meier curve based on the predictive model in TCGA cohort (C) and CGGA cohort (E). ROC curves of the signature for predicting 1- and 3- year survival of GBM in both TCGA (D) and CGGA cohorts (F). (G and H) Multivariable comparison of clinical features and the risk score. Subtype includes classical (reference), mesenchymal, neural, proneural. Abbreviations: IDH, isocitrate dehydrogenase; MGMT, methylguanine methyltransferase. |
Cases were classified into two groups according to the risk score median value. In the TCGA cohort, KM analysis showed that the risk score might serve as a significant prognostic factor for GBM (Figure 4C). Figure 4D shows AUC for the 1st year: 0.71; AUC for the 3rd year, 0.87. In the CGGA cohort, the risk score was also significantly related to OS by KM analysis (Figure 4E). The AUC was 0.65 and 0.62 in the 1st year and the 3rd year (Figure 4F). Meanwhile, the multivariate analysis indicated that the risk score was independently related to OS in both TCGA and CGGA cohorts (Figure 4G and H).
Enhancement of the Infiltration and Function of Macrophage in High CTLA4 Expression Group
As shown in Figure 5A, this was a landscape about the proportions of different subpopulations of TIICs calculated by the CIBERSORT algorithm. The positive correlation between CTLA4 and 3 subpopulations (Macrophages M1, Macrophages M2, and T cells CD8+) was investigated further (Figure 5B). Next, we also applied seven kinds of algorithms to compute the infiltration level of TIICs (Table 1). The founding is in accordance with the above result. We further explored the relationship between CTLA4 and classical chemokines and surface markers of both M1-macrophages (IL-12B, IL-23A, IL-23R, TNF) and M2-macrophages (IL-10, TGF-beta 1). As the result, CTLA4 was positively correlated with the marker genes of macrophages (Figure 5C–H). Similar results were also observed in the CGGA database (Figures S3A-S3H, S4A-S4G). Further survival analyses were conducted for CTLA4 expression, macrophage level, and the combination of them, respectively. The level of macrophage was calculated based on the XCELL algorithm. CTLA4 and macrophage exhibited a synergistic effect on GBM OS. Patients with high CTLA4 expression and high macrophage level had worst OS than patients with low CTLA4 expression and low macrophage level (P < 0.01), and survival times were not statistically significantly different between other subgroups both in TCGA cohort (Figure 6A–C) and CGGA cohort (Figure 6D–F).
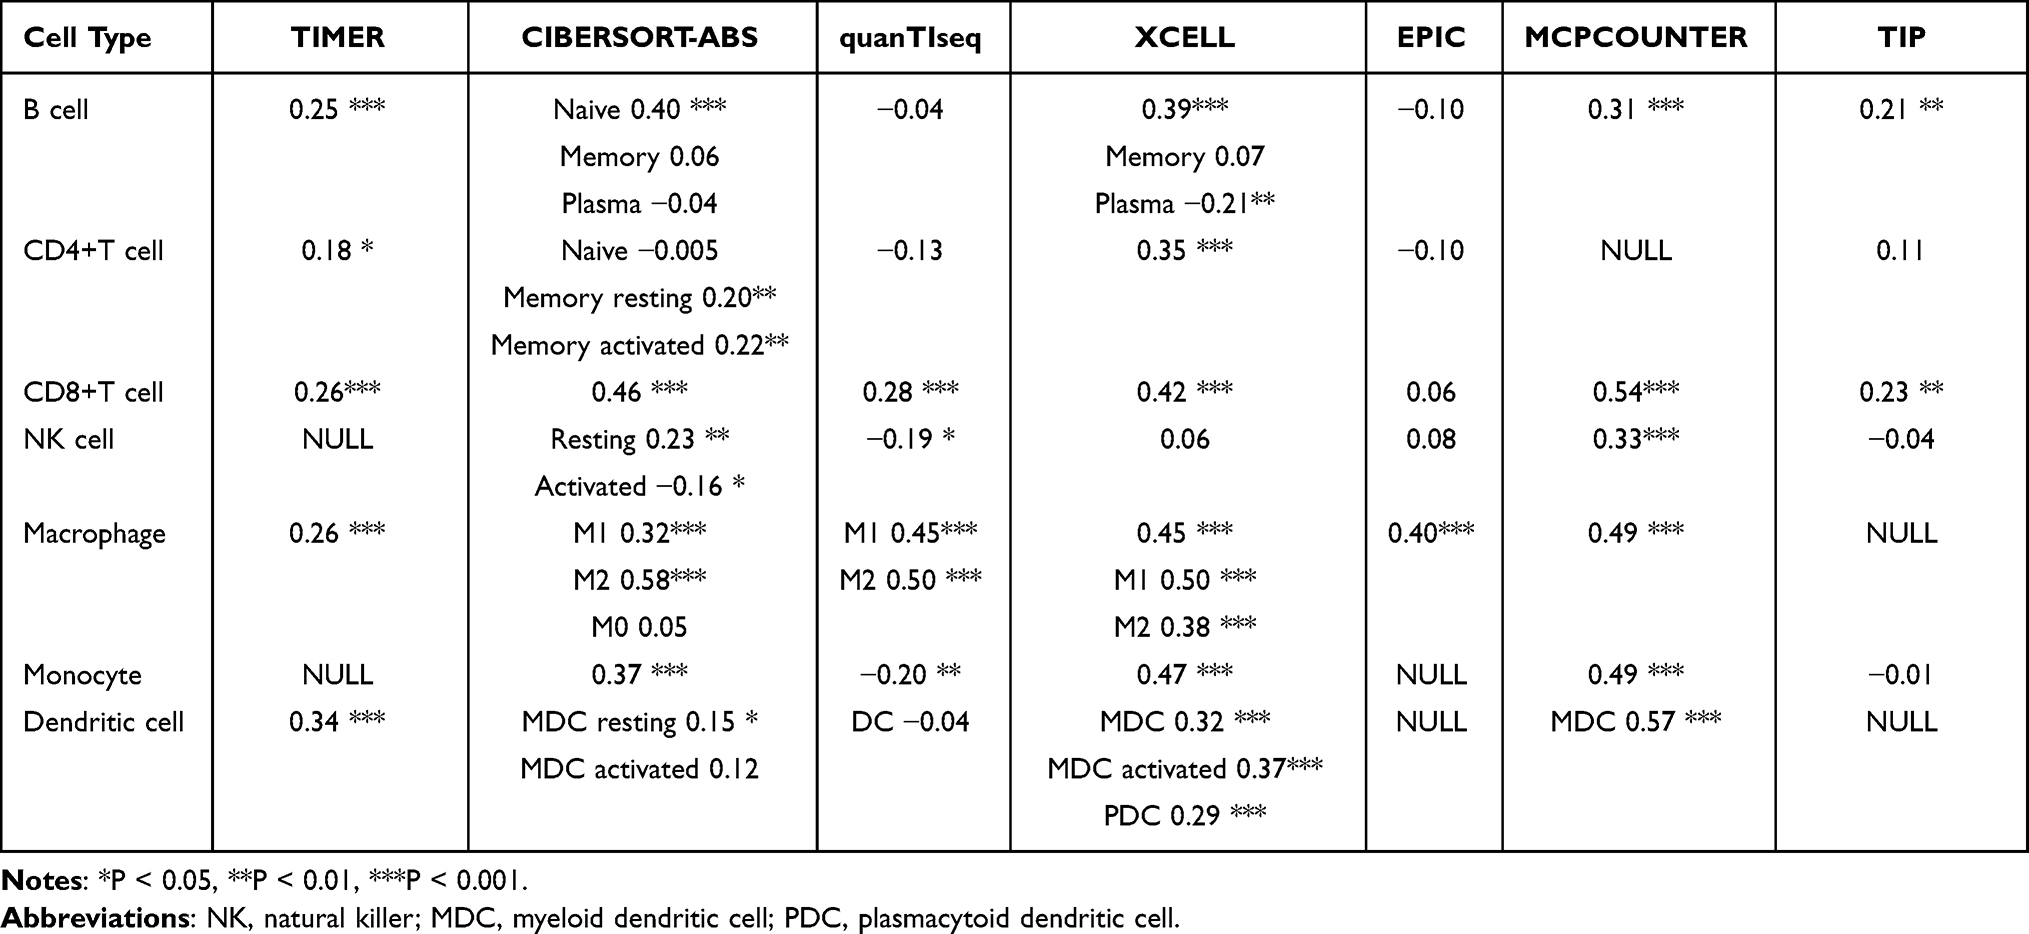 |
Table 1 Pearson Correlation Between CTLA4 and the Infiltration Levels of Seven Types of TIICs |
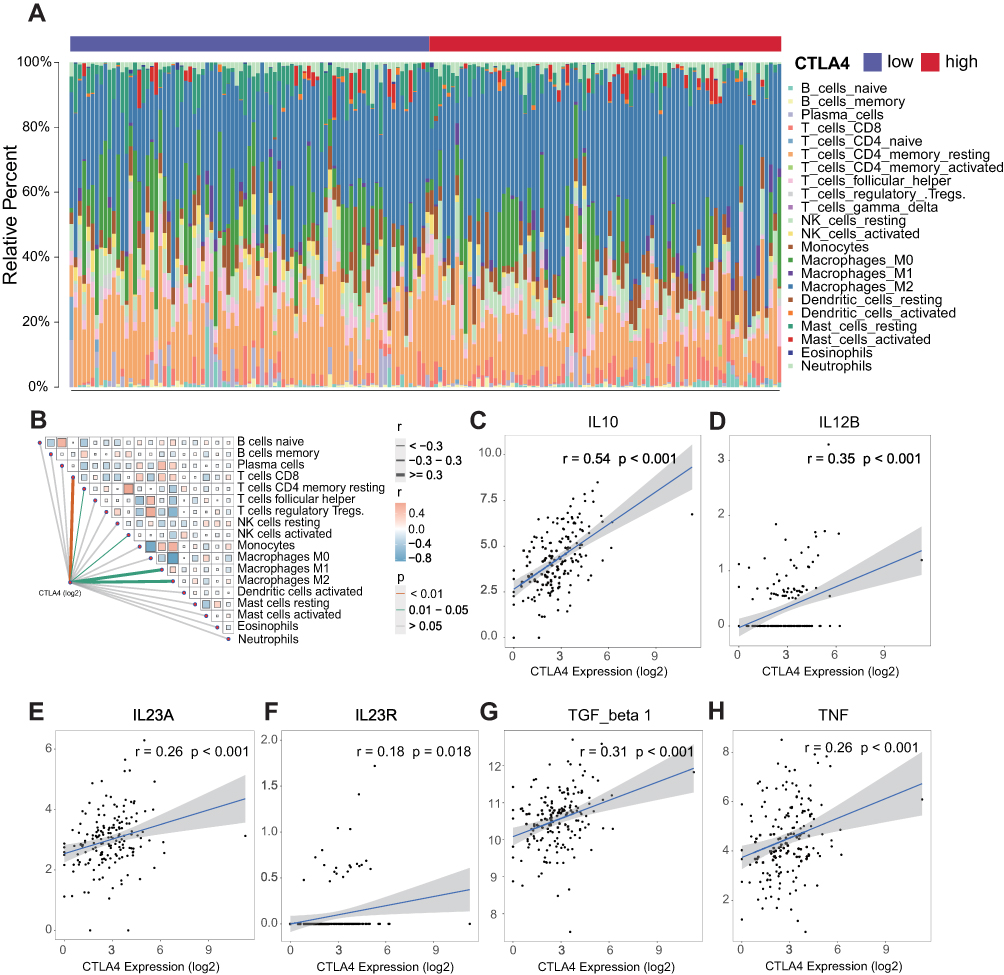 |
Figure 5 Significant differences exist in immune landscape. (A) Relative proportion of TIICs based on CIBERSORT algorithm in TCGA GBM cohort. (B) The association between CTLA4 and TIICs. (C–H) Correlation of CTLA4 and classical chemokines and surface markers of macrophage. |
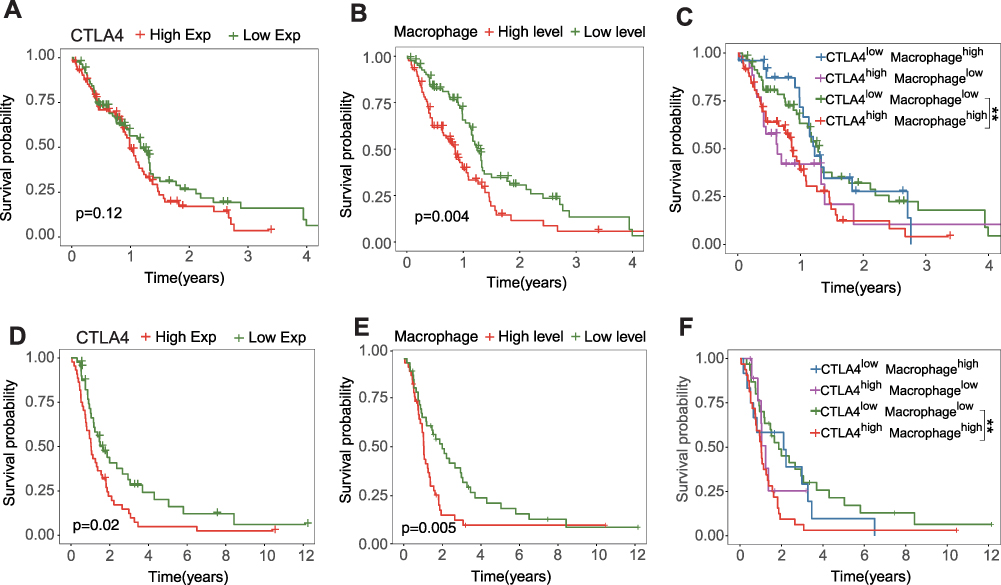 |
Figure 6 The combination of CTLA4 and macrophage is a better marker for prognosis. Kaplan-Meier analysis in patient groups with high and low CTLA4 (A), macrophage (B), and the combination (C) in TCGA GBM cohort. Kaplan-Meier analysis in patient groups with high and low CTLA4 (D), macrophage (E), and the combination (F) in CGGA GBM cohort. **P < 0.01. |
Relationship Between CTLA4 and Macrophage in GBM Based on scRNA-Seq Data and Immunohistochemistry
All kinds of proportions of TIICs in TME were calculated and inferred by different algorithms. To further validate the results above, scRNA-seq data was analyzed. After the workflow above in the method part, we obtained 3570 cells and 20,812 corresponding genes from 4 GBM cases. Afterward, all cells in 4 cases GBM were divided into 10 clusters. Cell clusters were visualized using the t-SNE method (Figure 7A). Based on the CellMarker database, Cluster 0 and 2 containing 518 cells, significantly highly expressing CD68, C1QB, RNASET2, were annotated as macrophages (Figure 7B–D). Subsequently, we explored the number and proportion of macrophages in every individual. 386, 489, 1165, and 1530 cells were contained in sample 1, sample 2, sample 3, and sample 4, respectively (Figure 7E–I). According to the mean of CTLA4 expression, sample 2 and sample 3 were stratified into the low CTLA4 expression group, while sample 1 and sample 4 were divided into high CTLA4 expression. The proportion of macrophages was 68.89% in the high CTLA4 expression group. On the contrary, the value was only 30.96% in the low CTLA4 expression group, which showed the difference is significant (P < 0.001) (Figure 7J). IHC analysis of 4 tissues confirmed that the infiltration of macrophages was enriched in high CTLA4 expression cases. Typical immunohistochemistry results and quantitative results are shown in Figure 7K and L, respectively. The results further supported our conclusion.
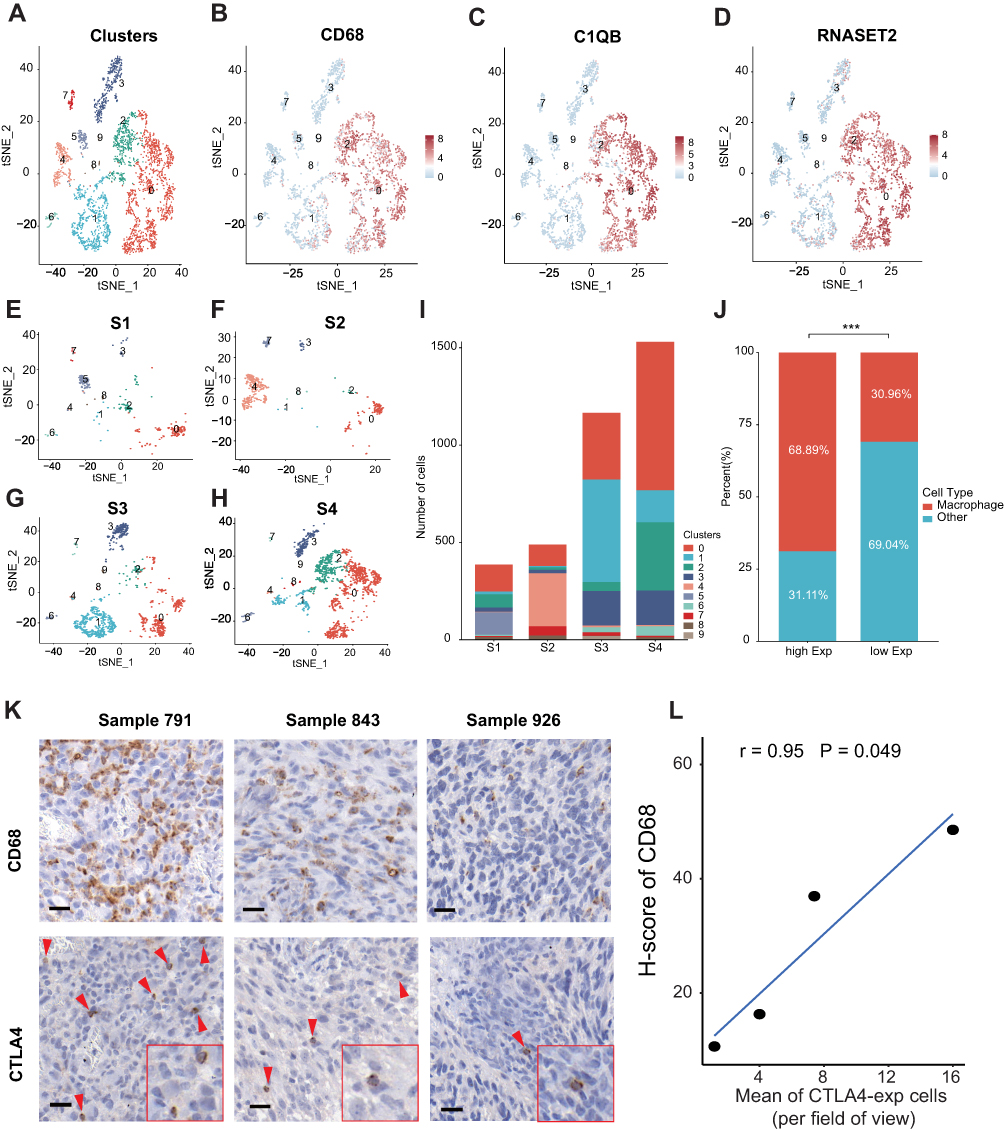 |
Figure 7 The expression of CTLA4 is related to the infiltration of macrophage. Relationship between CTLA4 and macrophage based on scRNA-seq data. (A) The tSNE algorithm was applied for dimensionality reduction and 10 cell clusters were successfully classified. (B–D) tSNE plots show the marker genes expression for macrophage. (E–H) tSNE plots show cell clusters of every single case. (I) Column plot shows cell number in every single case. (J) Difference in relative proportion of macrophage between high- and low-CTLA4 groups based on the mean value of CTLA4 expression. (K) Typical immunohistochemistry results of CTLA4-expressing cells and CD68-expressing macrophages (red arrows). Scale bars, 20 μm. Inset, high magnification. (L) Correlation of mean of CTLA4-expression cells per field of view and H-score of CD68 expression.***P < 0.001. Abbreviations: tSNE, T-distributed stochastic neighbor embedding; EXP, expression. |
Discussion
The tumor microenvironment constitutes a vital element of tumor biology. Many studies have demonstrated that the interactions of these TME components, such as tumor cells or TIICs, affect clinical outcomes. For instance, Ryota et al have found that tumor cells promote the infiltration of macrophages, and that macrophages infiltrate the tumor to induce immune suppression and resistance to chemotherapy in pancreatic cancer.35 Therefore, TME has received increasing attention.
CTLA4 is an important co-inhibitory molecule that suppresses the functions of T cells. Thus, this suggests that inhibition of CTLA4 is a novel immunotherapy target for GBM. However, the poor response of monotherapy10 and unfinished clinical trials (such as NCT02794883, NCT02311920) prevent clinical treatment in GBM. Therefore, the poor result of clinical trials on CTLA4 antibodies in GBM have promoted further research on the mechanism of immunotherapies resistance.
In this study, the role of CTLA4 in the GBM TME was particularly demonstrated. First, we confirmed that CTLA4 is positively related to the immunological status of GBM. Second, mutation analysis was also performed, and CTLA4 was related to gene mutation status. Third, we elucidated the association of CTLA4 and prognosis and successfully developed a model to predict prognosis. Finally, CTLA4 also enhanced the recruitment of macrophages and the proportion of macrophages in GBM. This was the first integrative study demonstrating the overall landscape of the GBM microenvironment related to CTLA4 based on multi-omics analysis.
CTLA4 could have broad effects on TME in GBM based on our study. Here, we found CTLA4 is associated with immune-related molecules, immunity cycle, immune score, and so on. Next, we found different genomic patterns in the higher and the lower CTLA4 expression groups. In somatic mutation analysis, concretely, compared with the lower-CTLA4 group, more mutation frequencies of PTEN, EGFR, RB1, DNAH17, NF1, and so on were observed in the higher-CTLA4 group. These gene mutations correlated with drug resistance, poor prognosis, and increased infiltration of macrophages.36,37 In addition, statistically significant differences in CNAs were observed between the lower and higher CTLA4 groups, such as QKI, CDK8, MUC4 in the lower-CTLA4 group. However, the G score value of the above-mentioned genes did not reach the threshold for defining abnormal CNAs events. Therefore, CTLA4 has not yet been shown to be related to CNAs in GBM. This could be due to the relatively small cases with available CNAs information. This certainly requires further verification and exploration in the future.
Furthermore, to further explore the prognostic role of CTLA4, the risk model was created and performed robustly in both the training and the external validation cohorts. Of distinction, in this model, there existed five genes, which were HOXB13, BTBD3, FCN3, HAR1B, SLC16A13, respectively. As shown in previous studies, HOXB13 and HAR1B correlatedwith GBM cell proliferation, invasion, and poor clinical outcomes in GBM, which may explain why this model can predict poor prognosis.38,39 However, there is no relevant research on the roles of BTBD3, FCN3, and SLC16A13 in GBM, which is a potential line of inquiry for future researchers.
In the GBM TME, our study particularly focused on the relationship between CTLA4 and macrophage. It is well known that most non-neoplastic cells are macrophages in GBM TME.40
Macrophages are mononuclear cell types characterized by considerable diversity and plasticity.41 The macrophage activation might be further subdivided into the pro-inflammatory M1 phenotype and the anti-inflammatory M2 phenotype, which causes quite opposite experimental results in vivo and in vitro. However, increasing evidence reveals that a distinct partitioning of the M1/M2 macrophage subtypes does not exist in patients,42 since different macrophage subtypes are likely to result in the same poor prognosis in GBM patients.41 Similarly, in our study, CTLA4 indeed correlated positively to the infiltration level and markers of both M1 and M2 subtypes, and no significant difference between them was observed in our study.
Accumulating evidence indicates that macrophage promotes GBM growth and invasion. Macrophages are enriched in the GBM environment, releasing a set of growth factors and cytokines and interacting with cancer cells.43,44 In this manner, macrophages facilitate tumor proliferation, survival and migration by releasing stress-inducible protein 1 (STI1),45 transforming growth factor-beta (TGF-beta),46 and so on. Meanwhile, GBM cells also release several factors such as CCL247 and SDF1,48 which attract macrophages to the tumor tissue. In our study, CTLA4 is associated with the step of the macrophage recruiting in immune cycle analysis and the proportion of macrophage in TME as well. Besides, CTLA4 correlated to the cytokines expression such as IL10, IL12B, IL23A, IL23R, TGF-beta1, TNF. More importantly, the synergistic effect of CTLA4 and macrophage more significantly correlated with OS for GBM. Moreover, a previous study reported the response of CTLA4 alone blockade strategy is still considered limited, whereas a combination of anti-CTLA4 and anti-PD-1 therapy dramatically improves the cure rate to 75%.10 This gives us an idea that the TME complexity in GBM restricts the clinical efficacy of one target of immunotherapy, and a combination of anti-CTLA4 and anti-macrophage therapy might also mean a better therapeutic effect in GBM.
Taken together, CTLA4 exerted a comprehensive effect on GBM microenvironment via the infiltration of macrophages. Further demonstration of the role of CTLA4 in clinical, genomic and TME conditions will contribute to stratifying clinical treatment and enhancing the efficiency of cancer immunotherapy.
Abbreviations
GBM, glioblastoma; CTLA-4, cytotoxic T-lymphocyte-associated protein 4; ICIs, immune-checkpoint inhibitors; TME, tumor microenvironment; TCGA, The Cancer Genome Atlas; CGGA, Chinese Glioma Genome Atlas; GEO, Gene Expression Omnibus; RNA-seq, RNA sequencing; scRNA-seq, single cell RNA sequencing; RPKM, reads per kilobase transcriptome per million reads; OS, overall survival; TIICs, tumor-infiltrating immune cells; PCA, principal components analysis; tSNE, T-distributed stochastic neighbor embedding; CNAs, copy number alterations; MEGENA, multiscale embedded gene co-expression network analysis; LASSO, least absolute shrinkage and selector operation; KM, Kaplan-Meier; ROC, receiver operating characteristic; AUC, area under the curve; NK, natural killer; MDC, myeloid dendritic cell; PDC, plasmacytoid dendritic cell; STI1, stress-inducible protein 1; TGF-beta, transforming growth factor-beta; PD-1, programmed cell death protein 1; EXP, expression.
Ethics
The study was conducted in accordance with good clinical practice guidelines and the declaration of Helsinki, which has been approved by Capital Medical University's Institutional Review Board.
Acknowledgments
This project was supported by the National Natural Science Foundation of China (No. 82071996, No. 81802483 and No. 82003075), the Beijing Municipal Health Commission of China (No. PXM2019_026280_000002), the Capital’s Funds for Health Improvement and Research (No. 2018-1-1071), and Beijing Hospitals Authority Youth Program (No. QML20190507).
Disclosure
The authors report no conflicts of interest in this work.
References
1. Louis DN, Perry A, Reifenberger G, et al. The 2016 World Health Organization Classification of Tumors of the Central Nervous System: a summary. Acta Neuropathol. 2016;131(6):803–820. doi:10.1007/s00401-016-1545-1
2. Jiang T, Mao Y, Ma W, et al. CGCG clinical practice guidelines for the management of adult diffuse gliomas. Cancer Lett. 2016;375(2):263–273. doi:10.1016/j.canlet.2016.01.024
3. Preusser M, Lim M, Hafler DA, Reardon DA, Sampson JH. Prospects of immune checkpoint modulators in the treatment of glioblastoma. Nat Rev Neurol. 2015;11(9):504–514. doi:10.1038/nrneurol.2015.139
4. Luke JJ, Flaherty KT, Ribas A, Long GV. Targeted agents and immunotherapies: optimizing outcomes in melanoma. Nat Rev Clin Oncol. 2017;14(8):463–482. doi:10.1038/nrclinonc.2017.43
5. Kohrt HE, Tumeh PC, Benson D, et al. Immunodynamics: a cancer immunotherapy trials network review of immune monitoring in immuno-oncology clinical trials. J Immunother Cancer. 2016;4:15. doi:10.1186/s40425-016-0118-0
6. Iams WT, Porter J, Horn L. Immunotherapeutic approaches for small-cell lung cancer. Nat Rev Clin Oncol. 2020;17(5):300–312. doi:10.1038/s41571-019-0316-z
7. Emens LA. Breast cancer immunotherapy: facts and hopes. Clin Cancer Res. 2018;24(3):511–520. doi:10.1158/1078-0432.CCR-16-3001
8. Ribas A, Wolchok JD. Cancer immunotherapy using checkpoint blockade. Science. 2018;359(6382):1350–1355. doi:10.1126/science.aar4060
9. Wei SC, Duffy CR, Allison JP. Fundamental mechanisms of immune checkpoint blockade therapy. Cancer Discov. 2018;8(9):1069–1086. doi:10.1158/2159-8290.CD-18-0367
10. Reardon DA, Gokhale PC, Klein SR, et al. Glioblastoma eradication following immune checkpoint blockade in an orthotopic, immunocompetent model. Cancer Immunol Res. 2016;4(2):124–135. doi:10.1158/2326-6066.CIR-15-0151
11. Reardon DA, Brandes AA, Omuro A, et al. Effect of Nivolumab vs Bevacizumab in Patients With Recurrent Glioblastoma: the CheckMate 143 Phase 3 Randomized Clinical Trial. JAMA Oncol. 2020;6(7):1003–1010. doi:10.1001/jamaoncol.2020.1024
12. Lim M, Xia Y, Bettegowda C, Weller M. Current state of immunotherapy for glioblastoma. Nat Rev Clin Oncol. 2018;15(7):422–442. doi:10.1038/s41571-018-0003-5
13. Louveau A, Smirnov I, Keyes TJ, et al. Structural and functional features of central nervous system lymphatic vessels. Nature. 2015;523(7560):337–341. doi:10.1038/nature14432
14. Yin W, Jiang X, Tan J, et al. Development and validation of a tumor mutation burden-related immune prognostic model for lower-grade glioma. Front Oncol. 2020;10:1409. doi:10.3389/fonc.2020.01409
15. Liu F, Huang J, Liu X, Cheng Q, Luo C, Liu Z. CTLA-4 correlates with immune and clinical characteristics of glioma. Cancer Cell Int. 2020;20:7. doi:10.1186/s12935-019-1085-6
16. Balkwill FR, Capasso M, Hagemann T. The tumor microenvironment at a glance. J Cell Sci. 2012;125(Pt 23):5591–5596. doi:10.1242/jcs.116392
17. Friebel E, Kapolou K, Unger S, et al. Single-cell mapping of human brain cancer reveals tumor-specific instruction of tissue-invading leukocytes. Cell. 2020;181(7):1626–1642.e1620. doi:10.1016/j.cell.2020.04.055
18. Klemm F, Maas RR, Bowman RL, et al. Interrogation of the microenvironmental landscape in brain tumors reveals disease-specific alterations of immune cells. Cell. 2020;181(7):1643–1660.e1617. doi:10.1016/j.cell.2020.05.007
19. Zhao Z, Zhang KN, Wang Q, et al. Chinese Glioma Genome Atlas (CGGA): a Comprehensive Resource with Functional Genomic Data from Chinese Glioma Patients. Genomics Proteomics Bioinformatics. 2021;19:1–12. doi:10.1016/j.gpb.2020.10.005
20. Mortazavi A, Williams BA, McCue K, Schaeffer L, Wold B. Mapping and quantifying mammalian transcriptomes by RNA-Seq. Nat Methods. 2008;5(7):621–628. doi:10.1038/nmeth.1226
21. Darmanis S, Sloan SA, Croote D, et al. Single-Cell RNA-seq analysis of infiltrating neoplastic cells at the migrating front of human glioblastoma. Cell Rep. 2017;21(5):1399–1410. doi:10.1016/j.celrep.2017.10.030
22. Charoentong P, Finotello F, Angelova M, et al. Pan-cancer immunogenomic analyses reveal genotype-immunophenotype relationships and predictors of response to checkpoint blockade. Cell Rep. 2017;18(1):248–262. doi:10.1016/j.celrep.2016.12.019
23. Xu L, Deng C, Pang B, et al. TIP: a web server for resolving tumor immunophenotype profiling. Cancer Res. 2018;78(23):6575–6580. doi:10.1158/0008-5472.CAN-18-0689
24. Auslander N, Zhang G, Lee JS, et al. Robust prediction of response to immune checkpoint blockade therapy in metastatic melanoma. Nat Med. 2018;24(10):1545–1549. doi:10.1038/s41591-018-0157-9
25. Hu J, Yu A, Othmane B, et al. Siglec15 shapes a non-inflamed tumor microenvironment and predicts the molecular subtype in bladder cancer. Theranostics. 2021;11(7):3089–3108. doi:10.7150/thno.53649
26. Ayers M, Lunceford J, Nebozhyn M, et al. IFN-γ-related mRNA profile predicts clinical response to PD-1 blockade. J Clin Invest. 2017;127(8):2930–2940. doi:10.1172/JCI91190
27. Li T, Fu J, Zeng Z, et al. TIMER2.0 for analysis of tumor-infiltrating immune cells. Nucleic Acids Res. 2020;48(W1):W509–w514. doi:10.1093/nar/gkaa407
28. Song WM, Zhang B. Multiscale Embedded Gene Co-expression Network Analysis. PLoS Comput Biol. 2015;11(11):e1004574. doi:10.1371/journal.pcbi.1004574
29. Butler A, Hoffman P, Smibert P, Papalexi E, Satija R. Integrating single-cell transcriptomic data across different conditions, technologies, and species. Nat Biotechnol. 2018;36(5):411–420. doi:10.1038/nbt.4096
30. Lall S, Sinha D, Bandyopadhyay S, Sengupta D. Structure-Aware Principal Component Analysis for Single-Cell RNA-seq Data. J Comput Biol. 2018;25(12):1365–1373. doi:10.1089/cmb.2018.0027
31. Zhang X, Lan Y, Xu J, et al. CellMarker: a manually curated resource of cell markers in human and mouse. Nucleic Acids Res. 2019;47(D1):D721–d728. doi:10.1093/nar/gky900
32. Zhang C, Cheng W, Ren X, et al. Tumor Purity as an Underlying Key Factor in Glioma. Clin Cancer Res. 2017;23(20):6279–6291. doi:10.1158/1078-0432.CCR-16-2598
33. Wang D, Hu X, Liu C, et al. Protein C receptor is a therapeutic stem cell target in a distinct group of breast cancers. Cell Res. 2019;29(10):832–845. doi:10.1038/s41422-019-0225-9
34. Chen DS, Mellman I. Oncology meets immunology: the cancer-immunity cycle. Immunity. 2013;39(1):1–10. doi:10.1016/j.immuni.2013.07.012
35. Takahashi R, Ijichi H, Sano M, et al. Soluble VCAM-1 promotes gemcitabine resistance via macrophage infiltration and predicts therapeutic response in pancreatic cancer. Sci Rep. 2020;10(1):21194. doi:10.1038/s41598-020-78320-3
36. Chow RD, Guzman CD, Wang G, et al. AAV-mediated direct in vivo CRISPR screen identifies functional suppressors in glioblastoma. Nat Neurosci. 2017;20(10):1329–1341. doi:10.1038/nn.4620
37. Wang Q, Hu B, Hu X, et al. Tumor Evolution of Glioma-Intrinsic Gene Expression Subtypes Associates with Immunological Changes in the Microenvironment. Cancer Cell. 2017;32(1):42–56.e46. doi:10.1016/j.ccell.2017.06.003
38. Wang X, Sun Y, Xu T, et al. HOXB13 promotes proliferation, migration, and invasion of glioblastoma through transcriptional upregulation of lncRNA HOXC-AS3. J Cell Biochem. 2019;120(9):15527–15537. doi:10.1002/jcb.28819
39. Lei B, Yu L, Jung TA, et al. Prospective Series of Nine Long Noncoding RNAs Associated with Survival of Patients with Glioblastoma. J Neurol Surg a Cent Eur Neurosurg. 2018;79(6):471–478. doi:10.1055/s-0038-1655549
40. Bettinger I, Thanos S, Paulus W. Microglia promote glioma migration. Acta Neuropathol. 2002;103(4):351–355. doi:10.1007/s00401-001-0472-x
41. Wei J, Chen P, Gupta P, et al. Immune biology of glioma-associated macrophages and microglia: functional and therapeutic implications. Neuro Oncol. 2020;22(2):180–194. doi:10.1093/neuonc/noz212
42. Ransohoff RM. A polarizing question: do M1 and M2 microglia exist? Nat Neurosci. 2016;19(8):987–991. doi:10.1038/nn.4338
43. Platten M, Kretz A, Naumann U, et al. Monocyte chemoattractant protein-1 increases microglial infiltration and aggressiveness of gliomas. Ann Neurol. 2003;54(3):388–392. doi:10.1002/ana.10679
44. Okada M, Saio M, Kito Y, et al. Tumor-associated macrophage/microglia infiltration in human gliomas is correlated with MCP-3, but not MCP-1. Int J Oncol. 2009;34(6):1621–1627. doi:10.3892/ijo_00000292
45. Carvalho da Fonseca AC, Wang H, Fan H, et al. Increased expression of stress inducible protein 1 in glioma-associated microglia/macrophages. J Neuroimmunol. 2014;274(1–2):71–77. doi:10.1016/j.jneuroim.2014.06.021
46. Wick W, Platten M, Weller M. Glioma cell invasion: regulation of metalloproteinase activity by TGF-beta. J Neurooncol. 2001;53(2):177–185. doi:10.1023/A:1012209518843
47. Zhang J, Sarkar S, Cua R, Zhou Y, Hader W, Yong VW. A dialog between glioma and microglia that promotes tumor invasiveness through the CCL2/CCR2/interleukin-6 axis. Carcinogenesis. 2012;33(2):312–319. doi:10.1093/carcin/bgr289
48. Wang SC, Hong JH, Hsueh C, Chiang CS. Tumor-secreted SDF-1 promotes glioma invasiveness and TAM tropism toward hypoxia in a murine astrocytoma model. Lab Invest. 2012;92(1):151–162. doi:10.1038/labinvest.2011.128
 © 2021 The Author(s). This work is published and licensed by Dove Medical Press Limited. The
full terms of this license are available at https://www.dovepress.com/terms
and incorporate the Creative Commons Attribution
- Non Commercial (unported, 3.0) License.
By accessing the work you hereby accept the Terms. Non-commercial uses of the work are permitted
without any further permission from Dove Medical Press Limited, provided the work is properly
attributed. For permission for commercial use of this work, please see paragraphs 4.2 and 5 of our Terms.
© 2021 The Author(s). This work is published and licensed by Dove Medical Press Limited. The
full terms of this license are available at https://www.dovepress.com/terms
and incorporate the Creative Commons Attribution
- Non Commercial (unported, 3.0) License.
By accessing the work you hereby accept the Terms. Non-commercial uses of the work are permitted
without any further permission from Dove Medical Press Limited, provided the work is properly
attributed. For permission for commercial use of this work, please see paragraphs 4.2 and 5 of our Terms.