Back to Journals » International Journal of Chronic Obstructive Pulmonary Disease » Volume 17
CT-Based Commercial Software Applications: Improving Patient Care Through Accurate COPD Subtyping
Authors Wang JM, Ram S, Labaki WW ![]() , Han MK, Galbán CJ
, Han MK, Galbán CJ ![]()
Received 31 December 2021
Accepted for publication 3 April 2022
Published 26 April 2022 Volume 2022:17 Pages 919—930
DOI https://doi.org/10.2147/COPD.S334592
Checked for plagiarism Yes
Review by Single anonymous peer review
Peer reviewer comments 2
Editor who approved publication: Prof. Dr. Richard Russell
Jennifer M Wang,1 Sundaresh Ram,2 Wassim W Labaki,1 MeiLan K Han,1 Craig J Galbán2
1Division of Pulmonary and Critical Care Medicine, University of Michigan, Ann Arbor, MI, USA; 2Department of Radiology, University of Michigan, Ann Arbor, MI, USA
Correspondence: Craig J Galbán, Department of Radiology, University of Michigan, BSRB, Room A506, 109 Zina Pitcher Place, Ann Arbor, MI, 48109-2200, USA, Tel +1 734-764-8726, Fax +1 734-615-1599, Email [email protected]
Abstract: Chronic obstructive pulmonary disease (COPD) is heterogenous in its clinical manifestations and disease progression. Patients often have disease courses that are difficult to predict with readily available data, such as lung function testing. The ability to better classify COPD into well-defined groups will allow researchers and clinicians to tailor novel therapies, monitor their effects, and improve patient-centered outcomes. Different modalities of assessing these COPD phenotypes are actively being studied, and an area of great promise includes the use of quantitative computed tomography (QCT) techniques focused on key features such as airway anatomy, lung density, and vascular morphology. Over the last few decades, companies around the world have commercialized automated CT software packages that have proven immensely useful in these endeavors. This article reviews the key features of several commercial platforms, including the technologies they are based on, the metrics they can generate, and their clinical correlations and applications. While such tools are increasingly being used in research and clinical settings, they have yet to be consistently adopted for diagnostic work-up and treatment planning, and their full potential remains to be explored.
Keywords: lung disease, medical imaging, phenotyping, clinical, quantitative
A Letter to the Editor has been published for this article.
Introduction
Despite advances in symptomatic management of chronic obstructive pulmonary disease (COPD) with new combination inhalers and in therapeutic options for patients with severe emphysema such as endobronchial valves, patients with COPD still have significant morbidity and mortality.1 Patients newly diagnosed with early COPD tend to have variable disease courses that remain difficult to predict even with readily available in-office spirometry.2 The healthcare burden of COPD in the US is significant and exacerbations account for $18 billion in direct costs annually.3 Thus, there is a pressing need to define clinically meaningful subtypes in COPD that better categorize patients with vastly different disease trajectories to identify those at risk for accelerated lung function decline and, ultimately, improve disease outcomes with targeted therapies.
The Fleischner Society published a statement in 2015 detailing computed tomography (CT) subtypes based on visual and quantitative evaluation of images to classify emphysema as well as other important features such as airway wall thickening, inflammatory small airways disease, interstitial abnormalities, and bronchiectasis.4 The combination of visual assessment and quantitative metrics can further help identify COPD phenotypes and provide information on disease progression and mortality.5 Commercially available software using novel radiographic features has become increasingly available to further aid in COPD subtyping. The use of quantitative CT (QCT) imaging has been harnessed by several companies discussed in detail in this review. These software packages can assess changes in airway architecture, vascular morphology, and parenchymal density on inspiratory and expiratory scans to measure the extent of emphysema, air trapping, and functional small airways disease (fSAD).
Search Strategy and Selection Criteria
The intention of this review is to present an overview of commercial platforms that provide quantitative CT applications for improving COPD subtyping. While there are many software platforms that offer this capability, those described here were selected based on our experience and communications with members of the COPDGene and SPIROMICS studies as well as with clinicians from other institutions. We searched published articles reported on the websites of VIDA, Imbio, Thirona, FLUIDDA, 4D Medical, and CoreLine, the companies that produce the platforms we review. We also searched terms such as “COPD” and “computed tomography,” company names (“VIDA,” “Imbio,” “Thirona,” “FLUIDDA,” “4D Medical,” “CoreLine”), and different combinations of these terms for all fields on PubMed and Web of Science before December 4, 2021. Only clinical studies using non-contrast QCT were included in this review; as such, the terms “preclinical” and “contrast enhanced” were used for exclusion criteria. All articles were published in English and related to COPD, QCT, and clinical studies. We excluded some articles whose resources were not available. We evaluated reviews and original research in this area, then cited relevant articles.
Quantitative Analysis of Computed Tomography
X-ray CT, with its high spatial resolution and air-soft tissue contrast, is used extensively in the clinical management of COPD patients. For radiographic assessments, thoracic radiologists routinely use the extensive array of analytical techniques that have been developed to improve the diagnostic and prognostic value of QCT.6,7 Measurements of low attenuation areas are by far the most extensively used readouts for quantifying obstructive regions of the lungs. When applying a threshold of <950 Hounsfield Units (HU) to CT scans acquired at inspiration (ie, full inflation), this quantitative index, presented as the relative volume of the lung parenchyma, has been pathologically validated as a measure of emphysema.8,9 Similar strategies have been applied to expiratory CT scans to assess the extent of air trapping, a hallmark of small airways disease (SAD).10 Spatially aligned paired CT scans acquired at different inflation levels have provided readouts of ventilation, ventilation heterogeneity, and quantification of SAD when emphysema is present.11–13 The high air-tissue contrast on the inspiration CT scan has also been exploited to develop methods for airway and vessel measurements, as well as fissure completeness.14–17 Combined, these analytical techniques provide detailed quantitative information on airway and vessel remodeling and alterations in local parenchyma.
Commercial Platforms
FLUIDDA
FLUIDDA, founded in 2005 and based primarily in Belgium, has harnessed the power of functional respiratory imaging (FRI) through the Broncholab platform. Using high-resolution CT (HRCT), FRI can create 3-dimensional airway models for computational fluid dynamics simulations.18 In addition to FRI, Broncholab provides additional QCT-based metrics that include lobe volumes and densities, emphysema scores, and pulmonary airway and vascular measurements (Figure 1).
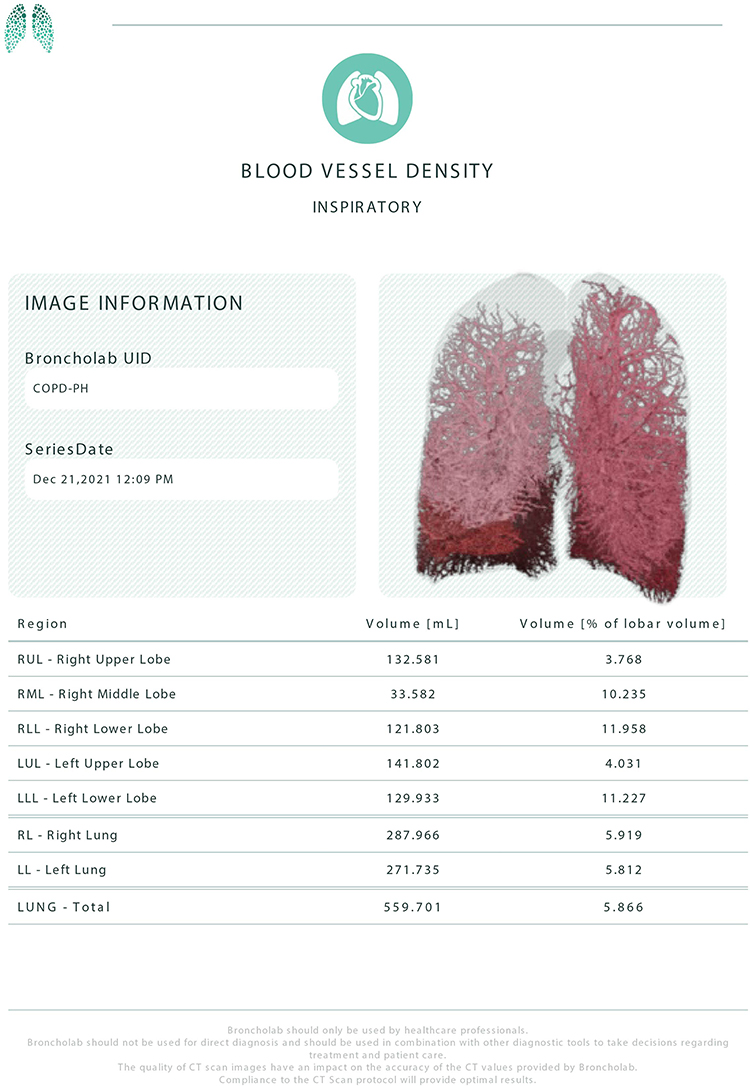 |
Figure 1 Representative clinical report of blood vessel density with coronal image and summary statistics from a COPD patient,courtesy of FLUIDDA. |
Researchers have demonstrated how FRI can be used to understand the heterogeneity of COPD. Among studies of exacerbations, van Geffen et al19 and Hajian et al20 used FRI to assess regional heterogeneity by looking at hyperinflation, airway diameter, and resistance, both during a COPD exacerbation and after resolution. Improvements in hyperinflation and airway resistance correlated to improved quality-of-life and pulmonary function testing (PFT) metrics, suggesting that therapy should focus on decreasing airway resistance, mostly distally, during exacerbations. FRI could further visualize variability in ventilation and airway resistance among subjects during exacerbations. In addition, FRI revealed changes in airway structure and volume in different regions of the lungs, including both central and distal airways,21 after inhaling a combination of a long-acting beta agonist (LABA) and inhaled corticosteroid (ICS).22 De Backer et al23 later demonstrated that administration of inhaled extra fine beclomethasone/formoterol with a lower ICS dose improved lung function and hyperinflation. Furthermore, FRI identified regional changes in medication deposition not detected by spirometry. More recently, this group found the combination long-acting muscarinic antagonist (LAMA) glycopyrrolate and LABA formoterol improved airway volumes and resistance, as measured by FRI, as well as forced expiratory volume in 1 second (FEV1), inspiratory capacity (IC), and hyperinflation. These findings support the use of dual bronchodilator therapy in patients with moderate-to-severe COPD.24,25 Orally administered roflumilast further reduced areas of hyperinflation, suggesting its ability to redistribute ventilation, which could enhance concomitant inhaler use.26 FRI parameters also predicted COPD exacerbations using machine learning algorithms in a cohort of 62 patients.27 Eleven baseline FRI parameters, specifically further decreases in airway volumes leading to higher airway resistances in chronically narrowed airways, could predict an impending exacerbation. No other clinical data, notably PFTs, had this predictive power.27 Most recently, Cahn et al28 showed that the phosphoinositide 3-kinase δ (PI3Kδ) inhibitor nemiralisib, combined with standard of care, helped patients recover from exacerbations and led to improved respiratory parameters, including FEV1 and distal-specific imaging airway volume, over a 28-day period and was well tolerated.
Apart from studies of COPD exacerbations, FRI is also being used to assess whether non-invasive ventilation (NIV) has the long-term benefit of improving oxygenation and/or chronic hypercarbia in patients with severe COPD.29 In patients treated with at least 6 months of NIV, mass flow was redistributed to areas of the lung with better perfusion and less emphysema to improve ventilation-perfusion matching and recruit previously occluded small airways. Patients had improved gas exchange, 6-minute walk distance (6MWD), and anxiety.30 These results suggest that patients with SAD may benefit from long-term NIV use. In patients with severe COPD with secondary pulmonary hypertension, inhaled nitric oxide caused pulmonary vasodilation as measured by increases in vessel volume through FRI. While subjective improvements in dyspnea were seen, long-term data is not yet available.31
VIDA Diagnostics
VIDA Diagnostics Inc., founded in 2004 and headquartered in Coralville, IA, has developed the Apollo Pulmonary Evaluation Software, their flagship QCT application. VIDA provides advanced algorithms for airway wall measurements, ventilation maps, and disease probability maps (DPM) obtained from the spatial alignment of paired CT scans at varying inflation levels, and Topographic Multi-Planar Reformat (tMPR) that displays an optimized view of non-overlapping airways in context with surrounding tissue (Figure 2). VIDA, using Apollo, serves as the image analysis core for COPDGene (Genetic Epidemiology of COPD), ECLIPSE (Evaluation of COPD Longitudinally to Identify Predictive Surrogate Endpoints), SPIROMICS (SubPopulations and InteRmediate Outcome Measures in COPD Study), SARP (Severe Asthma Research Group), and the MESA (Multi-Ethnic Study of Atherosclerosis) Lung Study.
 |
Figure 2 Representative clinical report (left) and tMPR (Topographic Multi-Planar Reformat; right) with air trapping map, courtesy of VIDA Diagnostics, Inc. |
In a study of current or former smokers with preserved spirometry who were symptomatic as measured by the COPD Assessment Test (CAT), VIDA software detected submillimeter increases in airway wall thickening compared to asymptomatic current and former smokers.32 Differences in airway anatomy on CT scans from the MESA Lung Study and SPIROMICS were associated with COPD development and subjects with the accessory sub-superior airway, the most common airway branch variant, were at higher risk.33 Those with the second most common variant, absence of the right medial-basal airway, had a familial FGF10 gene inheritance pattern, and were at increased risk of developing COPD, dyspnea, and smaller airway lumens. Central airways collapse greater than 50% of the airway lumen during exhalation, ie, expiratory central airway collapse (ECAC), was associated with worse St. George’s Respiratory Questionnaire (SGRQ) and Medical Research Council Scale (mMRC) scores in smokers with and without COPD in the COPDGene Study.34 Emphysema affects subsegmental airway anatomy and airflow obstruction, likely related to loss of airway tethering,35 and these changes in wall area correlated to the chronic bronchitis phenotype.36 Kirby et al37 quantified degree of fSAD using DPM in the longitudinal Canadian Chronic Obstructive Lung Disease (CanCOLD) study by registering full inspiration and expiration CT images to classify each voxel as emphysematous, gas trapping, or normal. DPM measurements were associated with PFTs, bronchodilator response, and symptoms, particularly dyspnea, as measured by the mMRC.
Kirby’s team has also used VIDA’s airway segmentation tool to evaluate total airway count (TAC), airway inner diameter, and wall area in CT scans from the CanCOLD Study.38 GOLD I and GOLD II subjects had reduced TAC and thinner airway walls with narrower lumens than never smokers and at-risk individuals. Since airway remodeling can be associated with declining lung function, such changes may serve as biomarkers to predict individuals at risk for accelerated disease progression. In two other cohorts –one from SARP and another from SPIROMICS– differences in airway structures of asthma and COPD subjects with post-bronchodilator FEV1 <80% were assessed.39 COPD patients had more severe emphysema, SAD, and reduced tissue fraction and regional lung deformation compared to asthmatics, with greatest differences in upper and middle lobes.
For patients with advanced emphysema undergoing interventional procedures, Apollo was used to evaluate fissure completeness in subjects undergoing bronchoscopic thermal vapor ablation, an alternative to valve placement due to collateral ventilation.40 Apollo showed that a target lobe volume reduction (TLVR) of about 50% would give patients improved quality of life and lung function following endoscopic valve therapy.41 Apollo software revealed QCT characteristics, such as low attenuation cluster (LAC) that reflect the size of the “emphysematous holes,” predictive of subjects who would respond positively to lung volume reduction with coils42 and valves.43 Beyond airway analysis, Apollo was used for vessel segmentation in the MESA study to demonstrate that peripheral total pulmonary vascular volume was greater after long-term black carbon exposure, suggesting air pollution could affect vascular remodeling, and, ultimately, gas exchange.44
Thirona
Thirona, headquartered in Nijmegen, Netherlands, and founded in 2014, develops artificial intelligence software products focusing on thoracic CT imaging. Thirona’s commercial software LungQ is capable of quantifying anatomical volumes, disease distribution, airway and vascular morphology, and fissure completeness.
Early studies using Thirona’s technology included work by Boueiz et al45 that evaluated lobar distribution of emphysema in the COPDGene cohort. They found that subgroups of smokers with upper-lobe predominant emphysema had greater disease progression over a 5-year period, gas trapping, and dyspnea. Thirona’s LungQ segmentation protocol was used in a separate study of COPDGene subjects to approximate the total lung capacity-adjusted lung density at the 15th percentile of predicted (TLC-PD15) as a means of monitoring disease progression.46 In smokers at risk for developing COPD, LungQ showed that lung tissue density increased over 5 years, suggesting ongoing inflammation and airway remodeling. In contrast, end-stage COPD patients (GOLD III or IV) had loss of TLC-PD15 over time, thus displaying a more classic picture of progressive emphysema and tissue destruction. Over the same 5-year period, smokers with and without COPD had increased evidence of emphysema and air trapping, but these radiographic findings accounted for less than half the decline in FEV1 in GOLD stages II–IV.47 The role of inflammation in airway wall thickening was validated by Charbonnier et al,48 who found that, in the COPDGene cohort, higher airway wall thickness (Pi10) was associated with worse lung function, 6MWD, and SGRQ scores in all GOLD stages. Further, subjects who quit smoking had lower Pi10 between their first visit and at 5-year follow-up; in contrast, Pi10 increased in subjects who started smoking, suggesting a reversible component of smoking-related inflammation. Most recently, Bodduluri et al49 confirmed that progressive airway narrowing and remodeling in COPD could be quantified by the CT imaging-derived ratio of airway luminal surface area to volume (SA/V) using Thirona’s airway quantification software. SA/V increased with airway narrowing and decreased with airway loss. Overall, subjects with predominantly airway loss had worse survival, although both changes were associated with increased respiratory morbidity.
In the therapeutic sphere, Thirona’s LungQ software for evaluating fissure completeness was used to identify the TLVR for bronchoscopic lung volume reduction with endobronchial valves, similar to VIDA’s technology. This study found that a minimal difference of –563 mL in a patient provided a clinical benefit.50 Measurements of lobar oxygen uptake also helped identify the least functional, and therefore target lobe for valve placement.51 Patients from the Lung Volume Reduction Coil Treatment in Patients with Emphysema (RENEW) Trial with significant hyperinflation (residual volume >200% predicted) had the best clinical outcomes when QCT analysis was used to identify lobar treatment location and adequate emphysema (>20%) for endobronchial coil treatment.52
Imbio
Imbio, a Minneapolis, US-based medical imaging software company founded in 2012, uses imaging biomarkers to enhance personalized medicine. Imbio’s Lung Density Analysis (LDA) software identifies key functional information from CT scans in COPD patients. The functional LDA image analysis tool maps regions of functionally healthy lung, air trapping, and emphysema. LDA uses parametric response mapping (PRM) to produce a voxel-wise map to pair inspiratory and expiratory CT scans to quantify fSAD (Figure 3). In addition to PRM, LDA includes other QCT metrics such as emphysema scores and lobe volume and density measurements.
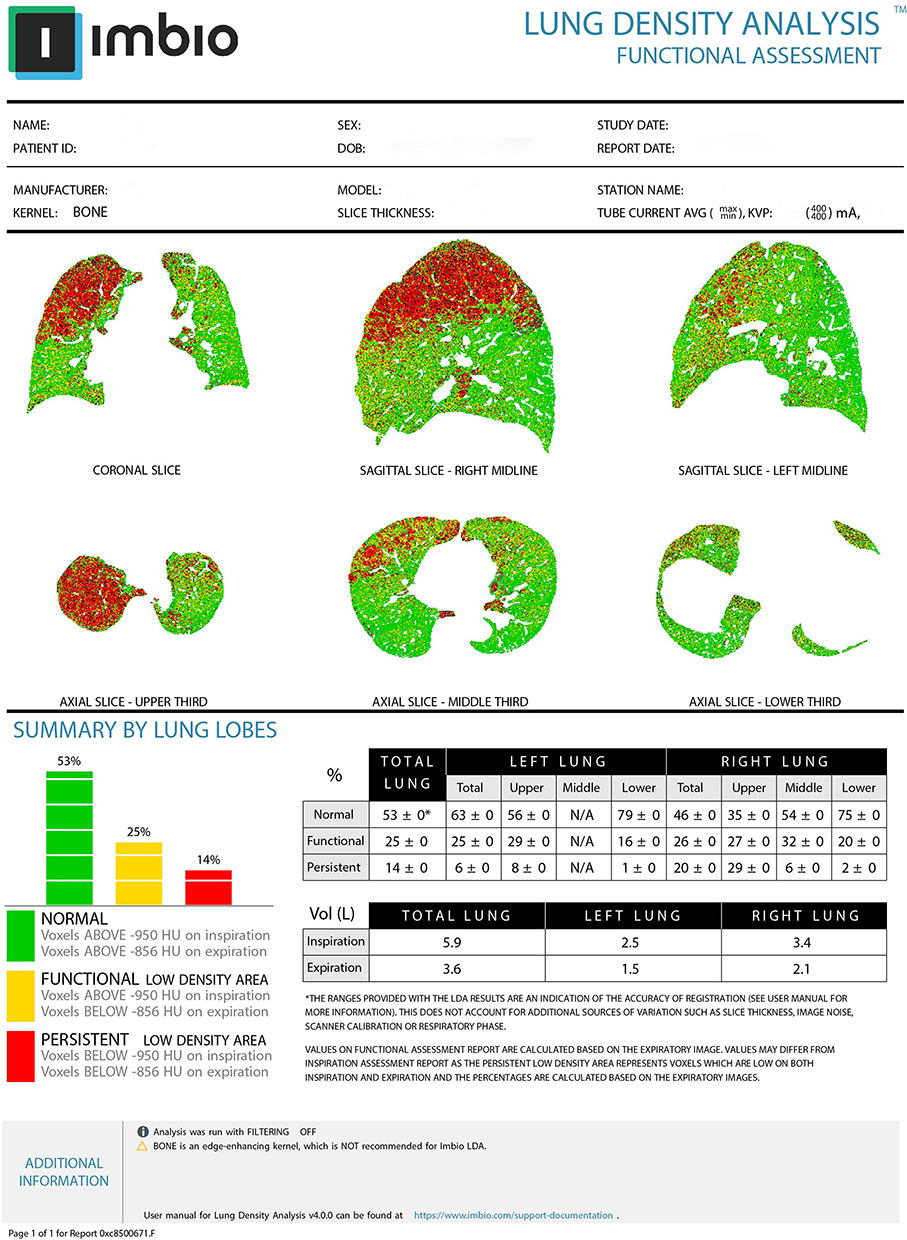 |
Figure 3 Representative clinical report that contains PRM images in all orientations and summary statistics from a COPD patient, courtesy of Imbio. |
Various studies have evaluated the efficacy of PRM as an accurate readout of SAD. These radiographic regions of fSAD pathologically correspond to areas of lung tissue with loss of terminal bronchioles, airway lumen narrowing, and obstruction identified by microscopic examination of resected lung. PRM is the only technique that has been histologically validated to date.13 An early study using PRM (2012), which analyzed data from 194 COPD subjects from COPDGene, showed that this technology can provide regional information on disease activity and, notably, that fSAD often preceded the development of emphysema.11 This association was more evident in subjects in the COPDGene cohort with mild- to moderate-stage COPD, where worsening PRM-derived fSAD (PRMfSAD) was also associated with declining FEV1 and diffusing capacity for carbon monoxide (DLCO).53,54 PRM metrics have been proven to be strongly associated with both the development and severity of COPD when compared to other biomarkers of emphysema, including expiratory-to-inspiratory ratio of mean lung density (MLD), an indirect measure of air trapping, and Perc15 (the Hounsfield Units [HU] where less than 15% of the voxels on an inspiratory CT are found).55
PRM, as part of the LDA platform, was used to analyze CT scans from the SPIROMICS study. In a 3-year follow-up of 1,105 COPD subjects from SPIROMICS, those who suffered from exacerbations during this time had greater small airways abnormalities as defined by PRMfSAD.56 As subjects progressed in their disease courses, emphysema increased as expected; however, this change was associated with a decrease in mean PRMfSAD values, suggesting that fSAD may be a transitional period between normal lung parenchyma and development of irreversible emphysema. fSAD may, therefore, offer a promising indicator for early, directed treatment.57 Of note, aging in and of itself, in both smokers and ever-smokers without airflow obstruction, was found to increase PRMfSAD in an analysis of 580 SPIROMICS subjects.58 This PRM approach was also successfully used in smokers without COPD, where it showed that these metrics can identify unique patterns of progression, and that both PRMfSAD and PRMEMPH, ie, PRM-derived emphysema, can independently predict future development of emphysema.59,60 Bronchiectasis was also found to be associated with increased emphysema in smokers and those with both bronchiectasis and emphysema had lower FEV1 and 6MWD.17 In current or former smokers, the low attenuation area on low-dose CT imaging ordered as part of routine lung cancer screening may be able to detect quantitative emphysema and diagnose subjects with early COPD, allowing clinicians to monitor patients closely and perhaps initiate appropriate treatment when needed.61 These findings suggest that PRM could allow clinicians to further understand the variable disease progression of COPD, resulting in better-tailored treatments.
Coreline
Coreline, based in Seoul, Korea and founded in 2012, has developed the AI-based technology AVIEW COPD. This commercial platform includes quantitative analyses and visualization software that performs automated segmentation to evaluate emphysema, SAD, pulmonary vasculature and airways, and fissure integrity.
At the 2018 annual meeting of the Radiological Society of North America, Coreline presented a voxel-by-voxel segmentation using a 2.5D convolutional neural net and compared it to their gold standard semi-automated algorithm, which uses the airway segmentation module of AVIEW and requires additional processing by research assistants. This AI technology, AVIEW Metric, was found to be practical and reliable when tested on inspiratory CT scans of both healthy subjects and subjects with COPD from the Korean Obstructive Lung Disease (KOLD) study.62 By fully automating various image analysis algorithms, AVIEW Metric segmented all airways in a few minutes and allowed for inspiratory and expiratory lung registration. Researchers have also shown the potential of AVIEW technology for classifying COPD phenotypes. Kwon et al63 assessed how ambient air pollution may predispose subjects to different phenotypes in a study of a Korean cohort of 457 subjects with and without COPD. Using AVIEW software to measure spirometry (FEV1, FVC [forced vital capacity]), degree of emphysema, airway wall thickness, and fSAD, this group evaluated the association of these measurements to the average concentration of environmental particulate matter less than or equal to 10 µm (PM10) in diameter and nitrogen dioxide (NO2). While imaging phenotypes were not associated with NO2, increased exposure to PM10 was associated with lower FVC, increased emphysema, and airway wall thickness. AVIEW software revealed no associations between fSAD and air pollutants. Elsewhere, use of QCT emphysema air-trapping composite (EAtC) maps from AVIEW segmentation software correlated to GOLD staging and lung function, which researchers are studying as a potential biomarker of disease progression.64 Most recently, AVIEW has been used to analyze longitudinal changes over a 6-year period in pulmonary vascular parameters obtained from CT images in 288 COPD patients.65 Degrees of emphysema were classified as five subtypes based on Hounsfield Units and used to assess severity on inspiratory and expiratory scans. Total and small vessel numbers per lung surface area (LSA) were obtained and shown to decrease as COPD progressed. However, these markers had weaker correlations to PFTs. COPD can be distinguished by the emphysema versus bronchitis phenotypes, and these vascular parameters demonstrated that total and small vessel numbers per LSA were higher in the SAD/bronchitis phenotype, confirming that changes in the pulmonary vasculature were more prominent for subjects with predominantly emphysema.
4DMedical
4DMedical, founded in 2012 and based both in Melbourne, Australia and Los Angeles, CA, uses X-ray Velocimetry (XV) Technology to capture simultaneous X-ray images from different acquisition angles to measure the motion of lung tissue at multiple locations during various breath stages. XV then creates colored heat maps of ventilation measurements.66,67 The limited angles from which images are acquired by XV allows for much lower radiation doses than are used for conventional CT scans. XV Lung Ventilation Analysis Software (XV LVAS) is an FDA-approved software that generates reports of areas of high and low ventilation in all phases of breathing.
Reports consist of coronal and axial images rendered in 4-dimensional animation, where red depicts regions of low ventilation, green depicts average ventilation regions, and blue depicts regions of high ventilation (Figure 4). Once the report is generated, it is saved directly onto a hospital’s Picture Archiving and Communication System (PACS). New versions of these reports are actively being developed, and include contrast-free pulmonary angiography, ventilation-perfusion reports, and airway flow and expiratory quantification. Researchers at Johns Hopkins School of Medicine are actively studying XV Technology to validate the clinical benefit of XV LVAS, with the goal of detecting earlier changes in airway function, ventilation defects, and disease progression than clinically available spirometry data and CT images can provide.68 At Vanderbilt University, researchers are comparing the degree of hyperinflation in COPD subjects, as measured by XV image analysis software, to traditional PFTs. This study will also compare lobar expiratory time constraints with fissure completeness measured by StratX software (https://pulmonx.com/stratx/) with the goal of improving the ability to evaluate patient outcomes after endobronchial valve placement (4D Medical X-ray Velocimetry for Bronchoscopic Lung Volume Reduction Targeting, ClinicalTrials.gov ID NCT04786171).
 |
Figure 4 Representative clinical report of lung ventilation with coronal map, histogram showing specific ventilation and quantitation of ventilation heterogeneity, courtesy of 4D Medical. |
Discussion
The commercial platforms reviewed here provide regional functional and anatomic information that enhances our understanding of the heterogeneity of COPD and aids clinicians and researchers in assessing which patients are more likely to experience disease progression and respond to tailored treatments. These novel markers can be harnessed to individualize patient care, moving beyond the widely accepted global metrics obtained from PFTs and patient-reported symptoms. FLUIDDA’s FRI technology highlights key alterations in both airway structure and resistance during COPD exacerbations and with medication use. VIDA’s QCT software Apollo provides similar information by looking at airway remodeling with its airway segmentation tool. Both FLUIDDA and VIDA also explore vessel segmentation. Thirona’s LungQ software has been used to quantify lung volumes and disease distribution, and, more recently, to evaluate fissure completeness, similar to VIDA’s technology. Imbio’s unique capability lies in its PRM maps that can quantify the area of SAD in the lungs to show how these regions evolve with disease progression. Recently, Coreline’s AI-based technology AVIEW COPD has used automated segmentation software to evaluate many of the same key structures, including pulmonary vasculature, fissures, and regions of emphysema and SAD. Lastly, 4DMedical’s XV Technology relies instead on composite X-ray images to create ventilation maps and thereby requires lower radiation doses than the conventional CT scans used by other companies. Of note, this review is based on published literature and online resources, and a full description of each platform and its capabilities would only be attainable through direct contact with the vendor.
Conclusion
The companies discussed in this review have developed a wide array of novel imaging modalities that have already moved the QCT field forward and will allow researchers and clinicians additional insight into the complex disease process of COPD. These imaging biomarkers have demonstrated the ability to predict disease progression earlier and inform the contributions of airway remodeling, air trapping, and emphysema to airflow obstruction and altered pulmonary biomechanics. The geographic distribution of these changes as visualized by automated software has also been validated and could signal accelerated lung function decline not yet captured by global PFT metrics. Such tools also hold the promise of assisting clinicians in advanced bronchoscopic procedures, such as lung volume reduction via coil treatments and endobronchial valves in the appropriate patient population. More importantly, many of the metrics have been correlated to patient symptoms and clinically meaningful outcomes. Even in subjects without airflow obstruction as measured on PFTs, these imaging markers were sensitive to abnormalities that could predict which subgroups were more likely to progress and become symptomatic. This leaves ample opportunity for research focused on key populations, where early intervention and monitoring could change the course of a potentially irreversible disease process with significant life-limiting morbidity and mortality.
Abbreviations
COPD, chronic obstructive pulmonary disease; FRI, functional respiratory imaging; fSAD, functional small airways disease; PFT, pulmonary function testing; PRM, parametric response mapping; QCT, quantitative computed tomography.
Acknowledgments
The authors thank Lee Olsen for assisting with manuscript preparation and editing.
Author Contributions
All authors made a significant contribution to the work reported, whether that is in the conception, study design, execution, acquisition of data, analysis and interpretation, or in all these areas; took part in drafting, revising or critically reviewing the article; gave final approval of the version to be published; have agreed on the journal to which the article has been submitted; and agree to be accountable for all aspects of the work.
Funding
The research for this review was funded by the National Heart, Lung, and Blood Institute/NIH (grants R01HL139690 and R01HL150023).
Disclosure
Dr. Galbán is co-inventor and patent holder of Parametric Response Mapping, which the University of Michigan has licensed to Imbio, LLC, and has a financial interest in Imbio, LLC. Dr. Labaki reports personal fees from Konica Minolta and Continuing Education Alliance. Dr. Han reports personal fees from GlaxoSmithKline, AstraZeneca, Boehringer Ingelheim, Cipla, Chiesi, Novartis, Pulmonx, Teva, Verona, Merck, Mylan, Sanofi, DevPro, Aerogen, Polarian, Regeneron, United Therapeutics, UpToDate, Medscape, and Integrity. She has received either in kind research support or funds paid to the institution from the National Institutes of Health (NIH), Novartis, Sunovion, Nuvaira, Sanofi, AstraZeneca, Boehringer Ingelheim, Gala Therapeutics, Biodesix, the COPD Foundation, and the American Lung Association. She has participated in Data Safety Monitoring Boards for Novartis and Medtronic with funds paid to the institution. She has received stock options from Meissa Vaccines. The authors report no other conflicts of interest in this work.
References
1. Quaderi SA, Hurst JR. The unmet global burden of COPD. Glob Health Epidemiol Genom. 2018;3:e4. doi:10.1017/gheg.2018.1
2. Agusti A, Calverley PM, Celli B, et al. Characterisation of COPD heterogeneity in the ECLIPSE cohort. Respir Res. 2010;11:122. doi:10.1186/1465-9921-11-122
3. Lopez-Campos JL, Tan W, Soriano JB. Global burden of COPD. Respirology. 2016;21(1):14–23. doi:10.1111/resp.12660
4. Lynch DA, Austin JH, Hogg JC, et al. CT-definable subtypes of chronic obstructive pulmonary disease: a statement of the Fleischner Society. Radiology. 2015;277(1):192–205. doi:10.1148/radiol.2015141579
5. Park J, Hobbs BD, Crapo JD, et al. Subtyping COPD by using visual and quantitative CT imaging features. Chest. 2020;157(1):47–60. doi:10.1016/j.chest.2019.06.015
6. Herth FJF, Kirby M, Sieren J, et al. The modern art of reading computed tomography images of the lungs: quantitative CT. Respiration. 2018;95(1):8–17. doi:10.1159/000480435
7. Lynch DA, Newell JD. Quantitative imaging of COPD. J Thorac Imaging. 2009;24(3):189–194. doi:10.1097/RTI.0b013e3181b31cf0
8. Coxson HO, Rogers RM, Whittall KP, et al. A quantification of the lung surface area in emphysema using computed tomography. Am J Respir Crit Care Med. 1999;159(3):851–856. doi:10.1164/ajrccm.159.3.9805067
9. Gevenois PA, De Vuyst P, de Maertelaer V, et al. Comparison of computed density and microscopic morphometry in pulmonary emphysema. Am J Respir Crit Care Med. 1996;154(1):187–192. doi:10.1164/ajrccm.154.1.8680679
10. Matsuoka S, Kurihara Y, Yagihashi K, Hoshino M, Watanabe N, Nakajima Y. Quantitative assessment of air trapping in chronic obstructive pulmonary disease using inspiratory and expiratory volumetric MDCT. AJR Am J Roentgenol. 2008;190(3):762–769. doi:10.2214/AJR.07.2820
11. Galban CJ, Han MK, Boes JL, et al. Computed tomography-based biomarker provides unique signature for diagnosis of COPD phenotypes and disease progression. Nat Med. 2012;18(11):1711–1715. doi:10.1038/nm.2971
12. Bhatt SP, Bodduluri S, Newell JD, et al. CT-derived biomechanical metrics improve agreement between spirometry and emphysema. Acad Radiol. 2016;23(10):1255–1263. doi:10.1016/j.acra.2016.02.002
13. Vasilescu DM, Martinez FJ, Marchetti N, et al. Noninvasive imaging biomarker identifies small airway damage in severe chronic obstructive pulmonary disease. Am J Respir Crit Care Med. 2019;200(5):575–581. doi:10.1164/rccm.201811-2083OC
14. Hammond E, Sloan C, Newell JD
15. Gerard SE, Patton TJ, Christensen GE, Bayouth JE, Reinhardt JM. FissureNet: a deep learning approach for pulmonary fissure detection in CT images. IEEE Trans Med Imaging. 2019;38(1):156–166. doi:10.1109/TMI.2018.2858202
16. Estépar RS, Kinney GL, Black-Shinn JL, et al. Computed tomographic measures of pulmonary vascular morphology in smokers and their clinical implications. Am J Respir Crit Care Med. 2013;188(2):231–239. doi:10.1164/rccm.201301-0162OC
17. Martinez CH, Okajima Y, Yen A, et al. Paired CT measures of emphysema and small airways disease and lung function and exercise capacity in smokers with radiographic bronchiectasis. Acad Radiol. 2021;28(3):370–378. doi:10.1016/j.acra.2020.02.013
18. De Backer JW, Vos WG, Vinchurkar SC, et al. Validation of computational fluid dynamics in CT-based airway models with SPECT/CT. Radiology. 2010;257(3):854–862. doi:10.1148/radiol.10100322
19. van Geffen WH, Hajian B, Vos W, et al. Functional respiratory imaging: heterogeneity of acute exacerbations of COPD. Int J Chron Obstruct Pulmon Dis. 2018;13:1783–1792. doi:10.2147/COPD.S152463
20. Hajian B, De Backer J, Vos W, et al. Changes in ventilation-perfusion during and after an COPD exacerbation: an assessment using fluid dynamic modeling. Int J Chron Obstruct Pulmon Dis. 2018;13:833–842. doi:10.2147/COPD.S153295
21. De Backer LA, Vos WG, Salgado R, et al. Functional imaging using computer methods to compare the effect of salbutamol and ipratropium bromide in patient-specific airway models of COPD. Int J Chron Obstruct Pulmon Dis. 2011;6:637–646. doi:10.2147/COPD.S21917
22. De Backer LA, Vos W, De Backer J, Van Holsbeke C, Vinchurkar S, De Backer W. The acute effect of budesonide/formoterol in COPD: a multi-slice computed tomography and lung function study. Eur Respir J. 2012;40(2):298–305. doi:10.1183/09031936.00072511
23. De Backer J, Vos W, Vinchurkar S, et al. The effects of extrafine beclometasone/formoterol (BDP/F) on lung function, dyspnea, hyperinflation, and airway geometry in COPD patients: novel insight using functional respiratory imaging. J Aerosol Med Pulm Drug Deliv. 2015;28(2):88–99. doi:10.1089/jamp.2013.1064
24. De Backer W, De Backer J, Verlinden I, et al. Functional respiratory imaging assessment of glycopyrrolate and formoterol fumarate metered dose inhalers formulated using co-suspension delivery technology in patients with COPD. Ther Adv Respir Dis. 2020;14:1753466620916990. doi:10.1177/1753466620916990
25. De Backer W, De Backer J, Vos W, et al. A randomized study using functional respiratory imaging to characterize bronchodilator effects of glycopyrrolate/formoterol fumarate delivered by a metered dose inhaler using co-suspension delivery technology in patients with COPD. Int J Chron Obstruct Pulmon Dis. 2018;13:2673–2684. doi:10.2147/COPD.S171707
26. Vos W, Hajian B, De Backer J, et al. Functional respiratory imaging to assess the interaction between systemic roflumilast and inhaled ICS/LABA/LAMA. Int J Chron Obstruct Pulmon Dis. 2016;11:263–271. doi:10.2147/COPD.S93830
27. Lanclus M, Clukers J, Van Holsbeke C, et al. Machine learning algorithms utilizing functional respiratory imaging may predict COPD exacerbations. Acad Radiol. 2019;26(9):1191–1199. doi:10.1016/j.acra.2018.10.022
28. Cahn A, Hamblin JN, Robertson J, et al. An inhaled PI3Kdelta inhibitor improves recovery in acutely exacerbating COPD patients: a randomized trial. Int J Chron Obstruct Pulmon Dis. 2021;16:1607–1619. doi:10.2147/COPD.S309129
29. De Backer L, Vos W, Dieriks B, et al. The effects of long-term noninvasive ventilation in hypercapnic COPD patients: a randomized controlled pilot study. Int J Chron Obstruct Pulmon Dis. 2011;6:615–624. doi:10.2147/COPD.S22823
30. Hajian B, De Backer J, Sneyers C, et al. Pathophysiological mechanism of long-term noninvasive ventilation in stable hypercapnic patients with COPD using functional respiratory imaging. Int J Chron Obstruct Pulmon Dis. 2017;12:2197–2205. doi:10.2147/COPD.S136412
31. Hajian B, De Backer J, Vos W, et al. Pulmonary vascular effects of pulsed inhaled nitric oxide in COPD patients with pulmonary hypertension. Int J Chron Obstruct Pulmon Dis. 2016;11:1533–1541. doi:10.2147/COPD.S106480
32. Woodruff PG, Barr RG, Bleecker E, et al. Clinical significance of symptoms in smokers with preserved pulmonary function. N Engl J Med. 2016;374(19):1811–1821. doi:10.1056/NEJMoa1505971
33. Smith BM, Traboulsi H, Austin JHM, et al. Human airway branch variation and chronic obstructive pulmonary disease. Proc Natl Acad Sci USA. 2018;115(5):E974–E981. doi:10.1073/pnas.1715564115
34. Bhatt SP, Terry NL, Nath H, et al. Association between expiratory central airway collapse and respiratory outcomes among smokers. JAMA. 2016;315(5):498–505. doi:10.1001/jama.2015.19431
35. Diaz AA, Han MK, Come CE, et al. Effect of emphysema on CT scan measures of airway dimensions in smokers. Chest. 2013;143(3):687–693. doi:10.1378/chest.12-0039
36. Kim V, Davey A, Comellas AP, et al. Clinical and computed tomographic predictors of chronic bronchitis in COPD: a cross sectional analysis of the COPDGene study. Respir Res. 2014;15:52. doi:10.1186/1465-9921-15-52
37. Kirby M, Yin Y, Tschirren J, et al. A novel method of estimating small airway disease using inspiratory-to-expiratory computed tomography. Respiration. 2017;94(4):336–345. doi:10.1159/000478865
38. Kirby M, Tanabe N, Tan WC, et al. Total airway count on computed tomography and the risk of chronic obstructive pulmonary disease progression. Findings from a population-based study. Am J Respir Crit Care Med. 2018;197(1):56–65. doi:10.1164/rccm.201704-0692OC
39. Choi S, Haghighi B, Choi J, et al. Differentiation of quantitative CT imaging phenotypes in asthma versus COPD. BMJ Open Respir Res. 2017;4(1):e000252. doi:10.1136/bmjresp-2017-000252
40. Gompelmann D, Eberhardt R, Schuhmann M, et al. Lung volume reduction with vapor ablation in the presence of incomplete fissures: 12-month results from the STEP-UP Randomized Controlled Study. Respiration. 2016;92(6):397–403. doi:10.1159/000452424
41. Gompelmann D, Kontogianni K, Schuhmann M, Eberhardt R, Heussel CP, Herth FJ. The minimal important difference for target lobe volume reduction after endoscopic valve therapy. Int J Chron Obstruct Pulmon Dis. 2018;13:465–472. doi:10.2147/COPD.S152029
42. Kontogianni K, Russell K, Eberhardt R, et al. Clinical and quantitative computed tomography predictors of response to endobronchial lung volume reduction therapy using coils. Int J Chronic Obstr. 2018;13:2215–2223. doi:10.2147/Copd.S159355
43. Schuhmann M, Raffy P, Yin Y, et al. Computed tomography predictors of response to endobronchial valve lung reduction treatment. Comparison with chartis. Am J Respir Crit Care Med. 2015;191(7):767–774. doi:10.1164/rccm.201407-1205OC
44. Aaron CP, Hoffman EA, Kawut SM, et al. Ambient air pollution and pulmonary vascular volume on computed tomography: the MESA air pollution and lung cohort studies. Eur Respir J. 2019;53(6):1802116. doi:10.1183/13993003.02116-2018
45. Boueiz A, Chang Y, Cho MH, et al. Lobar emphysema distribution is associated with 5-year radiological disease progression. Chest. 2018;153(1):65–76. doi:10.1016/j.chest.2017.09.022
46. Diaz AA, Strand M, Coxson HO, et al. Disease severity dependence of the longitudinal association between CT lung density and lung function in smokers. Chest. 2018;153(3):638–645. doi:10.1016/j.chest.2017.10.012
47. Pompe E, Strand M, van Rikxoort EM, et al. Five-year progression of emphysema and air trapping at CT in smokers with and those without chronic obstructive pulmonary disease: results from the COPDGene Study. Radiology. 2020;295(1):218–226. doi:10.1148/radiol.2020191429
48. Charbonnier JP, Pompe E, Moore C, et al. Airway wall thickening on CT: relation to smoking status and severity of COPD. Respir Med. 2019;146:36–41. doi:10.1016/j.rmed.2018.11.014
49. Bodduluri S, Kizhakke Puliyakote A, Nakhmani A, Charbonnier JP, Reinhardt JM, Bhatt SP. Computed tomography-based airway surface area-to-volume ratio for phenotyping airway remodeling in chronic obstructive pulmonary disease. Am J Respir Crit Care Med. 2021;203(2):185–191. doi:10.1164/rccm.202004-0951OC
50. Welling JBA, Hartman JE, van Rikxoort EM, et al. Minimal important difference of target lobar volume reduction after endobronchial valve treatment for emphysema. Respirology. 2018;23(3):306–310. doi:10.1111/resp.13178
51. Welling JBA, Klooster K, Charbonnier JP, et al. A new oxygen uptake measurement supporting target selection for endobronchial valve treatment. Respiration. 2019;98(6):521–526. doi:10.1159/000502310
52. Slebos DJ, Cicenia J, Sciurba FC, et al. Predictors of response to endobronchial coil therapy in patients with advanced emphysema. Chest. 2019;155(5):928–937. doi:10.1016/j.chest.2019.02.012
53. Bhatt SP, Soler X, Wang X, et al. Association between functional small airway disease and FEV1 decline in chronic obstructive pulmonary disease. Am J Respir Crit Care Med. 2016;194(2):178–184. doi:10.1164/rccm.201511-2219OC
54. Criner RN, Hatt CR, Galban CJ, et al. Relationship between diffusion capacity and small airway abnormality in COPDGene. Respir Res. 2019;20(1):269. doi:10.1186/s12931-019-1237-1
55. Pompe E, Galban CJ, Ross BD, et al. Parametric response mapping on chest computed tomography associates with clinical and functional parameters in chronic obstructive pulmonary disease. Respir Med. 2017;123:48–55. doi:10.1016/j.rmed.2016.11.021
56. Han MK, Quibrera PM, Carretta EE, et al. Frequency of exacerbations in patients with chronic obstructive pulmonary disease: an analysis of the SPIROMICS cohort. Lancet Respir Med. 2017;5(8):619–626. doi:10.1016/S2213-2600(17)30207-2
57. Boes JL, Hoff BA, Bule M, et al. Parametric response mapping monitors temporal changes on lung CT scans in the subpopulations and intermediate outcome measures in COPD Study (SPIROMICS). Acad Radiol. 2015;22(2):186–194. doi:10.1016/j.acra.2014.08.015
58. Martinez CH, Diaz AA, Meldrum C, et al. Age and small airway imaging abnormalities in subjects with and without airflow obstruction in SPIROMICS. Am J Respir Crit Care Med. 2017;195(4):464–472. doi:10.1164/rccm.201604-0871OC
59. Labaki WW, Gu T, Murray S, et al. Reprint of: voxel-wise longitudinal parametric response mapping analysis of chest computed tomography in smokers. Acad Radiol. 2019;26(3):306–312. doi:10.1016/j.acra.2019.02.003
60. Pompe E, Moore CM, Mohamed Hoesein FAA, et al. Progression of emphysema and small airways disease in cigarette smokers. Chronic Obstr Pulm Dis. 2021;8(2):198–212. doi:10.15326/jcopdf.2020.0140
61. Labaki WW, Xia M, Murray S, et al. Quantitative emphysema on low-dose CT imaging of the chest and risk of lung cancer and airflow obstruction: an analysis of the national lung screening trial. Chest. 2021;159(5):1812–1820. doi:10.1016/j.chest.2020.12.004
62. Yun J, Park J, Yu D, et al. Improvement of fully automated airway segmentation on volumetric computed tomographic images using a 2.5 dimensional convolutional neural net. Med Image Anal. 2019;51:13–20. doi:10.1016/j.media.2018.10.006
63. Kwon SO, Hong SH, Han YJ, et al. Long-term exposure to PM10 and NO2 in relation to lung function and imaging phenotypes in a COPD cohort. Respir Res. 2020;21(1):247. doi:10.1186/s12931-020-01514-w
64. Hwang HJ, Seo JB, Lee SM, et al. New method for combined quantitative assessment of air-trapping and emphysema on chest computed tomography in chronic obstructive pulmonary disease: comparison with parametric response mapping. Korean J Radiol. 2021;22(10):1719–1729. doi:10.3348/kjr.2021.0033
65. Park SW, Lim M-N, Kim WJ, Bak SH. Quantitative assessment the longitudinal changes of pulmonary vascular counts in chronic obstructive pulmonary disease. Res Square. 2021;23:1.
66. Dubsky S, Hooper SB, Siu KK, Fouras A. Synchrotron-based dynamic computed tomography of tissue motion for regional lung function measurement. J R Soc Interface. 2012;9(74):2213–2224. doi:10.1098/rsif.2012.0116
67. Fouras A, Allison BJ, Kitchen MJ, et al. Altered lung motion is a sensitive indicator of regional lung disease. Ann Biomed Eng. 2012;40(5):1160–1169. doi:10.1007/s10439-011-0493-0
68. 4DMedical. 4DMedical commences clinical trial studying XV LVAS at Johns Hopkins school of medicine; [updated June 29, 2021]. Available from: https://company-announcements.afr.com/asx/4dx/5329e76d-d85f-11eb-8781-565d0a66e208.pdf.
 © 2022 The Author(s). This work is published and licensed by Dove Medical Press Limited. The
full terms of this license are available at https://www.dovepress.com/terms
and incorporate the Creative Commons Attribution
- Non Commercial (unported, 3.0) License.
By accessing the work you hereby accept the Terms. Non-commercial uses of the work are permitted
without any further permission from Dove Medical Press Limited, provided the work is properly
attributed. For permission for commercial use of this work, please see paragraphs 4.2 and 5 of our Terms.
© 2022 The Author(s). This work is published and licensed by Dove Medical Press Limited. The
full terms of this license are available at https://www.dovepress.com/terms
and incorporate the Creative Commons Attribution
- Non Commercial (unported, 3.0) License.
By accessing the work you hereby accept the Terms. Non-commercial uses of the work are permitted
without any further permission from Dove Medical Press Limited, provided the work is properly
attributed. For permission for commercial use of this work, please see paragraphs 4.2 and 5 of our Terms.