")
Back to Journals » Cancer Management and Research » Volume 12
CREB1 Suppresses Transcription of microRNA-186 to Promote Growth, Invasion and Epithelial–Mesenchymal Transition of Gastric Cancer Cells Through the KRT8/HIF-1α Axis
Authors Huang X, Liu F, Jiang Z, Guan H, Jia Q
Received 29 May 2020
Accepted for publication 12 August 2020
Published 25 September 2020 Volume 2020:12 Pages 9097—9111
DOI https://doi.org/10.2147/CMAR.S265187
Checked for plagiarism Yes
Review by Single anonymous peer review
Peer reviewer comments 2
Editor who approved publication: Dr Sanjeev K. Srivastava
Xue Huang, Fujian Liu, Zhiyong Jiang, Hang Guan, Qiuhong Jia
Department of Gastroenterology, The Eighth Affiliated Hospital of Guangxi Medical University, Guigang 537100, Guangxi, People’s Republic of China
Correspondence: Qiuhong Jia
Department of Gastroenterology, The Eighth Affiliated Hospital of Guangxi Medical University, No. 1, Zhongshan Middle Road, Gangbei District, Guigang 537100, Guangxi, People’s Republic of China
Tel/Fax +86-775-4200168
Email [email protected]
Background: The cAMP response element-binding protein 1 (CREB1) was initiated as a potential target for cancer treatment. This research was conducted to probe the effect of CREB1 in the progression of gastric cancer (GC) and the molecules involved.
Materials and Methods: CREB1 expression in GC tissues and cell lines (AGS and MKN-45) as well as that in normal tissues and in gastric mucosa cell line (GES-1) was detected. The correlation between CREB1 expression and prognosis of GC patients was determined. Artificial silencing of CREB1 was introduced to evaluate its effect on biological behaviors of GC cells. The target microRNA (miRNA) of CREB1 and the target mRNA of miR-186 were predicted and validated. Altered expression of miR-186, KRT8 and HIF-1α was introduced to confirm their functions in GC progression.
Results: CREB1 was abundantly expressed in GC tissues and cells and linked to dismal prognosis in patients. Silencing of CREB1 or upregulation of miR-186 suppressed the malignant behaviors such as growth, epithelial–mesenchymal transition (EMT) and invasion of GC cells, while artificial overexpression of KRT8 led to reversed trends. KRT8 was a target mRNA of miR-186, and CREB1 transcriptionally suppressed miR-186 expression to further up-regulate KRT8. KRT8 was also found to increase HIF-1α expression. Upregulation of HIF-1α was found to block the suppressing role of CREB1 silencing in GC cell malignancy.
Conclusion: This study evidenced that silencing of CREB1 inhibits growth, invasion, EMT and resistance to apoptosis of GC cells involving the upregulation of miR-186 and the following downregulation of KRT8 and HIF-1α.
Keywords: CREB1, transcription suppression, microRNA-186, KRT-8, HIF-1α, gastric cancer
Introduction
Gastric Cancer (GC) is 5th most prevailing neoplastic disease and the 3rd leading contributor to cancer-related death in both males and females, accounting for over 1 million new incidences and almost 800,000 deaths in 2018.1 The development of targeted therapies and the improvements of already existing chemotherapies have expanded the therapeutic options for GC, granting better survival expectations to the patients.2 However, this seems to be better applied in early-diagnosed patients. Distant metastasis is the most fatal characteristics of advanced cancer, which accounted for over 90% of tumor-related death, and there is no exception for GC patients.3 For advanced patients with metastatic potential, the long-term survival rate is still poor with approximately 5.2% patients surviving 5 years or longer, though the palliative systemic chemotherapeutic regimens prolong the survival to a median 7.5–12.3 months.4 Unfortunately, approximately a half of patients are found with metastasis at the first time of diagnosis.5 Thus, early detection is the most important issue in GC control. In addition to this, finding effective ways to suppress malignancy potentials, including proliferation and epithelial–mesenchymal transition (EMT) that trigger further invasion and metastasis of cells, is of great significance as well.
Advances in genome sequencing technologies have enabled a revolutionary scale of transcript discovery. One of the transcription factors, cAMP response element-binding protein 1 (CREB1) was initiated as a potential target for cancer control.6 CREB is activated through phosphorylation mostly at Ser133 that is frequently found overexpressed in human tumors, and phosphorylated CREB binds to CREB-binding protein to trigger CREB-dependent gene transcription.7 The oncogenic function of CREB1 has been noticed in GC, with its knockdown led to declines in the growth of human GC cell line SGC-7901 in vivo and in vitro.8 This prompted us to validate its correlation with GC progression in patients and to inquire into the further molecules. Importantly, as a transcription factor, CREB1 is capable of regulating a number of microRNAs (miRNAs) transcriptionally.9 MiRNAs represent a large class of non-coding RNAs that primarily negatively regulate the target genes, thereby governing an extensive array of cellular processes and involving in the initiation and pathogenesis of cancers.10 miR-186, whose aberrant expression was suggested to be linked to the progression of many human cancers,11 was confirmed as a target transcript of CREB1 in this present study. We then speculated that regulation of miR-186 is possibly involved in GC progression influenced by CREB1. In addition, keratin 8 (KRT8) was confirmed as a target mRNA of miR-186 in this paper. This gene has been noted to promote metastasis of cancer-associated fibroblasts, thus serving as a promising therapeutic candidate for metastasis control and treatment.12 In addition, regional tumor hypoxia is a typical inhospitable condition within the tumor microenvironment in most solid malignancies. Hypoxia-inducible factor-1α (HIF-1α), a master regulator participating in response to hypoxia, might be capable of mediating various steps of cancer progression from cell survival to invasion and metastasis.13,14 This is also true for GC, since HIF-1α has been documented to be highly expressed in GC patients and associated with unfavorable prognosis in GC patients.15 In light of the above evidence, we hypothesized that CREB1 promotes GC progression and leads to worse prognosis in patients via transcriptionally suppressing miR-186 and following inducing KRT8 expression. Clinical samples from GC patients and purchased GC cell lines were used in this research to validate this hypothesis, and to explore if aberrant activation of HIF-1α is involved in the GC events.
Materials and Methods
Ethical Approval
The research was ratified by the Ethics Committee of the Eighth Affiliated Hospital of Guangxi Medical University (Approval No. 2011 (KY-E-021)) and performed in accordance with the Helsinki declaration. Written informed consents were acquired from the enrolled participants.
Clinical Sample Collection
A total of 100 pairs of fresh GC tissue and the adjacent normal mucosal tissues were obtained from patients who were admitted into the Eighth Affiliated Hospital of Guangxi Medical University from January 2012 to January 2014. Patients were included if 1) they were over 20 years old, 2) they were pathologically diagnosed as GC; 3) they have complete clinical data. In addition, those who underwent chemo or radiotherapy, or had a history or other malignancies were excluded. A 5-year follow-up study was carried out to investigate the prognosis and recurrence of all included patients.
Cell Culture
Human normal gastric cell line GES-1 (CL-0563, Procell Life Science & Technology Co., Ltd) and GC cell line AGS (CRL-1739, ATCC, Manassas, VA, USA) and MKN-45 (CL-0292, Procell) were applied for in vitro experiments. Cells were cultured in Roswell Park Memorial Institute (RPMI)-1640 containing 10% fetal bovine serum (FBS, Gibco, NY, USA) and 1% penicillin-streptomycin (Beyotime Biotechnology) at 37°C with 5% CO2 in a humidified atmosphere. The cells were negative for mycoplasma contamination according to the short tandem repeat profiling by Genetic Testing Biotechnology Corporation (Suzhou, China).
Cell Transfection
GC cells were sorted in 6-well plates 24 hours before transfection. miR-186 mimic, the corresponding mimic negative control (NC), small interfering (si)-RNA targeting CREB1 (siRNA-CREB1) and the siRNA-NC were synthesized by GenePharma Co., Ltd. (Shanghai, China), while the pcDNA-CREB1, pcDNA-KRT8 and pcDNA HIF-1α and the empty vector pcDNA 3.1 were constructed by ZonHon Biopharma Institute, Inc. (Jiangsu, China). All transfection was performed using the LipofectamineTM 2000 (Invitrogen Inc., Carlsbad, CA, USA)
Reverse Transcription Quantitative Polymerase Chain Reaction (RT-qPCR)
Total RNA was extracted using TRIzol Reagent (Invitrogen). The cDNA was synthesized using a Reverse Transcription Kit (Invitrogen). Next, real-time qPCR was conducted using a FastStart Universal SYBR Green Master (Life Technologies, Gaithersburg, MD, USA) and an ABI 7500 Fast Real-Time PCR system in light with the instructions. U6 was set as the reference for miRNA and glyceraldehyde-3-phosphate dehydrogenase (GAPDH) for mRNA. Relative RNA expression was determined using the 2−ΔΔCt method. The sequences are exhibited in Table 1. Three independent experiments were performed.
 |
Table 1 Primer Sequences in RT-qPCR |
Colony Formation Assay
The cells were sorted on 6-well plates at 1000 cells per well with three duplicated wells set for 14 days of colony formation. Thereafter, the formed colonies were fixed in 4% paraformaldehyde for 10 minutes and stained with 0.5% crystal violet. The colonies with over 50 cells were included.
Cell Counting Kit-8 (CCK-8) Method
The viability of cells was measured using a CCK-8 system (Dojindo, Japan) in compliance with the manufacturer’s protocol. The cells were sorted in 96-well plates (1 × 10⁴ cells per well). Cells were incubated at 37°C in the dark, and 10 μL CCK-8 solution was filled into the wells at 24, 48 and 72 hours for 4 more hours of incubation. Then, the light absorbance of each well was evaluated at 560 nm using a microplate reader (Tecan, Switzerland).
5-ethynyl-2ʹ-deoxyuridine (EdU) Labeling Assay
An EdU Assay Kit (RiboBio Co., Ltd, Guangzhou, Guangdong, China) was used to evaluate cell proliferation. GC cells were sorted in 96-well plates at a density of 2 ×10⁴ cells per well. Following 24 hours of culture, cells were labeled with 50 µM EdU at 37°C for 2 hours. After that, cells were fixed for 10 minutes, permeabilized by 0.5% Triton X-100 at 20°C for 20 minutes, washed by PBS, and then treated with 100 μL ApolloR reaction cocktail for 30 minutes. Hoechst 33,342 (5 μg/mL) was used for 30 minutes of nuclear staining. Thereafter, the cells were observed and photographed using the microscope (IX71, Olympus Optical Co., Ltd, Tokyo, Japan).
Transwell Assay for Cell Invasion
A 24-well Transwell plate was used for invasion assay. In brief, the apical chambers were precoated with 200 mg/mL Matrigel (BD Biosciences, Boston, MA, USA) and filled with 200 μL serum-free medium with 1 × 10⁵ cells, while the basolateral chambers were loaded with 600 μL 10% FBS supplemented-RPMI-1640. After 24 hours of normal incubation, the cells in the inner membrane in apical chambers were removed using a cotton swab, while the cells invaded through membranes were collected, fixed and stained by 0.05% crystal violet. Thereafter, the cells were imaged under the IX71 microscope with five random fields included.
Western Blot Analysis
Total protein from cells was collected using the Radio-Immunoprecipitation assay cell lysis buffer (Solarbio Science & Technology Co., Ltd., Beijing, China) with proteinase K inhibitor. After concentration detection using a BCA kit (Thermo Fisher Scientific Inc., Waltham, MA, USA), the protein was separated on 10% SDS-PAGE and transferred on PVDF membranes (EMD Millipore, Billerica, MA, USA). Then, the membranes were blocked by 5% non-fat milk. Next, the membranes were co-incubated with primary antibodies against E-cadherin (1:25,000, ab40772, Abcam Inc., Cambridge, MA, USA), N-cadherin (1:1000, ab76057, Abcam), vimentin (1:1000, #5741, Cell signaling technology), GAPDH (1:1000, #5174, Cell signaling technology) at 4°C overnight. The next day, the membranes were incubated with secondary goat anti-rabbit antibody immunoglobulin G (IgG) H&L (HRP) (1:10,000, ab6721, Abcam).
Flow Cytometry for Cell Cycle Analysis
Cells were fixed in 70% ethanol at −30°C for 24 hours and then stained with 5 mg/mL propidium iodide (PI, KeyGen, Nanjing, China). Cell cycle was determined using a FACSCalibur flow cytometer (BD Biosciences). Experimental data were analyzed using FlowJo (TreeStar, Ashland, OR, USA) and ModFit (BD Biosciences).
Caspase-3 Activity Assay
A caspase-3 activity reagent (Beyotime Institute of Biotechnology, China) was applied. Total protein from AGS and MKN-45 cells was diluted and mixed in caspase-3 substrate for 3 hours according to the manufacturer’s protocol. Next, the hydrolyzed Ac-DEVD-ρNA and free ρNA secreted by caspase-3 was measured at 405 nm.
Hoechst 33,258 Staining
Hoechst 33,258 (MedChemExpress Co., Ltd., New Jersey, USA) was used for apoptosis detection. In brief, after transfection, cells were fixed in paraformaldehyde, washed by phosphate buffered saline (PBS), and stained by Hoechst 33,258 at room temperature (20°C) in the dark for 30 minutes. The staining was observed under a fluorescence microscope (Leica, Solms, Germany) with five random fields included.
Luciferase Reporter Gene Assay
The 293T cell line (CRL-11,268, ATCC) was cultured in 24-well plates for further use. Binding site between CREB1 and the promoter region of miR-186 was predicted on JASPAR (http://jaspar.genereg.net/). The binding site sequence was amplified and cloned to pGL3 vector (Promega, Madison, WI, USA). In addition, the binding site between miR-186 and KRT8 was predicted on Starbase (http://starbase.sysu.edu.cn/). The cDNA fragment containing the putative binding site of miR-186 was amplified and inserted into pGL3. The KRT8-wild type (KRT8-WT) and the corresponding KRT8-mutant type (KRT8-MT) vectors were constructed. Well-constructed vectors were co-transfected with the transfection plasmids into 293T cells using the LipofectamineTM 2000. Forty-eight hours later, the luciferase activity was measured on a dual-luciferase reporter gene system (Promega, Madison, WI).
Flow Cytometry for Apoptosis Detection
An Annexin V-fluorescein isothiocyanate (FITC)/PI kit (BestBio, Shanghai, China) was applied to determined cell apoptosis. Cells were sorted in 6-well plates at 1 × 10⁵ cells per well. Forty-eight hours post-transfection, cells were detached in trypsin and resuspended in 1 × binding buffer to 1 × 10⁵ cells/mL. Next, 5 μL FITC Annexin-V and 5 μL PI was loaded in 100 μL suspension and incubated without light exposure for 15 minutes. After incubation, the samples were further loaded with 400 μL 1 × binding buffer. Apoptosis of cells was determined using the Cell-Quest software (BD Biosciences).
Chromatin Immunoprecipitation (ChIP) Assay
A ChIP kit (EZ-Magna, EMD, Millipore) was utilized to validate the binding relationship between CREB1 and the promoter region of miR-186. Briefly, AGS and MKN-45 cell lines were cross-linked in 1% methanol for 10 minutes and quenched by glycine. The DNA fragments were obtained by ultrasonication. DNA immunoprecipitated by anti-CREB1 or anti-IgG was analyzed by qPCR. The primer sequence used was: Forward: 5ʹ-AGGCACGGCCCATAC-3ʹ and Reverse: 5ʹ-TGCAGCTGCACACCT-3ʹ.
Immunohistochemical Staining
The collected tissue samples were fixed, embedded in paraffin and cut into 4-μm thick sections. Next, the sections were dewaxed, rehydrated and treated with 0.3% H2O2 to diminish the activity of peroxidase. After antigen epitope recovery, the sections were blocked with 10% goat serum and then incubated with anti-HIF-1α (1:100, ab51608, Abcam) overnight at 4°C and then with biotin-labeled IgG (1:1000, ab6721, Abcam) at 37°C for 2 hours. Next, the samples were stained with 3,3ʹ-diaminobenzidine and observed under the optical microscope at a × 400 magnification.
Statistical Analysis
Data were analyzed using the SPSS 22.0 System (IBM Corp. Armonk, NY, USA). Measurement data were collected from at least three experiments and exhibited as mean ± standard deviation (SD). Differences were compared using the t-test (two groups) and one-way or two-way analysis of variance (ANOVA) followed with Tukey’s multiple comparisons (three or more groups). The survival rate of patients was analyzed using the Kaplan–Meier method. p < 0.05 was regarded to show a significant difference.
Results
CREB1 is Abundant and Linked to Dismal Prognosis in GC Patients
According to data in GEPIA (http://gepia.cancer-pku.cn/), CREB1 was suggested to be highly expressed in GC (Figure 1A). Here, a total of 100 pairs or GC and adjacent normal patients were collected for RT-qPCR. The results suggested that CREB1 expression was higher in GC tissues than that in the normal tissues (Figure 1B). In addition, increased CREB1 expression was found in GC patients with recurrence (n = 48) as compared to those without (n = 52) (Figure 1C). The recurrence of GC in patients was confirmed by the appearance of recurrent lesions diagnosed by imaging examination including thoracoabdominal Computed Tomography, ultrasonic examination and positron emission tomography, along with pathological examination. According to the average value (4.766), the patients were allocated into CREB1 high-expression group (n = 47) and low-expression group (n = 53). The 5-year follow-up study suggested that patients with lower CREB1 expression had higher survival rates (Figure 1D). The clinicopathological characteristics of GC patients are presented in Table 2, and it was found that CREB1 is an independent risk factor for tumor size, tumor differentiation and invasion. High expression of CREB1 was found to be closely linked to poor prognosis in patients.
 |
Table 2 Correlation Between CREB1 Expression and Clinicopathological Characteristics of Gastric Cancer |
 |
Figure 1 CREB1 is abundant and linked to dismal prognosis in GC patients. (A) CREB1 expression profile in GC predicted on GEPIA (http://gepia.cancer-pku.cn/); (B) CREB1 expression in GC tissues and the adjacent normal tissues determined by RT-qPCR (paired t-test, n=100, ***p < 0.001); (C) CREB1 expression in GC patients with (n = 48) and without (n = 52) recurrence detected by RT-qPCR (unpaired t-test, **p < 0.01); (D) overall survival in patients with high (n = 47) and low (n = 53) expression of CREB1 detected by RT-qPCR (Kaplan-Meier method, **p < 0.01). |
Silencing of CREB1 Impedes Malignant Behaviors of GC Cells
RT-qPCR further identified high-expression profile of CREB1 expression in GC cell lines (AGS and MKN-45) as relative to that in the normal human gastric mucosa cell line (GES-1) (Figure 2A). Next, siRNA-CREB1 was transfected into GC cell lines (Figure 2B) to evaluate the influence of CREB1 silencing on GC cells. Thereafter, the CCK-8 and colony formation assays suggested that siRNA-CREB1 inhibited proliferation of GC cells (Figure 2C and D), and the Transwell assay results found the invasion ability of cells was decreased following CREB1 silencing (Figure 2E). Expression of EMT-related biomarkers in cells was measured, and the results presented that si-CREB1 led to an increase in E-cadherin expression while declines in N-cadherin and vimentin expression (Figure 2F). The flow cytometry results identified an increase in cell cycle arrest in the G0/G1 phases (Figure 2G). In addition, according to the caspase-3 activity kit results, it was found the caspase-3 expression in cells was increased after si-CREB1 transfection (Figure 2H). Accordingly, the Hoechst staining results presented that the cell apoptosis was increased (Figure 2I).
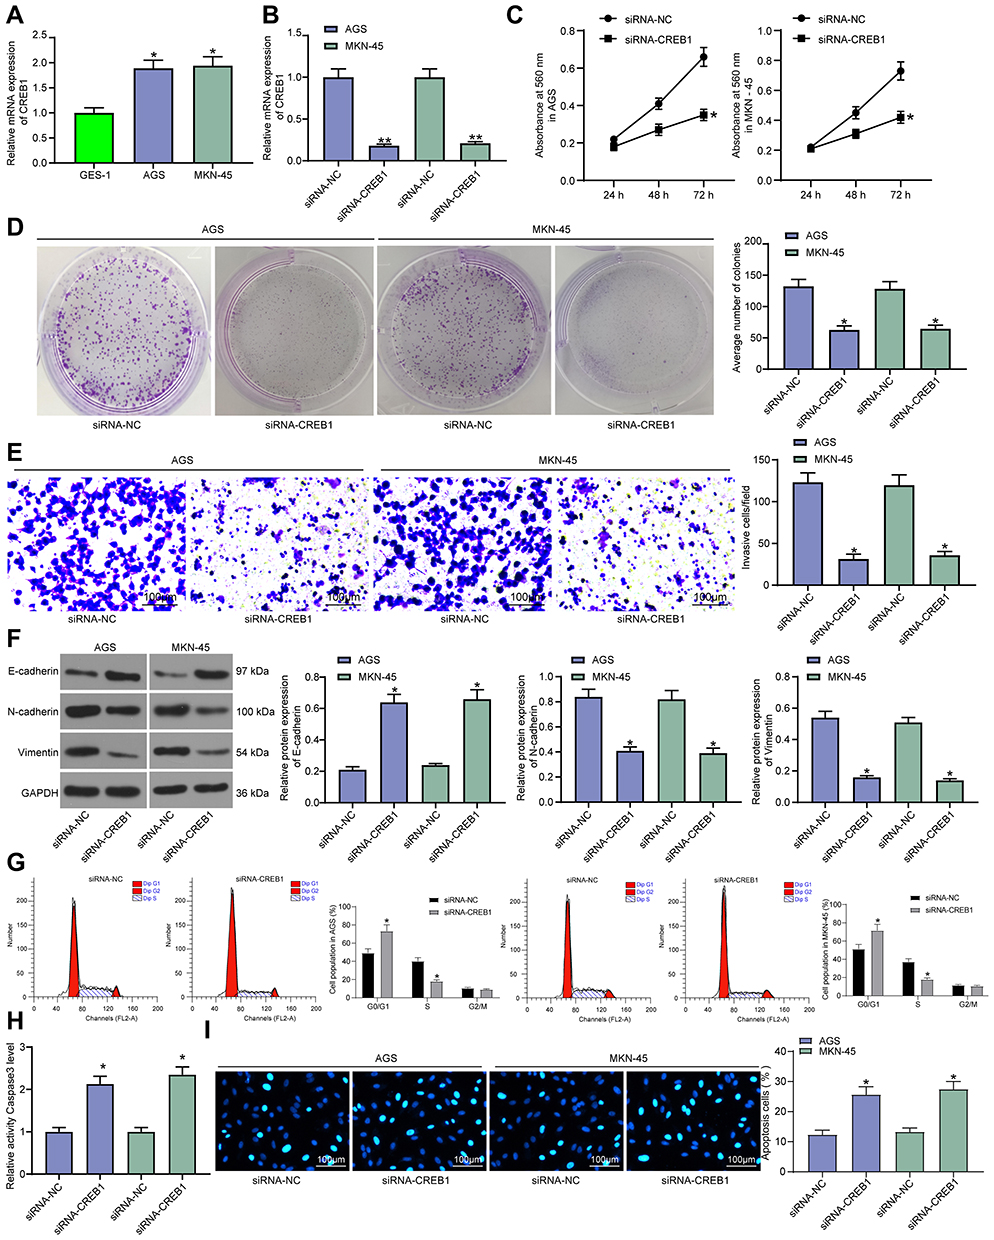 |
Figure 2 Silencing of CREB1 impedes malignant behaviors of GC cells. (A) CREB1 expression in GC cell lines (AGS and MKN-45) and in mucosa cell line (GES-1) measured by RT-qPCR (one-way ANOVA, compared to GES-1 cells, *p < 0.05); (B) CREB1 expression in GC cells following si-CREB1 transfection detected by RT-qPCR (one-way ANOVA, *p < 0.05); (C) proliferation of GC cells determined by the CCK-8 assay (two-way ANOVA, *p < 0.05); (D) number of formed cell colonies determined by colony formation assay (one-way ANOVA, *p < 0.05); (E) invasion ability of GC cells examined by Transwell assay (one-way ANOVA, *p < 0.05); (F) protein levels of E-cadherin, N-cadherin and vimentin in GC cells evaluated by Western blot analysis (one-way ANOVA, *p < 0.05); (G) cell cycle distribution in GC cells determined by flow cytometry (two-way ANOVA, *p < 0.05); (H) measurement of Caspase-3 activity in cells (one-way ANOVA, *p < 0.05); (I) apoptosis rate of GC cells assessed by Hoechst 33,258 staining (two-way ANOVA, *p < 0.05). |
CREB1 Suppresses miR-186 Transcription
The data on JASPAR predicted that CREB1 could bind to the promoter region of miR-186 (Figure 3A). Then, an RT-qPCR was performed and identified decreased miR-186 expression in GC tissues as compared to the paired normal ones (Figure 3B), presenting an inverse relationship with the CREB1 expression in tissues (Figure 3C). Next, pcDNA-CREB1 as well as its NC was transfected into GC cells, after which the CREB1 expression was successfully up-regulated (Figure 3D), while the miR-186 expression, accordingly, was further inhibited (Figure 3E). In addition, siRNA-CREB1 was administrated into GC cells, after which we found the miR-186 expression in cells was notably increased (Figure 3F), further indicating a negative correlation between CREB1 and miR-186 expression. To further validate the binding relationship between CREB1 and the promoter region of miR-186, the putative sequence with the highest binding score (Figure 3G) was used for further experiments. The dual-luciferase assay found that pcDNA-CREB1 inhibited the luciferase activity of miR-186 promoter (Figure 3H). Moreover, a ChIP assay was conducted, which suggested that the promoter region of miR-186 was enriched by anti-CREB1 in GC cell lines (Figure 3I). Collectively, these results identified that CREB1 could bind to the promoter region of miR-186 and suppress miR-186 transcription.
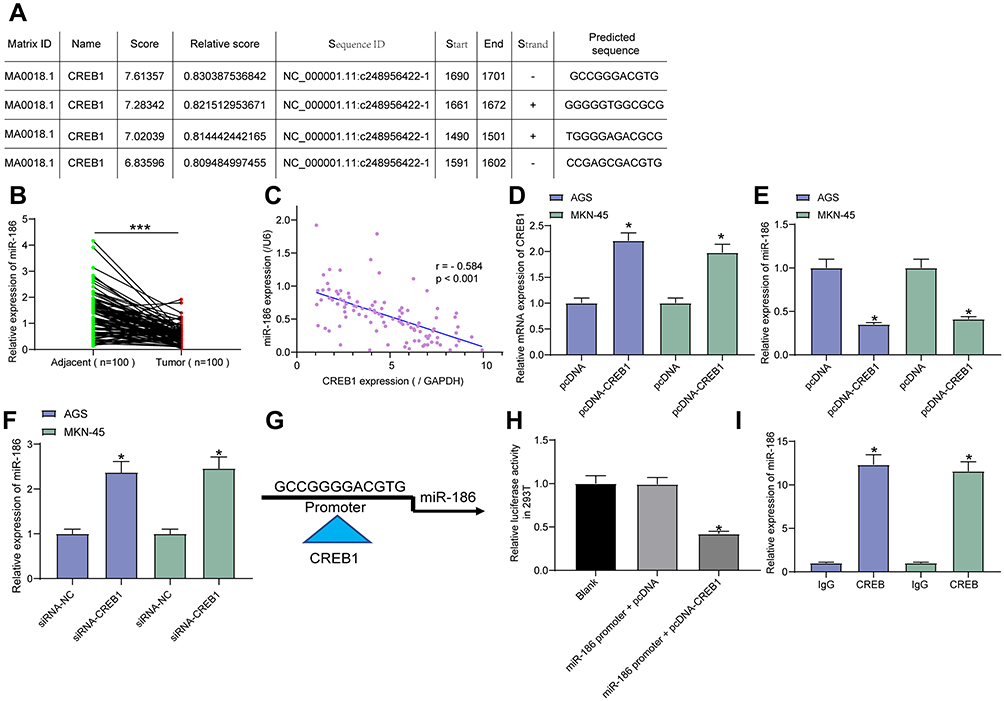 |
Figure 3 CREB1 suppresses miR-186 transcription. (A) putative binding sequences between CREB1 and the promoter region of miR-186 predicted on JASPAR (http://jaspar.genereg.net); (B) miR-186 expression in GC tissues and the adjacent normal tissues examined by RT-qPCR (paired t-test, n=100, ***p < 0.001); (C) correlation between miR-186 and CREB1 expression in GC tissues (Pearson’s correlation analysis, r = −0.584, ***p < 0.001); (D) CREB1 expression in GC cells following pcDNA-CREB1 transfection detected by RT-qPCR (one-way ANOVA, *p < 0.05); (E) miR-186 expression in GC cells after pcDNA-CREB1 transfection tested by RT-qPCR (one-way ANOVA, *p < 0.05); (F) miR-186 expression in GC cells after siRNA-CREB1 transfection tested by RT-qPCR (one-way ANOVA, *p < 0.05); (G) putative sequence of the miR-186 promoter used for following validation experiments; H-I, binding relationship between CREB1 and the sequence of miR-186 promoter confirmed by a luciferase reporter gene assay ((H), one-way ANOVA, compared to the Blank, *p < 0.05) and a ChIP-qPCR ((I), one-way ANOVA, *p < 0.05). |
Overexpression of miR-186 Inhibits Malignancy of GC Cells
Following the findings above, we further determined miR-186 expression in AGS, MKN-45 and GES-1 cell lines. The RT-qPCR results suggested a low-expression profile in GC cell lines (Figure 4A). Thereafter, miR-186 mimic was administrated into GC cell lines, after which miR-186 expression was successfully increased (Figure 4B). Then, the malignancy of GC cells was measured. The CCK-8 method suggested that the proliferation of cells was notably suppressed after miR-186 upregulation (Figure 4C). In addition, the Transwell assay showed that the invasive potential of cells was decreased (Figure 4D), and the GC cell apoptosis was increased following miR-186 mimic transfection according to the flow cytometry concerning cell apoptosis (Figure 4E).
 |
Figure 4 Overexpression of miR-186 inhibits malignancy of GC cells. (A) miR-186 expression in AGS, MKN-45 and GES-1 cell lines determined by RT-qPCR (one-way ANOVA, compared to GES-1 cells, *p < 0.05); (B) miR-186 expression in GC cells following miRNA mimic transfection detected by RT-qPCR (one-way ANOVA, *p < 0.05); (C) proliferation of GC cells measured by CCK-8 method (two-way ANOVA, *p < 0.05); (D) invasion ability of GC cells determined by Transwell assay (one-way ANOVA, *p < 0.05); (E) apoptosis rate of GC cells evaluated by flow cytometry (one-way ANOVA, *p < 0.05). |
miR-186 Directly Binds to KRT8
The downstream molecular mechanism was further explored. First, the prediction on Starbase suggested KRT8 as a biological target mRNA of miR-186 (Figure 5A). KRT8 was suggested to be highly expressed in GC according to the data in GEPIA (Figure 5B). Thereafter, KRT8 expression in GC tissues and cells was measured. The RT-qPCR found that KRT8 was highly expressed either in the GC tissues verses in the adjacent normal ones, or in the GC cell lines as compared to that in GES-1 cells (Figure 5C). In addition, following miR-186 mimic administration, it was found the KRT8 expression in GC cells was notably inhibited (Figure 5D). A luciferase assay was further performed, which presented that the luciferase activity in 293T cells co-transfected with miR-186 mimic and KRT8-WT vector was notably decreased, while the luciferase activity in cells subjected to other co-transfections showed little differences (Figure 5E).
 |
Figure 5 miR-186 directly binds to KRT8. (A) putative binding site between miR-186 and KRT8 predicted on Starbase (http://starbase.sysu.edu.cn/); (B) high-expression profile of KRT8 in GC predicted on GEPIA (http://gepia.cancer-pku.cn/); (C) KRT8 expression in GC tissues and the normal tissues (paired t-test, **p < 0.01) and in AGS, MKN-45 and GES-1 cell lines (one-way ANOVA, compared to GES-1 cells, *p < 0.05) determined by RT-qPCR; (D) KRT8 expression in GC cell lines after miR-186 mimic transfection measured by RT-qPCR (one-way ANOVA, **p < 0.01); (E) binding relationship between miR-186 and KRT8 validated by a dual-luciferase reporter gene assay. |
KRT8 Increases HIF-1α Expression in Cells and Promotes GC Cell Malignancy
To explore the possible involvement of HIF-1α in GC, an immunohistochemical staining concerning HIF-1α expression in GC and normal tissues was first performed, which identified a high protein level of HIF-1α in GC tissues (Figure 6A). Then, the RT-qPCR results found a similar trend, where higher expression of HIF-1α in GC cell lines was observed (Figure 6B). Further, we transfected pcDNA-KRT8 into GC cells, after which the mRNA expression of KRT8 was increased (Figure 6C). Intriguingly, the expression of HIF-1α was upregulated as well (Figure 6D). Thereafter, the EdU-labeling assay found that the number of EdU-positive cells was increased after pcDNA-KRT8 administration (Figure 6E). In addition, invasion of pcDNA-KRT8 cells was increased as well (Figure 6F), while the flow cytometry results suggested that the GC cell apoptosis was inhibited by pcDNA-KRT8 (Figure 6G). In addition, we further determined the mRNA expression of KRT8 and HIF-1α in GC cells transfected with siRNA-CREB1. It was found either KRT8 or HIF-1α expression was suppressed on CREB1 deletion (Figure 6H).
 |
Figure 6 KRT8 increases HIF-1α expression in cells and promotes GC cell malignancy. (A) protein level of HIF-1α in GC tissues and the paired normal tissues determined by immunohistochemistry staining (paired t-test, **p < 0.01); (B) HIF-1α expression in AGS, MKN-45 and GES-1 cell lines measured by RT-qPCR (one-way ANOVA, compared to GES-1 cells, *p < 0.05); (C and D) mRNA expression of KRT8 (C) and HIF-1α (D) in cells determined by RT-qPCR (one-way ANOVA, *p < 0.05); (E) proliferation of GC cells determined by EdU-labeling assay (one-way ANOVA, *p < 0.05); (F) invasion ability of GC cells measured by Transwell assay (one-way ANOVA, *p < 0.05); (G) apoptosis of GC cells determined by flow cytometry (one-way ANOVA, *p < 0.05); (H) mRNA expression of KRT8 and HIF-1α in cells after siRNA-CREB1 transfection determined by RT-qPCR (one-way ANOVA, *p < 0.05). |
Overexpression of HIF-1α Blocks the Inhibiting Role of CREB1 Silencing in GC Cells
Collectively, we further co-transfected siRNA-CREB1, siRNA-CREB1 + pcDNA-HIF-1α and the corresponding NC into GC cells. After that, it was found that HIF-1 expression was downregulated by siRNA-CREB1 but then recovered by pcDNA-HIF-1α (Figure 7A). The colony formation assay presented that the inhibitory effect of siRNA-CREB1 on GC cell growth was antagonized by pcDNA-HIF-1α (Figure 7B). In addition, the flow cytometry concerning cell cycle progression suggested that the promotion of CREB1 silencing in cell cycle arrest at G0/G1 phases was partially blocked following further HIF-1α upregulation (Figure 7C). Likewise, the invasiveness of GC cells was recovered by pcDNA-HIF-1α as well (Figure 7D). In the EMT regard, it was found that the further administration of pcDNA-HIF-1α led to increases in N-cadherin and vimentin expression while a decline in E-cadherin expression (Figure 7E). Still, the caspase-3 activity in cells was upregulated by pcDNA-HIF-1α as well (Figure 7F). Correspondingly, according to Hoechst staining, the apoptosis rate of GC cells was reduced by pcDNA-HIF-1α (Figure 7G).
 |
Figure 7 Overexpression of HIF-1α blocks the inhibiting role of CREB1 silencing in GC cells. (A) HIF-1α expression in GC cells after the administration of siRNA-CREB1, siRNA-CREB1 + pcDNA-HIF-1α and the corresponding NC determined by RT-qPCR (one-way ANOVA, *p < 0.05); (B) number of formed cell colonies determined by colony formation assay (one-way ANOVA, *p < 0.05); (C) cell cycle distribution in cells determined by flow cytometry (two-way ANOVA, *p < 0.05); (D) invasion ability of GC cells examined by Transwell assay (one-way ANOVA, *p < 0.05); (E) protein levels of E-cadherin, N-cadherin and vimentin in GC cells evaluated by Western blot analysis (one-way ANOVA, *p < 0.05); (F) caspase-3 activity in cells determined by a caspase-3 kit (one-way ANOVA, *p < 0.05); (G) apoptosis rate of GC cells assessed by Hoechst 33,258 staining (one-way ANOVA, *p < 0.05). |
Discussion
Treating GC, especially the advanced metastatic GC, is still a substantial challenge in the present society. Global efforts have been made to probe the genomic and epigenomic heterogeneity of GC to develop novel specific and sensitive predictive and/or prognostic markers based on gene expression profiling, and consequently to seek for better solutions for this health concern.2 In this paper, we validated a gene regulation network involving CREB1, miR-186, KLR8 and HIF-1α which is closely correlated with the disease progression in GC patients and in the malignant behaviors of GC cell lines AGS and MKN-45.
This research initially found a high-expression profile of CREB1 in the tumor tissues versus that in the adjacent normal tissues in GC patients. Importantly, abundant expression of CREB1 was found to lead to a high recurrence rate while poor survival in all included GC patients. The oncogenic roles of CREB1 in human malignancies have been largely revealed. It has been noted as a key driver of pro-survival and metabolic transcription program in prostate cancer and interacts with FoxA1 to increase the recurrence rate of cancer.16 In addition, increased expression of LINC01857, a CREB1 activator, was found to be linked to reduced survival time in patients with breast cancer.17 As for in GC, an inhibitor of CREB1, miR-1297, was found to be poorly existed in GC patients and positively correlated with survival of patients.18 Promotion of CREB1 in cancer has also been evidenced in several tumor cell types involving bladder cancer,19 colorectal cancer20 and glioma21 cells. Likewise, high-expression profiles of CREB1 have also been found in GC cell lines and its downregulation led to declines in growth and migration of SGC-7901 cells.8 Herein, in this paper, silencing of CREB1 was introduced in AGS and MKN-45 cell lines. We observed that silencing of CREB1 led to declines in colony formation, proliferation, invasion while increases in apoptosis and cell cycle arrest in GC cells. In the cytokine perspective, the expression of pro-apoptotic factor caspase-3 in cells was increased following CREB1 silencing. In addition, we further confirmed that the EMT of cells was decreased, presenting as an increased level of E-cadherin while decreased levels of N-cadherin and vimentin. During EMT, cells lose their cell-cell adhesion, which enables invasion and metastasis of cancer cells and is the malignant phase of tumor progression.22,23 These findings validated the protecting roles of CREB1 silencing against GC malignancy.
MicroRNAs are key influencers participating in tumorigenesis, metastasis, and prognosis of human cancers including GC.5 In the current research, the online prediction and the following luciferase and ChIP-qPCR assays identified miR-186 as a target that can be suppressed by CREB1 transcriptionally. miR-186 is a well-studied molecule that presented either high-expression or low-expression profiles, and played either tumor-inhibiting or oncogenic roles in different human cancer types.11,24 In most cases, miR-186 was said to be downregulated in cancers and to inhibit cancer development including GC.24 This was in line with our current findings which suggested decreased expression of miR-186 in GC cell lines. Thereafter, miR-186 mimic was introduced in these cell lines, after which the proliferation, invasion, as well as resistance to apoptosis of the GC cells were decreased. In addition, miR-186 presented a reverse correlation with CREB1 expression in cells, further indicating that CREB1 possibly promotes GC progression by suppressing miR-186.
miRNAs are well known to exert versatile functions through mediating the following mRNAs. Here, we further identified KRT8 as a target of miR-186 according to the integrated online prediction, expression examination and a luciferase assay. We found high expression of KRT8 promoted proliferation and reduced apoptosis in GC cells. KRT8 has been suggested as an independent predictor whose high expression indicating poor prognosis in patients with lung adenocarcinoma.25 Similarly, the upregulation of KRT8 was found to promote tumor metastasis and to indicate poor prognosis in clear cell renal cell carcinoma.26 More relatively, KRT8 was reported to promote metastasis and progression of GC.27 In addition to this, we found HIF-1α expression was increased following KRT8 upregulation. HIF-1α is frequently overexpressed in cancers as a consequence of the response to hypoxic niches.28 The promoting roles of HIF-1α in tumors including triggering metabolism, proliferation, inflammation, metastasis vascular homeostasis and tumorigenesis is also true for GC,29 leaving it a potential target for GC treatment.30 Clinically, high expression of HIF-1α has been documented to be correlated with unfavorable prognosis in GC patients.15 Here, to validate the involvement of this pathway in CREB-mediated events, a rescue experiment was performed, which suggested overexpression of HIF-1α blocked the functions of CREB1 silencing in GC malignancy.
Conclusion
To conclude, this study evidenced that silencing of CREB1 inhibited GC progression by suppressing growth, invasion, EMT and metastasis of GC cells, this process involving miR-186 upregulation and the following down-regulation of KLR8 (Figure 8). We further evidenced that KLR8 positively correlated with HIF-1α in GC cells, whose upregulation blocked the role of CREB1 silencing. However, the present evidence is still limiting since how CREB1 affects HIF-1α expression remains unsettled. We would like to explore this correlation in our further studies. We also hope more studies will be carried out to provide more ideas in gene-based therapeutic strategies for GC treatment.
 |
Figure 8 A diagram for molecular mechanism. In GC cells, nuclear translocation of CREB1 suppresses miR-186 transcription, up-regulating KRT-8 and HIF-1α expression and consequently promoting cell proliferation, invasion, EMT while suppressing cell cycle arrest and apoptosis. |
Disclosure
The authors declare no conflicts of interest for this work.
References
1. Bray F, Ferlay J, Soerjomataram I, Siegel RL, Torre LA, Jemal A. Global cancer statistics 2018: GLOBOCAN estimates of incidence and mortality worldwide for 36 cancers in 185 countries. CA Cancer J Clin. 2018;68(6):394–424. doi:10.3322/caac.21492
2. Pellino A, Riello E, Nappo F, et al. Targeted therapies in metastatic gastric cancer: current knowledge and future perspectives. World J Gastroenterol. 2019;25(38):5773–5788. doi:10.3748/wjg.v25.i38.5773
3. Jin X, Zhu Z, Shi Y. Metastasis mechanism and gene/protein expression in gastric cancer with distant organs metastasis. Bull Cancer. 2014;101(1):E1–12. doi:10.1684/bdc.2013.1882
4. Abrams T, Hess LM, Zhu YE, Schelman W, Liepa AM, Fuchs C. Predictors of heterogeneity in the first-line treatment of patients with advanced/metastatic gastric cancer in the U.S. Gastric Cancer. 2018;21(5):738–744. doi:10.1007/s10120-018-0802-5
5. Jiang C, Chen X, Alattar M, Wei J, Liu H. MicroRNAs in tumorigenesis, metastasis, diagnosis and prognosis of gastric cancer. Cancer Gene Ther. 2015;22(6):291–301. doi:10.1038/cgt.2015.19
6. Liu Y, Lang T, Jin B, et al. Luteolin inhibits colorectal cancer cell epithelial-to-mesenchymal transition by suppressing CREB1 expression revealed by comparative proteomics study. J Proteomics. 2017;161:1–10. doi:10.1016/j.jprot.2017.04.005
7. Steven A, Seliger B. Control of CREB expression in tumors: from molecular mechanisms and signal transduction pathways to therapeutic target. Oncotarget. 2016;7(23):35454–35465. doi:10.18632/oncotarget.7721
8. Rao M, Zhu Y, Cong X, Li Q. Knockdown of CREB1 inhibits tumor growth of human gastric cancer in vitro and in vivo. Oncol Rep. 2017;37(6):3361–3368. doi:10.3892/or.2017.5636
9. Wang YW, Chen X, Ma R, Gao P. Understanding the CREB1-miRNA feedback loop in human malignancies. Tumour Biol. 2016;37(7):8487–8502. doi:10.1007/s13277-016-5050-x
10. Adams BD, Kasinski AL, Slack FJ. Aberrant regulation and function of microRNAs in cancer. Curr Biol. 2014;24(16):R762–776. doi:10.1016/j.cub.2014.06.043
11. Wang Z, Sha HH, Li HJ. Functions and mechanisms of miR-186 in human cancer. Biomed Pharmacother. 2019;119:109428. doi:10.1016/j.biopha.2019.109428
12. Li X, Song Q, Guo X, et al. The metastasis potential promoting capacity of cancer-associated fibroblasts was attenuated by cisplatin via modulating KRT8. Onco Targets Ther. 2020;13:2711–2723. doi:10.2147/OTT.S246235
13. Garg N, Kumar P, Gadhave K, Giri R. The dark proteome of cancer: intrinsic disorderedness and functionality of HIF-1alpha along with its interacting proteins. Prog Mol Biol Transl Sci. 2019;166:371–403.
14. Vaupel P, Multhoff G. Fatal alliance of hypoxia-/HIF-1alpha-driven microenvironmental traits promoting cancer progression. Adv Exp Med Biol. 2020;1232:169–176.
15. Jiang X, Zhang S, Yin Z, et al. The correlation between NEDD4L and HIF-1alpha levels as a gastric cancer prognostic marker. Int J Med Sci. 2019;16(11):1517–1524. doi:10.7150/ijms.34646
16. Sunkel B, Wu D, Chen Z, et al. Integrative analysis identifies targetable CREB1/FoxA1 transcriptional co-regulation as a predictor of prostate cancer recurrence. Nucleic Acids Res. 2016;44(9):4105–4122. doi:10.1093/nar/gkv1528
17. Xiong Y, Gu Y, Wang F, et al. LINC01857 as an oncogene regulates CREB1 activation by interacting with CREBBP in breast cancer. J Cell Physiol. 2019;234(8):14031–14039. doi:10.1002/jcp.28090
18. Gao W, Cao Y, Guo P, et al. Downregulation of MiR-1297 predicts poor prognosis and enhances gastric cancer cell growth by targeting CREB1. Biomed Pharmacother. 2018;105:413–419. doi:10.1016/j.biopha.2018.05.094
19. Guo L, Yin M, Wang Y. CREB1, a direct target of miR-122, promotes cell proliferation and invasion in bladder cancer. Oncol Lett. 2018;16(3):3842–3848. doi:10.3892/ol.2018.9118
20. Yan L, You WQ, Sheng NQ, et al. A CREB1/miR-433 reciprocal feedback loop modulates proliferation and metastasis in colorectal cancer. Aging (Albany NY). 2018;10(12):3774–3793. doi:10.18632/aging.101671
21. Wang YP, Li HQ, Chen JX, et al. Overexpression of XIST facilitates cell proliferation, invasion and suppresses cell apoptosis by reducing radio-sensitivity of glioma cells via miR-329-3p/CREB1 axis. Eur Rev Med Pharmacol Sci. 2020;24(6):3190–3203. doi:10.26355/eurrev_202003_20686
22. Cho ES, Kang HE, Kim NH, Yook JI. Therapeutic implications of cancer epithelial-mesenchymal transition (EMT). Arch Pharm Res. 2019;42(1):14–24. doi:10.1007/s12272-018-01108-7
23. Choupani J, Mansoori Derakhshan S, Bayat S, Alivand MR, Shekari Khaniani M. Narrower insight to SIRT1 role in cancer: a potential therapeutic target to control epithelial-mesenchymal transition in cancer cells. J Cell Physiol. 2018;233(6):4443–4457. doi:10.1002/jcp.26302
24. Xiang Y, Tian Q, Guan L, Niu SS. The dual role of miR-186 in cancers: oncomir battling with tumor suppressor miRNA. Front Oncol. 2020;10:233. doi:10.3389/fonc.2020.00233
25. Xie L, Dang Y, Guo J, et al. High KRT8 expression independently predicts poor prognosis for lung adenocarcinoma patients. Genes (Basel). 2019;10(1):36. doi:10.3390/genes10010036
26. Tan HS, Jiang WH, He Y, et al. KRT8 upregulation promotes tumor metastasis and is predictive of a poor prognosis in clear cell renal cell carcinoma. Oncotarget. 2017;8(44):76189–76203. doi:10.18632/oncotarget.19198
27. Fang J, Wang H, Liu Y, Ding F, Ni Y, Shao S. High KRT8 expression promotes tumor progression and metastasis of gastric cancer. Cancer Sci. 2017;108(2):178–186. doi:10.1111/cas.13120
28. Jin X, Dai L, Ma Y, Wang J, Liu Z. Implications of HIF-1alpha in the tumorigenesis and progression of pancreatic cancer. Cancer Cell Int. 2020;20:273. doi:10.1186/s12935-020-01370-0
29. Zhang J, Xu J, Dong Y, Huang B. Down-regulation of HIF-1alpha inhibits the proliferation, migration, and invasion of gastric cancer by inhibiting PI3K/AKT pathway and VEGF expression. Biosci Rep. 2018;38(6). doi:10.1042/BSR20180741
30. Li H, Jia Y, Wang Y. Targeting HIF-1alpha signaling pathway for gastric cancer treatment. Pharmazie. 2019;74(1):3–7. doi:10.1691/ph.2019.8674
 © 2020 The Author(s). This work is published and licensed by Dove Medical Press Limited. The full terms of this license are available at https://www.dovepress.com/terms.php and incorporate the Creative Commons Attribution - Non Commercial (unported, v3.0) License.
By accessing the work you hereby accept the Terms. Non-commercial uses of the work are permitted without any further permission from Dove Medical Press Limited, provided the work is properly attributed. For permission for commercial use of this work, please see paragraphs 4.2 and 5 of our Terms.
© 2020 The Author(s). This work is published and licensed by Dove Medical Press Limited. The full terms of this license are available at https://www.dovepress.com/terms.php and incorporate the Creative Commons Attribution - Non Commercial (unported, v3.0) License.
By accessing the work you hereby accept the Terms. Non-commercial uses of the work are permitted without any further permission from Dove Medical Press Limited, provided the work is properly attributed. For permission for commercial use of this work, please see paragraphs 4.2 and 5 of our Terms.