")
Back to Journals » Journal of Inflammation Research » Volume 16
Creation of a Rat Takotsubo Syndrome Model and Utilization of Machine Learning Algorithms for Screening Diagnostic Biomarkers
Authors Huai H , Li J, Zhang X , Xu Q , Lan H
Received 30 May 2023
Accepted for publication 27 September 2023
Published 24 October 2023 Volume 2023:16 Pages 4833—4843
DOI https://doi.org/10.2147/JIR.S423544
Checked for plagiarism Yes
Review by Single anonymous peer review
Peer reviewer comments 2
Editor who approved publication: Professor Ning Quan
Hongyu Huai,1 Junliang Li,2 Xiangjie Zhang,1 Qiang Xu,3 Huan Lan1
1Key Laboratory of Medical Electrophysiology, Ministry of Education & Medical Electrophysiological Key Laboratory of Sichuan Province, Institute of Cardiovascular Research, Southwest Medical University, Luzhou, People’s Republic of China; 2Department of Otolaryngology Head and Neck Surgery, the Affiliated Hospital of Southwest Medical University, Luzhou, Sichuan, People’s Republic of China; 3School of Basic Medical Science, Southwest Medical University, Luzhou, People’s Republic of China
Correspondence: Huan Lan, Email [email protected]
Introduction: Ferroptosis, a crucial type of programmed cell death, is directly linked to various cardiac disorders. However, the contribution of ferroptosis-related genes (FRGs) to Takotsubo syndrome (TTS) has not been completely understood.
Purpose: The objective of this study was to investigate the relationship between the FRGs and TTS.
Methods: TTS rat models were established by isoprenaline injection. Heart tissues were subsequently harvested for total RNA extraction and library construction. Transcriptome data wereobtained transcriptome data for TTS and FRGs from our laboratory, and sources such as the Ferroptosis Database (FerrDb) and the Gene Expression Omnibus Database (GEO). 57 differentially expressed FRGs (DE-FRGs) were discovered. The LASSO and SVM-RFE algorithms were employed to identify Enpp2, Pla2g6, Etv4, and Il1b as marker genes, and logistic regression was applied to construct a diagnostic model. The important genes were validated by real time PCR and the external dataset. Finally, the extent of immune infiltration was explored.
Results: Among the 57 genes, there were 36 up-regulated and 21 down-regulated genes that exhibited distinct expression patterns in the TTS and healthy control samples. Kyoto Encyclopedia of Genes and Genomes (KEGG) analysis indicated that the enriched pathways were primarily associated with pathways of neurodegeneration-multiple disease, while Gene Ontology (GO) analysis revealed that these genes were primarily linked to cellular response to external stimuli, outer membrane functions, and ubiquitin protein ligase binding. After the identification of four marker genes as potentially effective biomarkers for TTS diagnosis, subsequent logistic regression modeling revealed a receiver operating characteristic curve (ROC) with an AUC of 1.0. The examination of immune cell infiltration showed significantly higher prevalence of activated CD4+ T cells, mast cells, etc., in TTS.
Conclusion: Our findings support the theoretical importance of ferroptosis in TTS, highlighting Enpp2, Pla2g6, Etv4, and Il1b as potential diagnostic and therapeutic biomarkers for TTS.
Keywords: ferroptosis, diagnosis, takotsubo syndrome, machine-learning algorithms
Introduction
TTS, also known as “stress cardiomyopathy” or “cardiovascular neurosis”, was first discovered by Japanese researchers. This condition is comparable to acute coronary syndrome and is induced by sudden physical or emotional stress. It is often characterized by brief myocardial edema or systolic myocardial dysfunction, which typically takes the form of left ventricular systolic dyskinesia. Acute chest pain, dyspnea, electrocardiographic changes like ST-segment elevation, T-wave inversion, slightly elevated cardiac enzyme levels, and transient ventricular wall motion abnormalities are typical symptoms of acute coronary syndrome.1 Early imaging is frequently used to distinguish between TTS and acute coronary syndrome,2 although accuracy needs to be improved.
Cell death is a crucial physiological process involved in growth, aging, and tissue homeostasis, which is often dysregulated in various clinical situations.3 Ferroptosis, an iron-dependent non-apoptotic form of cell death, was discovered in 2012.4 Its mechanism is distinct from those of apoptosis, necrosis, pyroptosis, and autophagy, and it is centered on the accumulation of lipid peroxides, which essentially results from intracellular reactive oxygen species (ROS) metabolism disorders.5 Iron catalyzes metabolic irregularities, reducing the antioxidant capacity of the cells, and consequently resulting in a gradual accumulation of ROS that causes cell death.6 Ferroptosis also contributes to significant morphological changes in mitochondria, including a reduction in mitochondrial volume, an increase in membrane density, and a disturbance of the mitochondrial membrane’s organization.7,8 The development of ferroptosis is significantly influenced by circulating iron, which can be inhibited using iron chelators. Furthermore, cells with high transferrin expression on their membranes are more susceptible to ferroptosis.4 Iron ions and lipid peroxide levels first increase significantly has been detected in ferroptosis. These events lead to amplified lipid peroxidation reactions on the cell membrane and increase the free radical studies of lipid peroxides, encouraging the apoptotic process and ultimately leading to cardiomyocyte death.9 Secondly, numerous studies have shown that TTS may be associated with alterations in the lipid metabolism enzyme system in vivo.10 The GLS (lipid peroxide-scavenging enzyme) mechanism, which is essential to ferroptosis and may disrupt the balance of lipid metabolism in vivo, is what causes TTS to manifest.11 The degree of glutathione peroxidase (GPX4) degradation and Nrf2 activation in cardiomyocytes, which are associated with the mechanism of ferroptosis, has been observed closely linked to the development of TTS.12 Taken together, these findings indicates that ferroptosis may play a role in the process of TTS. Mounting evidence suggests that ferroptosis significantly contributes to the development of cardiovascular diseases such as myocardial ischemia-reperfusion injury, hypertension, atherosclerosis, myocardial infarction, and heart failure.4,13,14 However, the mechanism of ferroptosis in TTS is still unclear. With the advent of Next Generation Sequencing (NGS) technology, bioinformatics has become a burgeoning interdisciplinary field that mainly utilizes molecular biology, computer science, and information technology to elucidate the laws and mysteries underlying complex biological data. Among these, machine learning algorithms have demonstrated a significant role in the screening of sensitive diagnostic biomarkers for various diseases.15 Intending to provide clinical guidelines for the diagnosis and treatment of TTS, this study conducted a thorough analysis of TTS transcriptome data using machine learning techniques to develop a diagnostic model based on FRGs.
Materials and Methods
Animals
All animal studies were approved by the Southwest Medical University Institutional Review Board’s Animal Welfare Committee and adhered to the institution’s guidelines for animal experimentation (approval number: 20220815-034). Female SPF-grade SD rats and ISO (isoprenaline) were purchased from Beijing HFK Bioscinece Co., Ltd and MedChemExpress respectively for this study. After 24 hours, of intraperitoneal injection of ISO, small animal ultrasound was used to detect the heart function to confirm that TTS rat model was successfully established. Then the rats were euthanized with isoflurane, and heart tissues were collected for RNA-Seq analysis.
RNA Extraction and Library Construction
A total RNA was used to prepare the RNA sample. mRNA was isolated from total RNA using magnetic beads with poly-T oligonucleotides attached. Divalent cations were used to break the RNA at a high temperature in a reaction buffer for initial strand synthesis (5X). First-strand cDNA was generated using random hexamer primers and M-MuLV reverses transcriptase, and RNA was then digested with RNaseH. The DNA polymerase I apparatus was used to create second-strand cDNA. After the 3’ end of the DNA fragment was adenylated, a junction with a hairpin loop structure was added for hybridization. The library fragments were purified using the AMPure XP system (Beckman Coulter, Beverly, USA) to select cDNA fragments with a length of preferably 250–300 BP. After PCR amplification, the PCR products were purified using AMPure XP beads to generate libraries. The library was first measured with a Qubit 2.0 fluorometer, diluted to 1.5 ng/L, and the insert size of the library was determined using an Agilent 2100 Bioanalyzer to ensure that it was with high quality. The effective concentration of the library was accurately determined by RT-PCR once the insert size reached the expected level (the effective concentration of the library was higher than 2 nM) to ensure library quality.
Sequencing and Mapping
Deep sequencing was performed using an Illumina NovaSeq 6000 with paired ends and a 150 bp read length. To ensure accurate data analysis, raw sequences obtained from sequencing were subjected to quality control to obtain good-quality sequences (Clean Reads). The following quality control criteria were applied: removal of reads that contain the junction filtering of low-quality data to ensure data quality, and elimination of reads with over 5% N content (unidentifiable base information). The incoming data was filtered using fastp software based on the aforementioned criteria. Hisat2 v2.2.1 was used to map the Clean Reads to the rat reference genomic RNA from the Ensembl database to the rat reference genome Rattus_norvegicus.mRatBN7.2.109. Finally, featureCounts was used to quantify the bam files to obtain the transcriptome raw counts data.
Data Integration and Analysis
The original counts data from the lab and the counts data of GSE223385 downloaded from the GEO database were combined. The batch effect was removed using the ComBat_seq function of the R package . The combined counts data were transformed into TPM data, and a total of 9 TTS samples and 9 normal samples were used as the training set for analysis. Analysis was conducted using the training set. To confirm the expression of marker genes, the GSE211134 dataset, which includes 20 TTS samples and 9 normal samples, was used. All data were log2-transformed and normalized using the R package. Additionally, the FerrDb database provided the FRGs used in this study. A detailed list of genes is displayed in Table S1.
Differential Expression Analysis
Initially, the expression information for 369 ferroptosis-related genes was collected from the normal and TTS samples in the training set. Next, paired t-tests were used to identify the DE-FRGs in the two distinct samples, and genes with p<0.05 were considered significant.
Functional Enrichment Analysis
GO and KEGG enrichment analyses were conducted on the DE-FRGs using the R package “ClusterProfiler”.
Identification of TTS Diagnostic Genes
The dimensionality of the data was reduced using the Least Absolute Shrinkage and Selection Operator (LASSO) algorithm implemented in the glmnet R package. The LASSO algorithm was used to identify genetic biomarkers of TTS by comparing DE-FRGs in TTS patients and normal samples. Additionally, a Support Vector Machine-Recursive Feature Elimination (SVM-RFE) model was created using the SVM package. The mean false positive rate of 10-fold cross-validation was used to compare the performance of the LASSO and SVM-RFE models. Overlapping genetic markers for TTS were identified using the results of both models. The diagnostic potential of the best genetic biomarker was evaluated by determining the ROC and calculating the area under the curve (AUC), accuracy, sensitivity, and specificity. Furthermore, a logistic regression model based on four marker genes was constructed using the predictive function in the R package glm, to distinguish between different sample types in the training set. The diagnostic performance of the logistic regression model was evaluated using ROC curves.
Gene Set Enrichment Analysis (GSEA)
The R package GSEA (V4.1.2) was utilized for this study. GSEA enrichment analysis was performed separately for the TTS and normal groups to better understand the relevant pathways enriched in TTS and normal samples.
Immune Infiltration Analysis
In this study, the single-sample gene-set enrichment analysis (ssGSEA) algorithm was utilized to estimate the type and relative expression of immune cells that had infiltrated into TTS and normal samples from the training set. The gene set defining the various types of immune-infiltrating cells originates from Charoentong’s comprehensive study, which encompasses a diverse array of human immune cell subtypes. These include activated B cells, activated CD8+T cells, activated CD4+T cells, and macrophages, among others16,17 (Table S3).
Quantitative Real-Time PCR
The rat TTS model was reconstructed using the method described in Section 2.1. The GeneJET RNA Purification Kit reagent (Thermo Scientific) was utilized to extract RNA from rat cardiac tissue. The RNA samples were reverse transcribed to cDNA, and the cDNA was by amplified real-time quantitative fluorescence PCR to determine gene expression level. The 2−ΔΔCT method was employed to analyze the data, and the relative expression of target genes was calculated by the GAPDH ratio. The following is the list of primers: Il1b: Forward: 5’-TAGCAGCTTTCGACAGTGAGG-3’; Reverse: 5’-CTCCACGGGCAAGACATAGG-3’. Enpp2:5’-CAAGGCTGTCTCGGGTCATT-3’; Reverse: 5’-AGAGTCAGACAGCACTGTGG-3’. Etv4:5’-CCGGACAGTGATGAGCAGTT-3’; Reverse: 5’-GGGAGTCATAGGCACTGGAG-3’. GAPDH:5’-GCGGCATTAACTCTGTCCTG-3’; Reverse: 5’-GTTCCCCTTACCTCCAGCTT-3’.
Statistical Analysis
All statistical analyses were carried out using the R software. A Student’s t-test was performed to compare the two groups, while correlation analysis was used to determine the association between DE-FRGs. Statistical significance was set at P <0.05.
Results
Identification of DE-FRGs in the Training Cohort
Out of the 369 FRGs identified in the training set, 37 genes (36 up-regulated and 21 down-regulated) displayed different expression levels between TTS and normal samples. The clustering heatmap demonstrates the expression pattern of these DE-FRGs (Figure 1A). Figure 1B illustrates the interaction between these genes.
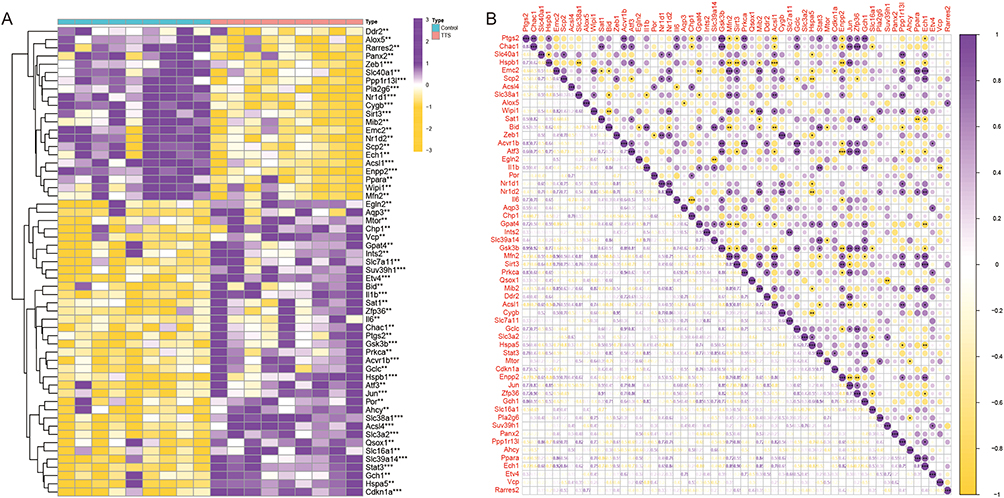 |
Figure 1 (A) DE‐FRGs in normal and TTS samples. (B) The correlation of DE‐FRGs. **P < 0.01, ***P < 0.001. |
Functional Analysis of DE-FRGs
Pathway enrichment analysis was conducted by GO and KEGG to identify the signaling pathways associated with DE-FRGs (Table S2). GO analysis discovered that neuronal death and the regulation of neuronal death was closely linked to the DE-FRGs in terms of biological processes, while the outer membrane, organelle outer membrane, and mitochondrial outer membrane were associated with the cellular components. In addition, biological activities linked to the binding of ubiquitin protein ligases, ubiquitin-like protein ligases, and DNA-binding transcriptional repressor activities were found to be related to the DE-FRGs (Figure 2A and B). KEGG pathway enrichment analysis revealed that the DE-FRGs were mostly involved in pathways related to lipid and atherosclerosis, kaposi sarcoma-associated herpesvirus infection, human cytomegalovirus infection, and neurodegeneration multiple disorders (Figure 2C).
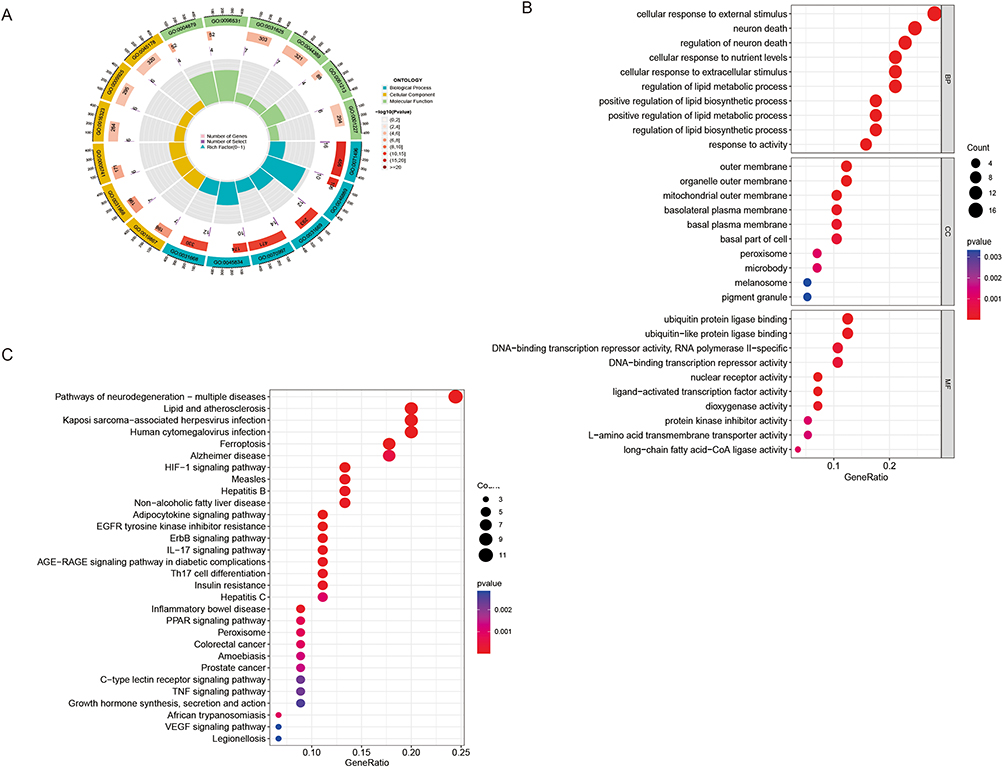 |
Figure 2 (A) GO enrichment analyses. (B) Top 10 enriched GO terms for biological processes (BP), cellular components (CC), and biological functions (BF). (C) Enrichment analysis of the top 30 KEGG pathways. |
Four DE-FRGs Were Identified as Diagnostic Genes for TTS
Two different machine learning techniques, LASSO and SVM-RFE, were employed to filter significant DE-FRGs and distinguish TTS from normal samples in the training set. The LASSO regression approach was applied with penalized parameter adjustment by 10-fold cross-validation to select 9 TTS-related characteristics (Figure 3A and B). The SVM-RFE algorithm was then used to screen DE-FRGs and choose the optimal mix of feature genes. Nine genes were selected as the best feature genes with a maximum accuracy of 0.95 and a minimum RMSE of 0.05 (Figure 3C and D). After intersecting the marker genes obtained in the LASSO and SVM-RFE models, Il1b, Enpp2, Pla2g6, and Etv4 were identified as four marker genes for further investigation. Using the R package glm, a logistic regression model was built based on the four marker genes. The ROC curves demonstrated that the model successfully distinguished between normal and TTS samples with an AUC of 1.0 (95% CI: 1.000–1.00). Moreover, ROC curves were plotted for the four marker genes to better understand their ability to differentiate between TTS and normal samples. All genes had an AUC greater than 0.9 (Figure 3E–G). Based on these findings, the logistic regression model is more accurate and specific than individual marker genes in discerning TTS samples from normal samples.
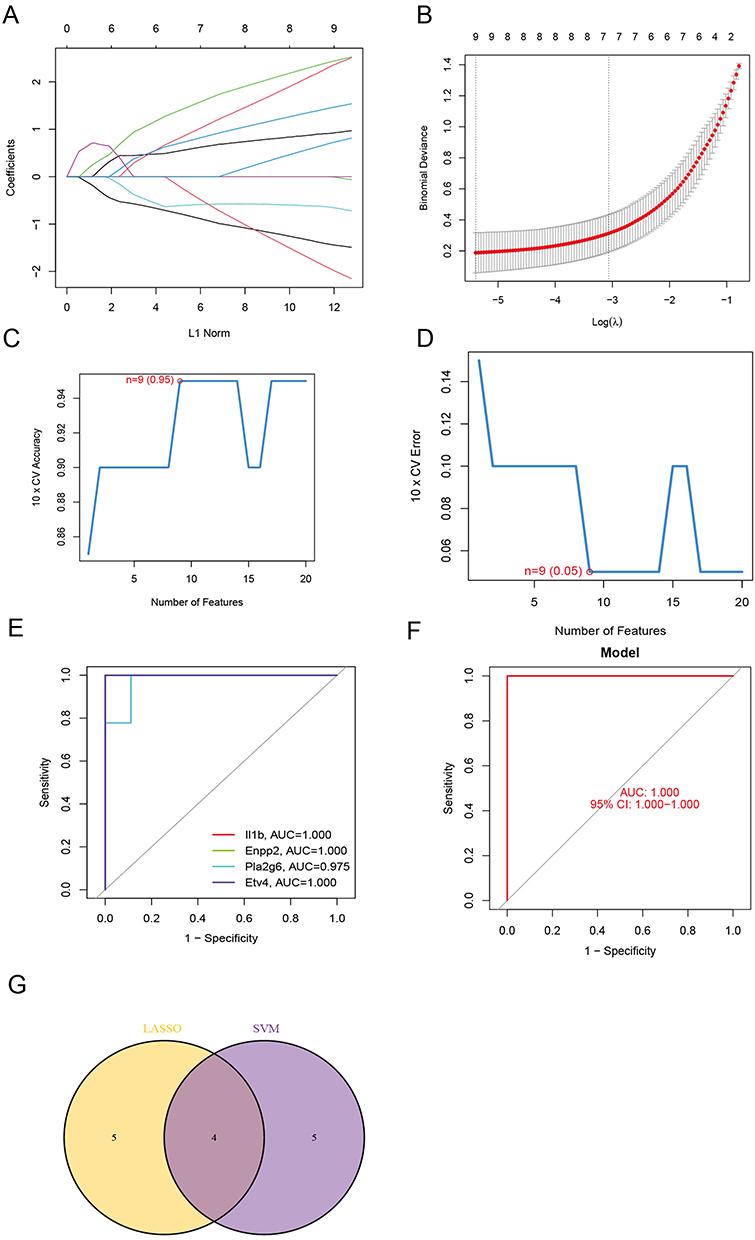 |
Figure 3 (A and B) By LASSO regression algorithm, with penalty parameter tuning conducted by 10‐fold cross‐validation, was used to select 9 TTS‐related features. (C and D) SVM‐RFE algorithm to filter the 57 DE‐FRGs to identify the optimal combination of feature genes. Finally, 9 genes (maximal accuracy =0.95, minimal RMSE =0.05) were identified as the optimal feature genes. (E) The marker genes obtained from the LASSO and SVM‐RFE models. (F) Logistic regression model to identify the AUC of TTS samples. (G) ROC curves for the 4 marker genes. |
Immune Infiltration and GSEA Analysis
The immune infiltration analysis carried out on the training set revealed significant differences in the expression of various immune cells between TTS and normal samples. Mast cells, activated CD4+ T cells, eosinophils, myeloid-derived suppressor cells, and activated CD8+ T cells were found to be more highly expressed in TTS samples than in normal samples (Figure 4A). The spearman correlation analysis revealed a significant positive correlation between Il1b and CD56bright natural killer cells, CD56dim natural killer cells, mast cells, and MDSC. Conversely, Enpp2 showed a significant negative correlation with activated B cells, CD56bright natural killer cells, CD56dim natural killer cells, macrophages, regulatory T cells, among others (Figure 4B). Furthermore, the results of GSEA analysis indicated that TTS samples were primarily enriched in signaling pathways linked to the cell cycle, cytokine-cytokine receptor interaction, and proteasome, whereas normal samples were mainly enriched in fatty acid metabolism, metabolism of xenobiotics by cytochrome p450, oxidative phosphorylation, and other related signaling pathways (Figure 5A and B).
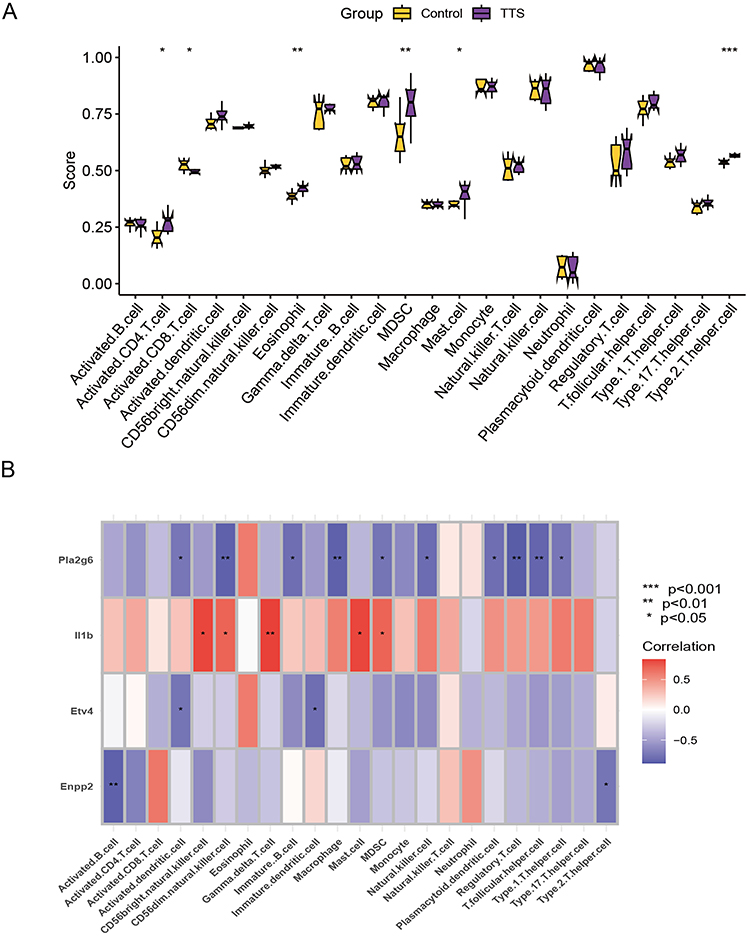 |
Figure 4 (A) Exploring differences in immune infiltration between TTS and normal samples using the ssGSEA algorithm. (B) Spearman analysis of the correlation between diagnostic model genes and immune cells. *P < 0.05, **P < 0.01, ***P < 0.001. |
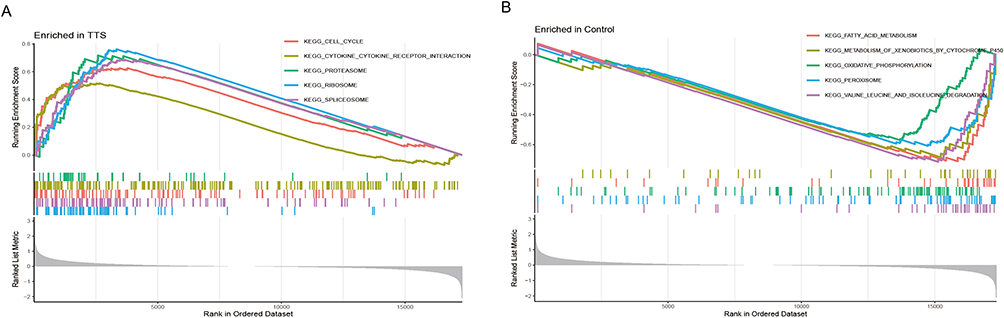 |
Figure 5 (A and B) GSEA analysis was performed on the TTS and normal groups. |
Validation of Marker Genes’ Expression
The relevant marker genes were validated in the training set. The expression trends of Il1b, Enpp2, and Etv4 were found to be consistent with the training set. Specifically, Il1b (p<0.001) and Etv4 (p=0.011) expression were observed to be higher in TTS samples than in normal samples, while Enpp2 (p=0.0043) was found to be more highly expressed in normal samples than in TTS samples (Figure 6A–C). Furthermore, we analyzed additional heart tissues from rats in the TTS and normal groups by real-time PCR, and the findings were in line with the previous analysis (Figure 6D–F).
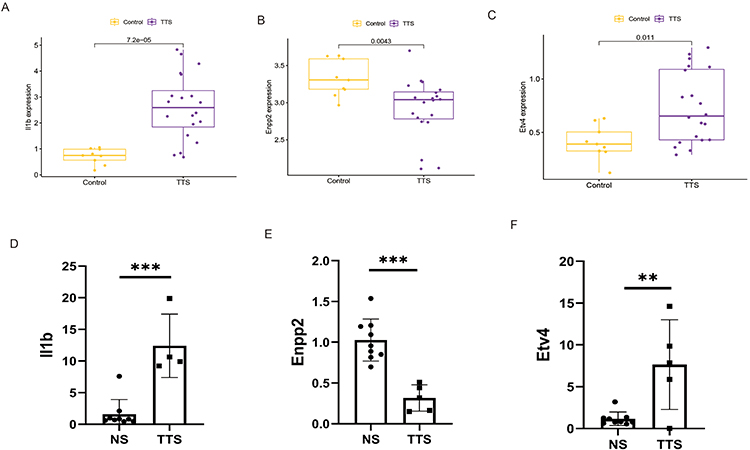 |
Figure 6 (A–C) The expression of marker genes in the GSE211134 dataset. (D–F) Validating the expression of marker genes using RT-qPCR. **P < 0.01, ***P < 0.001. |
Discussion
TTS was initially considered a benign self-limiting disease when it was first reported in 1990. However, recent studies have indicated that it could result in complications such as cardiac arrest, cardiogenic shock, severe mitral regurgitation, ventricular thromboembolism, and life-threatening arrhythmias during the acute phase, with in-hospital mortality rates ranging between 4% and 5%.18,19 The most popular theory regarding the pathogenesis of TTS suggests that intense mental stimulation or physical stress triggers the activation of the sympathetic nervous system, leading to the secretion of large amounts of catecholamines, which ultimately cause morbidity. Elevated catecholamine levels have been observed in TTS patients both during the acute phase and the recovery period. Moreover, conditions such as pheochromocytoma, subarachnoid hemorrhage, etc. can lead to the development of TTS as well20,21 Recent evidence also points towards the intricate relationship and interplay between the steroid hormones and catecholamines in the pathogenesis of TTS.22 To establish effective rat model of TTS, we selected the β-agonist isoprenaline as the stimulus as reported before.23 Initially, we utilized transcriptome sequencing to extract FRGs from the transcriptome data, then the variation in FRGs expression levels between normal and TTS samples was investigated. Two separate machine learning algorithms, LASSO and SVM-RFE, were employed to develop diagnostic models that screen for significant DE-FRGs to differentiate TTS from normal data. In this study, four genes, namely, Enpp2, Pla2g6, Etv4, and Il1b, were identified as differential genes related to ferroptosis. All four genes found to be essential to the diagnostic model have AUC values above 0.9, indicating their high specificity for TTS.Enpp2, also known as autocrine motility factor Autotaxin (ATX), is a hemolytic phospholipase D found in the arterial wall that promotes the production of lysophosphatidic acid (LPAS), leading to atherogenic monocyte adhesion. Enpp2 is involved in a variety of biological functions through the associated G protein-coupled receptor LPAR1-6. Additionally, Enpp2 is a lipid kinase involved in lipid metabolism and has been found to protect cardiac myocytes from elastin-induced ferroptosis. Overexpression of Enpp2 promotes migration and proliferation in H9C2 cells while significantly reducing elastin-induced ferroptosis.24 Pla2g6 is abundantly expressed in human placental trophoblast cells25,26 and functions as a new ferroptosis regulator in these cells.25 When activated by oxidized phospholipids or other ROS, Pla2g6 can hydrolyze Hp-PE to hemolytic PE and oxidized fatty acids, thus eliminating the ferroptosis signal.27
Furthermore, knocking down Etv4 has been shown to inhibit SLC7A11, a crucial component in ferroptosis regulation, leading to accelerated papillary thyroid cancer growth.28 Inflammatory cytokines such as tumor necrosis factor (TNF), interleukin-1, and interleukin-6 are examples of markers downstream of ferroptosis that can be triggered.29 In our study, we found that the expression of the model gene Il1b was significantly increased in TTS, consistent with the fact that patients with TTS frequently experience an inflammatory response during the acute phase.30 Immune cells play a significant role in maintaining cardiac homeostasis, and recent studies on cardiac injury repair have highlighted the critical role played by immune cells that infiltrate cardiac tissue, such as mast cells, eosinophils, T cells, and B cells, in the preservation of healthy cardiac function.31 The iron deficit can prevent T cell proliferation, while iron overload can cause an imbalance between CD4+ and CD8+ T cell populations. Activated T cells have high iron demand and may limit SLC7A11 expression and impair cystine absorption by tumor cells through IFN-γ production by CD8+ T cells, thereby triggering ferroptosis via the JAK1-STAT1 pathway.32 Myeloid-derived suppressor cells (MDSC), which are regulatory immune cells that primarily dampen the immune response,33 were found to have higher CD4+ T cell expression and MDSC infiltration in TTS samples compared to normal samples in our study. These findings suggested that there may be an imbalance in immune cell infiltration in the hearts of rats in the TTS group.
In conclusion, our study effectively developed a four-FRG TTS diagnostic model with potential translational implications for the diagnosis and treatment of TTS, utilizing high-throughput data from our lab and public databases. However, there are certain limitations to this study. Despite reducing batch effects through data integration, confounding variables may still be affecting the results. Additionally, further in vitro and in vivo studies are necessary to confirm the importance of the identified genes.
Conclusion
Our findings support the theoretical importance of ferroptosis in TTS, highlighting Enpp2, Pla2g6, Etv4, and Il1b as potential diagnostic and therapeutic biomarkers for TTS.
Funding
This study was supported by Sichuan Science and Technology Programe (No.: 2022YFS0610).
Disclosure
The authors report no conflicts of interest in this work.
References
1. Nef HM, Möllmann H, Akashi YJ, Hamm CW. Mechanisms of stress (Takotsubo) cardiomyopathy. Nat Rev Cardiol. 2010;7(4):187–193. doi:10.1038/nrcardio.2010.16
2. Prokudina ES, Kurbatov BK, Maslov LN. Клиническая картина стрессорной кардиомиопатии (синдром такотсубо) и проблема дифференциальной диагностики с острым инфарктом миокарда [Clinical manifestation of stressful cardiomyopathy (Takotsubo Syndrome) and the problem of differential diagnosis with acute myocardial infarction]. Kardiologiia. 2020;60(11):777. Russian. doi:10.18087/cardio.2020.11.n777
3. Fang X, Wang H, Han D, et al. Ferroptosis as a target for protection against cardiomyopathy. Proc Natl Acad Sci U S A. 2019;116(7):2672–2680. doi:10.1073/pnas.1821022116
4. Dixon SJ, Lemberg KM, Lamprecht MR, et al. Ferroptosis: an iron-dependent form of nonapoptotic cell death. Cell. 2012;149(5):1060–1072. doi:10.1016/j.cell.2012.03.042
5. Guo J, Xu B, Han Q, et al. Ferroptosis: a Novel Anti-tumor Action for Cisplatin. Cancer Res Treat. 2018;50(2):445–460. doi:10.4143/crt.2016.572
6. Mou Y, Wang J, Wu J, et al. Ferroptosis, a new form of cell death: opportunities and challenges in cancer. J Hematol Oncol. 2019;12(1):34. doi:10.1186/s13045-019-0720-y
7. Xie Y, Hou W, Song X, et al. Ferroptosis: process and function. Cell Death Differ. 2016;23(3):369–379. doi:10.1038/cdd.2015.158
8. Angeli JPF, Shah R, Pratt DA, Conrad M. Ferroptosis inhibition: mechanisms and opportunities. Trends Pharmacol Sci. 2017;38(5):489–498. doi:10.1016/j.tips.2017.02.005
9. Wu X, Li Y, Zhang S, Zhou X. Ferroptosis as a novel therapeutic target for cardiovascular disease. Theranostics. 2021;11(7):3052–3059. doi:10.7150/thno.54113
10. Godsman N, Kohlhaas M, Nickel A, et al. Metabolic alterations in a rat model of takotsubo syndrome. Cardiovasc Res. 2022;118(8):1932–1946. doi:10.1093/cvr/cvab081
11. Feng H, Stockwell BR. Unsolved mysteries: how does lipid peroxidation cause ferroptosis? PLoS Biol. 2018;16(5):e2006203. doi:10.1371/journal.pbio.2006203
12. Nef HM, Möllmann H, Troidl C, et al. Expression profiling of cardiac genes in Tako-Tsubo cardiomyopathy: insight into a new cardiac entity. J Mol Cell Cardiol. 2008;44(2):395–404. doi:10.1016/j.yjmcc.2007.10.015
13. Re DP D, Amgalan D, Linkermann A, Liu Q, Kitsis RN. Fundamental mechanisms of regulated cell death and implications for heart disease. Physiol Rev. 2019;99(4):1765–1817. doi:10.1152/physrev.00022.2018
14. Chen Y, Li X, Wang S, Miao R, Zhong J. Targeting iron metabolism and ferroptosis as novel therapeutic approaches in cardiovascular diseases. Nutrients. 2023;15(3):591. doi:10.3390/nu15030591
15. Li G, Lei J, Xu D, et al. Integrative analyses of ferroptosis and immune related biomarkers and the osteosarcoma associated mechanisms. Sci Rep. 2023;13(1):5770. doi:10.1038/s41598-023-33009-1
16. Charoentong P, Finotello F, Angelova M, et al. Pan-cancer Immunogenomic analyses reveal genotype-immunophenotype relationships and predictors of response to checkpoint blockade. Cell Rep. 2017;18(1):248–262. doi:10.1016/j.celrep.2016.12.019
17. Dai B, Sun F, Cai X, et al. Significance of RNA N6-methyladenosine regulators in the diagnosis and subtype classification of childhood asthma using the gene expression omnibus database. Front Genet. 2021;12:634162. doi:10.3389/fgene.2021.634162
18. Gili S, Cammann VL, Schlossbauer SA, et al. Cardiac arrest in takotsubo syndrome: results from the InterTAK Registry. Eur Heart J. 2019;40(26):2142–2151. doi:10.1093/eurheartj/ehz170
19. Di Vece D, Citro R, Cammann VL, et al. Outcomes associated with cardiogenic shock in Takotsubo syndrome. Circulation. 2019;139(3):413–415. doi:10.1161/circulationaha.118.036164
20. Y-Hassan S. Clinical features and outcome of pheochromocytoma-induced Takotsubo syndrome: analysis of 80 published cases. Am J Cardiol. 2016;117(11):1836–1844. doi:10.1016/j.amjcard.2016.03.019
21. Ranieri M, Finsterer J, Bedini G, Parati EA, Bersano A. Takotsubo syndrome: clinical features, pathogenesis, treatment, and relationship with cerebrovascular diseases. Curr Neurol Neurosci Rep. 2018;18(5):20. doi:10.1007/s11910-018-0833-7
22. Batta A, Gupta AK, Singal G, et al. Autoimmune polyendocrine syndrome II presenting paradoxically as Takotsubo cardiomyopathy: a case report and reappraisal of pathophysiology. Egypt Heart J. 2022;74(1):82. doi:10.1186/s43044-022-00321-6
23. Wilson HM, Cheyne L, Brown PAJ, et al. Characterization of the myocardial inflammatory response in acute stress-induced (Takotsubo) cardiomyopathy. JACC Basic to Transl Sci. 2018;3(6):766–778. doi:10.1016/j.jacbts.2018.08.006
24. Bai YT, Chang R, Wang H, et al. ENPP2 protects cardiomyocytes from erastin-induced ferroptosis. Biochem Biophys Res Commun. 2018;499(1):44–51. doi:10.1016/j.bbrc.2018.03.113
25. Beharier O, Tyurin VA, Goff JP, et al. PLA2G6 guards placental trophoblasts against ferroptotic injury. Proc Natl Acad Sci U S A. 2020;117(44):27319–27328. doi:10.1073/pnas.2009201117
26. Dolma S, Lessnick SL, Hahn WC, Stockwell BR. Identification of genotype-selective antitumor agents using synthetic lethal chemical screening in engineered human tumor cells. Cancer Cell. 2003;3(3):285–296. doi:10.1016/s1535-6108(03)00050-3
27. Balboa MA, Balsinde J. Oxidative stress and arachidonic acid mobilization. Biochim Biophys Acta. 2006;1761(4):385–391. doi:10.1016/j.bbalip.2006.03.014
28. Wang L, Zhang Y, Yang J, et al. The knockdown of ETV4 inhibits the papillary thyroid cancer development by promoting ferroptosis upon SLC7A11 downregulation. DNA Cell Biol. 2021;40(9):1211–1221. doi:10.1089/dna.2021.0216
29. Xiao Z, Kong B, Fang J, et al. Ferrostatin-1 alleviates lipopolysaccharide-induced cardiac dysfunction. Bioengineered. 2021;12(2):9367–9376. doi:10.1080/21655979.2021.2001913
30. Díaz-García E, Nanwani-Nanwani K, García-Tovar S, et al. NLRP3 inflammasome overactivation in patients with aneurysmal subarachnoid hemorrhage. Transl Stroke Res. 2023;14(3):334–346. doi:10.1007/s12975-022-01064-x
31. Sun K, Li YY, Jin J. A double-edged sword of immuno-microenvironment in cardiac homeostasis and injury repair. Signal Transduct Target Ther. 2021;6(1):79. doi:10.1038/s41392-020-00455-6
32. Wang W, Green M, Choi JE, et al. CD8(+) T cells regulate tumour ferroptosis during cancer immunotherapy. Nature. 2019;569(7755):270–274. doi:10.1038/s41586-019-1170-y
33. Condamine T, Ramachandran I, Youn JI, Gabrilovich DI. Regulation of tumor metastasis by myeloid-derived suppressor cells. Annu Rev Med. 2015;66(1):97–110. doi:10.1146/annurev-med-051013-052304
 © 2023 The Author(s). This work is published and licensed by Dove Medical Press Limited. The full terms of this license are available at https://www.dovepress.com/terms.php and incorporate the Creative Commons Attribution - Non Commercial (unported, v3.0) License.
By accessing the work you hereby accept the Terms. Non-commercial uses of the work are permitted without any further permission from Dove Medical Press Limited, provided the work is properly attributed. For permission for commercial use of this work, please see paragraphs 4.2 and 5 of our Terms.
© 2023 The Author(s). This work is published and licensed by Dove Medical Press Limited. The full terms of this license are available at https://www.dovepress.com/terms.php and incorporate the Creative Commons Attribution - Non Commercial (unported, v3.0) License.
By accessing the work you hereby accept the Terms. Non-commercial uses of the work are permitted without any further permission from Dove Medical Press Limited, provided the work is properly attributed. For permission for commercial use of this work, please see paragraphs 4.2 and 5 of our Terms.