")
Back to Journals » Journal of Multidisciplinary Healthcare » Volume 14
COVID-19: Were Public Health Interventions and the Disclosure of Patients’ Contact History Effective in Upholding Social Distancing? Evidence from South Korea
Authors Im J , Kim J, Choeh JY
Received 23 January 2021
Accepted for publication 3 March 2021
Published 22 March 2021 Volume 2021:14 Pages 705—712
DOI https://doi.org/10.2147/JMDH.S303093
Checked for plagiarism Yes
Review by Single anonymous peer review
Peer reviewer comments 7
Editor who approved publication: Dr Scott Fraser
Jongho Im,1 Jewoo Kim,2 Joon Yeon Choeh3
1Department of Applied Statistics, Yonsei University, Seoul, Republic of Korea; 2Department of Apparel, Events, and Hospitality Management, Iowa State University, Ames, IA, USA; 3Department of Software, Sejong University, Seoul, Republic of Korea
Correspondence: Joon Yeon Choeh
Department of Software, Sejong University, 209 Neungdong-ro, Gwangjin-gu, Seoul, Republic of Korea
Tel +82-2-3408-3887
Email [email protected]
Background: The coronavirus disease 2019 (COVID-19) pandemic has prompted a global-scale public health response. Social distancing, along with intensive testing and contact tracing, has been considered an effective vehicle to reduce new infections. In this study, we aimed to estimate the effect of South Korean public health measures on behavioral changes with respect to social distancing without a nationwide lockdown. The results of this study may provide insights to countries who are planning to relax their aggressive restrictions though still having an unflattened curve of infections.
Methods: To estimate how the closure of educational and social welfare facilities and the disclosure of confirmed patients’ contact history affected social distancing behaviors, we analyzed public transportation data in Seoul, Korea. For the modeling analysis, we used linear mixed-effects estimation.
Results: Our estimation showed that the average daily number of bus passengers decreased by 21.8% in February 2020 as compared to the previous year with an additional decrease observed in the areas around educational and social welfare facilities. The highest drop in the daily number of passengers was observed in areas with religious facilities. We also found that individuals avoided areas that were proximate to or within the locations that constituted the confirmed patients’ contact history.
Conclusion: Our results demonstrate that public health measures can lead people to practice social distancing. Among them, the measures that strongly encourage voluntary social distancing behaviors would play a critical role in suppressing the infections as it becomes increasingly difficult to continue imposing aggressive restrictions due to practical and economic reasons.
Keywords: COVID-19, social distancing, information disclosure, contact history, public transportation
Introduction
Since the first outbreak of the coronavirus disease 2019 (COVID-19) in December 2019, this contagious respiratory disease became a global pandemic due to its wide and rapid spread across almost every country.1 In the absence of treatments and vaccines for COVID-19, the pandemic led to the unprecedented health and economic crisis.2,3 Accordingly, governments all over the world are earnestly imposing strict case isolation, contact tracing, and/or social distancing measures to reduce the transmission of this pandemic. While the number of infections continues to rise rapidly, some countries such as Australia, Georgia, and Taiwan have the flattened curve of new infections, drawing great attention of global public health experts. Among such countries, South Korea was distinctively one of the hard-hit countries outside China and had a peak of 909 new infections in a single day. Two months after the peak, South Korea has managed the daily infections to single digits. Moreover, the mortality rate in South Korea is one of the lowest in the world, at 2.23%. More interestingly, such progress in the containment of the pandemic was made without a nationwide lockdown. South Korea is considerably a good example to many countries that are facing the unprecedented challenge of lifting lockdowns for the sake of their respective economy despite not having full control over the pandemic. Therefore, it is of great importance to explore public health measures implemented in South Korea for the control of the pandemic.
Immediate and widespread testing with drive-through stations and aggressive technology-based contact tracing played a pivotal role in controlling the pandemic effectively in South Korea.4 Aside from these measures, social distancing was recognized as another key factor in driving the reduction in transmission of new infections.4 Avoiding wide-scale restrictions on business, social, and religious activities, the South Korean government focused on social distancing measures that could prevent mass gatherings5,6 (see Table 1). However, rigorous research regarding these government efforts on social distancing is scarce. Hence, this study aims to investigate the effectiveness of two social distancing measures: 1) closure of educational and social welfare facilities and 2) disclosure of confirmed patients’ contact history.
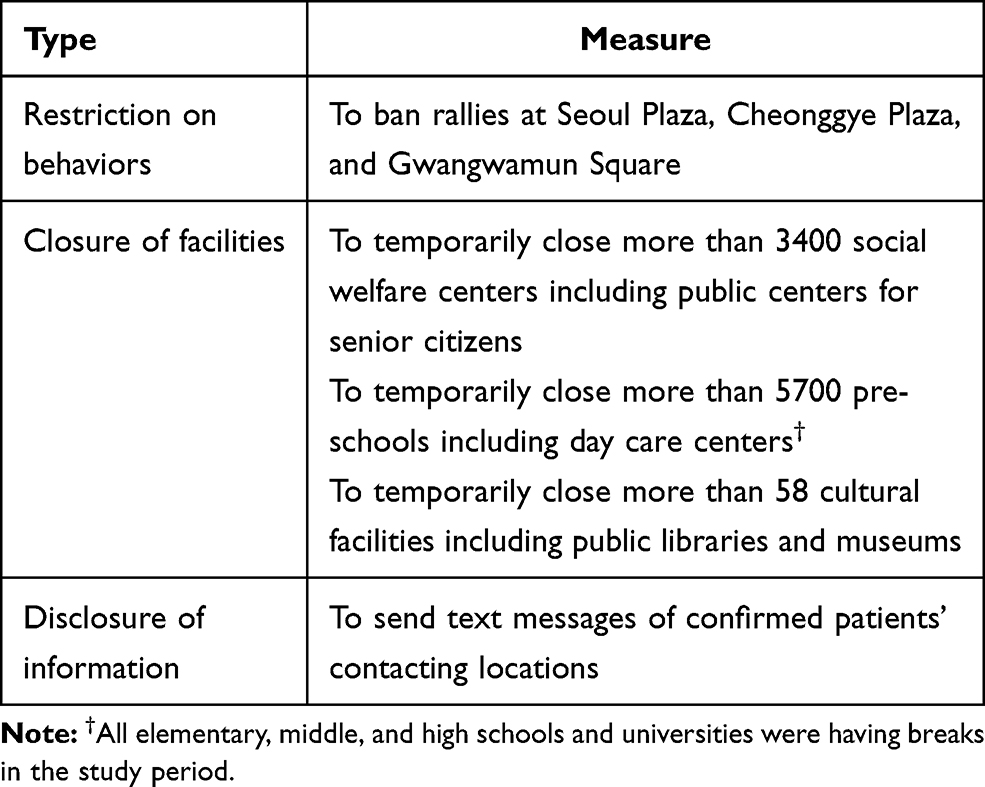 |
Table 1 Social Distancing Measures In Seoul |
Methods
Data
To measure and/or construct the parameters of the model, we collected data from the Seoul Open Data Service,7 the Korea National Spatial Data Infrastructure Portal8 and the COVID-19 Korea Dataset.9 These publicly available raw data are inconsistent in data types and shapes, which makes them difficult to use for data modeling.10 Therefore, we conducted data cleaning and preprocessing to convert the raw data into an analyzable form for rigorous research. The final sample consists of 3442 bus stops. Our study focused on a 10-day period from February 17 to February 26, 2020, during which the government raised the alert level of COVID-19 to the highest and instituted several public health measures due to local mass infections. The datasets used for this analysis are available in the data repository.11
Model
We employed a linear mixed-effects analysis to explore the effectiveness of the closure of educational and social welfare facilities and the disclosure of patients’ contact history. The model is formulated as follows:
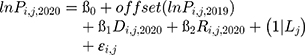
where i denotes bus stop and j denotes location characteristics; offset denotes an offset; P2019 and P2020 are the bus passenger flow in 2019 and 2020, respectively; D is the proximity of bus stops to confirmed patients’ contacting locations; R is the number of contacting locations near bus stops; L is the random effects of the location characteristics of bus stops and is independent and identically distributed (IID; 0, σγ2);  is IID (0, σε2); and Lj and εi,j are independent of each other. A more detailed description of the main parameters is shown in Table 2.
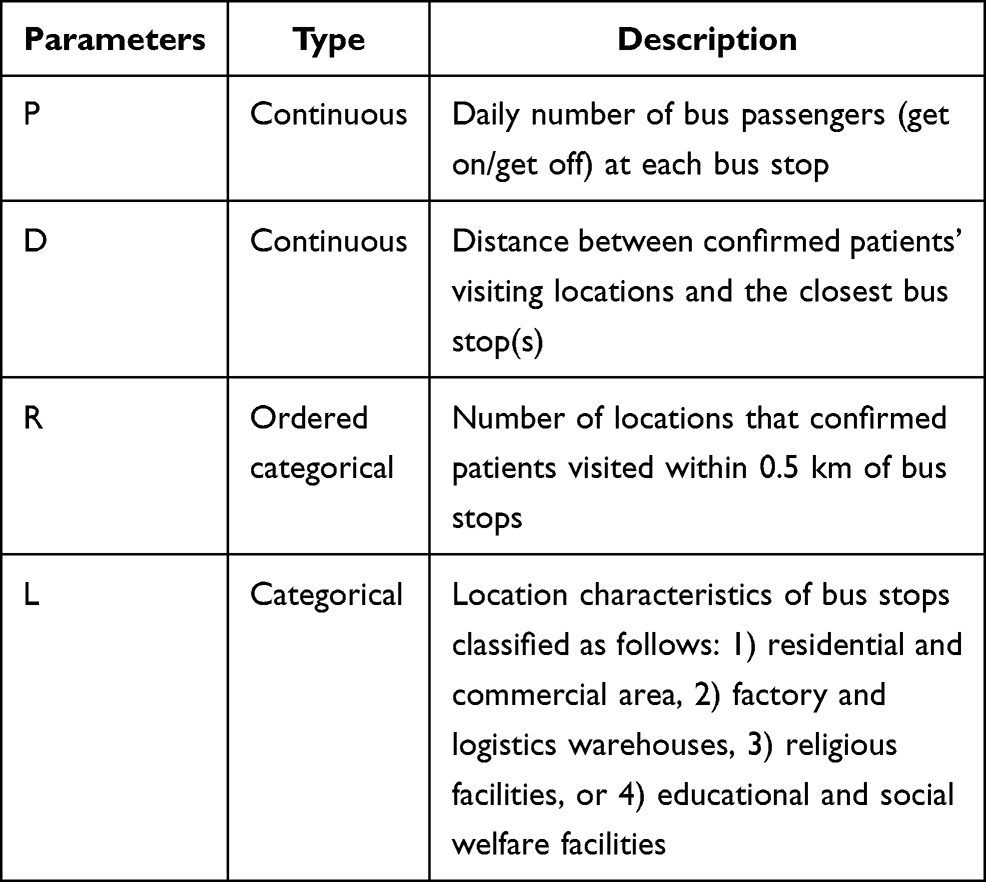 |
Table 2 Description of Parameters |
Bus Passenger Flow (P)
The bus passenger flow (P) shows the daily number of passengers who get on and off at each stop in Seoul. For this parameter, this study used the bus transportation data that include the geographical coordinates of bus stops and daily passenger flow information. There are 13,258 bus stops in Seoul, which means that bus stops are densely distributed so that each bus stop covers only 240m2 on average. In addition, given that the modal share of bus transportation accounts for more than 30% in Seoul,12 bus passenger flow is appropriate for capturing the changes in the floating population and is therefore employed as a proxy for the extent of social distancing.
Proximity to Contacting Locations (D) and Contacting Location Counts (R)
The contacting route-related parameters D and R were examined to check whether the disclosure of detailed information on the contact history of confirmed patients was effective in preventing social gathering in potential infectious areas. The original purpose of this information disclosure is to facilitate contact tracing by allowing citizens to check whether they are exposed to the risk of being infected. The additional benefit of information disclosure is to help citizens avoid areas that were considered risky. Our analysis of the social distancing effect of this measure was conducted in two ways. First, we investigated how bus passenger flow (P) changed at bus stops according to their proximity to the locations where confirmed patients had contact history (D). Second, we looked at how bus passengers (P) responded to the route information on the number of contacting locations near bus stops (R).
Random Effects: Location Characteristics of Bus Stops (L)
Location characteristics (L) around bus stops serve as the random effects of our model. We investigated them to see how bus passenger flow changed according to location characteristics after social distancing interventions such as the closure of educational and social welfare facilities were implemented. The location characteristics were determined using the information of approximately 500,000 buildings, including their intended use, site areas, total square footage of floor areas, and geographical coordinates. First, we spotted the buildings that passengers could visit from each bus stop. The total distance from the previous stop of the focal stop to the next stop of the focal stop was set as the range for the focal stop. All buildings within this range were matched with the focal stop. The range of each bus stop may overlap with those of neighboring stops under the assumption that passengers could use different bus stops to go to specific places for their convenience. As a result, buildings could be matched with more than one bus stop. Also, the buildings outside the range were assigned to the nearest bus stop. Figure 1 shows the building matching process.
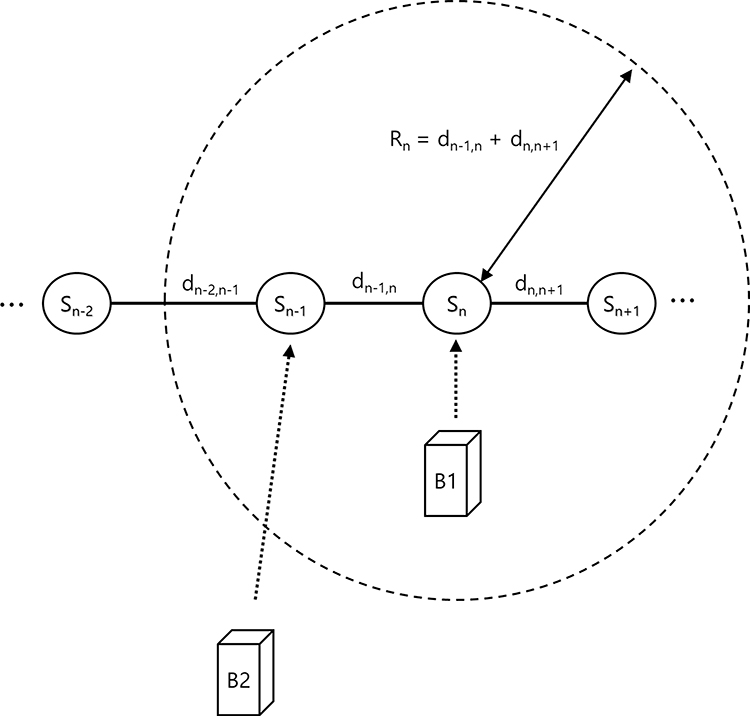 |
Figure 1 Process of matching buildings with bus stops. |
After completing the matching process, we identified the location characteristics of each bus stop using the intended use of buildings near the stops. For simplicity, the types of intended use were summarized in four categories: residential and commercial areas, factory and logistics warehouses, religious facilities, and educational and social welfare facilities. In terms of the square footage of buildings’ floor areas, the proportion of individual categories was computed for each bus stop. When a specific category exceeded 70% of the total square footage of floor areas within the range of a bus stop, the bus stop was classified as the category. Otherwise, bus stops were excluded from the sample.
Results
Figure 2 reports plots of fitted values and residuals. The log-scaled 2020 bus passengers, P2020, were well explained by the proposed model having log-scaled 2019 bus passengers, P2019, as offset. In addition, residual plots show that the required assumptions for the model are well preserved except for some outliers. The additional analysis of the plots indicates that these outliers are closely associated with a certain location characteristic of bus stops.
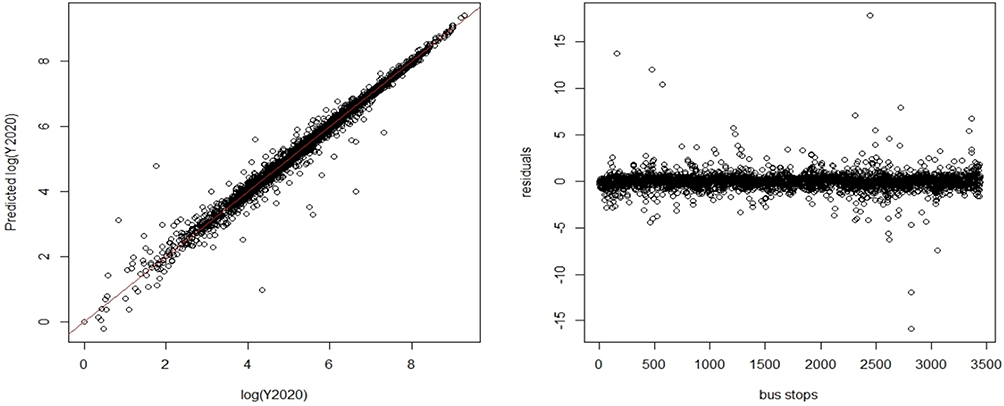 |
Figure 2 Plots of fitted values and residuals. |
The estimated fixed- and random-effects are presented in Tables 3 and 4, respectively. According to the results of the fixed-effects intercept (ß0), the average daily number of bus passengers in 2020 decreased by 21.7% compared to the previous year, and the decrease was statistically significant. This result indicates that social distancing was substantially practiced by citizens and that government’s public health measures could potentially contribute to such behavioral changes. The coefficient of proximity to contacting locations (D) was statistically significant, meaning that citizens avoided locations proximate to the routes where confirmed patients had contact history. This implies that the disclosure of the patients’ contact history was effective in preventing citizens from gathering in risky areas. However, considering the p-value associated with the estimate of R that was marginally less than the 0.05 level, the number of patients’ contacting locations might not be a critical factor for the decline in the number of bus passengers. Additionally, the inconsistent results on this parameter were found with different observation periods. Drawing from these results, we note that passengers took precautions considering how risky bus stops might possibly be based on their proximity to the locations where confirmed patients had contact history rather than on how many such contacting locations were near bus stops.
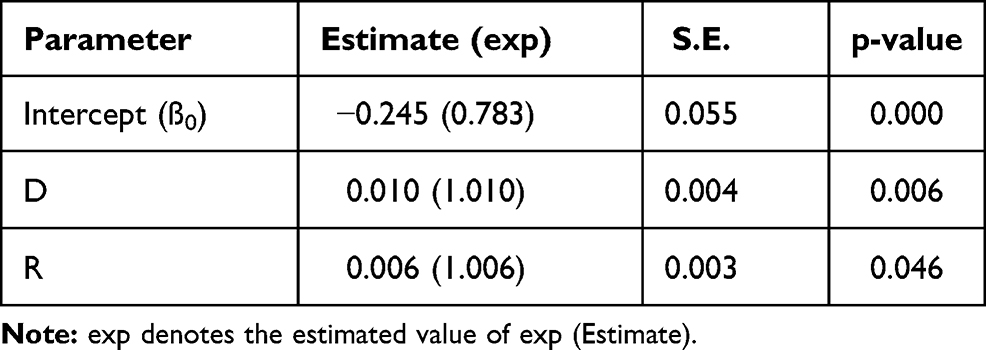 |
Table 3 Estimated Fixed Effect |
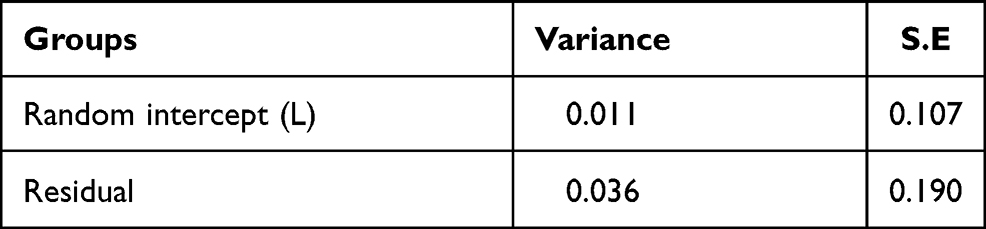 |
Table 4 Estimated Random Effects |
Our linear mixed-effects model is essentially a random intercepts model, where all responses in a location characteristic category are additionally shifted by the fixed intercept specific to the location category. The variance of the random intercept term (L) in Table 4 indicates how the intercept varied depending on location characteristics. The total effect of individual location characteristics combining both fixed and random effects is presented in Table 5. The intercepts for religious facilities and educational and social welfare facilities were shifted downward by 10.7% and 2.8%, respectively. These results mean that bus stops where these facilities were concentrated had greater decreases in passenger flow than the average decline rate of passenger flow (−21.7%). The decreased number of passengers in religious facilities is understood as the active voluntary involvement of religious institutions in government social distancing campaigns that appeal to reducing gatherings. The South Korean government particularly emphasized the importance of the participation of religious institutions in social distancing due to the mass infections related to a religious cult that accounted for more than 40% of total cases (5212 cases). The other result on educational and social welfare facilities implies that the closure of such facilities effectively halted personal interactions. On the other hand, the intercept for factories and logistics warehouses was shifted upward by 0.138, which was 14.8% greater than the average decline rate. The increased number of passengers indicates that the need for delivery services grew in the period. This may imply that many citizens voluntarily stayed at home in line with their government’s social distancing measures. This created a demand for delivery services. However, there was no substantial change in residential and commercial areas (0.3%).
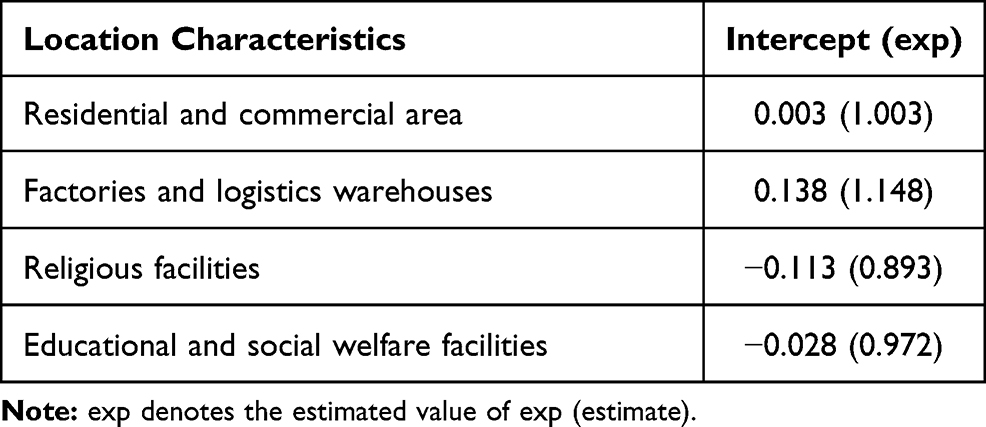 |
Table 5 Estimated Effects of Location Characteristics |
Discussion
COVID-19 is an infectious disease transmitted through direct contact.13,14 Public health measures for reducing the number of physical interactions among people, are essential in controlling the further spread of the disease. Social distancing measures along with personal protective equipment should be emphasized once countries start or decide to lift restrictions for the sake of their respective economy even though they are struggling to flatten the pandemic curve.15 This is because such measures can at least delay the rapid spread and allow the healthcare system to save time and resources intended for expanding capacity in testing and medical treatment. In this challenging period, South Korea provides evidence that the pandemic can be contained with less aggressive restrictions.16 Our analysis empirically shows that many South Korean nationals were engaging in social distancing, and that their engagement could potentially be prompted by social distancing measures set by their respective government.
Figure 3 illustrates the trends in the average daily number of passengers per month from October 2018 to March 2019 and from October 2019 to March 2020. The daily number of passengers per month was similar in the first three months from October to December; the average change in those months between 2018 and 2019 was only 0.15%. However, the number of passengers started to decrease from January 2020 when the South Korean government raised the alert level to the second highest level as the first confirmed case of COVID-19 was reported on January 20, 2020. The number of passengers in 2020 was 5.89% lower than that in 2019. The gap between the two passenger datasets continued to widen as the number of passengers in 2020 continued to plunge in the following months when the government strongly imposed social distancing measures and raised the alert level to the highest: −9.46% in February and −29.24% in March. Figure 4 depicts the growth rates of average daily number of bus passengers over the study period in comparison to the previous year. Note that bus passenger flow declined across all regions of Seoul. The average reduction rate was 21.7%.
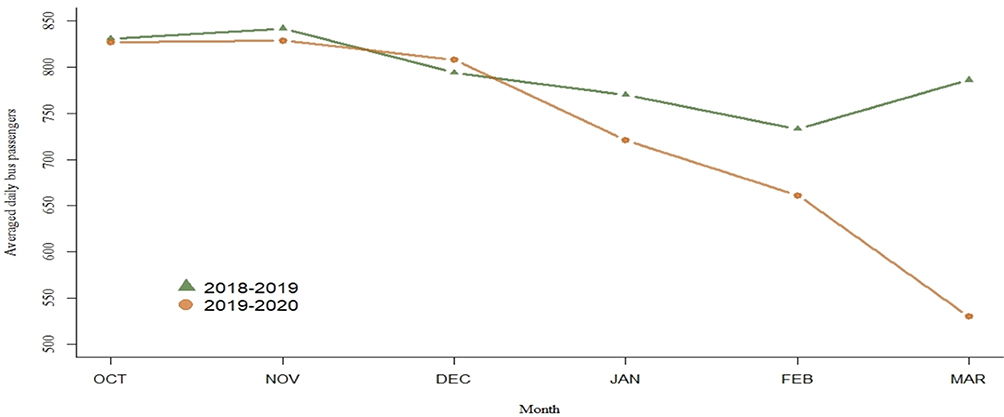 |
Figure 3 Average daily Seoul bus passengers in October 2018 –March 2019 and October 2019–March 2020 . |
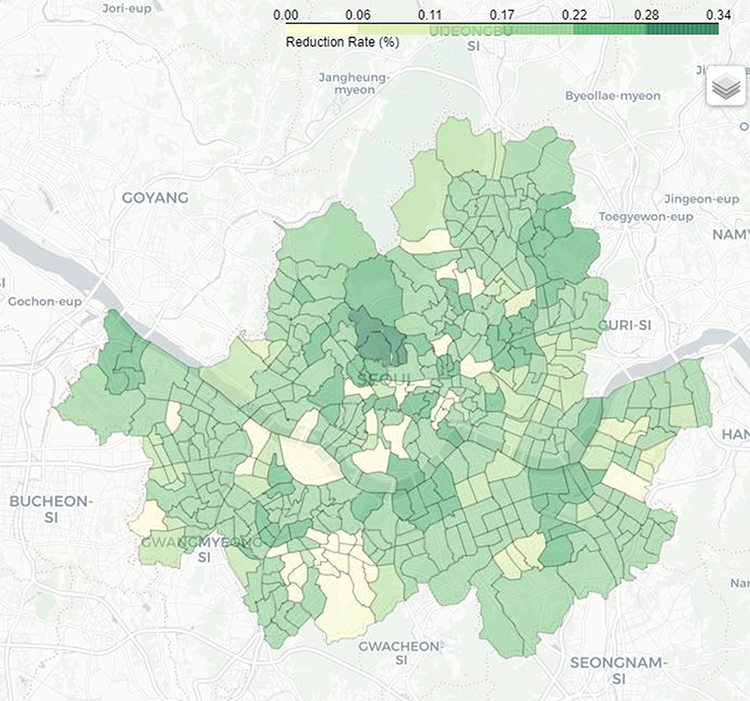 |
Figure 4 Growth rates of the average daily Seoul bus passengers in the study period. |
Our analysis revealed that the closure of educational and social welfare facilities and the disclosure of confirmed patients’ contacting locations led to significant decreases in bus passenger flow. The former result on facility closure indicates that government interventions were effective in compelling social distancing. On the other hand, the latter result on information disclosure implies that the measure effectively encouraged voluntary civic engagement in social distancing. Given that the South Korean government strongly campaigned for social distancing in mass gathering facilities, the result of the decreased passenger flow in religious facilities demonstrates that such voluntary behavioral changes were induced by government relentless efforts. With the flattened infection curve, these results highlight that social distancing measures have effectively reduced the spread of the pandemic by preventing physical contacts. Thus, it is recommended that governments should keep encouraging social distancing practices among citizens for the control of the pandemic through public health measures and public participation campaigns.
Furthermore, our result regarding the increased flow in factory and warehouse areas may be attributable to the voluntary participation of citizens to stay at home that required reliance on delivery services. This finding shows that pandemic-induced changes in consumption patterns lead economic activity to be concentrated in particular areas, thus making the areas vulnerable to the pandemic. Recognizing this potential pandemic risk from active social distancing practices, policy makers are advised to impose stringent public health measures on business facilities (eg, warehouse, face mask factories) that benefit from the pandemic in order to minimize inevitable mass gathering resulting from vibrant business activity.
These social distancing measures in South Korea might not be applicable to other countries. In particular, the disclosure of confirmed patients’ contact history is very controversial and could generate personal privacy issues. To institute this measure, it is critical to fairly evaluate the social benefits of disclosing personal information while protecting personal privacy and to construct a strict approval process for the use of personal information. Most of all, a concrete consensus on this issue should be established within a country before adopting such measure.
Our study is not free from limitations. First, we indirectly measured the disclosure of patients’ contact history with two proxies: the minimum distance between bus stops and patients’ contacting locations, and the number of contacting locations near bus stops. These parameters may fail to capture the effect of distancing measures when there is a substantial delay in information disclosure that could create discrepancies between information disclosure dates and actual contact. Moreover, the location characteristics of bus stops are exposed to measurement error as it is specified with the main intended use of nearby buildings. It is particularly difficult to specify the primary location characteristics of bus stops in downtown areas where buildings with various intended uses are mixed. To obtain more accurate results, it is necessary to remove this confounding factor. Finally, it would be worthwhile to investigate the effect of moderating variables (eg, main passenger groups’ ages, population density) on the relationship between the pandemic and social distancing.17
In conclusion, public health measures have a strong potential in reducing physical interactions, the number of new infections, and the mortality rate. While some social distancing interventions, including facility closures, can prevent mass gathering by restricting individual behaviors, other measures such as the disclosure of contacting locations and public campaigns can effectively prompt individuals to reduce physical interactions with other people. Our findings suggest that public health actions that lead to voluntary social distancing can be a viable option to delay the spread of the virus under the new normalcy that people should return to normal life amid the COVID-19 crisis and in the absence of medical treatments and vaccines.
Funding
The authors disclosed receipt of the following financial support for the research, authorship, and/or publication of this article: This work was supported by the National Research Foundation of Korea grant funded by the Korea government. [grant numbers NRF-2017S1A5B6053101, NRF-2018R1D1A1B07045220].
Disclosure
The authors declare that there is no conflict of interest.
References
1. Sun Z, Yang B, Zhang R, Cheng X. Influencing factors of understanding COVID-19 risks and coping behaviors among the elderly population. Int J Environ Res Public Health. 2020;17(16):5889. doi:10.3390/ijerph17165889
2. Kim J, Kim J, Wang Y. Uncertainty risks and strategic reaction of restaurant firms amid COVID-19: evidence from China. Int J Hospitality Manage. 2021;92:102752. doi:10.1016/j.ijhm.2020.102752
3. Xing C, Zhang R. COVID-19 in China: responses, challenges and implications for the health system. Healthcare. 2021;9(1):82. doi:10.3390/healthcare9010082
4. Colbourn T. COVID-19: extending or relaxing distancing control measures. Lancet Public Health. 2020;5(5):236–237. doi:10.1016/S2468-2667(20)30072-4
5. Anderson RM, Heesterbeek H, Klinkenberg D, Hollingsworth TD. How will country-based mitigation measures influence the course of the COVID-19 epidemic? Lancet. 2020;395(10228):931–934. doi:10.1016/S0140-6736(20)30567-5
6. Park S, Choi GJ, Ko H. Information technology–based tracing strategy in response to COVID-19 in South Korea—privacy controversies. JAMA. 2020;323(21):2129–2130. doi:10.1001/jama.2020.6602
7. Seoul Open Data Service. Seoul City Bus Boarding Data. Available from: http://data.seoul.go.kr/.
8. Korea National Spatial Data Infrastructure Portal. The integrated legister of building of Korea. Available from: http://www.nsdi.go.kr.
9. COVID-19 Korea Dataset. COVID-19 Korea Dataset with patient routes and visualizer. Available from: https://github.com/ThisIsIsaac/Data-Science-for-COVID-19.
10. Breiman L. Statistical modeling: the two cultures. Stat Sci. 2001;16(3):199–231. doi:10.1214/ss/1009213726
11. Data for COVID-19: Were Public Health Interventions and the Disclosure of Patients’ Contact History Effective in Upholding Social Distancing? Evidence from South Korea. Available from: https://github.com/joon425/covid-19/.
12. Seoul Research Data Service: Seoul and the world's largest cities-comparison of city changes after the millennium. Available from: http://data.si.re.kr/2015br10-modal-share.
13. Imran E, Khurshid Z, Al Qadhi AA, Al-Quraini AA, Tariq K. Preprocedural use of povidone-Iodine mouthwash during dental procedures in the COVID-19 pandemic. Eur J Dent. 2020;14(1):182–184. doi:10.1055/s-0040-1717001
14. Khurshid Z, Asiri FY, Al Wadaani H. Human saliva: non-invasive fluid for detecting novel coronavirus (2019-nCoV). Int J Environ Res Public Health. 2020;17(7):2225. doi:10.3390/ijerph17072225
15. Zaheer R, Khan M, Tanveer A, Farooq A, Khurshid Z. Association of personal protective equipment with de novo headaches in frontline healthcare workers during COVID-19 pandemic: a cross-sectional study. Eur J Dent. 2020;14(1):S79–85. doi:10.1055/s-0040-1721904
16. Lu N, Cheng KW, Qamar N, Huang KC, Johnson JA. Weathering COVID-19 storm: successful control measures of five Asian countries. Am J Infect Control. 2020;48(7):851–852. doi:10.1016/j.ajic.2020.04.021
17. Roma P, Monaro M, Muzi L, et al. How to improve compliance with protective health measures during the COVID-19 outbreak: testing a moderated mediation model and machine learning algorithms. Int J Environ Res Public Health. 2020;17(19):7252. doi:10.3390/ijerph17197252
 © 2021 The Author(s). This work is published and licensed by Dove Medical Press Limited. The
full terms of this license are available at https://www.dovepress.com/terms.php
and incorporate the Creative Commons Attribution
- Non Commercial (unported, v3.0) License.
By accessing the work you hereby accept the Terms. Non-commercial uses of the work are permitted
without any further permission from Dove Medical Press Limited, provided the work is properly
attributed. For permission for commercial use of this work, please see paragraphs 4.2 and 5 of our Terms.
© 2021 The Author(s). This work is published and licensed by Dove Medical Press Limited. The
full terms of this license are available at https://www.dovepress.com/terms.php
and incorporate the Creative Commons Attribution
- Non Commercial (unported, v3.0) License.
By accessing the work you hereby accept the Terms. Non-commercial uses of the work are permitted
without any further permission from Dove Medical Press Limited, provided the work is properly
attributed. For permission for commercial use of this work, please see paragraphs 4.2 and 5 of our Terms.