
Back to Journals » ClinicoEconomics and Outcomes Research » Volume 16
Cost-Utility of Real-Time Continuous Glucose Monitoring versus Self-Monitoring of Blood Glucose in People with Insulin-Treated Type 2 Diabetes in Spain
Authors Merino-Torres JF  , Ilham S, Alshannaq H, Pollock RF , Ahmed W , Norman GJ
Received 19 June 2024
Accepted for publication 18 October 2024
Published 5 November 2024 Volume 2024:16 Pages 785—797
DOI https://doi.org/10.2147/CEOR.S483459
Checked for plagiarism Yes
Review by Single anonymous peer review
Peer reviewer comments 2
Editor who approved publication: Professor Giorgio Colombo
Juan Francisco Merino-Torres,1 Sabrina Ilham,2 Hamza Alshannaq,2,3 Richard F Pollock,4 Waqas Ahmed,4 Gregory J Norman2
1Endocrinology and Nutrition Department, Health Research Institute La Fe, University Hospital La Fe. Department of Medicine, University of Valencia, Valencia, Spain; 2Dexcom, San Diego, CA, USA; 3University of Cincinnati College of Medicine, Cincinnati, OH, USA; 4Covalence Research Ltd, Harpenden, UK
Correspondence: Richard F Pollock, Covalence Research Ltd., Rivers Lodge, West Common, AL5 2JD, Harpenden, UK, Tel +44 20 8638 6525, Email [email protected]
Objective: Management of advanced type 2 diabetes (T2D) typically involves daily insulin therapy alongside frequent blood glucose monitoring, as treatments such as oral antidiabetic agents are therapeutically insufficient. Real-time continuous glucose monitoring (rt-CGM) has been shown to facilitate greater reductions in glycated hemoglobin (HbA1c) levels and improvements in patient satisfaction relative to self-monitoring of blood glucose (SMBG). This study aimed to investigate the cost-utility of rt-CGM versus SMBG in Spanish patients with insulin-treated T2D..
Methods: The analysis was conducted using the IQVIA Core Diabetes Model (CDM V9.5). Baseline characteristics of the simulated patient cohort and treatment efficacy data were sourced from a large-scale, United States-based retrospective cohort study. Costs were obtained from Spanish sources and inflated to 2022 Euros (EUR) where required. A remaining lifetime horizon (maximum 50 years) was used, alongside an annual discount rate of 3% for future costs and health effects. A willingness-to-pay (WTP) threshold of EUR 30,000 per quality-adjusted life year (QALY) was adopted, based on precedent across previous cost–effectiveness studies set in Spain. A Spanish payer perspective was adopted.
Results: Over patient lifetimes, rt-CGM yielded 9.933 QALYs, versus 8.997 QALYs with SMBG, corresponding to a 0.937 QALY gain with rt-CGM. Total costs in the rt-CGM arm were EUR 2347 higher with rt-CGM versus SMBG (EUR 125,365 versus EUR 123,017). The base case incremental cost–utility ratio was therefore EUR 2506 per QALY gained, substantially lower than the WTP threshold of EUR 30,000 per QALY. The analysis also projected a reduction in cumulative incidence of ophthalmic, renal, neurological, and cardiovascular events in rt-CGM users, with reductions of 16.03%, 13.07%, 7.34%, and 9.09%, respectively.
Conclusion: Compared to SMBG, rt-CGM is highly likely to be a cost-effective intervention for patients living with insulin-treated T2D in Spain.
Keywords: continuous glucose monitoring, CGM, cost-effectiveness, hypoglycaemia, health economics, type 2 diabetes
Introduction
Type 2 diabetes (T2D) is a metabolic disorder that affects over 400 million people worldwide, with this number expected to rise to over 700 million by 2045.1 In Spain, the prevalence of T2D is estimated to be 13.8% in the adult population,2 although data on the current incidence of T2D in Spain is limited.3,4 The impacts of the disease can vary, however available clinical evidence shows that patients living with T2D can have a reduced quality of life (QoL).5 Furthermore, these patients are also likely to experience multiple related co-morbidities6 and experience higher mortality risks than individuals without diabetes.1,7 Clinical complications have been found to translate into higher costs, with a 2015 study set in Spain finding patients with T2D to have 72.4% higher annual average direct medical costs per patient than non-diabetic individuals (3110.1 Euros [EUR] versus EUR 1803.6, respectively).8 The factors with the greatest impact on these costs were hospitalizations and medications, demonstrating that effective disease management can be paramount for minimizing the financial burden associated with T2D.8
For patients with insulin-treated T2D, regular monitoring of blood glucose levels and glycated hemoglobin (HbA1c) levels can be essential for ensuring optimal disease management.9 Self-monitoring of blood glucose (SMBG) is a well-established and systematic approach to monitoring blood glucose levels that allows daily glycemic patterns to be identified.10 The clinical outcomes associated with SMBG use have been investigated in multiple randomized trials involving T2D patients using insulin.11,12 More recently, the emergence of continuous glucose monitoring (CGM) systems has helped alleviate the burden of repeated, manual monitoring (ie, using fingerstick testing) associated with SMBG. Real-time CGM (rt-CGM) is an advanced form of glucose monitoring that provides users with “real-time” (every 1–5 minutes) data on current blood glucose levels, as well as the direction of change relative to previous readings.13,14 These devices can also issue high and low alarms that inform the user when their blood glucose levels lie outside of a present threshold.15 Additionally, rt-CGM devices feature a graphical display of glucose trends showing whether blood glucose levels are steady, increasing or decreasing. A growing number of randomized controlled trials (RCTs) have investigated the clinical benefits of these new technologies versus SMBG. Specifically, results from the DIAMOND and MOBILE trials showed that CGM led to improved glycemic outcomes relative to SMBG for patients with T2D.16,17
The availability of data from large-scale, real-world studies investigating the clinical benefits of rt-CGM relative to SMBG is also growing. One such study (based in the United States [US]) included 36,080 patients with insulin-treated T2D and found that rt-CGM led to comparatively greater reductions in the HbA1c levels of participants compared to SMBG (−0.56% for rt-CGM and −0.09% for SMBG).18 The same study found that rates of hypoglycemic events (ie, those events leading to emergency room visits or hospitalizations) were comparatively lower with rt-CGM use than with SMBG.
There is a significant financial burden associated with the management of insulin-treated T2D in Spain.3,19 Consequently, there is a pressing need to identify the most cost-effective interventions to ensure the optimal allocation of Spanish healthcare payers’ financial resources. While rt-CGM may result in incremental clinical and health outcome benefits for patients living with insulin-treated T2D, these benefits must be weighed against any additional costs incurred relative to existing interventions (ie, SMBG). Previous studies have found rt-CGM to be cost-effective relative to SMBG in patients with T2D receiving insulin therapy across various settings, including Canada,20 the United Kingdom (UK),21 and France.22 However, no such analysis has yet been conducted in the population of interest within the Spanish setting, although a comparative cost-only analysis of a flash glucose monitoring device (ie, the FreeStyle Libre 2) versus SMBG has been conducted.23
The objective of this study was therefore to conduct a cost-utility analysis of rt-CGM versus SMBG, in patients living with insulin-treated T2D in Spain.
Methods
Model Structure
This analysis was conducted using the IQVIA CORE Diabetes Model (CDM, V9.5) to evaluate the cost-utility of rt-CGM versus SMBG in patients with insulin-treated T2D in Spain. The CDM has been extensively validated and is designed to estimate the cost-effectiveness of various diabetes management strategies.24–26 The model allows for adaptations to be made in order for various country and region-specific care settings to be adopted. The CDM has been used in numerous health technology appraisals conducted in the UK and subject to extensive scrutiny from the National Institute of Health and Care Excellence (NICE) in evaluating the cost-effectiveness of strategies for the management of type 1 diabetes (T1D)27 and T2D.28,29 The CDM structure comprises 17 inter-dependent Markov models that interact where and when appropriate in order to predict health outcomes and costs of diabetes care interventions over long-term time horizons.30 Each sub-model consists of between two and nine different health states, with built-in equations used to predict progression of risk factors such as HbA1c, systolic and diastolic blood pressure, estimated glomerular filtration rate (eGFR) and total cholesterol levels. The cardiovascular risk prediction equations used for the base case analysis were sourced from the United Kingdom Prospective Diabetes Study (UKPDS) Outcomes Model.31 The model also contains clinical data that inform the probabilities of the onset of diabetes-related microvascular complications and event-specific mortalities. Further details on the CDM can be found in Palmer et al.26
In the present analysis, key outputs from the CDM included life expectancy (LE), quality-adjusted life years (QALYs),32 direct and indirect costs, cumulative incidence of diabetes-related complications, and incremental cost-utility ratios (ICURs). The final ICURs were calculated by dividing the incremental costs by the incremental QALYs, to determine a “cost per QALY gained” with rt-CGM versus SMBG.33
Baseline Cohort Characteristics and Treatment Effects
For the simulated patient cohort, key baseline characteristics were obtained from a large-scale, US-based study that investigated the clinical outcomes of rt-CGM initiation in 41,753 participants with insulin-treated diabetes.18 Of the 41,753 participants, 36,080 had T2D. A summary of patient cohort characteristics is outlined in Table 1, with a more detailed breakdown presented in Supplementary Table S1. Briefly however, at baseline, the patient cohort had a mean HbA1c level of 8.3% (±1.6%), a mean age of 64.5 years (±12.2 years) and a mean body mass index of 33.4 kg/m2 (±7.5 kg/m2). The cohort had lived with diabetes for a mean period of 16 years (±8.8 years), and 50.5% of simulated patients were male. Regarding racial and ethnic groups, 43% of the simulated patient cohort were White, 21.6% were Hispanic, 17.9% were Asian, and 10.5% were Black. The remaining 7% of modelled patients were Native American.18 For any baseline characteristics that were not available from the US-based study, the default CDM values (based on the ACCORD trial) were used instead.34,35
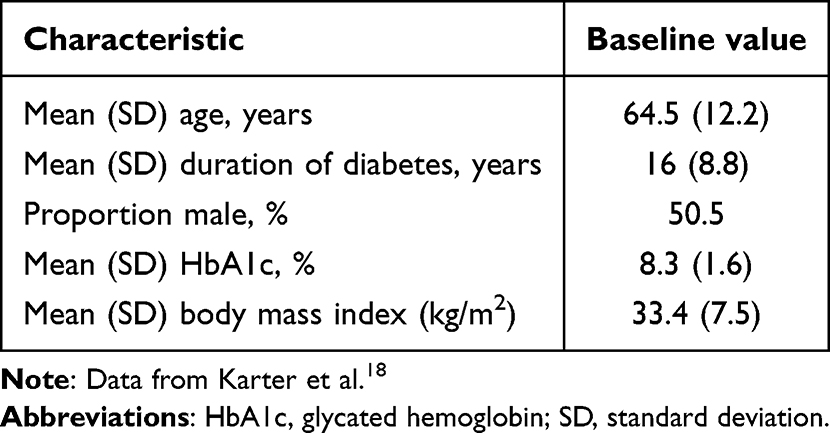 |
Table 1 Baseline Characteristics of the Simulated Patient Cohort |
A reduction in HbA1c of 0.56% (favoring rt-CGM) was adopted for the treatment effect based on the adjusted mean difference between rt-CGM and SMBG in the same US-based retrospective cohort study used to source cohort baseline characteristics.18 This reduction was assumed to be sustained for two additional years after the first year in the rt-CGM arm, with the rationale for this assumption stemming from longitudinal study evidence, where glycemic improvements were shown to persist for up to 10 years.36–38 The annual modeled increase of HbA1c in the SMBG arm after the first year and in the rt-CGM arm after the third year was identical ie, +0.15 units per annum (based on the CDM default clinical table).
Severe hypoglycemic event (SHE) rates and severe hyperglycemic event (assumed to be diabetic ketoacidosis [DKA]) rates were determined using emergency room visits or hospitalizations recorded by Karter et al.18 For SHE, there were 0 and 4 events per 100 patient years calculated for RT-CGM and SMBG, respectively. For DKA, there were 0 and 2.5 events per 100 patient years calculated for RT-CGM and SMBG, respectively.
Costs
Where necessary, costs used for this analysis were inflated to EUR 2022 values using the Harmonized Index for Consumer Prices: Health for Spain.39 Only direct medical costs associated with each intervention were incorporated within the model, with published sources used to identify costs related to concomitant therapies and screening. A recently conducted cost-effectiveness analysis of oral semaglutide set in Spain was used to identify the majority of diabetes-related complication costs,40 with a full list of these costs outlined in Supplementary Table S2. A guidance document for T2D management published by the National Institute for Health and Care Excellence (NICE) was used to source data on drug therapies typically utilized for primary and secondary prevention of cardiovascular and microvascular disease.41 This document was also used to identify screening rates for ocular and renal disease.
The summarized annual costs and equipment usage for each intervention can be found in Supplementary Table S3. Annual treatment costs specific to rt-CGM therapy were based on the Dexcom ONE system price in Spain, and comprised one receiver, four transmitters, and 36 sensors. No value added tax was factored into the final costs, which amounted to EUR 1100. For SMBG, a cost of EUR 0.29 per test strip was used (again based on the current price listings in Spain), which when considering an assumed 1387 tests per annum, resulted in a final annual cost of EUR 402. The 1387 annual test figure was calculated using data sourced from the DIAMOND T2D trial, wherein participants used an average of 3.8 tests per day.16
Utilities
All utility and disutility parameters are presented in Supplementary Table S4. For T2D without any associated complications, a utility value of 0.785 was modeled. This value (which is the default value used in the CDM) originated from a review of utility values for economic modelling in T2D, conducted by Beaudet et al.42 The same study was used to source the majority of utilities and disutilities associated with diabetes-related complications as well as adverse events occurring due to diabetes treatment. A published cost-effectiveness analysis of flash glucose monitoring set in China was used to source one event-related disutility figure, namely a 0.0367 decrement associated with DKA in patients living with T1D.43
A utility benefit of 0.03 was assumed for patients modelled within the rt-CGM arm, based on the avoidance of frequent, daily fingerstick testing associated with SMBG. This figure was sourced from Matza et al,44 a time trade-off study that investigated the difference in utilities associated with alternative blood glucose monitoring approaches. The present analysis additionally considered the avoidance of fear of hypoglycemia (FoH), and the subsequent impact this phenomenon could have on the QoL of the modeled patient cohort, as the prevalence of FoH in patients living with insulin-dependent T2D has been estimated to range between 27.7% and 34%.45,46 An avoidance of FoH utility value of 0.02536 was therefore also assumed for the rt-CGM group, which when combined with the avoidance of fingerstick testing utility gain, yielded an overall rt-CGM specific utility benefit of 0.05536. This assumption was based on the inclusion of alarm features in rt-CGM devices that are expected to reduce hypoglycemia event occurrence (and therefore FoH) in patients. Briefly, the 0.02536 figure was determined by obtaining respondent scores from the Hypoglycemia Fear Survey conducted as part of the DIAMOND trial,47 before mapping said data to the EQ-5D using modelling approaches outlined in Currie et al.48
Time Horizon, Perspective, and Discounting
The base case analysis was conducted over a remaining lifetime horizon (with a maximum of 50 years) and adopted a Spanish payer perspective. Future costs and effects were discounted annually at a rate of 3%, based on guidelines issued by the European network for Health technology Assessment (EUnetHTA).49 No official willingness-to-pay (WTP) threshold currently exists in Spain, however EUR 30,000 per QALY is a commonly cited figure across numerous cost-effectiveness studies within this setting.50,51 Therefore, this analysis also adopted a EUR 30,000 per QALY WTP threshold.
Sensitivity Analyses
The base case analysis was conducted as a probabilistic sensitivity analysis (Figure 1). A wide range of sensitivity analyses were also conducted to explore the impacts of potential variations across numerous model parameter values. These analyses would additionally identify which of the model parameters led to the largest variations in key model outputs, such as QALYs, costs, and subsequent ICUR values. The HbA1c treatment effect (modeled as −0.56% in favor of rt-CGM in the base case), was one such model parameter that was investigated. The chosen variations of ±30% (to −0.728% and −0.392%) and ±40% (−0.784% and −0.336%) were informed by treatment efficacies observed in T2D participant populations as part of the DIAMOND16 and MOBILE trials.17
 |
Figure 1 Cost-effectiveness scatterplot from the probabilistic base case analysis. Abbreviations: EUR, Euro; WTP, willingness-to-pay. |
The base case values for parameters representing QoL benefits associated with the rt-CGM intervention (ie, the combined 0.05536 utility value comprising avoidance of fingerstick testing [AFS] and FoH) were also altered. The modeled scenarios included: −50% AFS benefit (utility: 0.04), +50% AFS benefit (utility: 0.07), no FoH benefit (utility: 0.03), −50% FoH benefit (utility: 0.0425), and finally no FoH or AFS benefit (utility: 0.00).
For SHE in the SMBG arm (which considered 4 SHE per 100 patient years in the base case analysis), the rate was altered by ±50% (ie, 6 SHE and 2 SHE per 100 patient years). However, based on the rationale for the FoH utility incorporation, a 50% reduction in SHE in the SMBG arm would likely lead to an adjacent 50% reduction in FoH utility experienced in the rt-CGM arm. Therefore, the FoH utility value for rt-CGM was 0.0425 within the scenario where a 50% reduction in SHE in the SMBG arm was assumed.
The base case assumption of 3.8 finger-stick tests per day in the SMBG arm was also varied, alternately considering costs associated with 1, 2, 5 and 6 daily tests. Various time horizons were also explored in the sensitivity analyses, with separate analyses conducted over for 1-, 5-, 10-, 20- and 30-year time horizons. Other parameters investigated within the sensitivity analysis included the mean age of the modeled cohort and the duration of diabetes (with the latter also explored as a standalone parameter). Finally, the use of alternative cardiovascular risk prediction equations was also considered—namely the equations from the UKPDS Outcomes Model 8252—as well as varied prices for the rt-CGM system.
Projected Clinical Outcomes
The projected cumulative incidence of diabetes complications was used to derive various measures comparing rt-CGM with SMBG; specifically, the relative risk (RR) and number needed to treat (NNT) were calculated and reported. The NNT represents the number of patients who would need to use rt-CGM rather than SMBG in order for one patient to avoid experiencing the complication of interest over the study time frame.53,54 RRs demonstrate the relative change in risk, irrespective of the absolute incidence. RRs greater than 1 would indicate that the given complication was more likely to occur in patients receiving rt-CGM than in patients receiving SMBG.55,56 Conversely, RRs below 1 indicate that rt-CGM reduced the risk of patients experiencing the given complication.
Results
Over patient lifetimes, rt-CGM was associated with an additional 0.937 QALYs (9.933 QALYs compared to 8.997 QALYs with SMBG). Rt-CGM was also associated with incremental costs of EUR 2347 (EUR 125,365 versus EUR 123,017 with SMBG). The ICUR for rt-CGM versus SMBG was therefore EUR 2506 per QALY gained, falling well below the WTP threshold of EUR 30,000 per QALY. At this WTP threshold, rt-CGM was 75.9% likely to be cost-effective and 44.9% likely to be cost-saving compared with SMBG (see Table 2 and Figure 2).
 |
Table 2 Summary of Base Case Findings |
 |
Figure 2 Cost-effectiveness acceptability curve from the probabilistic base case analysis. Abbreviations: EUR, Euro; QALY, quality-adjusted life year; rt-CGM; real-time continuous glucose monitoring. |
Clinical Outcomes
The cumulative incidence, RR and NNT for each projected diabetes complication is presented in Table 3. Neuropathy and microalbuminuria had the joint lowest NNTs (NNT: 19) followed by background diabetic retinopathy and macular edema (NNT for both: 21). All RRs for rt-CGM versus SMBG were below 1, demonstrating consistently favourable clinical outcomes with rt-CGM. Those complications with the lowest RRs included end-stage renal disease (RR: 0.77), proliferative diabetic retinopathy (RR: 0.78) and gross proteinuria (RR: 0.83). Overall, the analysis projected a reduction in cumulative incidence of ophthalmic, renal, neurological, and cardiovascular events by 16.03%, 13.07%, 7.34%, and 9.09%, respectively, for rt-CGM users.
 |
Table 3 Projected Diabetes Complications for Insulin-Treated Adult Type 2 Diabetes Patients in Spain: Rt-CGM Vs SMBG |
Sensitivity Analyses
The findings of the analysis were sensitive to changes in assumptions around the following parameters: time horizon, number of SMBG tests per day, mean cohort age (and adjacent duration of diabetes), rt-CGM prices, clinical efficacy based on HbA1c changes and varying QoL utilities. Across all 35 scenarios that were explored, results unanimously showed that rt-CGM was either cost-effective or dominant versus SMBG (Table 4).
 |
Table 4 Summary Findings of Sensitivity Analyses: Rt-CGM versus SMBG |
Each stepwise reduction in the time horizon from the baseline maximum of 50 years led to the final ICUR value increasing, with a minimum 1-year time horizon scenario yielding the second-highest positive ICUR across all sensitivity analyses conducted of EUR 9022 per QALY gained.
Changes in assumptions around the number of SMBG tests per day also led to significant changes in the ICUR. A testing frequency of 1 daily SMBG test resulted in the ICUR increasing to EUR 6458 per QALY gained. By contrast, when 6 daily SMBG tests were assumed per day, rt-CGM was cost-saving and therefore the dominant intervention.
Reducing the mean baseline cohort age to 55 years, reduced the ICUR to EUR 602 per QALY gained; larger reductions in the ICUR were observed when the mean cohort age was further reduced to 45 years (ICUR: EUR −2066 per QALY gained) or 35 years (ICUR: EUR −4435 per QALY gained). Rt-CGM was associated with cost savings versus SMBG in these younger cohorts, representing the dominant intervention. Rt-CGM remained dominant when a 1-year duration of diabetes was assumed in combination with the mean cohort age of 45 years.
As rt-CGM prices were incrementally increased by 10%, 15% and 20%, the ICUR also gradually increased but rt-CGM remained cost-effective. Conversely, when rt-CGM prices were decreased, the ICUR also decreased, with rt-CGM becoming cost-saving and therefore dominant with a price reduction of 20% (ICUR: EUR −487.00 per QALY gained).
The ICUR increased to EUR 4020 per QALY gained when the HbA1c effect was reduced by 30%, with a 30% increase in the HbA1c effect leading to the ICUR decreasing to EUR 1549 per QALY gained. Similar effects were observed when the HbA1c effect was decreased or increased by 40%, yielding ICURs of EUR 4412 and EUR 1112 per QALY gained, respectively.
Changes to the rt-CGM-specific utility associated with AFS also led to notable changes in the final ICUR. When this utility benefit was reduced by 50%, the ICUR increased to EUR 3148 per QALY gained, whilst a 50% increase in the AFS utility benefit led to a the ICUR reducing to a value of EUR 2081 per QALY gained. A similar relationship was observed with the FoH utility benefit associated with rt-CGM. Specifically, when the FoH utility benefit was reduced by 50%, the ICUR increased to a value of EUR 3019 per QALY gained. Removing the FoH benefit entirely led to the ICUR further increasing to EUR 3797 per QALY gained. The largest ICUR all scenarios was observed when no utility benefits associated with either FoH or AFS were modeled, yielding an ICUR of EUR 9955 per QALY gained, with rt-CGM still representing a cost-effective intervention at the adopted WTP threshold.
Discussion
This analysis sought to determine the cost-utility of rt-CGM versus SMBG in patients living with insulin-treated T2D in Spain. The results showed that rt-CGM was highly likely to be a cost-effective option relative to SMBG, with the base case ICUR of EUR 2506 per QALY gained falling substantially below the WTP threshold of EUR 30,000 per QALY. The results presented here also align with those from previous analyses set in Canada,20 the UK,21 and France,22 where rt-CGM was found to be cost-effective relative to SMBG.
When uncertainties surrounding clinical and cost parameter values were explored across a range of 35 scenarios, rt-CGM was consistently shown to be either cost-effective or dominant versus SMBG. One key finding showed that as the mean baseline age of the modelled cohort was reduced, the ICUR also decreased, with rt-CGM becoming cost-saving and therefore dominant when the mean age at baseline was either 35 years or 45 years. Assuming these modeled findings would transfer to a real-world setting, the results may have a meaningful effect on the future cost-effectiveness profile of rt-CGM versus SMBG, considering that T2D prevalence is estimated to rise considerably in the near future.1 In particular, incidence and prevalence rates of T2D in young adults, adolescents and children have been observed to be increasing in recent decades, with this trend proving to be consistent across a wide range of patient demographics and ethnicities.57–60 If current global epidemiological trends persist, the mean age of the worldwide T2D patient population will likely decrease over time, potentially further improving the health economic arguments favoring the use of rt-CGM over SMBG in routine practice. Indeed, results from the projected clinical outcomes also show that rt-CGM would likely play an increasingly significant role in helping to reduce the potentially substantial economic burden of T2D-related complications incurred over time for a younger patient cohort. These trends were also present when changes in assumptions regarding the time horizon of the study were explored; over longer time horizons, simulated patients are exposed to differences in glycemic control for longer periods, and therefore have incremental QoL benefits (with comparatively smaller adjacent gains in incremental cost), thus yielding a lower ICUR value and showing rt-CGM to be increasingly cost-effective.
Sensitivity analyses also revealed that the results were sensitive to changes in assumptions on other model parameters such as rt-CGM prices, HbA1c changes, QoL utilities and number of SMBG tests per day. For the SMBG testing frequency parameter, the base case analysis assumed patients would undergo a mean of 3.8 tests per day, based on findings from the DIAMOND trial.16 This is a conservative estimate relative to a previous Spanish-based cost analysis of flash glucose monitoring, which considered a mean SMBG testing frequency of 6 tests per day.23 As the mean number of daily tests in the present analysis was increased to a maximum of 6, rt-CGM became cost-saving and therefore the dominant strategy, owing to the increased total test strip costs associated with a higher testing frequency. However, this scenario (along with the wider exploration of various SMBG testing frequencies) did not account for the likely adjacent QoL impacts associated with changes to the number of daily tests. One such effect is that as patients conduct an increasing number of daily SMBG tests, glycemic control may improve (assuming consistent adherence), thereby ultimately improving QoL and QALY gains by reducing the long-term incidence of diabetes complications.61 However, multiple studies across various settings have found that SMBG adherence in patients living with both T1D and T2D diabetes is suboptimal.62–65 A further important caveat is that increased SMBG testing frequency could also result in additional process disutilities (ie related to the increased testing itself), increased FoH, and potentially other impacts on patients’ daily lives arising from the logistics of increased testing frequency. Therefore, any potential QoL gains arising from improvised glycemic control may be offset by the negative QoL impacts incurred due to increased SMBG testing.
A 2021 study similar in design to the present analysis (also set in Spain) focused on costs associated with flash glucose monitoring relative to SMBG, however this study only reported clinical benefits related to reductions in SHE rates.23 The present analysis sought to evaluate cost-effectiveness based on a broader array of treatment effects, particularly by incorporating improvements in glycemic control that can arise with rt-CGM use versus SMBG, in addition to potential reductions in hypoglycemia incidence. These additional benefits, captured through improvements in HbA1c levels, translated to a reduction in the incidence of microvascular and macrovascular complications with rt-CGM. Specifically, rt-CGM led to a projected reduction in the cumulative incidence of ophthalmic, renal, neurological, and cardiovascular events by 16.03%, 13.07%, 7.34%, and 9.09%, respectively. These effects translated to direct and sustained QALY gains for patients, whilst reducing the substantial financial burden to the Spanish healthcare system arising from long-term management of complications.
Another recent Spanish study found that cardiovascular complications alone in patients with T2D led to longer stays in hospital and a higher mean cost per hospital discharge, compared to the same complications occurring in non-diabetes patients.66 Productivity losses (for both patients and caregivers) associated with hospitalisation events elevate the costs further still from a societal perspective. Given that incidence trends indicate an ever-younger global cohort with T2D, the potential for rt-CGM to reduce complication incidence over patient lifetimes is likely to provide a continuously growing benefit.
A key strength of the present analysis was the use of clinical data sourced from a real-world study that investigated outcomes associated with the use of rt-CGM versus SMBG in a large subgroup of patients with insulin-treated T2D (n = 36,080).18 Real-world data provide the potential to yield insights into effect size, which can demonstrate how meaningful observed differences in variables or outcomes between participants across different study groups (eg, rt-CGM users and non-rt-CGM users) can be, as opposed to simply determining whether an effect is present. Given the scale and real-world nature of the Karter et al18 study that informed the treatment effects in the present analysis, the health economic findings are likely to have practical significance alongside a high degree of generalizability to the population of interest in routine clinical practice.
A second key strength was that all of the cost parameters used within the model were identified from Spanish sources, including a recently conducted Spanish cost–effectiveness study focusing on interventions for diabetes40 and an official Spanish cost of procedures tariff document,67 alongside NICE guidelines outlining management pathways for T2D.41 In some cases, it proved necessary to inflate costs to 2022 EUR, which may have omitted effects of technological developments, economic forces, and legal developments such as loss of patent exclusivity on costs. Nevertheless, any such idiosyncratic price fluctuations not captured by the inflationary adjustments applied in the present analysis would likely only have a minimal effect given the relatively short time periods over which the costs were inflated.
The main limitations of the study were associated with a lack of publicly available and geographically specific data for all model parameters, with the latter specifically being an issue with regards to the patient cohort. One such example of this was the use of a disutility value associated with DKA events that was specific to a patient population living with T1D in China.43 However, in all cases where proxy data inputs were sought, priority was placed on ensuring said data were as relevant to the study aims as possible, and any potential arising uncertainties were addressed as part of the sensitivity analysis. This limitation was also applicable to the real-world study (Karter et al18) that was used to source baseline patient characteristics and clinical efficacy data. The study was conducted within a large sample of patients living with insulin-treated T1D or T2D (N = 41,753), and measured outcomes based on participants’ responses to the intervention of interest within this analysis (ie, rt-CGM initiation). Nevertheless, Karter et al18 was based in the US, whilst the present analysis was conducted in a Spanish setting. The rationale for the use of this robustly conducted proxy-data is that there is currently a lack of similar real-world studies (with a comparably large sample size) set in Spain, or indeed other European countries. This exact approach has been used in a previous study investigating the cost-utility of rt-CGM versus SMBG in patients with insulin-treated T2D in France.22 Regardless, potential differences between Spanish and US populations (particularly when considering the ethnic profile of the modeled cohort) would still need to be accounted for. The extensive sensitivity analyses conducted were designed with these differences in mind, and aimed to characterize and explore a range of hypothetical scenarios. The results of this study should still, however, be interpreted with these population differences in mind, as the cost and health outcomes are likely most reflective of people with similar baseline characteristics to those used in the present analysis, with potentially limited generalizability beyond this scope. This limitation is also relevant when considering that the present analysis focused exclusively on patients with T2D receiving insulin therapy. Whilst our results are therefore likely limited to patients with a similar treatment profile, there is emerging evidence on the efficacy of CGM technologies in patients with T2D who are not receiving insulin therapy. However, further research is needed to explore the economic value of CGMs beyond insulin users, and this could be a potential focus for future cost–effectiveness studies.
Conclusion
The present analysis demonstrates that for patients living with insulin-treated T2D in Spain, rt-CGM is highly likely to be a cost-effective intervention relative to SMBG. These results can be used to inform the decision-making processes taken by the Spanish healthcare system, and to facilitate appropriate resource allocation for the optimal management of insulin-treated T2D.
Data Sharing Statement
The present study did not report original data. Data used for modeling were derived from public sources and have been reported in full in the paper and the accompanying online-only Supplemental Material.
Author Contributions
All authors made a significant contribution to the work reported, whether that is in the conception, study design, execution, acquisition of data, analysis and interpretation, or in all these areas; took part in drafting, revising or critically reviewing the article; gave final approval of the version to be published; have agreed on the journal to which the article has been submitted; and agree to be accountable for all aspects of the work.
Funding
Funding for the analysis, manuscript preparation, and the journal’s article-processing fees was provided by Dexcom.
Disclosure
R.F.P. and W.A. are full-time employees, and R.F.P. is a director and shareholder in, Covalence Research Ltd., which has received consulting fees from Dexcom for this analysis and from Dexcom outside the submitted work. S.I., H.A. and G.J.N. are current employees of Dexcom. H.A. and G.N. hold stock or stock options in Dexcom. J.F.MT received consulting fees from Dexcom. The authors report no other conflicts of interest in this work.
Part of this analysis were presented in a poster at ATTD 2024 in Florence, Italy.
References
1. Ahmad E, Lim S, Lamptey R, et al. Type 2 diabetes. Lancet. 2022;400(10365):1803–1820. doi:10.1016/S0140-6736(22)01655-5
2. Franch Nadal J, Mata Cases M, Mauricio Puente D. Epidemiology and clinical management of type 2 diabetes mellitus and associated comorbidities in Spain (e-Management study). Med Clin (Barc). 2016;147 Suppl 1:1–7. doi:10.1016/S0025-7753(17)30618-8
3. Lopez-Bastida J, Boronat M, Moreno JO, et al. Costs, outcomes and challenges for diabetes care in Spain. Glob Health. 2013;9:17. doi:10.1186/1744-8603-9-17
4. Alzaid A, Ladrón de Guevara P, Beillat M, et al. Burden of disease and costs associated with type 2 diabetes in emerging and established markets: systematic review analyses. Expert Rev Pharmac Outcom Res. 2021;21(4):785–798. doi:10.1080/14737167.2020.1782748
5. Khan MAB, Hashim MJ, King JK, et al. Epidemiology of type 2 diabetes – global burden of disease and forecasted trends. J Epidemiol Glob Health. 2020;10(1):107–111. doi:10.2991/jegh.k.191028.001
6. Pearson-Stuttard J, Holloway S, Polya R, et al. Variations in comorbidity burden in people with type 2 diabetes over disease duration: a population-based analysis of real world evidence. E Clin Med. 2022;52:1.
7. Guzder RN, Gatling W, Mullee MA, et al. Early mortality from the time of diagnosis of Type 2 diabetes: a 5-year prospective cohort study with a local age- and sex-matched comparison cohort. Diabet Med. 2007;24(10):1164–1167. doi:10.1111/j.1464-5491.2007.02223.x
8. Mata-Cases M, Casajuana M, Franch-Nadal J, et al. Direct medical costs attributable to type 2 diabetes mellitus: a population-based study in Catalonia, Spain. Eur J Health Econ. 2016;17(8):1001–1010. doi:10.1007/s10198-015-0742-5
9. Mathew TK, Zubair M, Tadi P. Blood Glucose Monitoring. In: StatPearls. Treasure Island (FL): StatPearls Publishing; 2023. Available from http://www.ncbi.nlm.nih.gov/books/NBK555976/.
10. Schnell O, Alawi H, Battelino T, et al. Self-monitoring of blood glucose in type 2 diabetes: recent studies. J Diabetes Sci Technol. 2013;7(2):478–488. doi:10.1177/193229681300700225
11. Polonsky WH, Fisher L, Schikman CH, et al. Structured self-monitoring of blood glucose significantly reduces A1C levels in poorly controlled, noninsulin-treated type 2 diabetes: results from the structured testing program study. Diabetes Care. 2011;34(2):262–267. doi:10.2337/dc10-1732
12. Durán A, Martín P, Runkle I, et al. Benefits of self-monitoring blood glucose in the management of new-onset Type 2 diabetes mellitus: the St Carlos Study, a prospective randomized clinic-based interventional study with parallel groups. J Diabetes. 2010;2(3):203–211. doi:10.1111/j.1753-0407.2010.00081.x
13. Hásková A, Radovnická L, Petruželková L, et al. Real-time CGM is superior to flash glucose monitoring for glucose control in type 1 diabetes: the CORRIDA randomized controlled trial. Diabetes Care. 2020;43(11):2744–2750. doi:10.2337/dc20-0112
14. Edelman SV, Argento NB, Pettus J, et al. Clinical implications of real-time and intermittently scanned continuous glucose monitoring. Diabetes Care. 2018;41(11):2265–2274. doi:10.2337/dc18-1150
15. Abraham SB, Arunachalam S, Zhong A, et al. Improved real-world glycemic control with continuous glucose monitoring system predictive alerts. J Diabetes Sci Technol. 2019;15(1):91–97. doi:10.1177/1932296819859334
16. Beck RW, Riddlesworth TD, Ruedy K, et al. Continuous glucose monitoring versus usual care in patients with type 2 diabetes receiving multiple daily insulin injections: a randomized trial. Ann Intern Med. 2017;167(6):365–374. doi:10.7326/M16-2855
17. Martens T, Beck RW, Bailey R, et al. Effect of continuous glucose monitoring on glycemic control in patients with type 2 diabetes treated with basal insulin: a randomized clinical trial. JAMA. 2021;325(22):2262–2272. doi:10.1001/jama.2021.7444
18. Karter AJ, Parker MM, Moffet HH, et al. Association of real-time continuous glucose monitoring with glycemic control and acute metabolic events among patients with insulin-treated diabetes. JAMA. 2021;325(22):2273–2284. doi:10.1001/jama.2021.6530
19. Parekh W, Hoskins N, Baker-Knight J, et al. The economic burden of insulin-related hypoglycemia in Spain. Diabetes Ther. 2017;8(4):899–913. doi:10.1007/s13300-017-0285-0
20. Alshannaq H, Isitt JJ, Pollock RF, et al. Cost-utility of real-time continuous glucose monitoring versus self-monitoring of blood glucose in people with insulin-treated Type 2 diabetes in Canada. J Comp Eff Res. 2023;12(10):e230075. doi:10.57264/cer-2023-0075
21. Isitt JJ, Roze S, Sharland H, et al. Cost-effectiveness of a real-time continuous glucose monitoring system versus self-monitoring of blood glucose in people with type 2 diabetes on insulin therapy in the UK. Diabetes Ther. 2022;13(11–12):1875–1890. doi:10.1007/s13300-022-01324-x
22. Alshannaq H, Pollock RF, Joubert M, et al. Cost-utility of real-time continuous glucose monitoring versus self-monitoring of blood glucose in people with insulin-treated type II diabetes in France. J Comp Eff Res. 2024;13(3):e230174. doi:10.57264/cer-2023-0174
23. Oyagüez I, Gómez-Peralta F, Artola S, et al. Cost analysis of FreeStyle libre® 2 system in type 2 diabetes mellitus population. Diabetes Ther. 2021;12(9):2329–2342. doi:10.1007/s13300-021-01064-4
24. McEwan P, Foos V, Palmer JL, et al. Validation of the IMS CORE diabetes model. Value Health. 2014;17(6):714–724. doi:10.1016/j.jval.2014.07.007
25. Palmer AJ, Roze S, Valentine WJ, et al. Validation of the CORE Diabetes Model against epidemiological and clinical studies. Curr Med Res Opin. 2004;201(Suppl 1):S27–40. doi:10.1185/030079904X2006
26. Palmer AJ, Roze S, Valentine WJ, et al. The CORE Diabetes Model: projecting long-term clinical outcomes, costs and cost-effectiveness of interventions in diabetes mellitus (types 1 and 2) to support clinical and reimbursement decision-making. Curr Med Res Opin. 2004;20(Suppl 1):S5–26. doi:10.1185/030079904X1980
27. NICE. Continuous subcutaneous insulin infusion for the treatment of diabetes mellitus: guidance. London: NICE; 2008. Available from: https://www.nice.org.uk/Guidance/TA151.
28. NICE. Dapagliflozin in combination therapy for treating type 2 diabetes: guidance. London: NICE; 2013. Available from: https://www.nice.org.uk/Guidance/TA288.
29. NICE. Canagliflozin in combination therapy for treating type 2 diabetes: guidance. London: NICE; 2014. Available from: https://www.nice.org.uk/guidance/TA315.
30. IQVIA. IQVIA Core Diabetes Model. 2024. Available from: https://www.core-diabetes.com/Index.aspx?Page=Index.
31. Clarke PM, Gray AM, Briggs AH, et al. A model to estimate the lifetime health outcomes of patients with type 2 diabetes: the United Kingdom Prospective Diabetes Study (UKPDS) Outcomes Model (UKPDS no. 68). Diabetologia. 2004;47(10):1747–1759. doi:10.1007/s00125-004-1527-z
32. MacKillop E, Sheard S. Quantifying life: understanding the history of quality-adjusted life-years (QALYs). Soc Sci Med. 2018;211:359–366. doi:10.1016/j.socscimed.2018.07.004
33. Paulden M. Calculating and interpreting ICERs and net benefit. PharmacoEconomics. 2020;38(8):785–807. doi:10.1007/s40273-020-00914-6
34. Gerstein HC, Miller ME; ACCORD Study Group. Effects of intensive glucose lowering in type 2 diabetes. N Engl J Med. 2008;358(24):2545–2559.
35. Buse JB, Bigger JT; ACCORD Study Group. Action to control cardiovascular risk in diabetes (ACCORD) trial: design and methods. Am J Cardiol. 2007;99(12A):21i–33i. doi:10.1016/j.amjcard.2007.03.003
36. Visser MM, Charleer S, Fieuws S, et al. Effect of switching from intermittently scanned to real-time continuous glucose monitoring in adults with type 1 diabetes: 24-month results from the randomised ALERTT1 trial. Lancet Diabetes Endocrinol. 2023;11(2):96–108. doi:10.1016/S2213-8587(22)00352-7
37. Šoupal J, Petruželková L, Grunberger G, et al. Glycemic outcomes in adults with T1D are impacted more by continuous glucose monitoring than by insulin delivery method: 3 years of follow-up from the COMISAIR study. Diabetes Care. 2020;43(1):37–43. doi:10.2337/dc19-0888
38. Karakus KE, Akturk HK, Alonso GT, et al. Association between diabetes technology use and glycemic outcomes in adults with type 1 diabetes over a decade. Diabetes Care. 2023;46(9):1646–1651. doi:10.2337/dc23-0495
39. Eurostat. Harmonized index of consumer prices: health for Spain [Internet]. FRED Fed. Reserve Bank St Louis. FRED, Federal Reserve Bank of St. Louis; 1996. Available from: https://fred.stlouisfed.org/series/CP0600ESM086NEST.
40. Franch-Nadal J, Malkin SJP, Hunt B, et al. The cost-effectiveness of oral semaglutide in Spain: a long-term health economic analysis based on the PIONEER clinical trials. Adv Ther. 2022;39(7):3180–3198. doi:10.1007/s12325-022-02156-8
41. NICE. Type 2 diabetes in adults: management [Internet]. London: NICE; 2015. Available from: https://www.nice.org.uk/guidance/ng28.
42. Beaudet A, Clegg J, Thuresson P-O, et al. Review of utility values for economic modeling in type 2 diabetes. Value Health. 2014;17(4):462–470. doi:10.1016/j.jval.2014.03.003
43. Zhao X, Ming J, Qu S, et al. Cost-effectiveness of flash glucose monitoring for the management of patients with type 1 and patients with type 2 diabetes in China. Diabetes Ther. 2021;12(12):3079–3092. doi:10.1007/s13300-021-01166-z
44. Matza LS, Stewart KD, Davies EW, et al. Health state utilities associated with glucose monitoring devices. Value Health. 2017;20(3):507–511. doi:10.1016/j.jval.2016.10.007
45. Vexiau P, Mavros P, Krishnarajah G, et al. Hypoglycaemia in patients with type 2 diabetes treated with a combination of metformin and sulphonylurea therapy in France. Diabetes Obes Metab. 2008;10 Suppl 1:16–24. doi:10.1111/j.1463-1326.2008.00883.x
46. Sakane N, Kotani K, Tsuzaki K, et al. Fear of hypoglycemia and its determinants in insulin-treated patients with type 2 diabetes mellitus. J Diabetes Investig. 2015;6(5):567–570. doi:10.1111/jdi.12340
47. Polonsky WH, Hessler D, Ruedy KJ, et al. The impact of continuous glucose monitoring on markers of quality of life in adults with type 1 diabetes: further findings from the DIAMOND randomized clinical trial. Diabetes Care. 2017;40(6):736–741. doi:10.2337/dc17-0133
48. Currie CJ, Morgan CL, Poole CD, et al. Multivariate models of health-related utility and the fear of hypoglycaemia in people with diabetes. Curr Med Res Opin. 2006;22(8):1523–1534. doi:10.1185/030079906X115757
49. EUNETHTA. Methods for health economic evaluations: a guideline based on current practices in Europe. 2015. Available from: https://www.eunethta.eu/wp-content/uploads/2018/03/Methods_for_health_economic_evaluations.pdf.
50. Vallejo-Torres L, García-Lorenzo B, Serrano-Aguilar P. Estimating a cost-effectiveness threshold for the Spanish NHS. Health Econ. 2018;27(4):746–761. doi:10.1002/hec.3633
51. Gandjour A. Willingness to pay for new medicines: a step towards narrowing the gap between NICE and IQWiG. BMC Health Serv Res. 2020;20(1):343. doi:10.1186/s12913-020-5050-9
52. Hayes AJ, Leal J, Gray AM, et al. UKPDS outcomes model 2: a new version of a model to simulate lifetime health outcomes of patients with type 2 diabetes mellitus using data from the 30 year United Kingdom Prospective Diabetes Study: UKPDS 82. Diabetologia. 2013;56(9):1925–1933. doi:10.1007/s00125-013-2940-y
53. Mendes D, Alves C, Batel-Marques F. Number needed to treat (NNT) in clinical literature: an appraisal. BMC Med. 2017;15:112. doi:10.1186/s12916-017-0875-8
54. Cordell WH. Number needed to treat (NNT). Ann Emerg Med. 1999;33(4):433–436. doi:10.1016/S0196-0644(99)70308-2
55. Tenny S, Hoffman MR. Relative risk. In: StatPearls. Treasure Island (FL): StatPearls Publishing; 2023. Available from http://www.ncbi.nlm.nih.gov/books/NBK430824/.
56. Irwig L, Irwig J, Trevena L, et al. Relative risk, relative and absolute risk reduction, number needed to treat and confidence intervals. Smart Health Choices Mak Sense Health Advice. Hammersmith Press; 2008. Available from: https://www.ncbi.nlm.nih.gov/books/NBK63647/.
57. Bjornstad P, Chao LC, Cree-Green M, et al. Youth-onset type 2 diabetes mellitus: an urgent challenge. Nat Rev Nephrol. 2023;19(3):168–184. doi:10.1038/s41581-022-00645-1
58. Mayer-Davis EJ, Lawrence JM, Dabelea D, et al. Incidence trends of type 1 and type 2 diabetes among youths, 2002-2012. N Engl J Med. 2017;376(15):1419–1429. doi:10.1056/NEJMoa1610187
59. Lawrence JM, Divers J, Isom S, et al. Trends in prevalence of type 1 and type 2 diabetes in children and adolescents in the US, 2001-2017. JAMA. 2021;326(8):717–727. doi:10.1001/jama.2021.11165
60. Pinhas-Hamiel O, Zeitler P. The global spread of type 2 diabetes mellitus in children and adolescents. J Pediatr. 2005;146(5):693–700. doi:10.1016/j.jpeds.2004.12.042
61. Schütt M, Kern W, Krause U, et al. Is the frequency of self-monitoring of blood glucose related to long-term metabolic control? Multicenter analysis including 24,500 patients from 191 centers in Germany and Austria. Exp Clin Endocrinol Diabetes. 2006;114(7):384–388. doi:10.1055/s-2006-924152
62. Patton SR. Adherence to glycemic monitoring in diabetes. J Diabetes Sci Technol. 2015;9(3):668–675. doi:10.1177/1932296814567709
63. Moström P, Ahlén E, Imberg H, et al. Adherence of self-monitoring of blood glucose in persons with type 1 diabetes in Sweden. BMJ Open Diabetes Res Care. 2017;5(1):e000342. doi:10.1136/bmjdrc-2016-000342
64. Peyrot M, Rubin RR, Lauritzen T, et al. Psychosocial problems and barriers to improved diabetes management: results of the Cross-National Diabetes Attitudes, Wishes and Needs (Dawn) Study. Diabet Med. 2005;22(10):1379–1385. doi:10.1111/j.1464-5491.2005.01644.x
65. Harris MI; National Health and Nutrition Examination Survey (NHANES III). Frequency of blood glucose monitoring in relation to glycemic control in patients with type 2 diabetes. Diabetes Care. 2001;24(6):979–982. doi:10.2337/diacare.24.6.979
66. Jodar E, Artola S, Garcia-Moll X, et al. Incidence and costs of cardiovascular events in Spanish patients with type 2 diabetes mellitus: a comparison with general population, 2015. BMJ Open Diabetes Res Care. 2020;8(1):e001130. doi:10.1136/bmjdrc-2019-001130
67. eSalud. eSalud 2018 Cost of procedures according to official tariffs. 2018.
 © 2024 The Author(s). This work is published and licensed by Dove Medical Press Limited. The
full terms of this license are available at https://www.dovepress.com/terms
and incorporate the Creative Commons Attribution
- Non Commercial (unported, 3.0) License.
By accessing the work you hereby accept the Terms. Non-commercial uses of the work are permitted
without any further permission from Dove Medical Press Limited, provided the work is properly
attributed. For permission for commercial use of this work, please see paragraphs 4.2 and 5 of our Terms.
© 2024 The Author(s). This work is published and licensed by Dove Medical Press Limited. The
full terms of this license are available at https://www.dovepress.com/terms
and incorporate the Creative Commons Attribution
- Non Commercial (unported, 3.0) License.
By accessing the work you hereby accept the Terms. Non-commercial uses of the work are permitted
without any further permission from Dove Medical Press Limited, provided the work is properly
attributed. For permission for commercial use of this work, please see paragraphs 4.2 and 5 of our Terms.