")
Back to Journals » ClinicoEconomics and Outcomes Research » Volume 11
Cost-of-illness of knee osteoarthritis: potential cost savings by not undergoing arthroplasty within the first 2 years
Authors Ong KL, Runa M, Lau E , Altman RD
Received 4 April 2018
Accepted for publication 9 August 2018
Published 14 March 2019 Volume 2019:11 Pages 245—255
DOI https://doi.org/10.2147/CEOR.S170119
Checked for plagiarism Yes
Review by Single anonymous peer review
Peer reviewer comments 2
Editor who approved publication: Prof. Dr. Dean Smith
Kevin L Ong,1 Maria Runa,1 Edmund Lau,2 Roy D Altman3
1Biomedical Engineering, Exponent, Inc, Philadelphia, PA, USA; 2Health Sciences, Exponent, Inc, Menlo Park, CA, USA; 3School of Medicine, University of California, Los Angeles, CA, USA
Purpose: Although knee arthroplasty (KA) is the largest source of hospitalization costs for knee osteoarthritis (OA), some studies have suggested reducing the use of “low-value” interventions, such as intra-articular hyaluronic acid (HA), to lower health care costs. However, those studies fail to consider that HA has demonstrated benefits in extending time to more costly KA or avoiding KA altogether. We evaluated 1) the overall knee OA costs (direct) within a 2-year period; 2) the relative contribution of HA and KA costs; 3) the direct cost savings from HA patients not undergoing KA.
Patients and methods: Knee OA patients were identified from the Optum Clinformatics data set, which includes physician, facility, and pharmacy claims data from privately insured patients of all ages. Patients were stratified in the no HA, non-hylan G-F 20, and hylan G-F 20 cohorts. The cumulative costs (payer perspective) were evaluated for all knee OA-related claims (adjusted to Consumer Price Index Jan 2017$) for patients who had at least 2 years follow-up. Costs were stratified into various clinical categories.
Results: The study cohort included 2,030,497 knee OA patients, of which 65,144 patients (3.2%) underwent KA. The cost of treating knee OA within the 2-year follow-up period was estimated to be $4.99 billion (B). The majority of the costs (69%) were attributed to KA patients (3.2% of patients). In all, 15.9% of the HA patients underwent KA within 2 years, but HA only contributed 1.7% to the total costs for these patients. The remaining 84.1% of HA patients did not undergo KA, which saved an estimated total of $1.54B (average $20,740 per patient) or 83.9%, after accounting for their non-KA therapies.
Conclusion: Our study estimated substantial cost savings through a large percentage of HA patients not undergoing KA. Although a fraction of patients moved on from their conservative therapy to undergo KA within the 2-year period, HA attributed to <2% of their total treatment costs.
Keywords: hyaluronic acid, knee arthroplasty, intra-articular injections, health care expenditures
Introduction
Knee osteoarthritis (OA) contributes >$27 billion (B) annually in health care expenditures in USA.1 The individual lifetime cost of knee OA-related care has been estimated to range from $12,400 to $16,000, depending on the eligibility of total knee arthroplasty (TKA) for the different Kellgren–Lawrence grades.2 Since most hospitalizations associated with OA are for joint replacement surgeries3 and the largest source of these costs is related to primary knee arthroplasty (KA),2 the increasing prevalence of KA across the globe4 may add to the increasing health care costs. There were ~620,000 TKA in USA in 2009, corresponding to hospital expenditures of $28.5B.3 Moreover, there are a number of interventions that are commonly used before and after KA, such as intra-articular (IA) corticosteroid (CS) injections, nonsteroidal anti-inflammatory drugs (NSAIDs), opioids, physical therapy (PT), arthroscopy, and IA hyaluronic acid (HA) injections.5,6
HA is a normal component of synovial joints that provides functional integrity, lubrication, and nutrition to the articular cartilage and when this joint is arthritic the concentration of naturally occurring HA decreases. One of the interventions used prior to KA is IA HA injections, which has been shown to reduce pain and increase function for knee OA patients.7 However, it is considered by some to be of low-value health care.8 It has been suggested that knee OA costs can be reduced by 45% if clinicians cease to utilize interventions that are not recommended by American Academy of Orthopaedic Surgeons (AAOS) Clinical Practice Guidelines, such as HA.9 However, these recommendations fail to consider that HA is associated with delay to more costly KA.10–12 Moreover, patients who are treated with HA may also be able to avoid KA altogether.12
Previous knee OA cost studies have primarily focused on the expenditures leading up to TKA,5,6,9 but have not assessed the episode-of-care costs starting from the time of knee OA diagnosis and beyond any surgical interventions. Therefore, our research objectives were 1) to evaluate the overall cost of care (direct) for treating knee OA within a 2-year period; 2) to determine the contribution of HA and KA to the overall knee OA-related direct costs; and 3) to evaluate cost savings, if any, from the utilization of HA.
Materials and methods
Patients with knee OA were identified from the Optum Clinformatics (Eden Prairie, MN, USA) data from 2006 until the end of the second quarter of 2016. At the time of the study, the most recent data available corresponded to the year 2016. The study was designed to evaluate a 10-year period; therefore, the data set started from 2006. This USA data set incorporates claims from all 50 states for ~13 million lives annually, who are covered by UnitedHealth Group (commercial/private payer), including those of all age groups. It is derived from administrative claims through affiliated health plans, Optum employer customer health plans, and Optum payer customer health plans. The patient-level anonymized data are then integrated from physician, facility, and pharmacy claims, with various data elements such as demographics (age, gender), procedure codes, diagnoses codes, admission and discharge dates, and payments. These data are publicly available for purchase and are exempt from institutional review board approval. Knee OA and combined nonspecific OA and knee pain codes were used to identify the study cohort (Table 1). A look back period of 6 months with no previous knee OA diagnosis was used to identify the first diagnosis of knee OA. It was required to have at least a 2-year follow-up after the index knee OA diagnosis (no death or end of enrollment). Patients younger than 18 years old and who had IA HA treatment prior to the knee OA diagnosis were excluded.
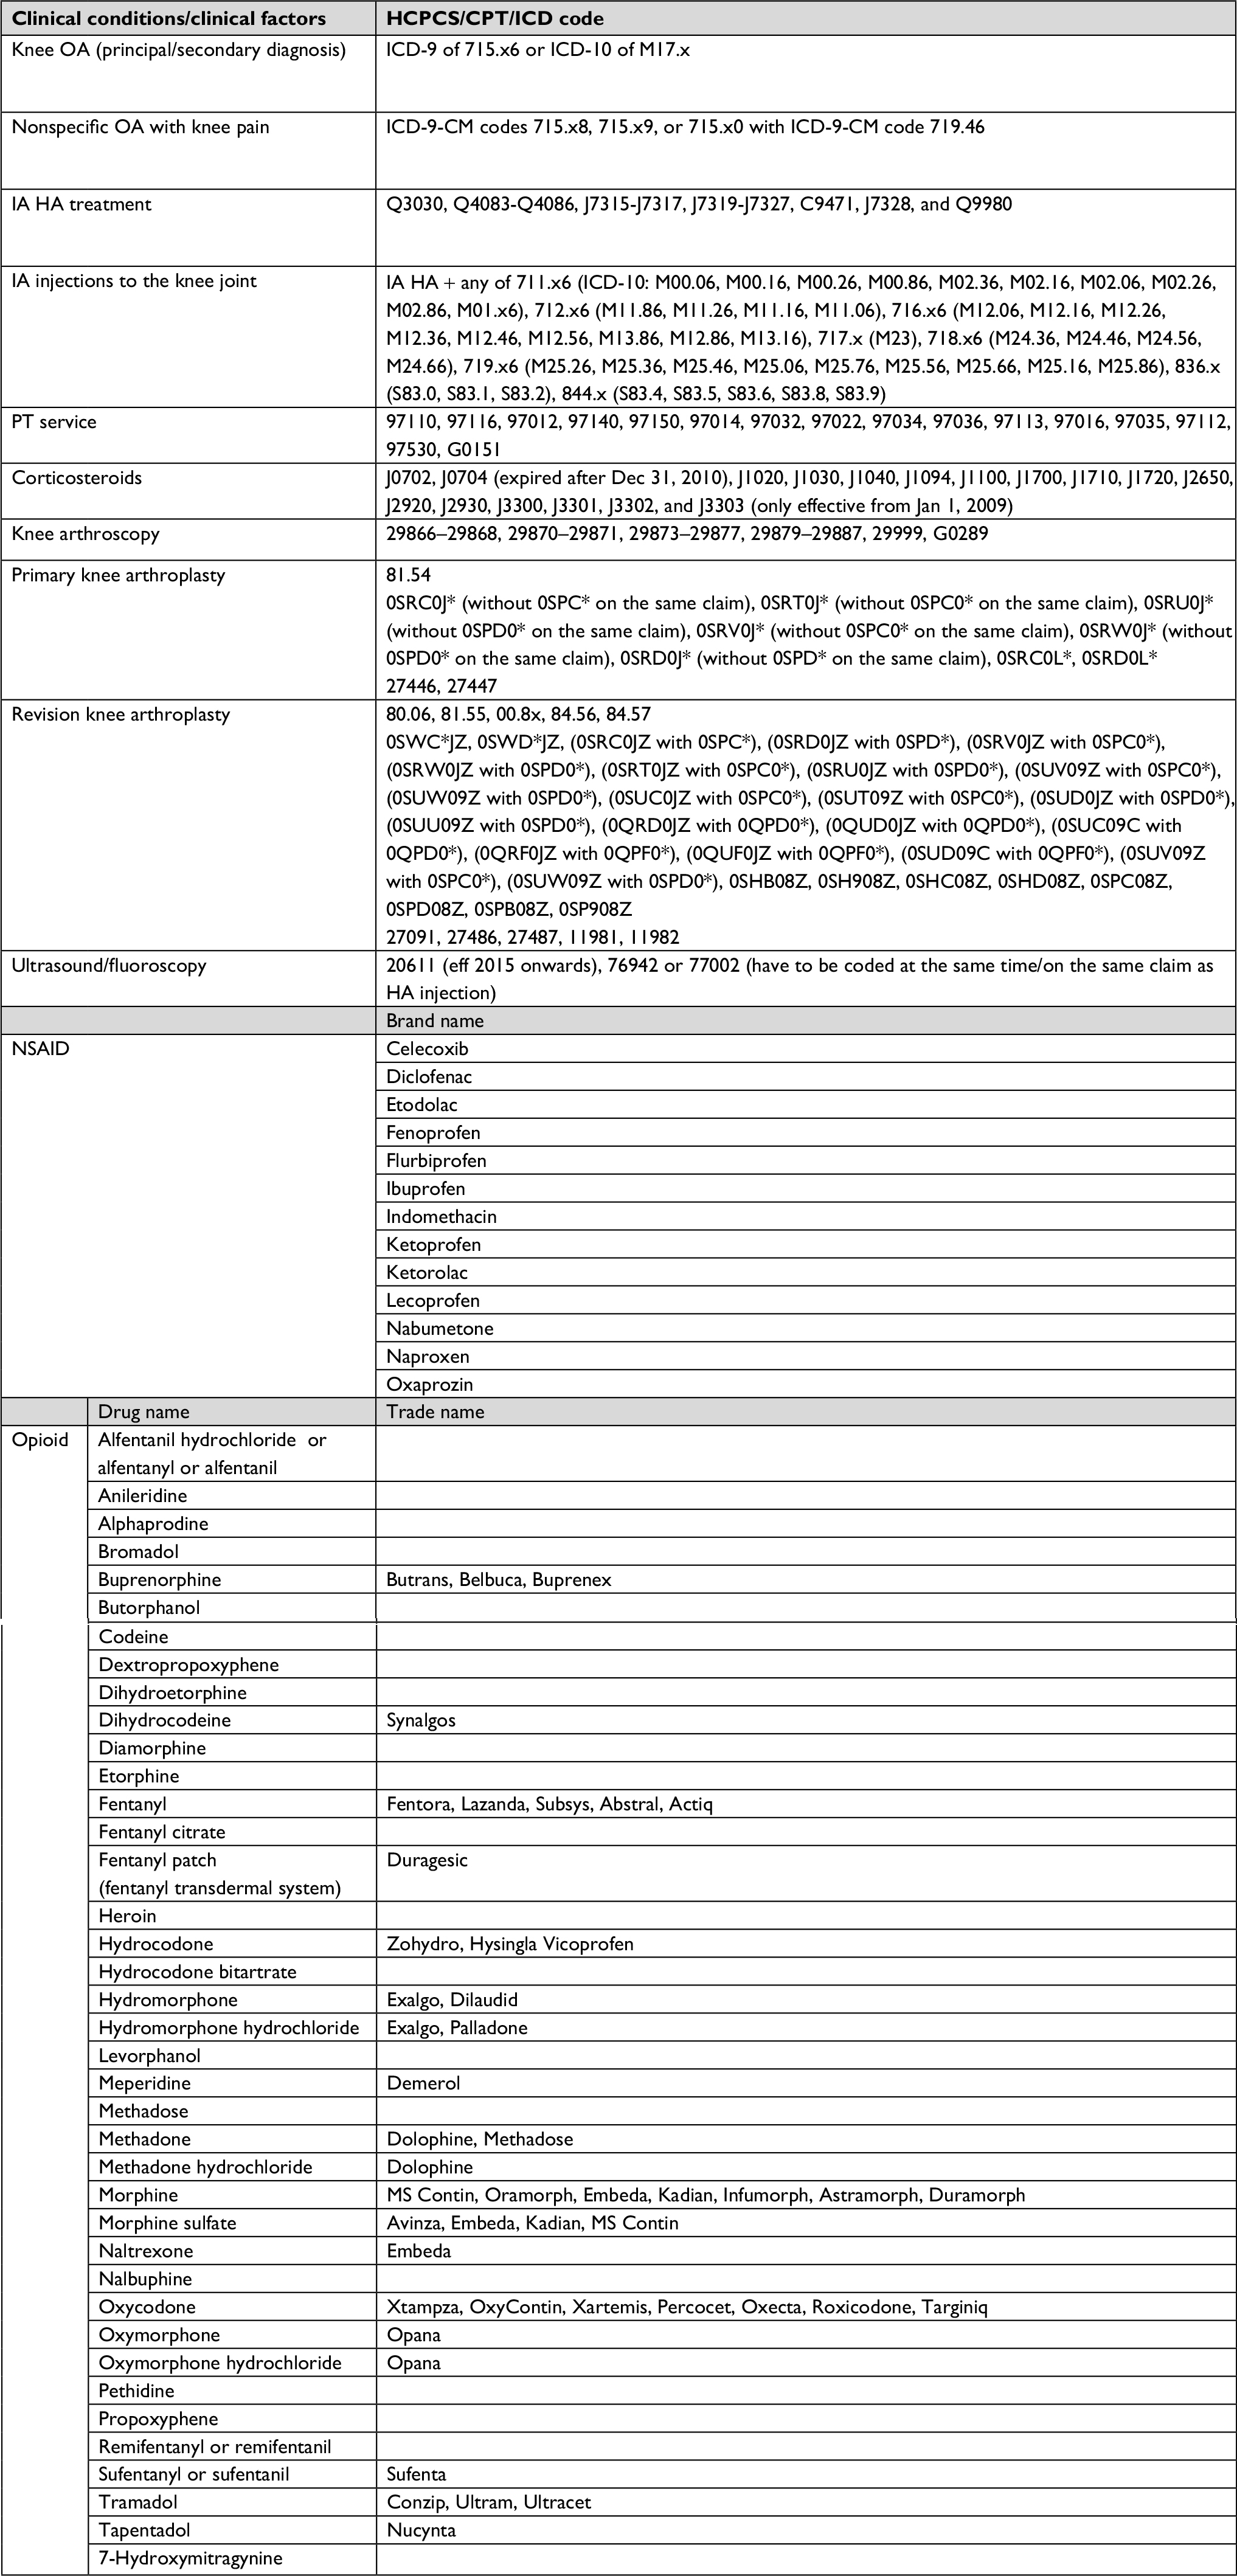 | Table 1 HCPCS/CPT/ICD codes or brand name for knee OA, HA, and the clinical factors considered Abbreviations: HCPCS, Healthcare Common Procedure Coding System; CPT, Current Procedural Terminology; NSAID, nonsteroidal anti-inflammatory drug; PT, physical therapy; IA, intra-articular; OA, osteoarthritis; HA, hyaluronic acid. |
Patients were stratified in three cohorts: 1) no HA cohort; 2) non-hylan G-F 20 cohort; and 3) hylan G-F 20 cohort. Those who did not receive IA HA following knee OA diagnosis were placed in the no HA cohort. The non-hylan G-F 20 cohort included patients who received either multiple types of HAs during the study period or who utilized only one type of non-hylan G-F 20 HA during the study period. The hylan G-F 20 cohort included those who received only hylan G-F 20; these patients were further subdivided into three groups: those who received 1) only hylan G-F 20 three injection type (“3 inj”); 2) only hylan G-F 20 one injection type (“1 inj”); or 3) a combination of both (“1+3 inj”). Table 1 shows the Healthcare Common Procedure Coding System (HCPCS) Q and J codes used to identify IA HA treatment and the codes used to limit the injections to the knee joint. Because hylan G-F 20 (3 inj) and hylan G-F 20 (1 inj) have the same HCPCS code, the following criteria were used sequentially to differentiate between these two products: 1) year (hylan G-F 20 [3 inj]: from 2006 up to February 26, 2009; hylan G-F 20 [3 inj] or hylan G-F 20 [1 inj]): from February 27, 2009 onwards; National Drug Code (hylan G-F 20 [3 inj]: 58468-0090-01 or 66267-0921-03 or 35356-0034-01 or 68115-0535-03; hylan G-F 20 [1 inj]: 58468-0090-03); 2) brand name; 3) number of units per injection (hylan G-F 20 [3 inj]: 16 mg; hylan G-F 20 [1 inj]: 48 mg); 4) number of injections (hylan G-F 20 [3 inj]: 3 over 3 weeks; hylan G-F 20 [1 inj]: 1); and 5) charge difference (3× more for one injection of hylan G-F 20 [1 inj] than one injection of hylan G-F 20 [3 inj]).
The cumulative costs from the payer perspective were evaluated for all knee OA-related claims (adjusted to Consumer Price Index Jan 2017$), which was compiled on a monthly basis until the end of the 2-year follow-up. The costs were stratified into various categories: 1) IA CS injection, 2) prescription of NSAIDs, 3) opioid prescription (from pharmacy claims), 4) knee arthroscopy, 5) ultrasound/fluoroscopy use, 6) PT use, 7) HA, 8) primary KA, and 9) revision KA (RKA). These were identified using either HCPCS codes or brand names (Table 1).
Results
From the initial cohort of 4,027,848 knee OA patients, 2,030,497 patients met the inclusion/exclusion criteria for the cost analysis. From this group of patients, 65,144 patients (3.2%) underwent KA and 1,965,352 patients (96.8%) did not undergo KA (Figure 1). Of the 1,941,996 patients (95.6%) who did not receive any HA injection, 51,106 patients (2.6%) had KA and 1,890,890 patients (97.4%) did not. In all, 56,093 patients (2.8%) received at least one non-hylan G-F 20 HA injection, which included 8,315 patients (14.8%) with KA and 47,778 patients (85.2%) without KA. The remaining 32,408 patients (1.6%) received hylan G-F 20 injections. From this last group, 18,870 patients (0.9%) were administered only hylan G-F 20 (3 inj) HA injections, including 3,367 patients (17.8%) with KA and 15,503 patients (82.2%) without KA. Also, 12,619 patients (0.6%) had only hylan G-F 20 (1 inj) HA injections, which included 2,250 patients (17.8%) who underwent KA and 10,369 patients (82.2%) who did not undergo KA. Nine hundred and nineteen patients (0.05%) had a combination of both hylan G-F 20 (3 inj) and hylan G-F 20 (1 inj) HA injections (“hylan G-F 20 [1+3 inj]” group), where 106 patients (11.5%) had KA and 813 patients (88.5%) did not.
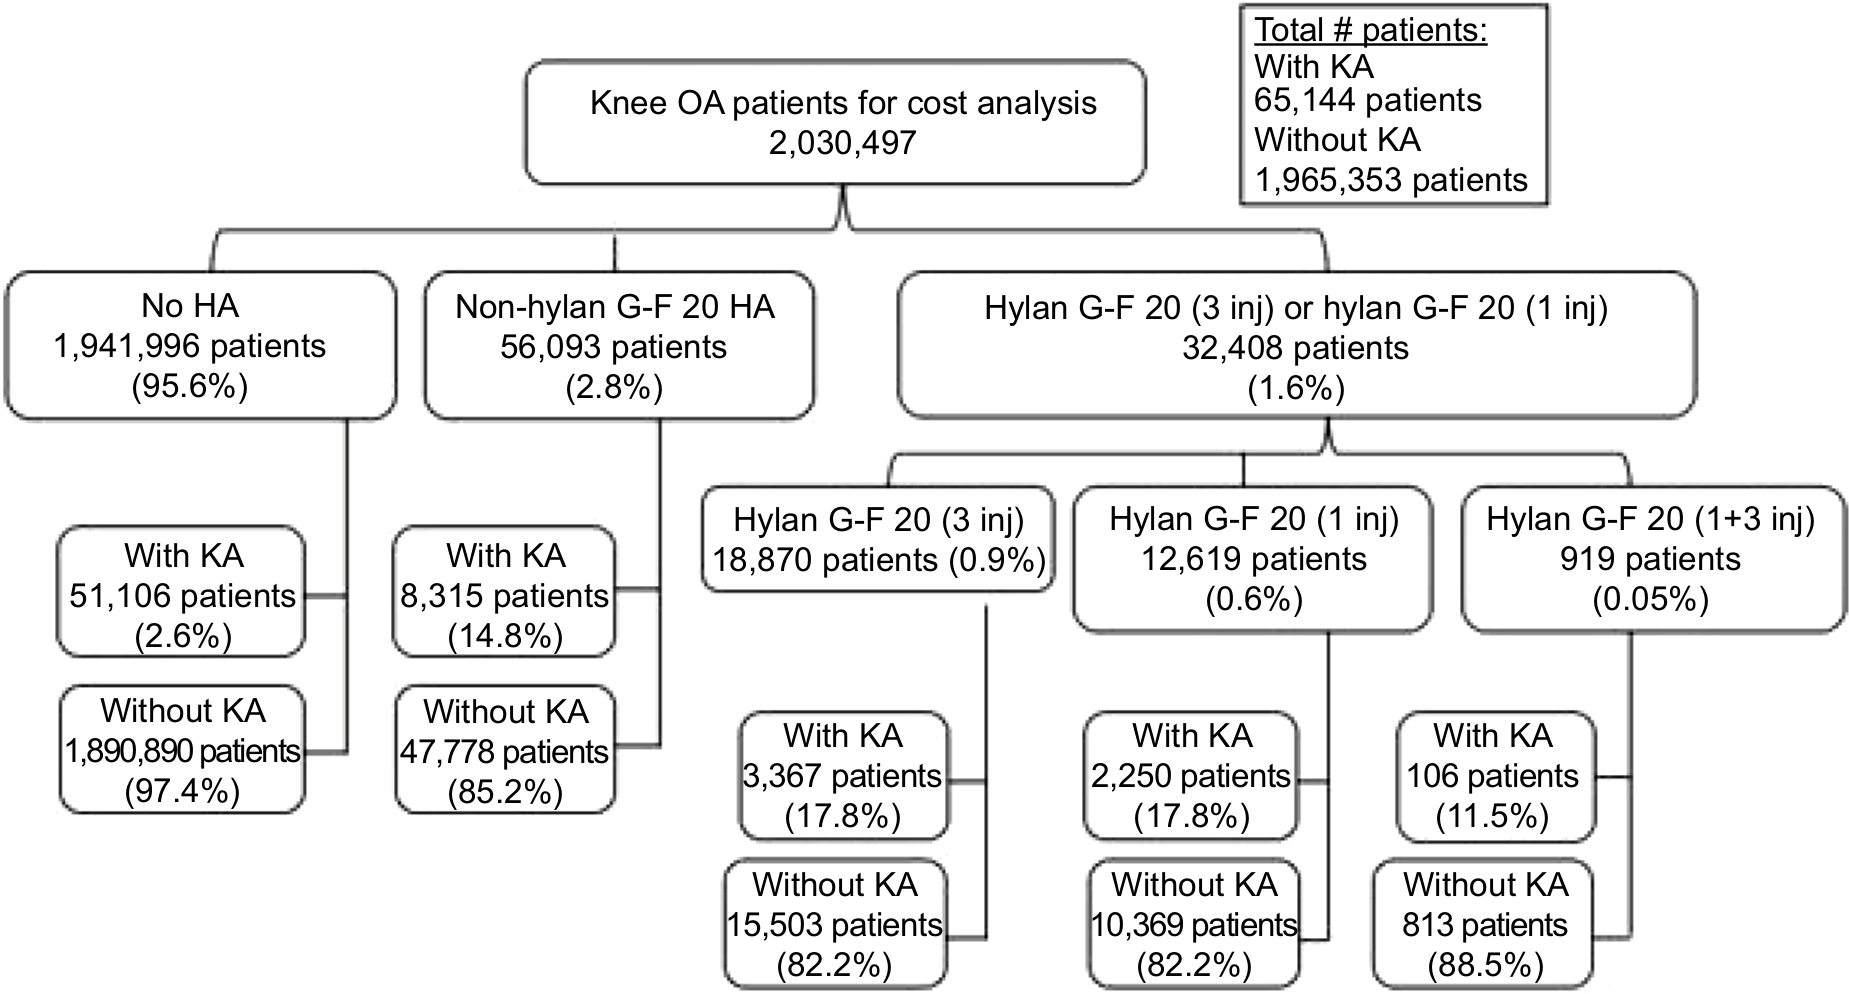 | Figure 1 Patient distribution within the study cohort. Abbreviations: KA, knee arthroplasty; HA, hyaluronic acid; OA, osteoarthritis. |
The cost of treating knee OA within a 2-year period following knee OA for the 2,030,497 patients was estimated to be $4.99B (Figure 2), corresponding to an average 2-year cost of $2,460 per patient. Although the majority of the patients did not undergo KA, the majority of the costs (69%) were attributed to KA patients. During the 2-year period, KA patients had the following estimated total knee OA-related costs: the no HA group had a $2,658.0 million (M) cost (67.8% of cohort costs); the non-hylan G-F 20 HA group had a $460.9M cost (69.3%); the hylan G-F 20 (3 inj) group had a $201.4M cost (77.1%); the hylan G-F 20 (1 inj) group had a $106.9M cost (78.2%); the combination of hylan G-F 20 (3 inj) and hylan G-F 20 (1 inj) group had a $5.4M cost (58.7%); and the hylan G-F 20 (3 inj) or hylan G-F 20 (1 inj) group had a $313.7M cost (77.0%). The costs related to KA and RKA for the no HA group were $1.19B and $34.6M, respectively (Table 2). The average cost of KA ranged from $23,046 to $25,998, while the average cost of RKA per primary KA patient ranged from $0 to $677, depending on the patient group. The average and median 2-year knee OA-related costs depended on whether the patient underwent KA (Figure 3). For example, hylan G-F 20 patients with KA had an average cost of $59,816 compared to the cost of $3,864 for patients without KA. Similar differences were observed within other groups for KA vs non-KA patients.
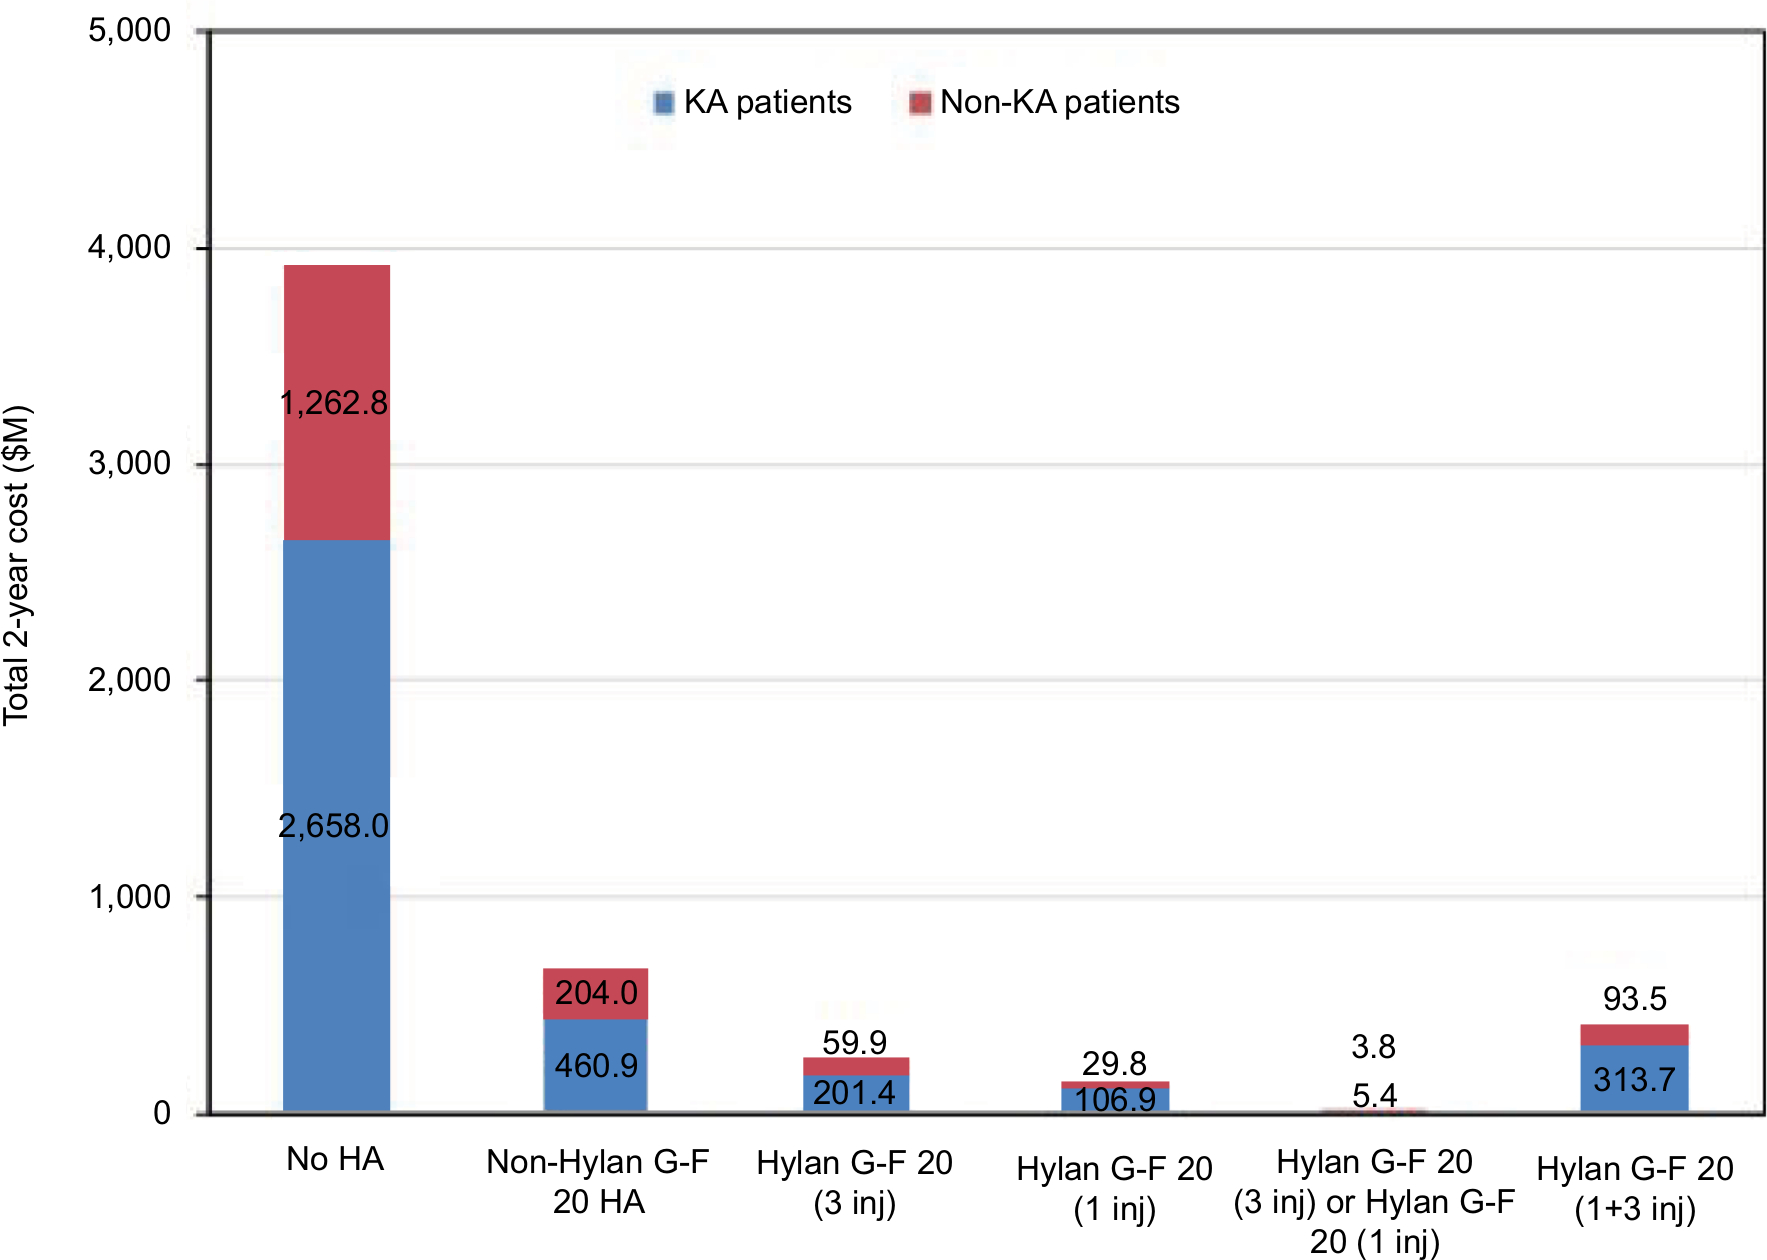 | Figure 2 Overall 2-year cost of treating knee OA within the study cohort totalled $4.99B. Abbreviations: KA, knee arthroplasty; HA, hyaluronic acid; OA, osteoarthritis. |
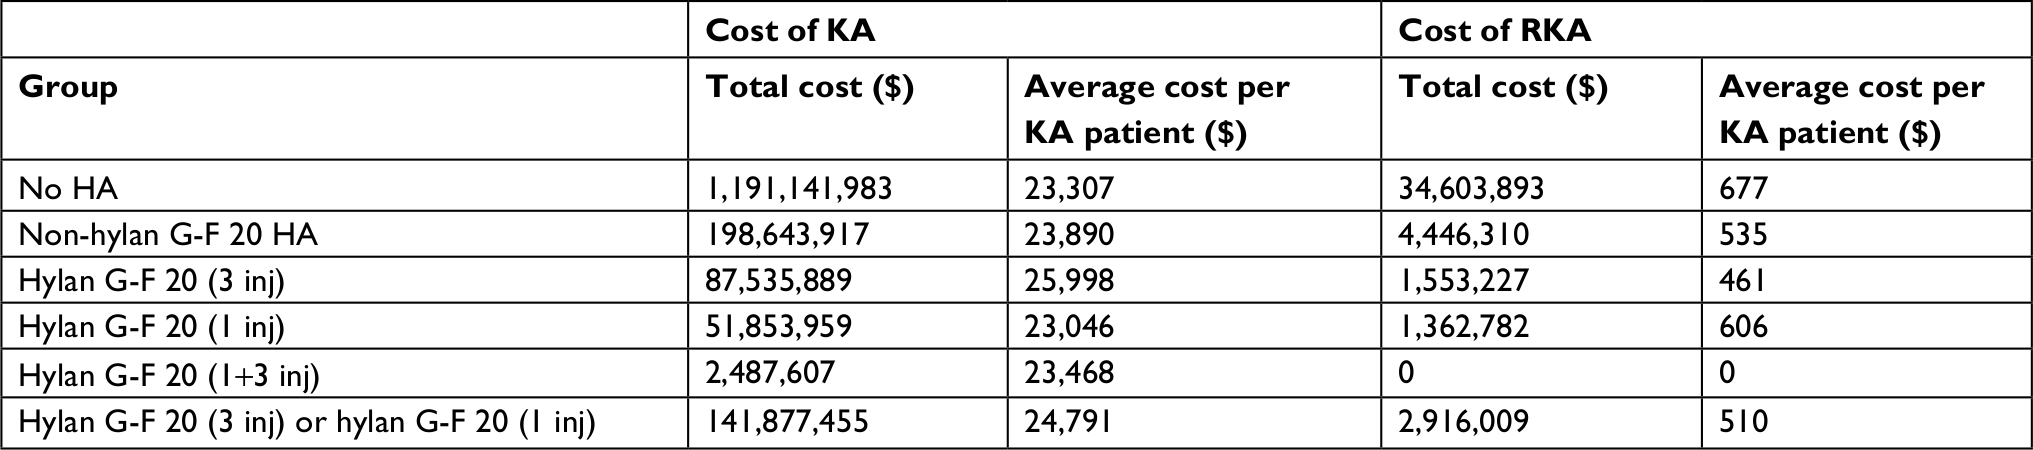 | Table 2 Total cost for KA patients for each group Abbreviations: HA, hyaluronic acid; RKA, revision knee arthroplasty; KA, knee arthroplasty. |
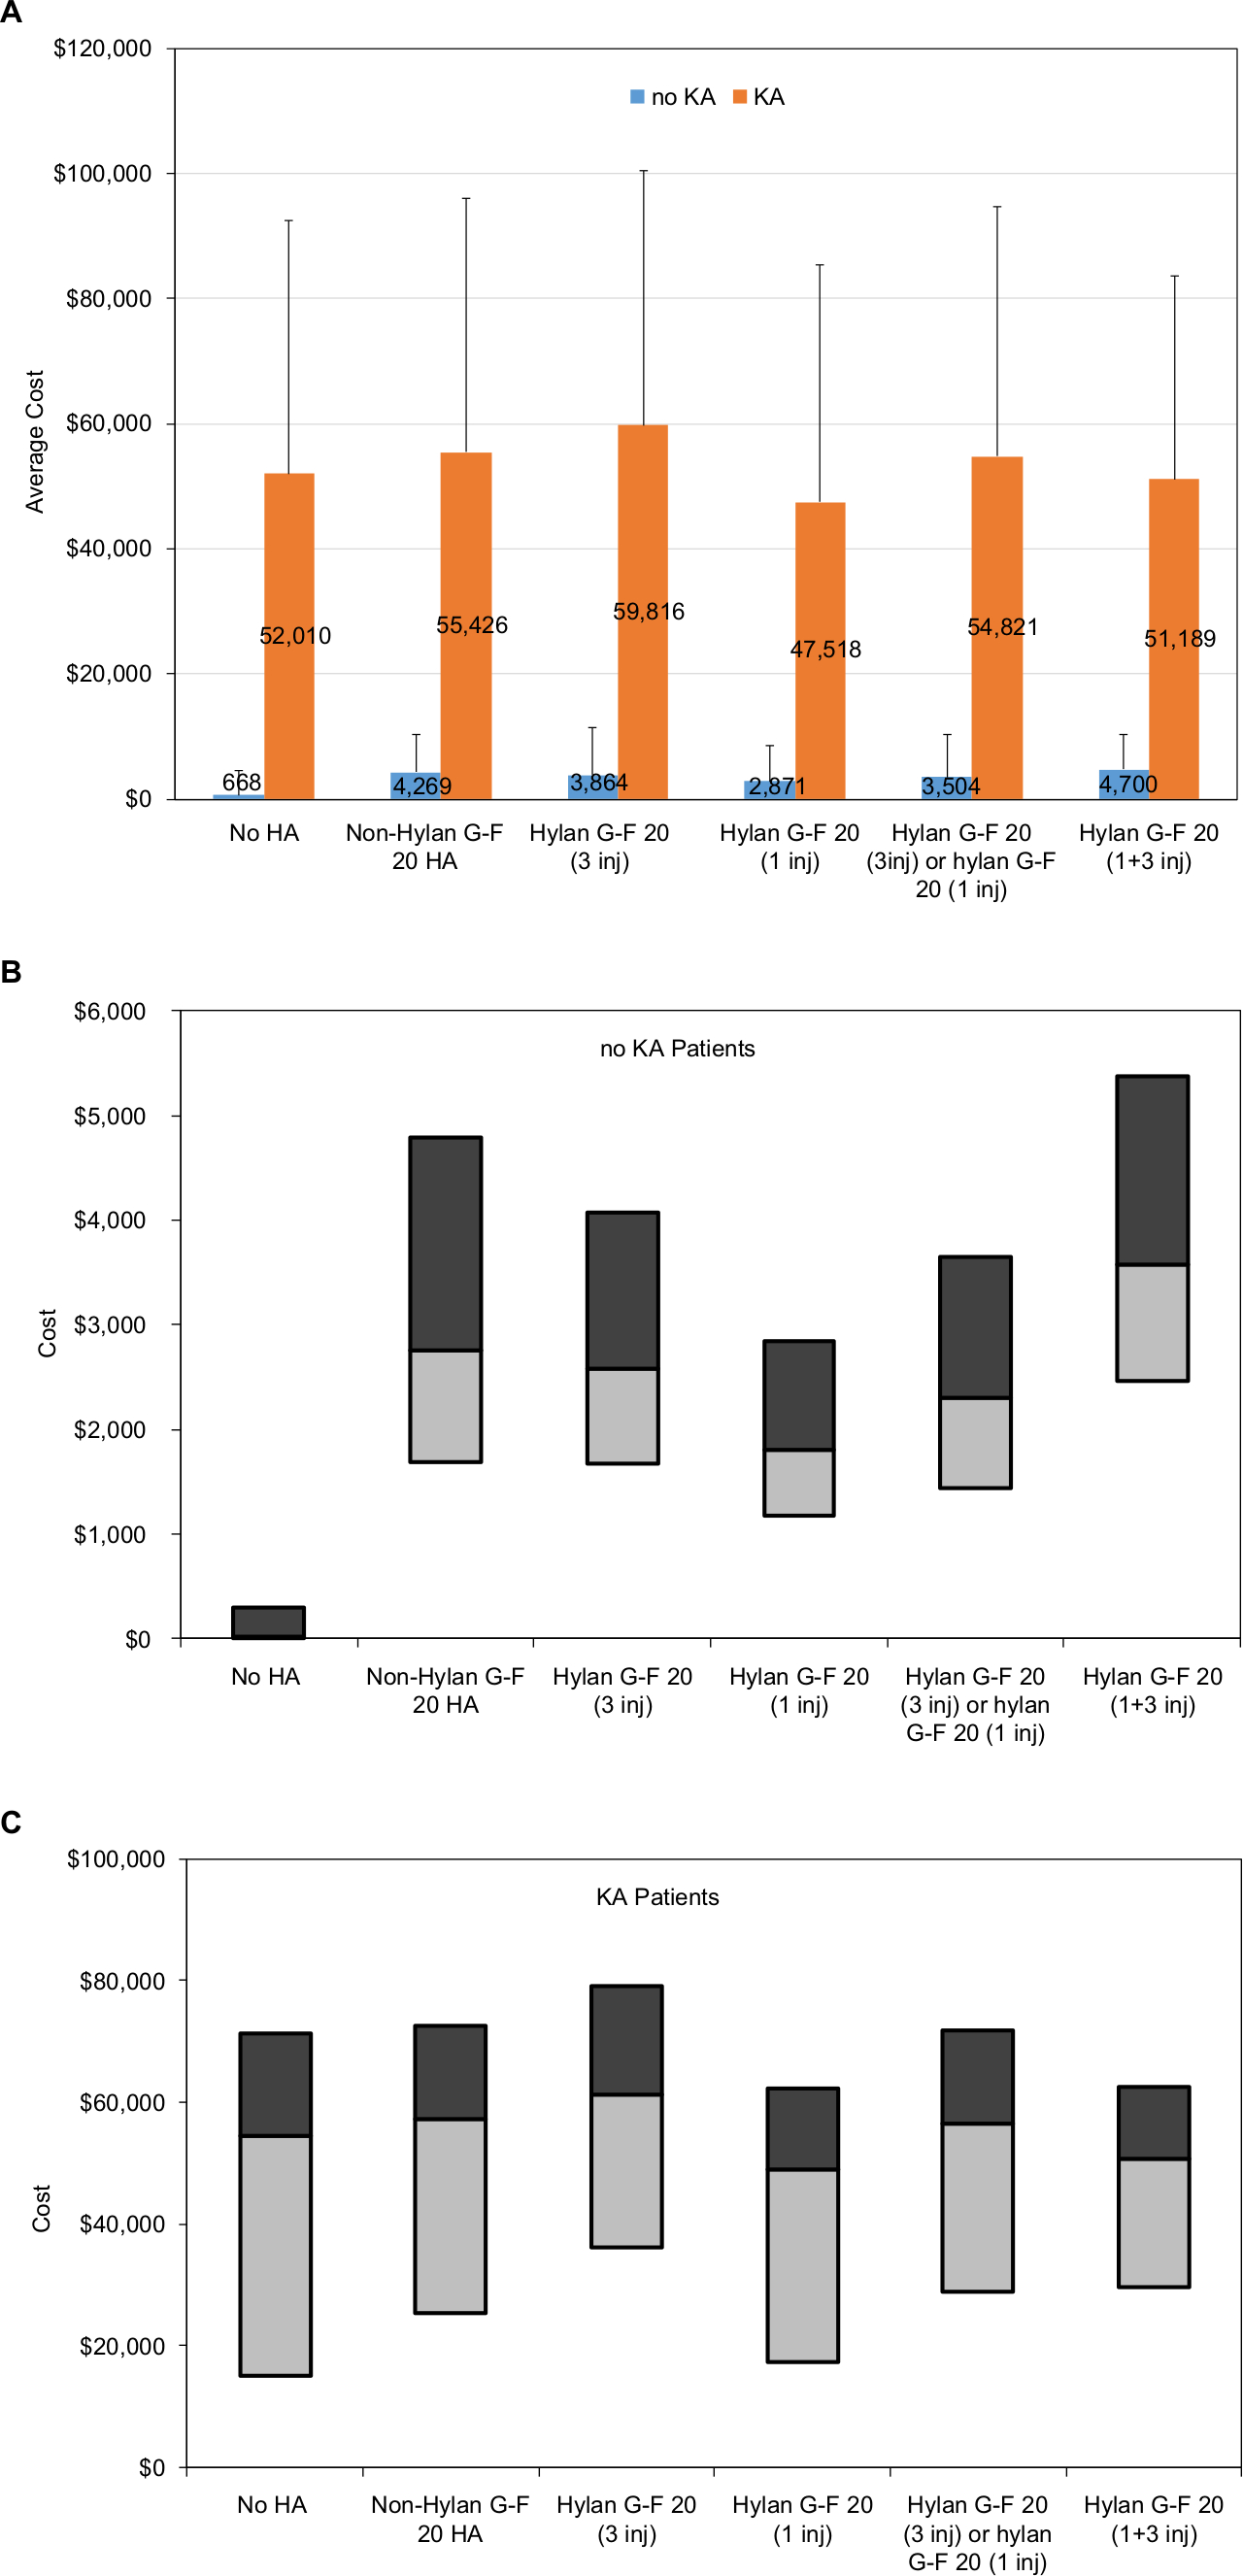 | Figure 3 Average (A) and median (B and C) 2-year costs of treating knee OA for KA and non-KA patients. For the median plots, the light gray bars represent the 25th percentile (lower edge) and median (upper edge), while the dark gray bars represent the median (lower edge) and 75th percentile (upper edge). Abbreviations: KA, knee arthroplasty; HA, hyaluronic acid; OA, osteoarthritis. |
For the HA cohort, each group had the following average HA cost per patient with/without KA: non-hylan G-F 20 HA had $1,014/$1,170; the hylan G-F 20 (3 inj) group had $916/$1,005; the hylan G-F 20 (1 inj) group had $675/$760; the hylan G-F 20 (3 inj) or hylan G-F 20 (1 inj) group had $834/$931; and the hylan G-F 20 (1+3 inj) group had an average cost of $1,606/$1,686. The average (± SD) costs for the use of ultrasound/fluoroscopy with the HA claim was $120.1 ± $536.6, $27.2 ± $179.9, $15.0 ± $74.2, and $49.1 ± $253.0 for the non-hylan G-F 20 HA, hylan G-F 20 (3 inj), hylan G-F 20 (1 inj), and hylan G-F 20 (1+3 inj) groups, respectively. Of the patients who underwent HA treatment, 15.9% underwent KA within 2 years. However, HA only contributed 1.7% to the total cost of treating these patients. Conversely, 84.1% of HA patients did not undergo KA within 2 years of being diagnosed with knee OA. If these patients had, instead, undergone KA without delay, the expected cost would have been $1.84B, which corresponded to $24,740 per patient (Figure 4). By not undergoing KA and any subsequent RKA, these patients saved an estimated total of $1.54B (average $20,740 per patient), after accounting for their non-KA therapies, which corresponded to a savings of 83.9% (Figure 5).
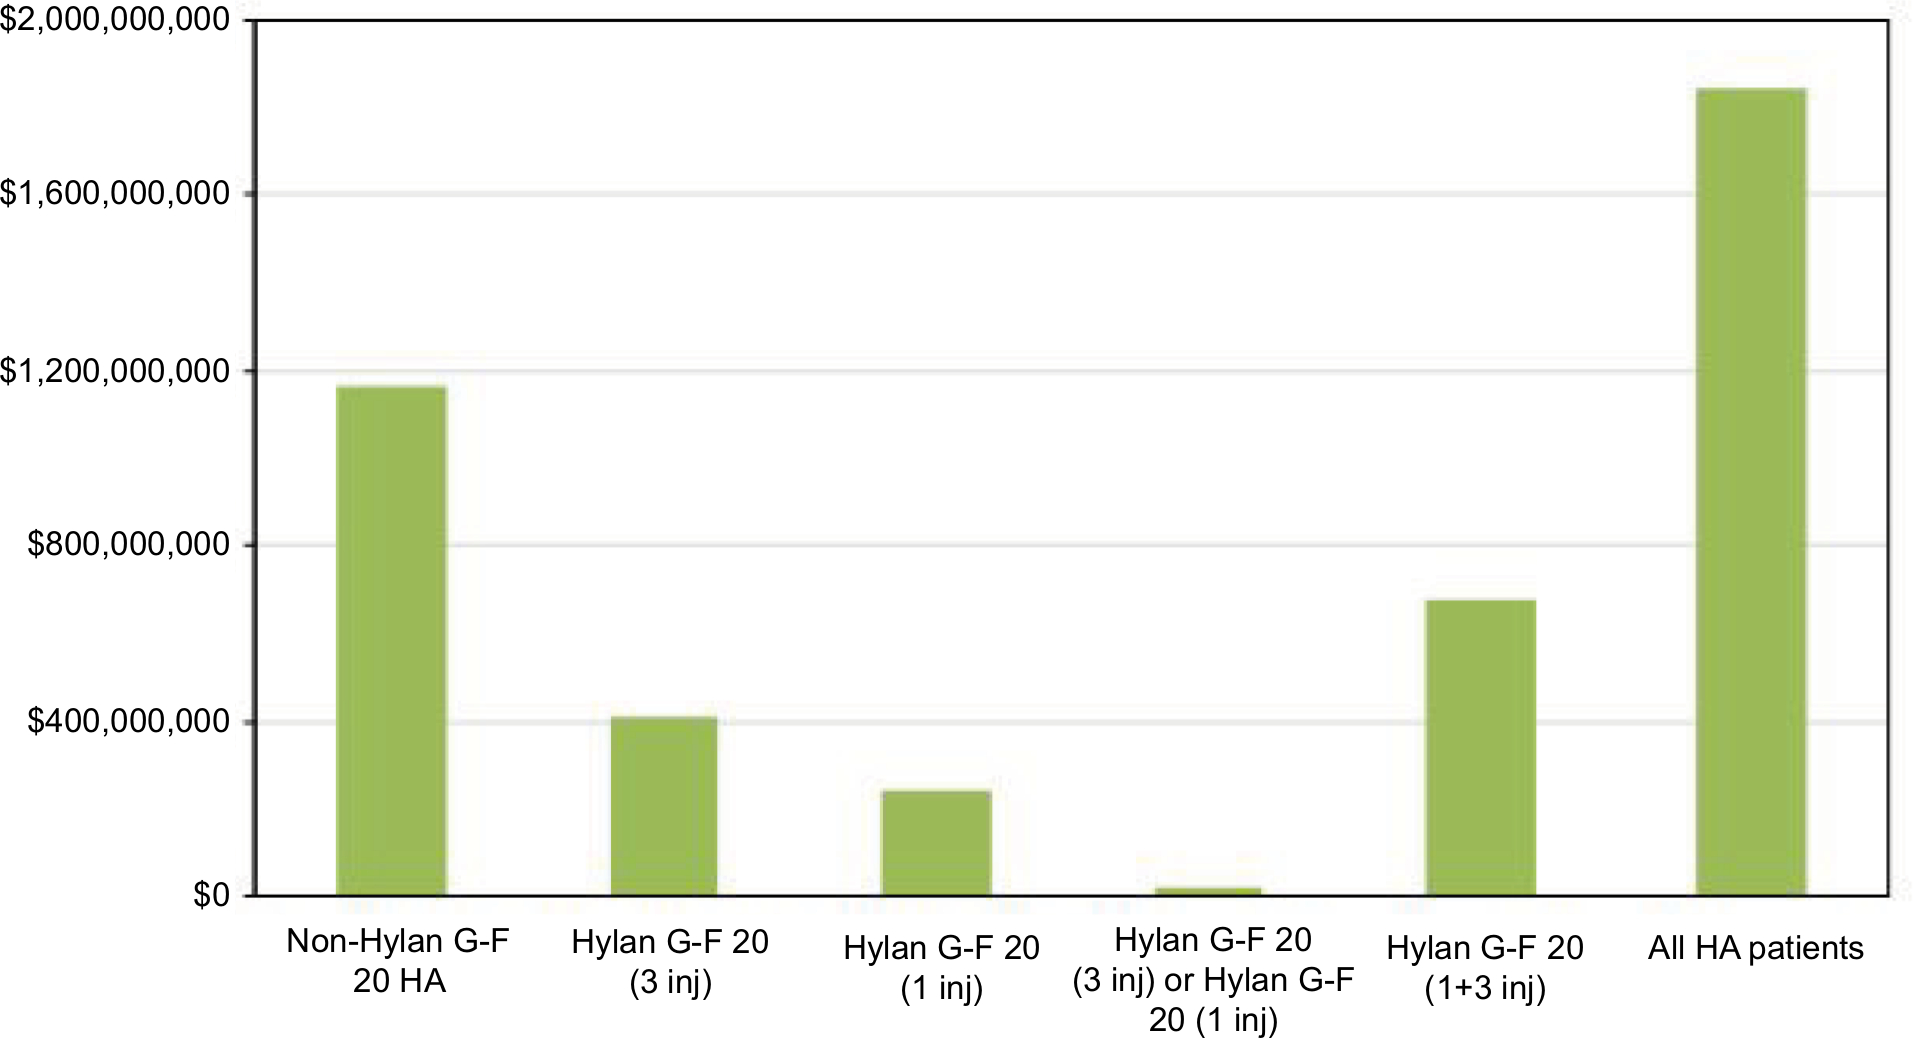 | Figure 4 Estimated costs of $1.84B for HA patients who did not undergo KA during the study period, if they had, instead, undergone KA without delay. Abbreviations: KA, knee arthroplasty; HA, hyaluronic acid. |
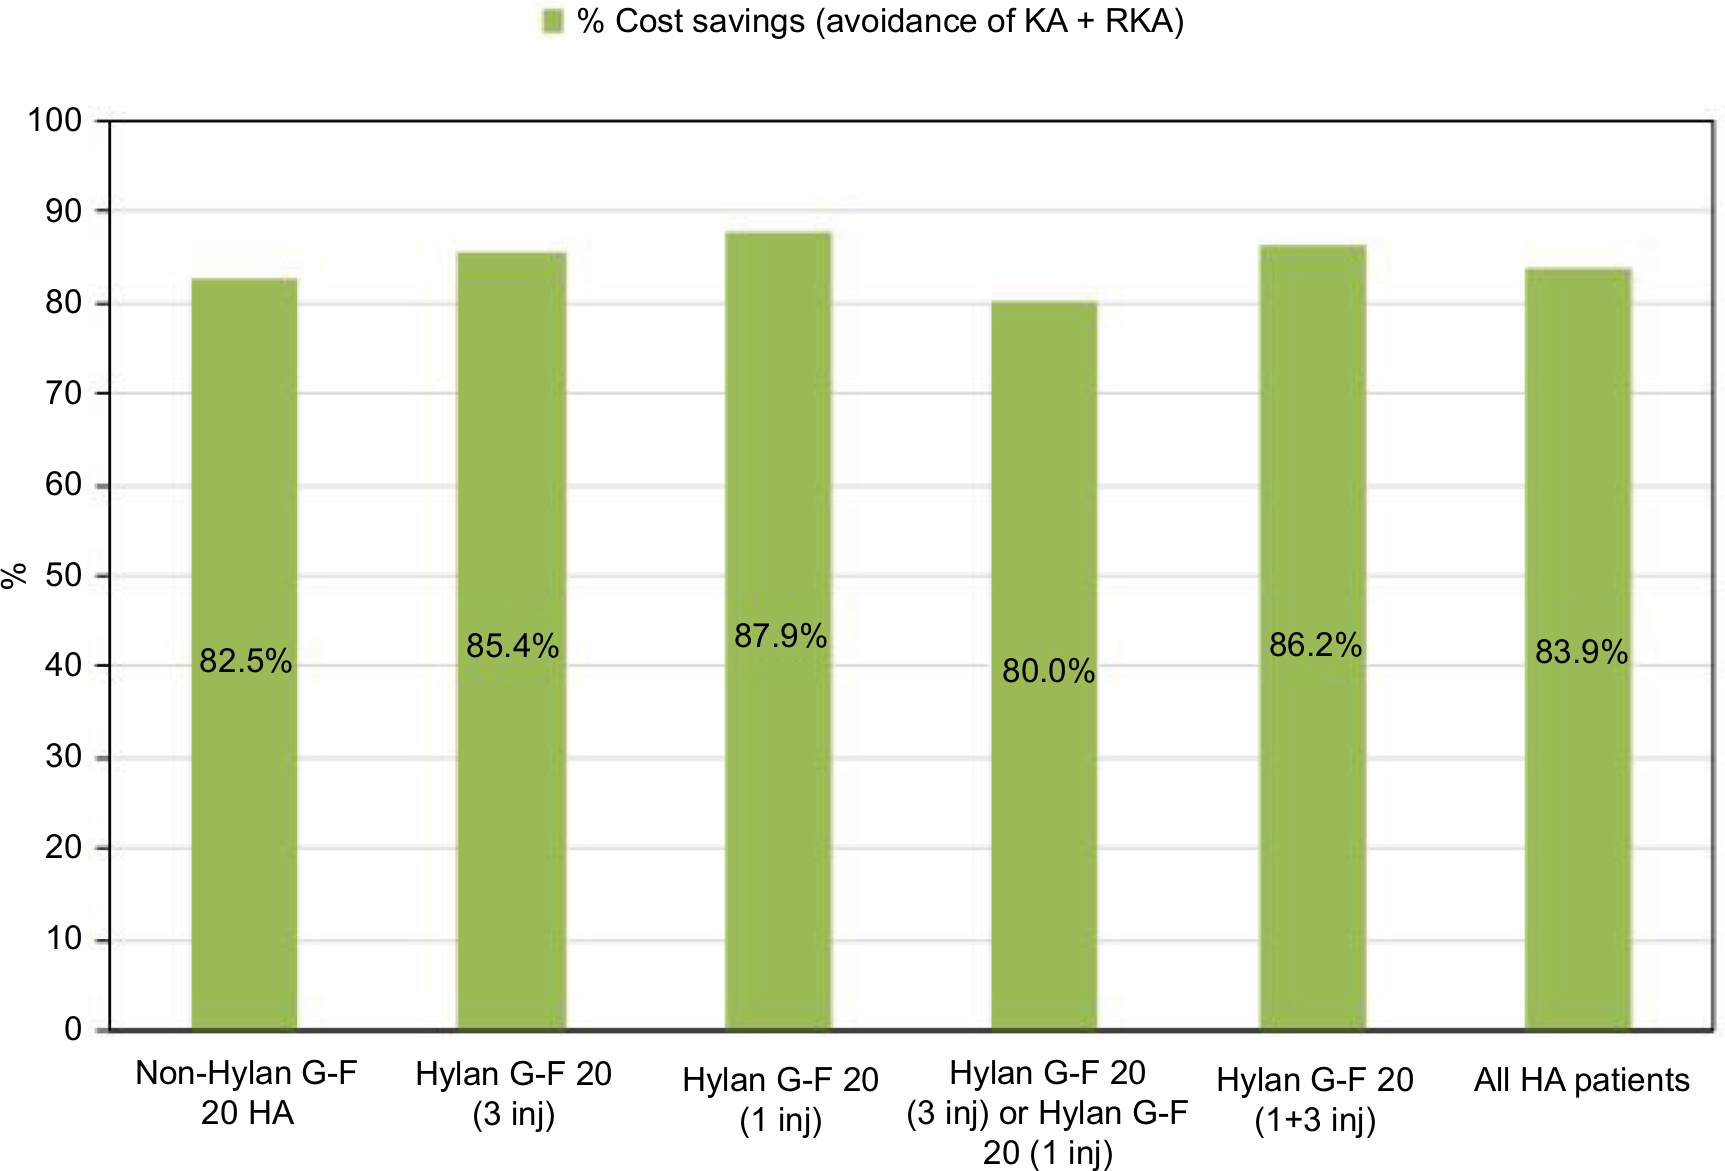 | Figure 5 Estimated savings by not undergoing KA and RKA for HA patients who did not undergo KA during the 2-year study period. Abbreviations: KA, knee arthroplasty; RKA, revision KA; HA, hyaluronic acid. |
From the specific clinical categories considered in the study, there was a greater prevalence of KA patients who utilized opioids, NSAIDs, and PT compared to the non-KA patients (Table 3). KA patients also tended to have more office visits than the non-KA patients. For example, for the no HA group, the average number of office visits was 10.6 for those with KA and 2.4 for those without KA. Similarly, non-hylan G-F 20 HA patients with KA and without KA averaged 17.9 and 10.2 office visits, respectively, while hylan G-F 20 (3 inj) or hylan G-F 20 (1 inj) patients with KA and without KA averaged 15.9 and 7.9 office visits, respectively. KA patients incurred an additional cost of $6,920–$9,429 in their average knee OA-related cost following KA (Table 4). Of the clinical categories examined in this study, the additional costs following KA were primarily from PT, followed by office visits, NSAIDs, knee arthroscopy, and opioids (Table 5). Moreover, the biggest relative changes pre- and post-KA appeared to be from PT costs, followed by opioid costs.
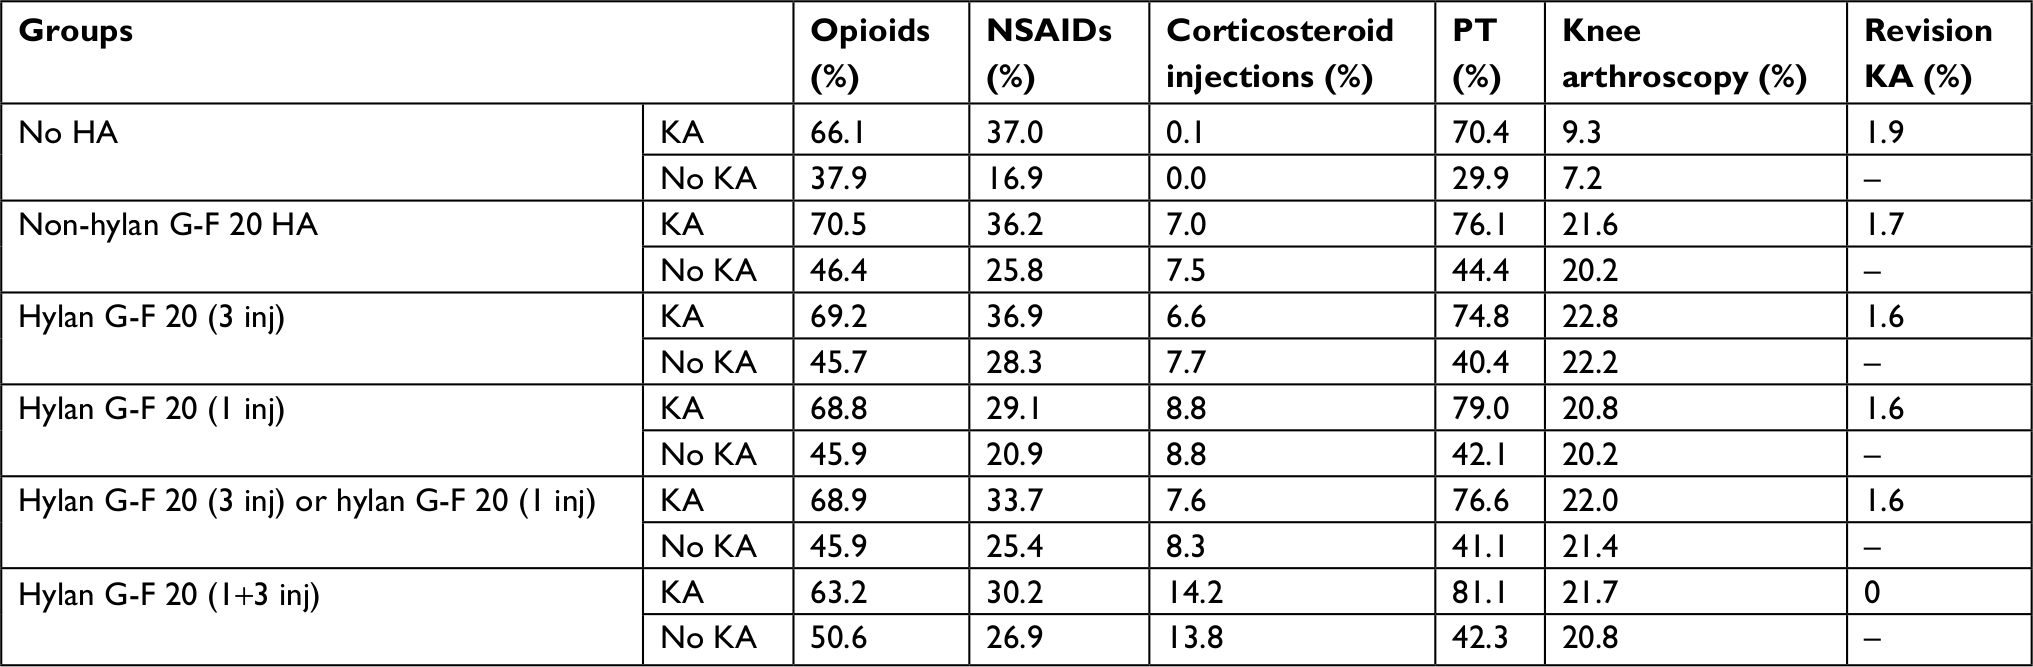 | Table 3 Prevalence of use of opioids, NSAIDs, corticosteroid injections, PT, and knee arthroscopy Abbreviations: HA, hyaluronic acid; NSAIDs, nonsteroidal anti-inflammatory drugs; PT, physical therapy; KA, knee arthroplasty. |
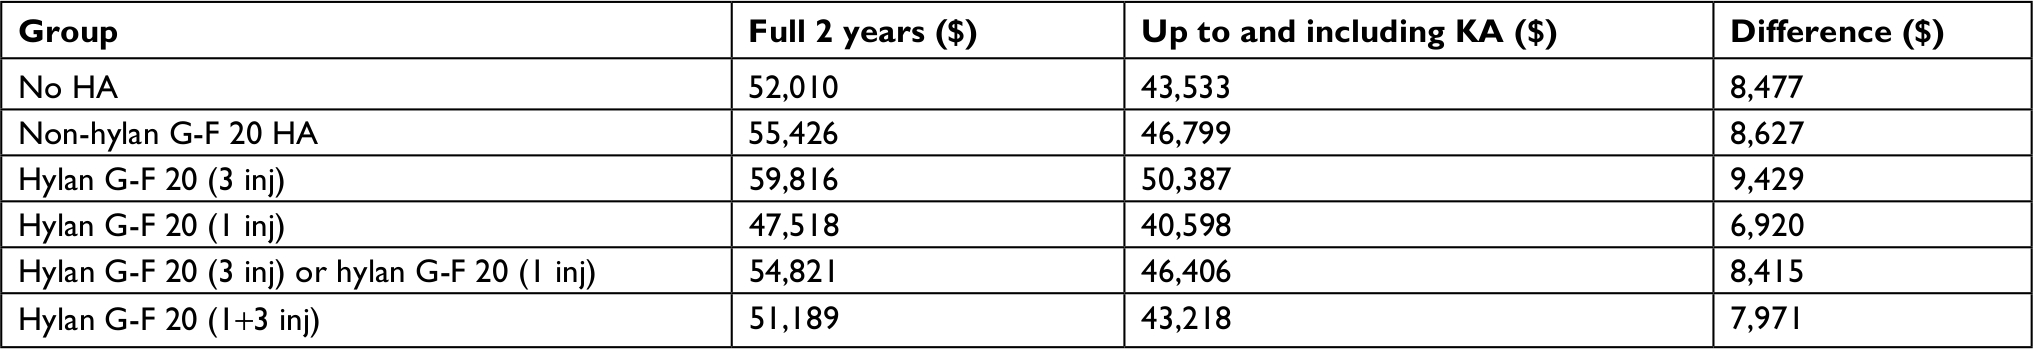 | Table 4 Average knee OA-related costs up to and including KA and during the full 2-year period for KA patients Abbreviations: KA, knee arthroplasty; HA, hyaluronic acid; OA, osteoarthritis. |
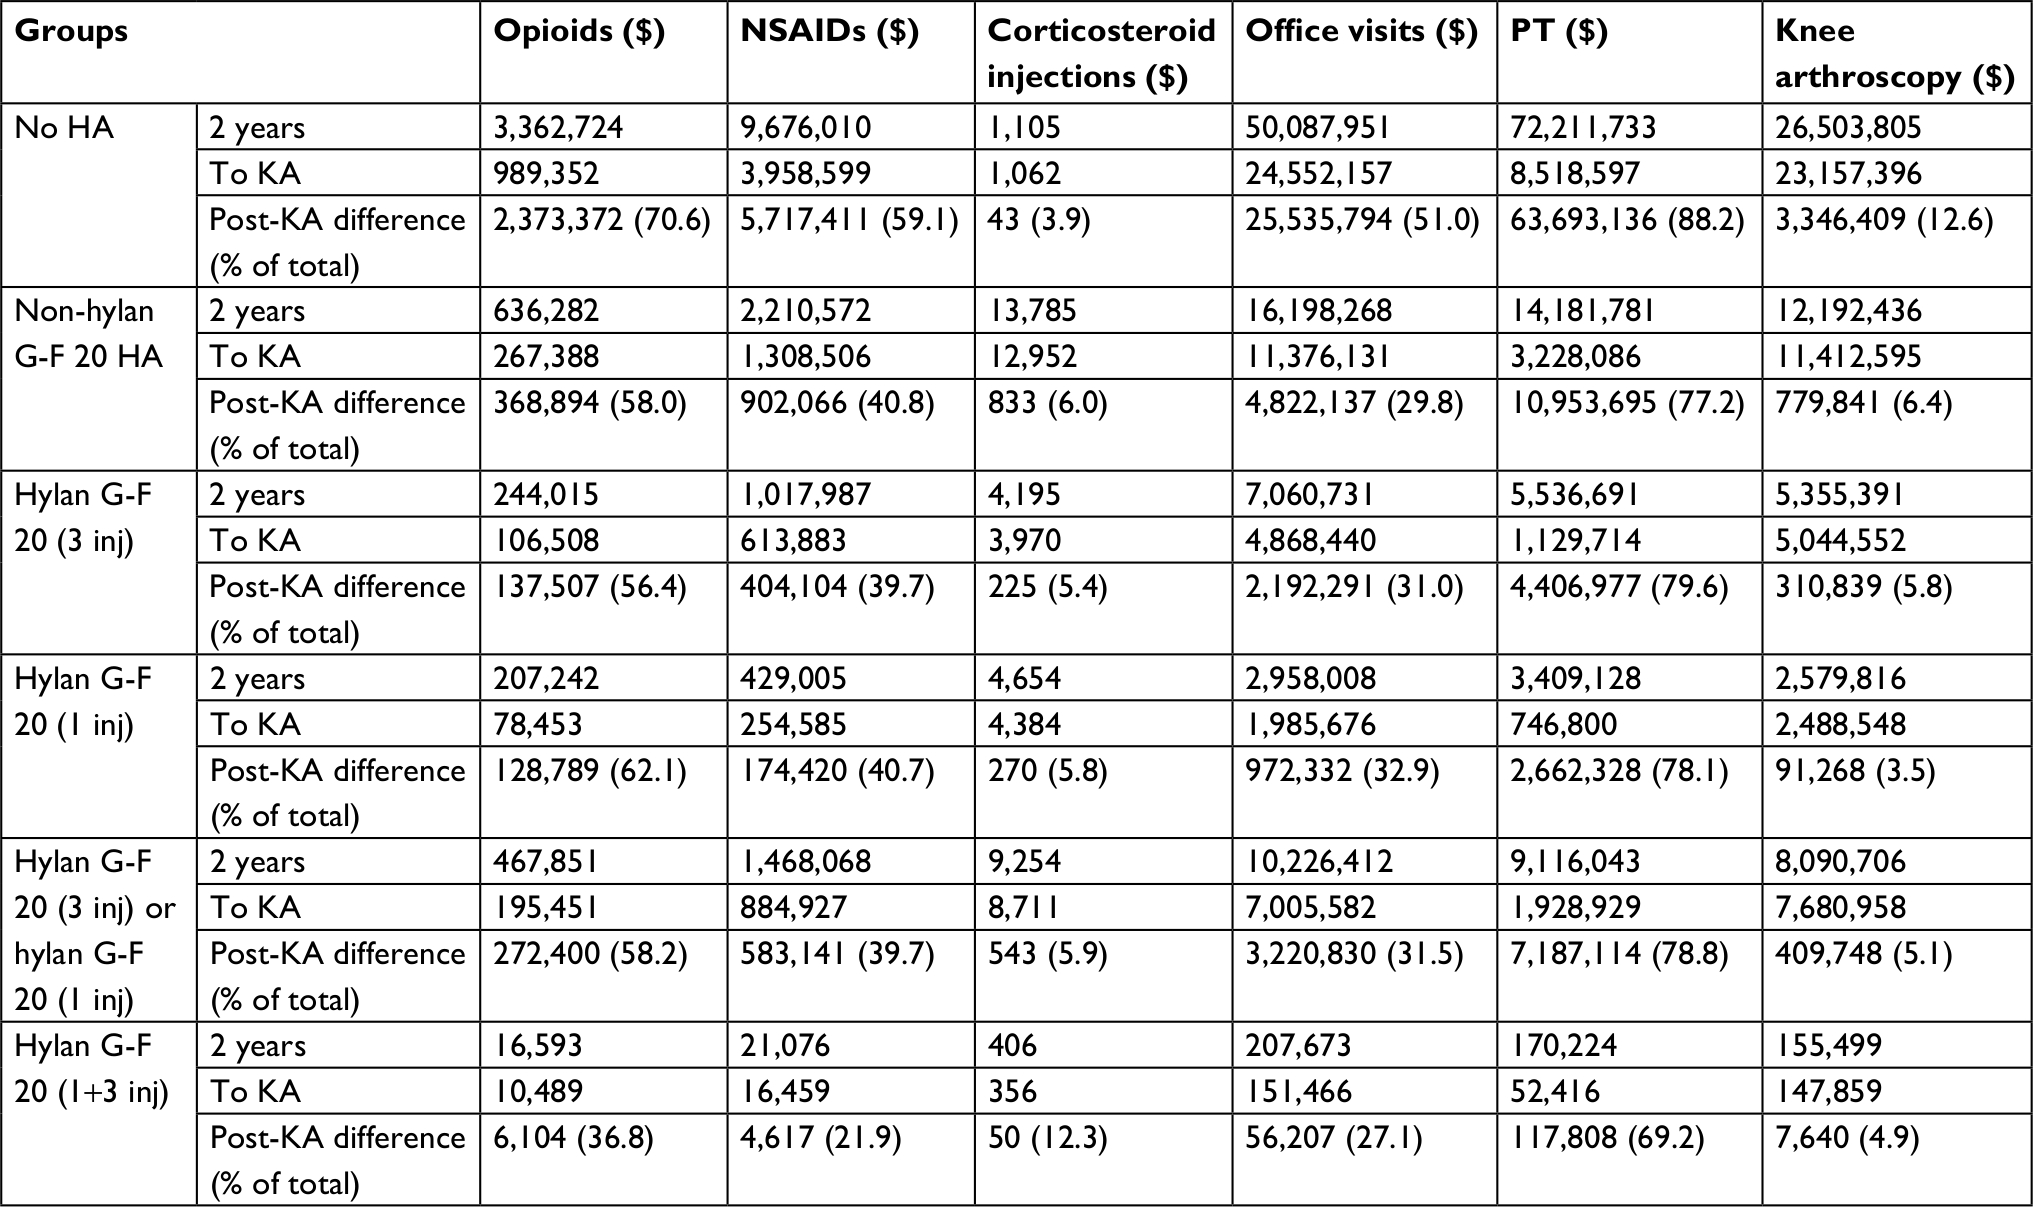 | Table 5 Knee OA-related costs by specific clinical category up to and including KA and during the full 2-year period for KA patients Abbreviations: HA, hyaluronic acid; NSAIDs, nonsteroidal anti-inflammatory drugs; PT, physical therapy; KA, knee arthroplasty; OA, osteoarthritis. |
Discussion
Our analysis of over 2 million privately insured knee OA patients showed that the cost of treating these patients was almost $5B over a 2-year period following knee OA diagnosis. For the HA patients who subsequently underwent KA within 2 years of the knee OA, the cost of HA only contributed to 1.7% of the overall cost of treating those patients. A large proportion (84.1%) of HA patients also did not undergo KA within 2 years of knee OA diagnosis. If these patients had, instead, been treated immediately with KA (and subsequent RKA), it would have cost an estimated $1.84B. By not undergoing KA (and subsequent RKA) within 2 years of knee OA, these HA patients had potential savings of $1.54B, after accounting for other therapies that were utilized.
Our study found that the combination of the majority of HA patients not undergoing KA (and subsequent RKA) and the substantial cost differences for those who do and do not undergo KA, corresponded to an estimated cost savings of $1.54B (83.9% or $20,740 per patient). This was a conservative estimate because while it included the potential cost of subsequent RKA, it did not include other post-KA care and interventions, such as PT, office visits, NSAIDs, and opioids. Our patient cohort encountered about $7,000–$9,000 per patient in additional costs following primary KA (Table 4). This included the average cost of about $460–$680 for RKA per primary KA patient, but substantial costs for other treatments following KA still remain. Thus, opting for nonoperative treatment may be perceived by private payers to be less costly,13 particularly if patients are able to avoid KA,12 which applied to >80% of the HA patients in our study. Moreover, if patients are able to delay surgery, as has been observed in previous studies,10–12 some patients may change insurers or become eligible for Medicare, in turn, resulting in savings to the initial insurer.13 Further improvement in knee OA symptoms or even delay to surgery may be provided by multiple courses of HA therapy.10,14,15 However, there may be detrimental effects on the net earnings by delaying KA over opting to undergo nonoperative care. Bedair et al estimated that there would be a loss in net earnings between $70,000 and $106,000 by delaying KA by 1–10 years over nonoperative treatment.13 On the other hand, Mari et al did not find any support for early TKA over late TKA from a cost-utility perspective.16
In our cohort of HA patients who underwent KA within 2 years of the knee OA (15.9%), HA contributed to a disproportionately small fraction (1.7%) of the total cost for treating these patients. The contribution of HA to the cost of patient care has been examined from various perspectives. Bedard et al examined the costs of non-arthroplasty management of knee OA in the year prior to TKA.8 They reported that 29.3% of non-inpatient costs were due to HA and concluded that the costs would decrease by 45% if the use of interventions was limited to those recommended by AAOS Clinical Practice Guidelines. However, Bedard et al failed to consider surgical interventions, such as knee arthroscopy, in the year prior to TKA, which would be more costly than the nonsurgical options examined in their study. The Medicare national average rates for knee arthroscopy are about $560–$870 for physicians, $2,200 for hospital outpatient rates, $1,200 for ambulatory surgical center rates, and at least $7,500 if inpatient stays are required.17 In contrast, Bedard et al identified a lower average cost of up to $822 per patient receiving HA treatment.9 Using commercial claims data of TKA patients, Weick et al reported that HA injections accounted for 16% of all knee OA-related payments in the 12 months prior to TKA.18 They suggested that decreasing its use may represent a substantial cost savings that does not adversely impact the quality of care. However, both the Weick and Bedard studies considered non-arthroplasty costs leading up to the TKA surgery, but failed to consider those costs in the context of the TKA costs. TKA represents the largest source of per-person lifetime costs for knee OA-related care.2 Postoperative costs related to the TKA surgery, such as PT, office visits, and RKA, also add to the arthroplasty-related cost of care. Moreover, high molecular weight HA has been reported to be cost-effective in treating knee OA compared to conventional care including NSAIDs19 or when added to usual care, which includes NSAIDs along with acetaminophen, PT, and lifestyle changes.20 Yet, NSAIDs has a “strong” recommendation under the AAOS Clinical Practice Guidelines but HA is strongly not recommended.21 Other studies have also concluded that HA is not inferior to NSAIDs.22,23
Although our study attempted to capture the costs related to treating knee OA within 2 years following diagnosis of the disease, we were unable to include the costs associated with over-the-counter medications, even though our analysis included prescription medications. Furthermore, the analysis was based on prescriptions, but not consumption. Our results were also limited by the relatively short look back period of 6 months with no previous knee OA diagnosis and the 2-year window following knee OA diagnosis. It is unclear to what extent the different contributions to the cost of treating these patients may change over a longer time period. We were also unable to include indirect costs. Our findings are also based on costs from the payer perspective, not from societal or hospital perspectives. Our study had several strengths. It relied on real-world data from a large sample size of over 2 million knee OA patients. It also included knee OA patients of all ages. Knee OA-related costs were analyzed from various sources, including professional services, facility fees, prescription medications, as well as non-arthroplasty and arthroplasty interventions.
Conclusion
Our study estimated substantial cost savings through a large percentage of HA patients not undergoing KA and subsequent RKA. Although a fraction of patients moved on from their conservative therapy to undergo KA within the 2-year period, HA attributed to <2% of their total treatment costs. With many therapies available for treating knee OA, efforts should focus on identifying the most appropriate candidates for arthroplasty and non-arthroplasty therapies, such as HA or other non-HA therapies, to help reduce costs to the health care system.
Acknowledgment
This study was supported by Sanofi US.
Disclosure
KLO, MR, and EL are employees of Exponent, Inc, a scientific and engineering consulting firm. Exponent, Inc received funding from Sanofi US for this study. Exponent, Inc has been paid fees by companies and suppliers for KLO’s consulting services on behalf of the following companies and suppliers: Stryker Orthopaedics, Zimmer Biomet, Ethicon, Ferring Pharmaceuticals, Paradigm Spine, Medtronic, Pacira Pharmaceuticals, DJO, and Ossur. RDA has been a paid consultant for Ferring Pharmaceuticals, Novartis, Pfizer and an unpaid consultant for Sanofi-Aventis. The authors report no other conflicts of interest in this work.
References
Arthritis Foundation. Arthritis by the Numbers: Book of Trusted Facts and Figures; 2017. Available from: https://www.arthritis.org/Documents/Sections/About-Arthritis/arthritis-facts-stats-figures.pdf. Accessed May 24, 2017. | ||
Losina E, Paltiel AD, Weinstein AM, et al. Lifetime medical costs of knee osteoarthritis management in the United States: impact of extending indications for total knee arthroplasty. Arthritis Care Res. 2015;67(2):203–215. | ||
Murphy L, Helmick CG. The impact of osteoarthritis in the United States: a population-health perspective: a population-based review of the fourth most common cause of hospitalization in U.S. adults. Orthop Nurs. 2012;31(2):85–91. | ||
Kurtz SM, Ong KL, Lau E, et al. International survey of primary and revision total knee replacement. Int Orthop. 2011;35(12):1783–1789. | ||
Bozic KJ, Stacey B, Berger A, Sadosky A, Oster G. Resource utilization and costs before and after total joint arthroplasty. BMC Health Serv Res. 2012;12:73. | ||
Cohen JR, Bradley AT, Lieberman JR. Preoperative interventions and Charges before total knee arthroplasty. J Arthroplasty. 2016;31(12): e2737:2730–2735. | ||
Maheu E, Rannou F, Reginster J-Y. Efficacy and safety of hyaluronic acid in the management of osteoarthritis: evidence from real-life setting trials and surveys. Semin Arthritis Rheum. 2016;45(4 Suppl): S28–S33. | ||
Schmajuk G, Bozic KJ, Yazdany J. Using Medicare data to understand low-value health care: the case of intra-articular hyaluronic acid injections. JAMA Intern Med. 2014;174(10):1702–1704. | ||
Bedard NA, Dowdle SB, Anthony CA, et al. The AAHKS clinical Research Award: what are the costs of knee osteoarthritis in the year prior to total knee arthroplasty? J Arthroplasty. 2017;32(9S):S8–S10.e1. | ||
Altman R, Lim S, Steen RG, Dasa V. Hyaluronic acid injections are associated with delay of total knee replacement surgery in patients with knee osteoarthritis: evidence from a large U.S. health claims database. PLoS One. 2015;10(12):e0145776. | ||
Ong KL, Anderson AF, Niazi F, Fierlinger AL, Kurtz SM, Altman RD. Hyaluronic acid injections in Medicare knee osteoarthritis patients are associated with longer time to knee arthroplasty. J Arthroplasty. 2016;31(8):1667–1673. | ||
Waddell DD, Joseph B. Delayed total knee replacement with Hylan G-F 20. J Knee Surg. 2016;29(2):159–168. | ||
Bedair H, Cha TD, Hansen VJ. Economic benefit to society at large of total knee arthroplasty in younger patients: a Markov analysis. J Bone Joint Surg Am. 2014;96(2):119–126. | ||
Navarro-Sarabia F, Coronel P, Collantes E, et al. A 40-month multicentre, randomised placebo-controlled study to assess the efficacy and carry-over effect of repeated intra-articular injections of hyaluronic acid in knee osteoarthritis: the AMELIA project. Ann Rheum Dis. 2011;70(11):1957–1962. | ||
Turajane T, Amphansap T, Labpiboonpong V, Maungsiri S. Total knee replacement following repeated cycles of intra-articular sodium hyaluronate (500-730 kDa) in failed conservative treatment of knee osteoarthritis: a 54-month follow-up. J Med Assoc Thai. 2009;92(Suppl 6):S63–S68. | ||
Mari K, Dégieux P, Mistretta F, Guillemin F, Richette P. Cost utility modeling of early vs late total knee replacement in osteoarthritis patients. Osteoarthritis Cartilage. 2016;24(12):2069–2076. | ||
Covidien. 2015 Sports Surgery: Medicare Reimbursement Coding Guide; 2015. Available from: http://www.covidien.com/imageServer.aspx/doc336881.pdf?contentID=76487&contenttype=application/pdf. Accessed May 25, 2017. | ||
Weick JW, Bawa HS, Dirschl DR. Hyaluronic acid injections for treatment of advanced osteoarthritis of the knee: utilization and cost in a national population sample. J Bone Joint Surg Am. 2016;98(17):1429–1435. | ||
Hatoum HT, Fierlinger AL, Lin S-J, Altman RD. Cost-effectiveness analysis of intra-articular injections of a high molecular weight bioengineered hyaluronic acid for the treatment of osteoarthritis knee pain. J Med Econ. 2014;17(5):326–337. | ||
Hermans J, Reijman M, Goossens LM, Verburg H, Bierma-Zeinstra SMA, Koopmanschap MA. A cost utility analysis of high molecular weight hyaluronic acid for knee osteoarthritis in everyday clinical care in patients in the working age. An economic evaluation of a randomized clinical trial. Arthritis Care Res. 2018;70(1):89–97. | ||
American Academy of Orthopaedic Surgeons (AAOS). Treatment of Osteoarthritis of the Knee: Evidence-Based Guideline. 2nd ed. USA: AAOS; 2013. Available from: http://www.aaos.org/research/guidelines/TreatmentofOsteoarthritisoftheKneeGuideline.pdf. Accessed May 25, 2017. | ||
Bannuru RR, Vaysbrot EE, Sullivan MC, Mcalindon TE. Relative efficacy of hyaluronic acid in comparison with NSAIDs for knee osteoarthritis: a systematic review and meta-analysis. Semin Arthritis Rheum. 2014;43(5):593–599. | ||
Ishijima M, Nakamura T, Shimizu K, et al. Intra-articular hyaluronic acid injection versus oral non-steroidal anti-inflammatory drug for the treatment of knee osteoarthritis: a multi-center, randomized, open-label, non-inferiority trial. Arthritis Res Ther. 2014;16(1):R18. |
 © 2019 The Author(s). This work is published and licensed by Dove Medical Press Limited. The full terms of this license are available at https://www.dovepress.com/terms.php and incorporate the Creative Commons Attribution - Non Commercial (unported, v3.0) License.
By accessing the work you hereby accept the Terms. Non-commercial uses of the work are permitted without any further permission from Dove Medical Press Limited, provided the work is properly attributed. For permission for commercial use of this work, please see paragraphs 4.2 and 5 of our Terms.
© 2019 The Author(s). This work is published and licensed by Dove Medical Press Limited. The full terms of this license are available at https://www.dovepress.com/terms.php and incorporate the Creative Commons Attribution - Non Commercial (unported, v3.0) License.
By accessing the work you hereby accept the Terms. Non-commercial uses of the work are permitted without any further permission from Dove Medical Press Limited, provided the work is properly attributed. For permission for commercial use of this work, please see paragraphs 4.2 and 5 of our Terms.