")
Back to Journals » International Journal of General Medicine » Volume 17
Correlations of m6A Methylation-Related lncRNAs with the Prognosis of Papillary Thyroid Carcinoma
Received 24 November 2023
Accepted for publication 23 February 2024
Published 5 March 2024 Volume 2024:17 Pages 775—790
DOI https://doi.org/10.2147/IJGM.S449827
Checked for plagiarism Yes
Review by Single anonymous peer review
Peer reviewer comments 2
Editor who approved publication: Dr Scott Fraser
Xiang Li,1 Zigang Ding,1 Yun Tong2
1Department of General Surgery, The Affiliated Hospital of Jiujiang University, Jiujiang, People’s Republic of China; 2Department of Pain, The Affiliated Hospital of Jiujiang University, Jiujiang, People’s Republic of China
Correspondence: Yun Tong, The Affiliated Hospital of Jiujiang University, No. 57 East Xunyang Road, Jiangxi, Jiujiang 332000, People’s Republic of China, Email [email protected]
Purpose: Papillary thyroid carcinoma (PTC) is the most common subtype of thyroid cancer. Recurrence makes the prognosis for some patients with PTC worse. Increasing evidence have suggested that N6-methyladenosine (m6A) RNA methylation plays an important role in tumorigenesis. However, the significance of m6A-related lncRNAs in the malignant progression of PTC remains unknown. In this study, we explored the significance of M6A-related lncrnas in the malignant progression of PTC.
Patients and Methods: Transcriptome and clinical data of PTC were achieved and integrated from The Cancer Genome Atlas (TCGA). Firstly, a Spearman correlation analysis was performed to obtain m6A RNA methylation-associated lncRNAs. Next, We constructed a prognostic signature and assessed the accuracy of the signature by receiver operating characteristic (ROC) curve and Kaplan Meier survival analyses. Furthermore, functional enrichment analysis was performed on the high- and low-risk groups. Finally, we determined prognostic gene expression in clinical samples using quantitative reverse transcription polymerase chain reaction (RT-qPCR).
Results: We identified 56 differentially expressed lncRNAs associated with m6A RNA methylation. Univariate Cox and Least Absolute Shrinkage and Selection Operator (LASSO) regression analyses showed that the survival-related lncRNAs associated with m6A RNA methylation were detected, which showed superior calibration and discrimination. Moreover, the biological processes related to energy metabolism were significantly activated in the high-risk group. Finally, the co-expressed genes of lncRNAs in the risk model were significantly enriched in biological processes related to copper ion response. Finally, we validated the expression levels of three prognostic genes in clinical samples using RT-qPCR.
Conclusion: Our study revealed m6A RNA methylation-associated lncRNAs were significantly associated with disease-free survival in patients with papillary thyroid cancer, which would improve our understanding of the relationship between m6A RNA methylation-associated lncRNAs and PTC.
Keywords: Papillary thyroid carcinoma, m6a RNA methylation, lncrna, PROGNOSIS, disease-free survival
Introduction
Thyroid carcinoma (TC), with increasing incidence in recent years, is one of the most frequent endocrine neoplasia.1 According to statistics in 2018, the global incidence of TC in women reached 10.2 per 100,000 people, accounting for 5.12% of all female malignancies.2 TC can be divided into four types: papillary thyroid carcinoma (PTC), follicular thyroid carcinoma, medullary thyroid carcinoma, and anaplastic thyroid carcinoma.3 PTC is the most common pathological type of thyroid cancer, accounting for about 70–90% of all thyroid cancers.4,5 Although most PTC patients have a good prognosis, there are still more than 10% of patients who encounter tumor recurrence or metastasis in long-term follow-up.6 These patients with metastases or relapses have a significantly higher mortality rate, and the difficulty of retreatment is increased. Therefore, it is necessary to find new potential recurrence-related markers.7,8
N-6 methyladenosine (m6A) modification, the most dominant modification form of RNA in eukaryotic cells,9 is a dynamic and reversible process regulated by a “writer” (methyltransferase), an “eraser” (demethylase) and a “reader” (binding protein).10 The “writer” catalyzes the formation of m6A methylation, which is mainly composed of METTL3, METTL14, WTAP, KIAA1429, METTL16, RBM15, and ZC3H13; The “eraser” mediates the removal of M6A methylation, which consists of FTO and ALKBH5; The “reader” affects the biological function of mRNA by specifically recognizing methylated adenosine on mRNA, which is mainly composed of YTHDF1/2/3, YTHDC1/2, HNRNPA2B1, HNRNPC11, and HNRNPG.11 Previous studies have shown that m6A methylation plays an important role in the occurrence and development of a variety of malignant tumors.12,13 The mechanisms may involve many stages of gene expression, such as RNA splicing, maturation, translation, and degradation, and ultimately affect homeostasis, regulating the occurrence and progression of a variety of tumors.14 Many studies have proved that there is a close relationship between m6A methylation and PTC, and m6A-RNA methylation has a significant impact on the prognosis of PTC patients.15,16
LncRNA is a nucleotide with a length of more than 200nt, which does not has protein-coding ability.17 In recent years, many studies have shown that lncRNA played an important role in the occurrence and development of a variety of malignant tumors.18,19 Meanwhile, many lncRNAs are closely related to the prognosis of patients with PTC, such as CASC2, FAM95B1, and UCA1.20,21 The relationship between m6A and lncRNA has also been mentioned more and more. m6A is reported to modify a variety of lncRNAs, which may affect lncRNAs by changing the structure of lncRNA, inhibiting mediated gene transcription, changing subcellular distribution, and regulating stability.22 Previous research has already reported on the role of m6A methylation-related lncRNAs in PTC.23 However, it is still necessary to conduct a more systematic analysis of the impact of m6A methylation-related lncRNAs on PTC. This is to discover additional m6A methylation-related lncRNAs potentially associated with PTC and to further enhance their predictive value.
In this study, we identified the lncRNAs related to the regulatory factors of m6A methylation by bioinformatics method and constructed a prognostic model for predicting PTC patients, which enriched the study on the lncRNAs related to m6A methylation in PTC and laid a theoretical foundation for clinical work and patient prognosis evaluation.
Materials and Methods
Data Collections
The RNA-seq transcription data including PTC tissues (381) and normal tissues (58) was collected from The Cancer Genome Atlas (TCGA, https://portal.gdc.cancer.gov/). And the clinical information was downloaded from cBioPortal (https://www.cbioportal.org/) database. Based on previously published literature, a total of 21 regulatory factors of m6A RNA methylation were obtained including 8 writers (METTL3, METTL14, METTL16, WTAP, VIRMA, RBM15, RBM15B, and ZC3H13), two erasers (FTO and ALKBH5), and 14 readers (YTHDC1, YTHDC2, IGF2BP1, IGF2BP2, IGF2BP3, YTHDF1, YTHDF2, YTHDF3, HNRNPC, HNRNPA2B1,RBMX, RBM15, RBM15B, and ZC3H13).
Identification of m6A RNA Methylation Related Differentially Expressed lncRNAs
Differentially expressed lncRNAs between tumor and normal samples, 381 PTC tissues and 58 normal tissues were served to perform differential analysis using the “limma”24 package in R. P values less than 0.05 and the absolute of log2-fold-change (FC) more than 1 were set to the threshold. Meanwhile, the R package “pheatmap”25 and “ggplot2”26 were used to draw the volcano plot and heatmap. Moreover, Spearman correlation analysis was performed between differentially expressed lncRNAs and 21 m6A RNA methylation regulators to obtain m6A RNA methylation-associated lncRNAs.
Construction of a Prognostic Signature of m6A RNA Methylation-Associated lncRNAs
TCGA papillary thyroid cancer samples were randomly divided into a training set and a validation set (7:3), and the training set was used to construct a prognostic gene signature. Univariate Cox regression analysis was carried out to identify prognosis related genes with P values < 0.05 using the R package “survival”.27 Subsequently, Least Absolute Shrinkage and Selection Operator (LASSO) regression analysis was performed to construct a prognostic gene signature via the R package “glmnet”.28
Evaluation and Validation of Prognostic Signature of m6A RNA Methylation-Associated lncRNAs
We first calculated the risk score for each PTC patient based on the risk coefficient obtained by LASSO regression analysis, and divided patients into high- and low-risk groups according to the median risk score. Then, the risk curve and its corresponding scatter plot, and gene expression heatmap was drawn in the R package. Kaplan-Meier (K-M) survival analysis was performed to compare the prognostic differences between high and low-risk patients using the R package “survival”. And the R package “surminer”29 was used to draw the K-M survival curves. Then, the R package “survivalROC”30 was used to draw the receiver operating characteristic (ROC) curves and the area under the curve (AUC) values were calculated to assess the accuracy and sensitivity of survival predictions. Moreover, we performed the same methods in the validation set to verify the generalizability and spreadability of the prognostic signature.
Univariate and Multivariate Cox Regression Analysis
Univariate and multivariate Cox regression analyses were used to evaluate the effects of risk score, age, pathologic_stage, and pathologic T, N, M on prognosis. Factors with a P value < 0.05 were considered independent prognostic factors.
Nomogram Predicting Survival in PTC Patients
The risk score and clinical characteristics were used to construct a nomogram predicting 1-, 3-, and 5-year survival in PTC patients using the ‘rms’31 package in R. Then, Calibration curves were drawn to evaluate the accuracy of the prediction. And closer the slope of the curve is to 1, the more accurate the prediction is. Furthermore, Decision Curve Analysis (DCA) was used to evaluate the prediction efficiency of the nomogram.
Gene Set Variation Analysis (GSVA)
Gene set variation analysis (GSVA) was conducted between high- and low-risk groups using the R package “gsva”.32 Then, the differentially expressed pathways were identified using the R package “limma”.
lncRNA-mRNA Coexpression Network
The differentially expressed genes (DEGs) were identified between high- and low-risk groups with |Log2FC| > 1 and P < 0.05. The resulting DEGs were used for Spearman correlation analysis with prognostic signature lncRNAs. In addition, Cytoscape was used to construct a lncRNA-mRNA coexpression network.
Functional Prediction of Coexpressed Genes
To further explore the function of lncRNA coexpressed genes, the Gene Ontology (GO) and Kyoto Encyclopedia of Genes and Genomes (KEGG) analyses were performed via “clusterProfiler”33 package in R.
Samples and Quantitative Real-Time Polymerase Chain Reaction (qRT -PCR)
Specimens were obtained from ten patients who had undergone surgical procedures at our institution, encompassing both their PTC tissues and adjacent normal tissues, and subsequently stored at −80°C. Ethical approval for this study was granted by our hospital’s institutional ethics committee, and sample collection and utilization adhered to approved protocols. Informed consent was duly obtained from all participating patients.
Total RNA was extracted from the obtained tissues using TRIzol reagent, followed by reverse transcription using PrimeScript RT Master Mix. The expression of target genes was analyzed using the SYBR Premix Ex Taq II PCR detection system, with GAPDH serving as the internal control reference. Normalized expression levels were calculated using the 2^-ΔΔCT method to determine the relative fold change. The primer sequences are provided in Table 1.
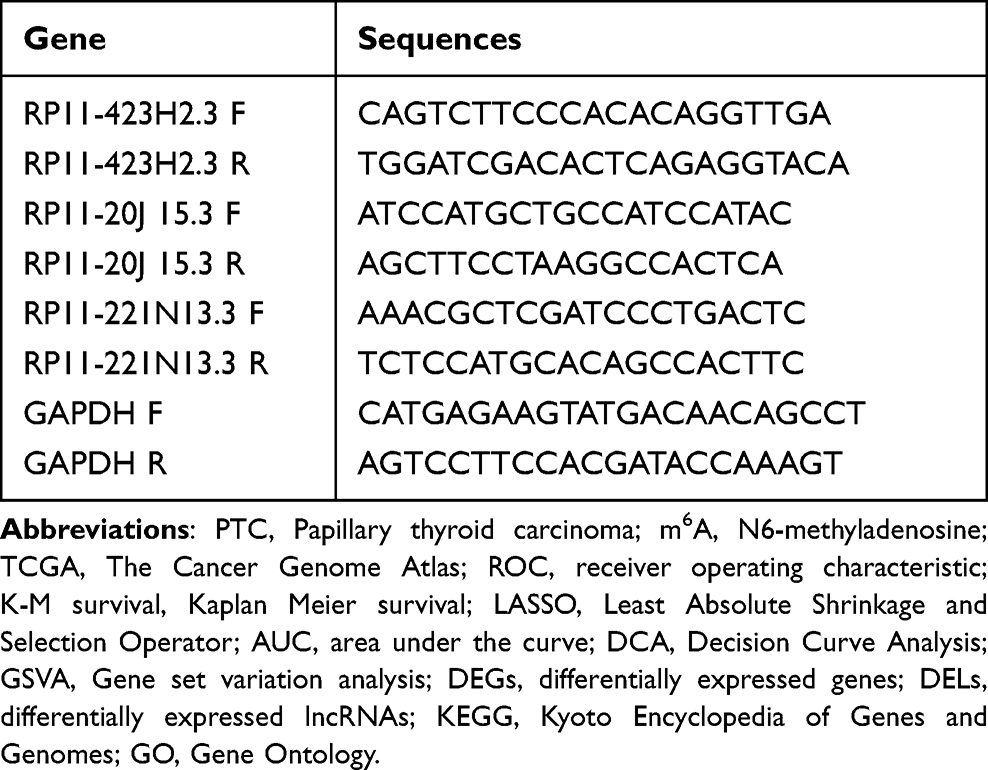 |
Table 1 Consists of a Collection of Primer Sequences Utilized in This Study |
Statistical Analysis
In the present study, all statistical analyses were performed in R (version 4.0.3) and P-values less than 0.05 were considered to be biometrically significant. The chi-square test was used to test for variation in clinicopathological characteristics.
Results
Fifty-Six Differentially Expressed lncRNAs Associated with m6A RNA Methylation Were Identified
First of all, a total of 81 DELs between PTC tissues and normal tissues were identified including 42 up-regulated DELs and 39 down-regulated DELs with adjusted P value < 0.05 and |Log2FC| > 0.5 (Supplementary Table S1). Volcano plot was used to show the distribution of DELs (Figure 1A). In addition, the heatmap gives us a general idea of the trend of DELs between PTC and normal groups (Figure 1B). Furthermore, to identify lncRNAs associated with m6A methylation, we performed Spearman correlation analysis of 81 DELs with 21 m6A methylation regulators, and 56 m6A RNA methylation related lncRNAs were identified with 丨Cor丨> 0.6 and P < 0.05 (Supplementary Table S2, Figure 1C).
 |
Figure 1 Identifying of differentially expressed lncRNAs (DELs) between normal tissues and PTC. (A) Volcano plot of DELs in normal tissues and PTC (|Log2FC| > 1 and adj. P value < 0.05), with red dots representing up-regulation, blue dots representing down-regulation and grey dots representing genes that are not significantly different. (B) Heatmap of lncRNAs differentially expressed between normal tissues and PTC. (C) Heat map of the correlation between m6A methylation regulators and DELs. |
A Prognostic Signature of Three m6A RNA Methylation-Associated lncRNAs
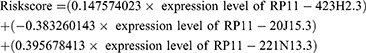
To assess whether these lncRNAs were associated with disease-free survival in patients with papillary thyroid cancer, we performed a univariate Cox regression analysis of 56 m6A RNA methylation-associated DELs. And only three lncRNAs (RP11-423H2.3, RP11-20J15.3, RP11-221N13.3) turned out to be significantly associated with disease-free survival of PTC patients (P < 0.05) (Figure 2A). Then, the LASSO regression analysis was used to screen the survival strongly related characteristics to construct a risk model. Finally, RP11-423H2.3 (Coef = 0.147574023), RP11-20J15.3 (Coef = −0.383260143), and RP11-221N13.3 (Coef = 0.395678413) were used to construct a prognostic signature with lambda.min was 0.0139 (Figure 2B and C). Next, the risk score was calculated based on the expression of lncRNAs per sample and risk coefficient as follow:
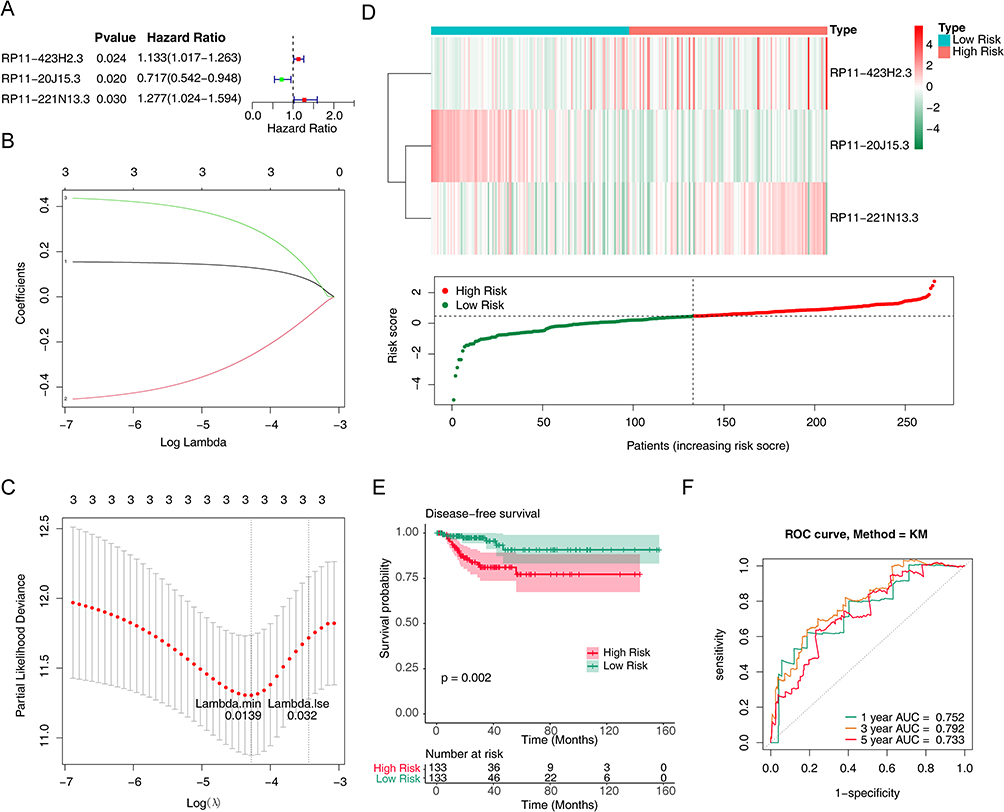 |
Figure 2 Prognostic value of m6A methylation-related lncRNAs in PTC patients in the training cohort. (A) Forest map of univariate Cox regression analysis on relationship between differential expression of lncRNAs associated with methylation of m6A RNA and prognosis of PTC. (B) Three m6A RNA methylation-associated DELs were selected by the least absolute shrinkage and selection operator (LASSO) Cox models. (C) Cross-validation for tuning parameter selection in the LASSO model. (D) Heatmap and scatter plot of risk scores constructed from lncRNAs in the training cohort. (E) Kaplan-Meier survival curves of the high and low risk groups in the training cohort. (F) Receiver operating characteristic (ROC) curves for predicting 1, 3, and 5-year disease-free survival of PTC patients in the training cohort. |
Meanwhile, the PTC patients were divided into high- and low-risk groups based on the median risk score. Then, the risk curve and its corresponding scatter plot were shown in Figure 2D. Clearly, the high-risk group was richer in patients with recurrence. And the expression heatmap showed that RP11-423H2.3 and RP11-221N13.3 were up-regulated in the high-risk group while RP11-20J15.3 was down-regulated (Figure 2D). In addition, the Kaplan-Meier survival curves showed that the higher the risk score, the lower the disease-free survival rate of the patient (P = 0.002) (Figure 2E). Furthermore, the ROC curve suggested that this prognostic signature has a strong sensitivity and accuracy in predicting disease-free survival while the AUCs for predicting 1, 3, and 5-year disease-free survival were 0.752, 0.792, and 0.733, respectively (Figure 2F).
Validation of the Prognostic Signature
We further validated the replicability of the prognostic signature in the validation set. Likewise, the risk curve and its corresponding scatter plot showed that the higher the risk score, the greater the probability that the patient will relapse (Figure 3A). RP11-423H2.3 and RP11-221N13.3 were up-regulated, and RP11-20J15.3 was down-regulated in the high-risk group, which were consistent with the training set (Figure 3A). In addition, Kaplan-Meier survival curves showed that patients with higher risk scores had lower disease-free survival than those with lower risk scores (P = 0.005) (Figure 3B). The AUCs of ROC curves for predicting 1-, 3- and 5-year disease-free survival of Papillary thyroid carcinoma patients in the validation set were 0.689, 0.757, and 0.637 (Figure 3C). In conclusion, these results suggested the stability in predicting disease-free survival of PTC patients of this prognostic signature.
 |
Figure 3 Prognostic value of m6A methylation-related lncRNAs in PTC patients in the validation cohort. (A) Heatmap and scatter plot of risk scores constructed from lncRNAs in the validation cohort. (B) Kaplan-Meier survival curves of the high and low risk groups in the validation cohort. (C) ROC curves for predicting 1, 3, and 5-year disease-free survival in PTC patients in the validation cohort. |
Association Between the Risk Signature and Clinical Characteristics
To further explore the correlation between risk scores and other clinicopathological characteristics, we divided the PTC patients into different clinical subgroups and compared the differences in risk scores. As it turned out, risk scores differed significantly only between T1 and T3 stages, which showed a significant association with the T stage (P > 0.05) (Figure 4A). However, there was no significant correlation between risk score and age, stage, M stage, and N stage (P > 0.05) (Figure 4B–E). Besides, we analyzed the expression of risk model genes according to risk score and different clinical characteristics, such as age, gender, stage, T stage, M stage, and N stage (Figure 4F). These results suggested that risk score might be a factor independent of other clinical characteristics that affected patients’ disease-free survival.
 |
Figure 4 Relationship between the risk score and clinicopathological features. (A) Relationship between risk score and tumor size or scope of invasion in PTC. (B) Relationship between risk score and lymph node metastasis of PTC. (C) Relationship between risk score and distant metastasis of PTC. (D) Relationship between risk score and tumor stage of PTC. (E) Relationship between risk score and patient age of PTC. (F) Heatmap of correlation between m6A methylation-related lncRNAs and different clinicopathological features of PTC. |
Independent Prognostic Value of the Prognostic Signature
Based on the above analyses, univariate and multivariate Cox regression analyses were further used to evaluate the independent prognostic capability of risk scores. Then, univariate Cox regression analysis preliminarily confirmed the independent ability of pathologic_stage (HR = 1.435, P = 0.007), pathologic_T stage (HR = 1.707, P = 0.003) and risk score (HR = 2.584, P < 0.001) (Figure 5A). Ultimately, only the risk score showed independent prognostic capability for disease-free survival in patients with papillary thyroid cancer (HR = 2.391, P < 0.001) (Figure 5B).
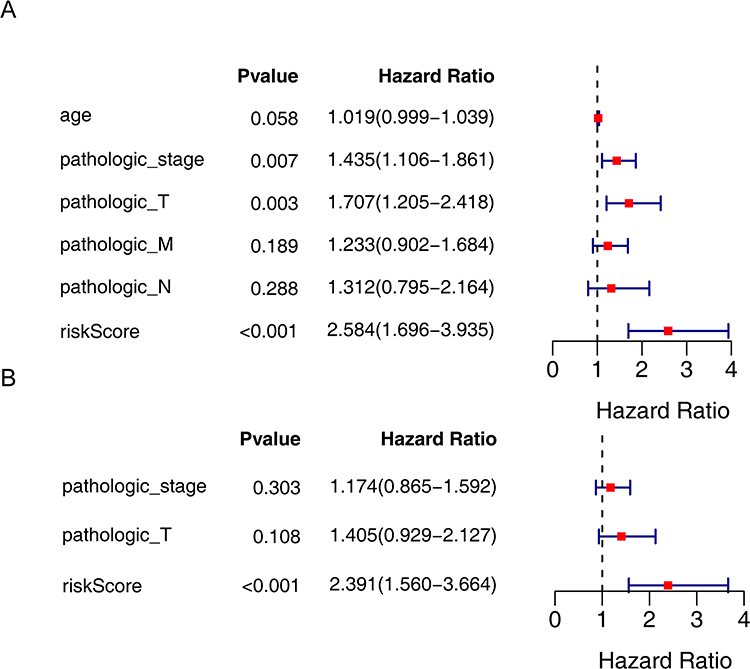 |
Figure 5 Analysis of independent prognostic factors for PTC. (A) Univariate Cox regression analysis of prognosis in PTC patients. (B) Multivariate Cox regression analysis of prognosis in PTC patients. |
Construction and Validation of a Nomogram Predicting Disease-Free Survival in Patients with Papillary Thyroid Cancer
According to the nomogram, each clinical characteristic was given its own score, and based on the sum of so scores, the patient’s disease-free survival could be predicted. Therefore, we incorporated pathologic_stage, age, pathologic_T stage, pathologic_N stage, pathologic_M stage and risk scores into the R package “rms” to construct a nomogram predicting disease-free survival at 1, 3 and 5 years for papillary thyroid cancer (Figure 6A). Subsequently, the calibration curves showed the high accuracy of the nomogram in predicting disease-free survival (Figure 6B). And the DCA showed that the nomogram had a stronger predictive capability than the simple prognostic signature (Figure 6C).
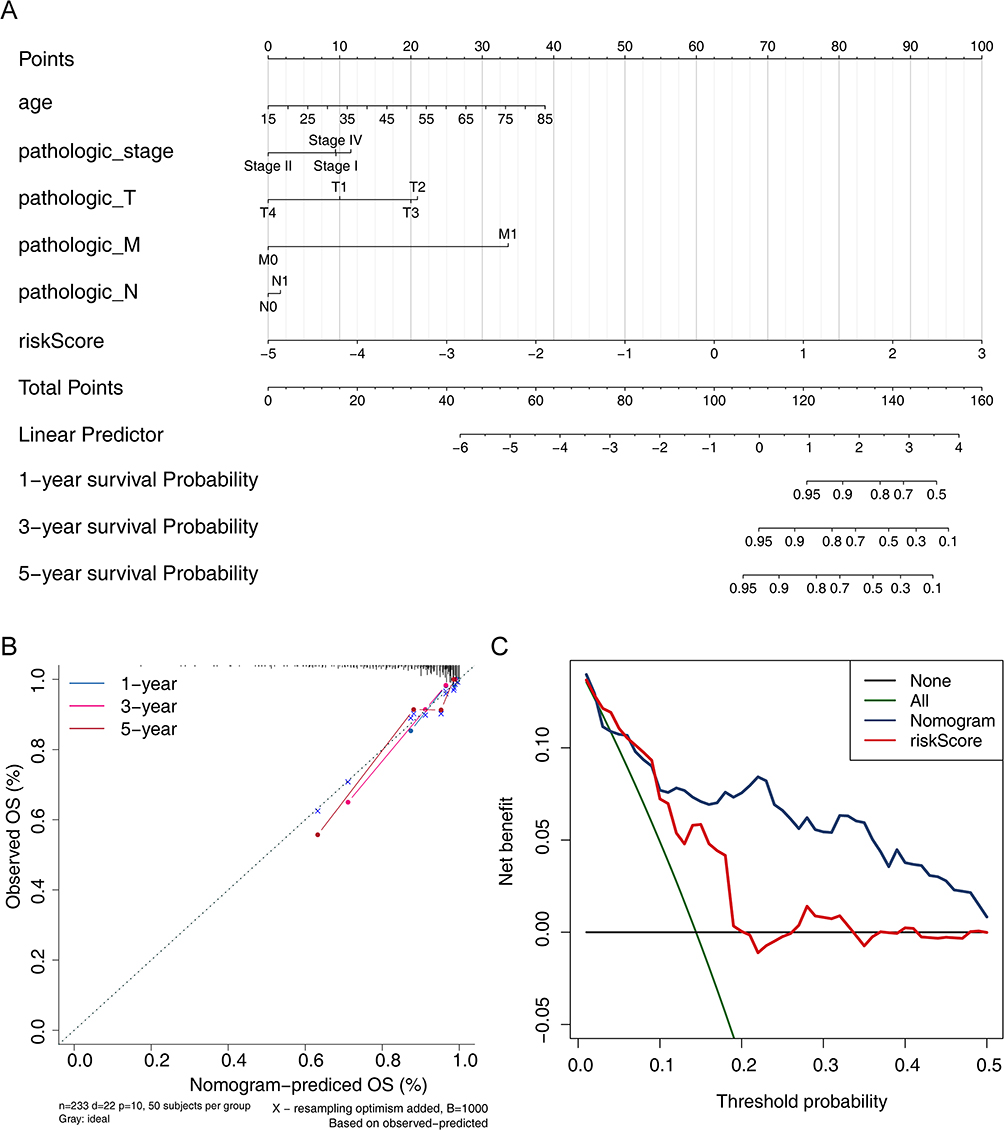 |
Figure 6 Prediction of 1-, 3-, and 5 year disease-free survival in PTC patients. (A) Nomogram for predicting 1, 3, and 5 year survival in PTC patients. (B) Nomogram calibration curves for predicting 1, 3, and 5 year survival in PTC patients. (C) Decision Curve Analysis (DCA) curves of nomogram. |
Functional Differences Between High- and Low- Risk Groups
We further explored the mechanisms underlying the differences in disease-free survival between high- and low-risk groups. GSVA results for GO showed that some biological processes related to energy metabolism were significantly activated, such as“GO_TRICARBOXYLIC_ACID_CYCLE”(P < 0.001), “GO_2_OXOGLUTARATE_METABOLIC_PROCESS”(P < 0.001), and “GO_AEROBIC_RESPIRATION”(P < 0.001). Meanwhile, cell composition of “GO_INNER_MITOCHONDRIAL_MEMBRANE_ORGANIZATION”(p = 8.89E-09) was also significantly activated (Supplementary Table S3, Figure 7A). In addition, KEGG pathways associated with energy metabolism were also significantly activated including “KEGG_GLYOXYLATE_AND_DICARBOXYLATE_METABOLISM”(P < 0.001), “KEGG_CITRATE_CYCLE_TCA_CYCLE”(P < 0.001), “KEGG_PROPANOATE_METABOLISM”(P < 0.001), and “KEGG_OXIDATIVE_PHOSPHORYLATION”(P < 0.001) (Supplementary Table S4, Figure 7B). In conclusion, these results suggested that papillary thyroid cancer consumed a lot of energy when it relapsed.
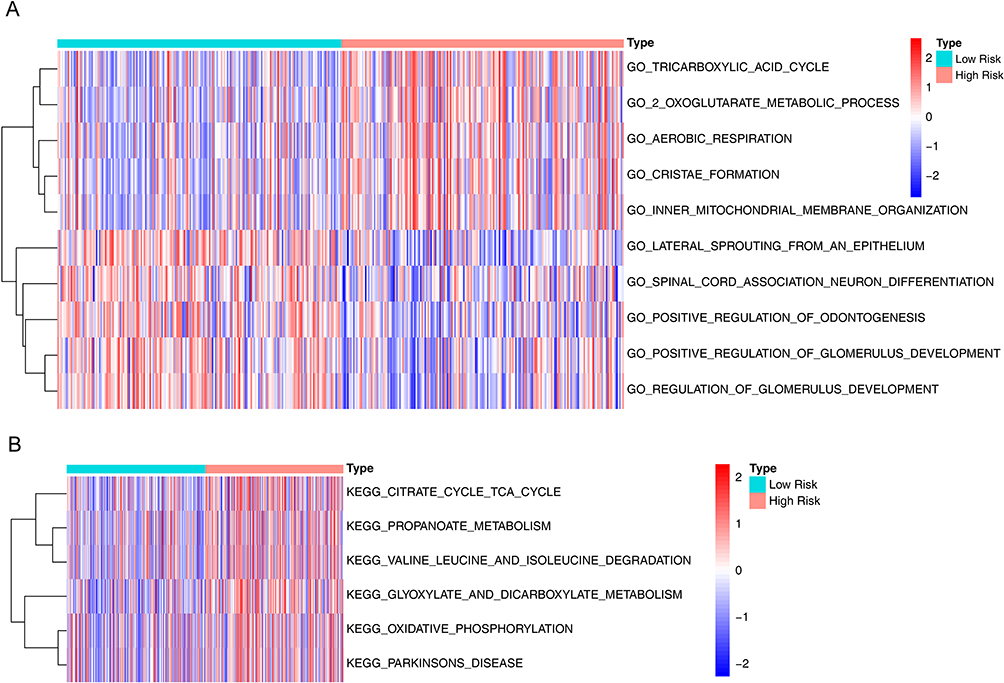 |
Figure 7 Differences in pathways between high and low risk groups. (A) Gene Ontology (GO) heatmap of differences between high and low risk groups. (B) Kyoto Encyclopedia of Genes and Genomes (KEGG) pathway heatmap of differences between high and low risk groups. |
Analysis of Coexpressed Genes of Prognostic Signature lncRNAs and Their Functional Enrichment
A total of 922 DEGs (524 up-regulated and 398 down-regulated) between the normal (n=58) and papillary thyroid cancer (n = 381) groups were screened by differential expression analysis (Supplementary Table S5, Figure 8A and B). After Spearman correlation analysis, 263 genes coexpressed with risk model lncRNAs were identified with丨Cor丨> 0.6 and P < 0.05 (Supplementary Table S6, Figure 8C). Furthermore, the GO enrichment analysis showed that these coexpression genes were significantly enriched in biological processes related to copper ion response including “response to copper ion”(P < 0.001), “cellular response to copper ion”(P < 0.001), “detoxification of copper ion”(P < 0.001), “stress response to copper ion”(P < 0.001), and so on (Supplementary Table S7, Figure 8D). These results indicated that the co-expressed genes of risk model lncRNAs were significantly correlated with the occurrence and development of papillary thyroid carcinoma.
 |
Figure 8 Expression of differentially expressed genes (DEGs) between normal tissues and PTC and construction of lncRNA-mRNA co-expression network. (A) Volcano plot of DEGs in normal tissue and PTC. (B) Heatmap of all genes differentially expressed between normal tissues and PTC. (C) PTC-related lncRNA-mRNA co-expression network signal network. (D) LncRNAs co-expressing genes enrichment to TOP10 GO map. |
Validation of the Expression Levels of Three of the m6A-Related lncRNA in Thyroid Samples
To assess differences in the expression of the three prognostic genes between normal thyroid tissues and PTC tissues, we conducted qRT-PCR analysis on ten PTC tissues and their adjacent normal tissues. The results demonstrated significant variations in the expression of these three prognostic genes between normal thyroid tissues and PTC tissues (Figure 9).
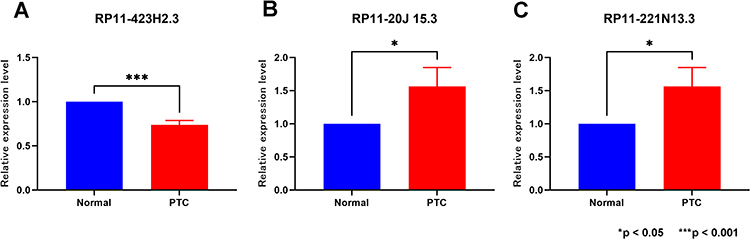 |
Figure 9 Validation of lncRNAs expression in normal thyroid tissue and PTC. (A) RP11-423H2.3 (B) RP11-20J15.3 (C) RP11-221N13.3. *p < 0.05; ***p < 0.001. |
Discussion
In recent years, with more and more in-depth studies on m6A and lncRNAs, m6A-related lncRNAs have also been proved to play an important role in the occurrence and development of a variety of malignant tumors.34–36 However, a comprehensive analysis of the effect of m6 A RNA methylation related lncRNAs on PTC patients is still lacking. In this study, we screened out 3 m6A-related lncRNAs (RP11-423H2.3, RP11-20J15.3, RP11-221N13.3) related to the prognosis of PTC, and built an m6A-related lncRNAs prognostic model that had a better predictive power and accuracy for PTC patients.
In this study, we found that 3 m6A-related lncRNAs, RP11-423H2.3, RP11-20J15.3, and RP11-221N13.3, were associated with prognosis in PTC patients, and could be used to predict disease-free survival in PTC patients. Subsequently, we constructed a model to predict disease-free survival in PTC patients and demonstrated its effectiveness. Many members of the RP11 family have been linked to the development of malignancies, including nasopharyngeal cancer, prostate cancer and breast cancer.37–40 Among them, RP11-423H2.3 was proved to be related to the occurrence of prostate cancer. By knocking out RP11-423H2.3 in prostate cancer cells, Li et al concluded that the expressions of miR-24-3p, miR-30a, miR-30d, and miR-30e in prostate cancer cells were reduced after knocking out. The expression of miR-7-1-3p was increased. The mechanism may be that lncRNAs act as molecular bait or sponges for miRNAs, and at the same time, lncRNAs can also be processed to generate miRNAs or activate miRNA expression.38 We suspect its effect on PTC because of the similar mechanism. Up to now, the other 2 lncRNAs have not been reported in the occurrence and development of tumors. In conclusion, our study for the first time illustrated the relationship between these m6A-related lncRNAs and the prognosis of PTC, and its mechanism needs to be further studied.
In the lncRNA-mRNA co-expression network, SYT12, SDC4, and CAMK2N1 were discovered to have the most significant relationship with the 3 prognostic lncRNAs, suggesting that these genes are closely related to the occurrence and development of PTC. SYT12 is a member of the Synaptotagmins family of genes that encode proteins that regulate the release of neurotransmitters.41 A previous study demonstrated that SYT12 expression is induced by thyroid hormones.42 Recently, some scholars have taken the expression of SYT12 as an important indicator for detecting the prognosis of PTC patients.43 CAMK2N1 plays an important role in the occurrence and development of tumors through regulating the cell cycle by mediating the inhibition of CaMKII activity.44,45 According to the results obtained by Eizuka et al’s gene knockout technology, CAMK2N1 was overexpressed after the knockout of SYT12 in OSCC-derived cells, indicating that SYT12 was involved in the occurrence and development of tumors by affecting the expression of CAMK2N1.46 The protein encoded by SDC4 gene is a transmembrane (type I) heparan sulfate proteoglycan, which acts as a receptor in intracellular signal transduction.47 Chen et al’s study manifested that SDC4 promotes the occurrence and development of PTC by enhancing the Wnt/β-catenin signaling pathway.48 In addition, GO enrichment analysis indicated that prognostic lncRNAs regulated the occurrence and development of (PTC) by regulating copper ion reaction. Previous studies have shown that copper ions bind and activate MEMO proteins, which subsequently play a role in tumor development and metastasis.49 At the same time, other studies have pointed out that copper ions are closely related to the signal pathway of BRAF protein mutation.50 Therefore, in the future research on the pathogenesis, development and treatment of PTC, copper ion is a key point worthy of our attention. The discovery of these genes helps us better understand the mechanism of the occurrence and development of PTC and also provides a new idea for the treatment of PTC.
Finally, we performed qRT-PCR validation for the three lncRNAs associated with the prognosis of PTC patients. These results affirmed the accuracy of our initial differential analysis, enhancing the credibility of subsequent studies and further validating the predictive capabilities of the prognostic model we established.
There are some limitations in the present study. Firstly, our research results are primarily based on bioinformatics analysis, and further in vivo and in vitro experiments are necessary to elucidate the underlying mechanisms. Secondly, our study did not encompass the subtypes of PTC.
Conclusion
In conclusion, we screened out 3 m6A methylation-related lncRNAs that were used to establish an effective prognostic model to accurately predict the prognosis of PTC patients. These m6A methylation-related lncRNAs may become potential clinical biomarkers and therapeutic targets, guiding future basic research and clinical work.
Ethics Approval and Informed Consent
We hereby confirm that our study complies with the Declaration of Helsinki. All methods described in this manuscript were carried out in strict accordance with the relevant guidelines and regulations. Ethical approval was obtained from the Ethics Review Committee of the Affiliated Hospital of Jiujiang University. All study participants provided informed consent before participating in the research. We have taken all necessary precautions to ensure the safety and well-being of our study participants and adhered to all relevant protocols throughout the study.
Author Contributions
All authors made a significant contribution to the work reported, whether that is in the conception, study design, execution, acquisition of data, analysis and interpretation, or in all these areas; took part in drafting, revising or critically reviewing the article; gave final approval of the version to be published; have agreed on the journal to which the article has been submitted; and agree to be accountable for all aspects of the work.
Funding
There is no funding to report.
Disclosure
The authors report no conflicts of interest in this work.
References
1. Siegel RL, Miller KD, Jemal A. Cancer statistics, 2019. CA Cancer J Clin. 2019;69(1):7–34. doi:10.3322/caac.21551
2. Bray F, Ferlay J, Soerjomataram I, et al. Global cancer statistics 2018: GLOBOCAN estimates of incidence and mortality worldwide for 36 cancers in 185 countries. CA Cancer J Clin. 2018;68(6):394–424. doi:10.3322/caac.21492
3. Zhu J, Zhang Q, Jin XY, et al. MiR-506 suppresses papillary thyroid carcinoma cell proliferation and metastasis via targeting IL17RD. Eur Rev Med Pharmacol Sci. 2019;23(7):2856–2862. doi:10.26355/eurrev_201904_17563
4. Vita R, Ieni A, Tuccari G, et al. The increasing prevalence of chronic lymphocytic thyroiditis in papillary microcarcinoma. Rev Endocr Metab Disord. 2018;19(4):301–309. doi:10.1007/s11154-018-9474-z
5. Niederer-Wüst SM, Jochum W, Förbs D, et al. Impact of clinical risk scores and BRAF V600E mutation status on outcome in papillary thyroid cancer. Surgery. 2015;157(1):119–125. doi:10.1016/j.surg.2014.07.015
6. Grant CS. Papillary thyroid cancer: strategies for optimal individualized surgical management. Clin Ther. 2014;36(7):1117–1126. doi:10.1016/j.clinthera.2014.03.016
7. Carneiro RM, Carneiro BA, Agulnik M, et al. Targeted therapies in advanced differentiated thyroid cancer. Cancer Treat Rev. 2015;41(8):690–698. doi:10.1016/j.ctrv.2015.06.002
8. Bramley MD, Harrison BJ. Papillary microcarcinoma of the thyroid gland. Br J Surg. 1996;83(12):1674–1683. doi:10.1002/bjs.1800831206
9. Roundtree IA, Evans ME, Pan T, et al. Dynamic RNA modifications in gene expression regulation. Cell. 2017;169(7):1187–1200. doi:10.1016/j.cell.2017.05.045
10. Yang Y, Hsu PJ, Chen YS, et al. Dynamic transcriptomic m6A decoration: writers, erasers, readers and functions in RNA metabolism. Cell Res. 2018;28(6):616–624. doi:10.1038/s41422-018-0040-8
11. Jiang X, Liu B, Nie Z, et al. The role of m6A modification in the biological functions and diseases. Signal Transduct Target Ther. 2021;6(1):74. doi:10.1038/s41392-020-00450-x
12. Pan Y, Ma P, Liu Y, et al. Multiple functions of m6A RNA methylation in cancer. J Hematol Oncol. 2018;11(1):48. doi:10.1186/s13045-018-0590-8
13. Dai D, Wang H, Zhu L, et al. N6-methyladenosine links RNA metabolism to cancer progression. Cell Death Dis. 2018;9(2):124. doi:10.1038/s41419-017-0129-x
14. Lee Y, Choe J, Park OH, et al. Molecular mechanisms driving mRNA degradation by m6A modification. Trends Genet. 2020;36(3):177–188. doi:10.1016/j.tig.2019.12.007
15. Wang X, Fu X, Zhang J, et al. Identification and validation of m6A RNA methylation regulators with clinical prognostic value in Papillary thyroid cancer. Cancer Cell Int. 2020;20(1):203. doi:10.1186/s12935-020-01283-y
16. Hou J, Shan H, Zhang Y, et al. m6A RNA methylation regulators have prognostic value in papillary thyroid carcinoma. Am J Otolaryngol. 2020;41(4):102547. doi:10.1016/j.amjoto.2020.102547
17. Tsai MC, Spitale RC, Chang HY. Long intergenic noncoding RNAs: new links in cancer progression. Cancer Res. 2011;71(1):3–7. doi:10.1158/0008-5472.CAN-10-2483
18. Huang L, Jiang X, Wang Z, et al. Small nucleolar RNA host gene 1: a new biomarker and therapeutic target for cancers. Pathol Res Pract. 2018;214(9):1247–1252. doi:10.1016/j.prp.2018.07.033
19. Camacho CV, Choudhari R, Gadad SS. Long noncoding RNAs and cancer, an overview. Steroids. 2018;133:93–95. doi:10.1016/j.steroids.2017.12.012
20. Xiong X, Zhu H, Chen X. Low expression of long noncoding RNA CASC2 indicates a poor prognosis and promotes tumorigenesis in thyroid carcinoma. Biomed Pharmacother. 2017;93:391–397. doi:10.1016/j.biopha.2017.06.063
21. Li N, Cui M, Yu P, et al. Correlations of lncRNAs with cervical lymph node metastasis and prognosis of papillary thyroid carcinoma. Onco Targets Ther. 2019;12:1269–1278. doi:10.2147/OTT.S191700
22. He RZ, Jiang J, Luo DX. The functions of N6-methyladenosine modification in lncRNAs. Genes Dis. 2020;7(4):598–605. doi:10.1016/j.gendis.2020.03.005
23. Zhou X, Chang L, Liang Q, et al. The m6A methyltransferase METTL3 drives thyroid cancer progression and lymph node metastasis by targeting LINC00894. Cancer Cell Int. 2024;24(1):47. doi:10.1186/s12935-024-03240-5
24. Ritchie ME, Phipson B, Wu D, et al. limma powers differential expression analyses for RNA-sequencing and microarray studies. Nucleic Acids Res. 2015;43:e47.
25. Kolde R. pheatmap: pretty Heatmaps. R package version 1.0.12. 2019. https://CRAN.R-project.org/package=pheatmap.
26. Wickham H. ggplot2: Elegant Graphics for Data Analysis. Springer-Verlag New York; 2016.
27. Therneau TM, Grambsch PM. Modeling Survival Data: Extending the Cox Model. New York: Springer; 2020:
28. Friedman J, Hastie T, Tibshirani R. Regularization paths for generalized linear models via coordinate descent. J Statis Soft. 2010;33(1):1–22. doi:10.18637/jss.v033.i01
29. Kassambara A, Kosinski M, Biecek P, et al. Package ‘survminer’. Drawing Survival Curves using ‘ggplot2’. (R package version 0.3. 1). 2017.
30. Patrick J Heagerty and packaging by Paramita Saha-Chaudhuri. survivalROC: time-dependent ROC curve estimation from censored survival data. R package version 1.0.3. 2013. https://CRAN.R-project.org/package=survivalROC.
31. Harrell JFE. rms: regression Modeling Strategies. R package version 4.0-0. City; 2013.
32. Hänzelmann S, Castelo R, Guinney J. GSVA: gene set variation analysis for microarray and RNA-seq data. BMC Bioinf. 2013;14(1):7. doi:10.1186/1471-2105-14-7
33. Yu G, Wang LG, Han Y, et al. clusterProfiler: an R package for comparing biological themes among gene clusters. OMICS. 2021;16(5):284–287. doi:10.1089/omi.2011.0118
34. Wu Y, Yang X, Chen Z, et al. m6A-induced lncRNA RP11 triggers the dissemination of colorectal cancer cells via upregulation of Zeb1. Mol Cancer. 2019;18(1):87. doi:10.1186/s12943-019-1014-2
35. Wang X, Zhang J, Wang Y. Long noncoding RNA GAS5-AS1 suppresses growth and metastasis of cervical cancer by increasing GAS5 stability. Am J Transl Res. 2019;11(8):4909–4921.
36. Ni W, Yao S, Zhou Y, et al. Long noncoding RNA GAS5 inhibits progression of colorectal cancer by interacting with and triggering YAP phosphorylation and degradation and is negatively regulated by the m6A reader YTHDF3. Mol Cancer. 2019;18(1):143. doi:10.1186/s12943-019-1079-y
37. Zhou L, Liu R, Liang X, et al. lncRNA RP11-624L4.1 Is associated with unfavorable prognosis and promotes proliferation via the CDK4/6-Cyclin D1-Rb-E2F1 pathway in NPC. Mol Ther Nucleic Acids. 2020;22:1025–1039. doi:10.1016/j.omtn.2020.10.017
38. Li Z, Zheng J, Xia Q, et al. Identification of specific long non-coding ribonucleic acid signatures and regulatory networks in prostate cancer in fine-needle aspiration biopsies. Front Genetics. 2020;11:62. doi:10.3389/fgene.2020.00062
39. Lou W, Ding B, Zhong G, et al. RP11-480I12.5-004 promotes growth and tumorigenesis of breast cancer by relieving miR-29c-3p-Mediated AKT3 and CDK6 Degradation. Mol Ther Nucleic Acids. 2020;21:916–931. doi:10.1016/j.omtn.2020.07.022
40. Giro-Perafita A, Luo L, Khodadadi-Jamayran A, et al. LncRNA RP11-19E11 is an E2F1 target required for proliferation and survival of basal breast cancer. NPJ Breast Cancer. 2020;6(1):1. doi:10.1038/s41523-019-0144-4
41. Kaeser-Woo YJ, Younts TJ, Yang X, et al. Synaptotagmin-12 phosphorylation by cAMP-dependent protein kinase is essential for hippocampal mossy fiber LTP. J Neurosci. 2013;33(23):9769–9780. doi:10.1523/JNEUROSCI.5814-12.2013
42. Thompson CC. Thyroid hormone-responsive genes in developing cerebellum include a novel synaptotagmin and a hairless homolog. J Neurosci. 1996;16(24):7832–7840. doi:10.1523/JNEUROSCI.16-24-07832.1996
43. Jonklaas J, Murthy S, Liu D, et al. Novel biomarker SYT12 may contribute to predicting papillary thyroid cancer outcomes. Future Sci OA. 2017;4:FSO249.
44. Ling KH, Hewitt CA, Beissbarth T, et al. Spatiotemporal regulation of multiple overlapping sense and novel natural antisense transcripts at the Nrgn and Camk2n1 gene loci during mouse cerebral corticogenesis. Cereb Cortex. 2011;21(3):683–697. doi:10.1093/cercor/bhq141
45. Zhang J, Li N, Yu J, et al. Molecular cloning and characterization of a novel calcium/calmodulin-dependent protein kinase II inhibitor from human dendritic cells. Biochem Biophys Res Commun. 2001;285(2):229–234. doi:10.1006/bbrc.2001.5175
46. Eizuka K, Nakashima D, Oka N, et al. SYT12 plays a critical role in oral cancer and may be a novel therapeutic target. J Cancer. 2019;10(20):4913–4920. doi:10.7150/jca.32582
47. Kaneider NC, Feistritzer C, Gritti D, et al. Expression and function of syndecan-4 in human platelets. Thromb Haemost. 2005;93(06):1120–1127. doi:10.1160/TH04-11-0763
48. Chen LL, Gao GX, Shen FX, et al. SDC4 Gene Silencing Favors Human Papillary Thyroid Carcinoma Cell Apoptosis and Inhibits Epithelial Mesenchymal Transition via Wnt/β-Catenin Pathway. Mol Cells. 2018;41(9):853–867. doi:10.14348/molcells.2018.0103
49. MacDonald G, Nalvarte I, Smirnova T, et al. Memo is a copper-dependent redox protein with an essential role in migration and metastasis. Sci Signal. 2014;7(329):ra56. doi:10.1126/scisignal.2004870
50. Brady DC, Crowe MS, Turski ML, et al. Copper is required for oncogenic BRAF signalling and tumorigenesis. Nature. 2014;509(7501):492–496. doi:10.1038/nature13180
 © 2024 The Author(s). This work is published and licensed by Dove Medical Press Limited. The full terms of this license are available at https://www.dovepress.com/terms.php and incorporate the Creative Commons Attribution - Non Commercial (unported, v3.0) License.
By accessing the work you hereby accept the Terms. Non-commercial uses of the work are permitted without any further permission from Dove Medical Press Limited, provided the work is properly attributed. For permission for commercial use of this work, please see paragraphs 4.2 and 5 of our Terms.
© 2024 The Author(s). This work is published and licensed by Dove Medical Press Limited. The full terms of this license are available at https://www.dovepress.com/terms.php and incorporate the Creative Commons Attribution - Non Commercial (unported, v3.0) License.
By accessing the work you hereby accept the Terms. Non-commercial uses of the work are permitted without any further permission from Dove Medical Press Limited, provided the work is properly attributed. For permission for commercial use of this work, please see paragraphs 4.2 and 5 of our Terms.