")
Back to Journals » International Journal of Chronic Obstructive Pulmonary Disease » Volume 17
Correlations of Computed Tomography Measurement of Distal Pulmonary Vascular Pruning with Airflow Limitation and Emphysema in COPD Patients
Authors Tang G, Wang F , Liang Z , Liang C, Wang J, Yang Y, Tang W, Shi W, Tang G, Yang K , Wang Z, Li Q, Li H , Xu J, Chen D, Chen R
Received 16 February 2022
Accepted for publication 28 August 2022
Published 14 September 2022 Volume 2022:17 Pages 2241—2252
DOI https://doi.org/10.2147/COPD.S362479
Checked for plagiarism Yes
Review by Single anonymous peer review
Peer reviewer comments 4
Editor who approved publication: Professor Min Zhang
Guoyan Tang,1,* Fengyan Wang,1,* Zhenyu Liang,1,* Cuixia Liang,2,* Jinling Wang,3,* Yuqiong Yang,1 Wanyi Tang,1,4 Weijuan Shi,1 Guoqiang Tang,3 Kai Yang,5 Zihui Wang,1 Qiasheng Li,1 Hualin Li,1 Jiaxuan Xu,1 Deyan Chen,2 Rongchang Chen5
1State Key Laboratory of Respiratory Disease, National Clinical Research Center for Respiratory Disease, Guangzhou Institute of Respiratory Health, The First Affiliated Hospital of Guangzhou Medical University, Guangzhou, People’s Republic of China; 2Neusoft Medical Systems Co., Ltd, Shenyang, People’s Republic of China; 3Qingyuan Chronic Disease Prevention Hospital, Qingyuan Occupational Disease Prevention Hospital, Qingyuan, People’s Republic of China; 4Qingyuan People’s Hospital, the Sixth Affiliated Hospital of Guangzhou Medical University, Guangzhou, People’s Republic of China; 5Department of Respiratory and Critical Care Medicine, First Affiliated Hospital of Southern University of Science and Technology, Second Clinical Medical College of Jinan University, Shenzhen People’s Hospital, Shenzhen Institute of Respiratory Diseases, Shenzhen, People’s Republic of China
*These authors contributed equally to this work
Correspondence: Rongchang Chen, Department of Respiratory and Critical Care Medicine, First Affiliated Hospital of Southern University of Science and Technology, Second Clinical Medical College of Jinan University, Shenzhen People’s Hospital, Shenzhen Institute of Respiratory Diseases, Shenzhen, People’s Republic of China, Email [email protected] Zhenyu Liang, State Key Laboratory of Respiratory Disease, National Clinical Research Center for Respiratory Disease, Guangzhou Institute of Respiratory Health, The First Affiliated Hospital of Guangzhou Medical University, Guangzhou, People’s Republic of China, Email [email protected]
Background: Pulmonary vascular alteration is an important feature of chronic obstructive pulmonary disease (COPD), which is characterized by distal pulmonary vascular pruning in angiography. We aimed to further investigate the clinical relevance of pulmonary vasculature in COPD patients using non-contrast computed tomography (CT).
Methods: Seventy-one control subjects and 216 COPD patients completed the questionnaires, spirometry, and computed tomography (CT) scans within 1 month and were included in the study. Small pulmonary vessels represented by percentage of cross-sectional area of pulmonary vessels smaller than 5 mm2 or 5– 10 mm2 to the total lung fields (%CSA< 5 or %CSA5– 10, respectively) were measured using ImageJ software. Spearman correlation was used to investigate the relationship between %CSA< 5 and airflow limitation. A receiver operating characteristic (ROC) curve was built to evaluate the value of %CSA< 5 in discriminating COPD patients from healthy control subjects. Segmented regression was used to analyze the relationship between %CSA< 5 and %LAA-950 (percentage of low-attenuation areas less than − 950 HU).
Results: We found a significant correlation between %CSA< 5 and forced expiratory volume in one second (FEV1) percentage of predicted value (%pred) (r = 0.564, P < 0.001). The area under the ROC curve for the value of %CSA< 5 in distinguishing COPD was 0.816, with a cut-off value of 0.537 (Youden index J, 0.501; sensitivity, 78.24%; specificity, 71.83%). Since the relationship between %CSA< 5 and %LAA-950 was not constant, performance of segmented regression was better than ordinary linear regression (adjusted R2, 0.474 vs 0.332, P < 0.001 and P < 0.001, respectively). As %CSA< 5 decreased, %LAA-950 slightly increased until an inflection point (%CSA< 5 = 0.524) was reached, after which the %LAA-950 increased apparently with a decrease in %CSA< 5.
Conclusion: %CSA< 5 was significantly correlated with both airflow limitation and emphysema, and we identified an inflection point for the relationship between %CSA< 5 and %LAA-950.
Keywords: computed tomography, pulmonary vascular pruning, airflow limitation, emphysema, chronic obstructive pulmonary disease
Introduction
Chronic obstructive pulmonary disease (COPD) is a common disease characterized by airway or alveolar abnormalities. Recent studies have showed that pulmonary vascular alterations also involved in COPD.1 Previous studies demonstrated that the initial pulmonary vasculopathy in COPD patients was endothelial dysfunction, which led to a decrease in vascular tone and an increase in vascular resistance, and resulted in diminished ability to vasodilate and pulmonary hypertension (PH).1,2 In addition, hypoxia-induced vasoconstriction and vascular compression due to emphysema may aggravate pulmonary vascular pruning, referring to the narrowing, occlusion, and loss of peripheral pulmonary vessels.3 In most cases, clinicians do not have access to pulmonary vascular pathology because traditional vascular examination mainly includes invasive procedures, such as histopathology, right heart catheterization, and/or angiography.4–7 With the improvement in computed tomography (CT) technology and quantitative analysis, the pulmonary vessels may be evaluated noninvasively. The percentage of cross-sectional area (CSA) of small pulmonary vessels smaller than 5 mm2 to the total lung area (%CSA<5) is one of the most commonly used two-dimensional CT vascular parameters, which correlates with histological vascular CSA.8–10
Previous studies have found that %CSA<5 has a strong negative correlation with emphysema and a relatively weaker correlation with airflow limitation.10 Distal pulmonary vascular alterations have been demonstrated in smokers with normal lung function and individuals with mild emphysema.11–15 Together, these findings suggest that the relationships of peripheral pulmonary vascular alteration with airflow limitation and emphysema are inconsistent. We hypothesized that pulmonary vascular pruning may be significantly associated with emphysema and airflow limitation, but the association may change with disease progression. To test the hypothesis, we used %CSA<5 to quantify pulmonary vascular pruning and investigated the relationships of %CSA<5 with emphysema and airflow obstruction.
Materials and Methods
Participants
A cross-sectional observational study was prospectively conducted relying on the COPD Cohort of National Key R&D Program of China (NCT 03240315) in the First Affiliated Hospital of Guangzhou Medical University, China, between April 2017 and April 2021. This study included healthy control subjects (smoke or not, no known respiratory diseases or other systemic diseases, like cancer or autoimmune disease) and COPD patients, defined according to the Global Initiative for Chronic Obstructive Lung Disease (GOLD) guidelines16 (ratio of forced expiratory volume in 1 second [FEV1] to forced vital capacity [FVC] < 0.7 after using bronchodilator), and more than 40 years old. Patients were excluded if they had intrapulmonary diseases other than COPD, severe extrapulmonary diseases (for example, systemic inflammation or cancer), an exacerbation within the last 1 month, history of lung surgery or treatment with systemic glucocorticoids, or participation in other clinical trials. The demographic characteristics, smoking history (smoke status including never smoke, current smoke and ex-smoke which meant stop smoking for more than 6 months; Pack years), and symptomatic scores, including that of COPD assessment test (CAT) and modified British Medical Research Council dyspnea scale (mMRC), were collected from all participants using questionnaires. Spirometry was performed at the time of enrollment. Non-contrast CT scan was performed within 1 month after spirometry.
A total of 355 participants (potentially healthy controls and COPD patients) were enrolled, but 23 were excluded because of severe intrapulmonary diseases other than COPD or extrapulmonary diseases, such as severe bronchiectasis, stomach cancer, prostate cancer, and aortic dissection. In addition, 45 participants were excluded because chest CT scan and spirometry had not been performed within a month or the post-bronchodilator test had not been performed in those FEV1/FVC<0.7 (Figure 1). The study complied with the Declaration of Helsinki and was approved by the ethics committee of the hospital (approval no. 2017–22). All the participants provided informed consent before enrollment.
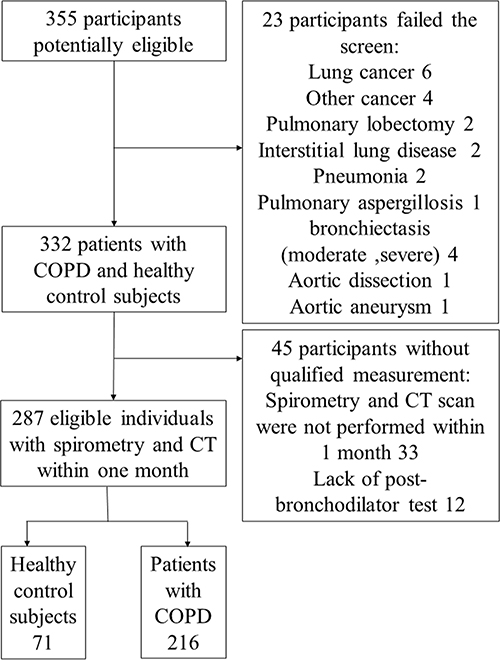 |
Figure 1 Flowchart of the study. |
Pulmonary Function Tests
Spirometry was performed according to the American Thoracic Society (ATS)/European Respiratory Society (ERS) guidelines.17 Subjects whose FEV1/FVC<0.7 were required to test again after inhalation of bronchodilators. For these subjects, we recorded several indexes, including FEV1, FEV1/FVC, and FEV1%pred after using bronchodilator. COPD patients were classified according to the GOLD stage (GOLD 1: FEV1%pred > 80; GOLD 2: FEV1%pred 50–80; GOLD 3: FEV1%pred 30–50; GOLD 4: FEV1%pred < 30).
Chest CT
CT Acquisition
All participants underwent a non-contrast CT scan during full inspiration using a 64-slice multidetector CT scanner (Somatom Sensation 64; Siemens Healthineers AG, Erlangen, Germany). The scan was performed in the supine position. The parameters of the CT scan were as follows: 110 kV, 30 effective mAs, 64×0.6 mm collimation, a pitch of 1.3, rotation time 0.6 s, rotation field 400 mm, scan bed speed 146.4 mm/s, matrix 512*512. The CT data were reconstructed using a I31s kernel with 1 mm slice thickness and 1 mm increment. Then, a specific algorithm called SAFIRE was added for noise reduction.
Quantitative Measurement
Measurement of Small Pulmonary Vessels
To measure the CSA, three levels (1 cm above the upper margin of the aortic arch, 1 cm below the carina, and 1 cm below the right inferior pulmonary vein) were selected from the CT scan images. All selected slices were analyzed semi-automatically using an image processing software (ImageJ, version 1.52v). The threshold was set between −500 Hounsfield units (HU) and −1024 HU to segment the lung field. The image was converted to binary with a window level of −720 HU to display the pulmonary vessels in black. The circularity range was set at 0.9–1.0 and the size range was set at 0–5 mm2 or 5–10 mm2, respectively, to calculate the CSA of vessels. The CSA of the vessels and lung fields of the three selected slices were added (Figure 2). CSA<5 referred to the total CSA of vessels < 5 mm2 of the three slices; %CSA<5 referred to the percentage of the CSA<5 to the total lung area in the selected slices. CSA5–10 and %CSA5–10 were calculated in the same manner.9,10
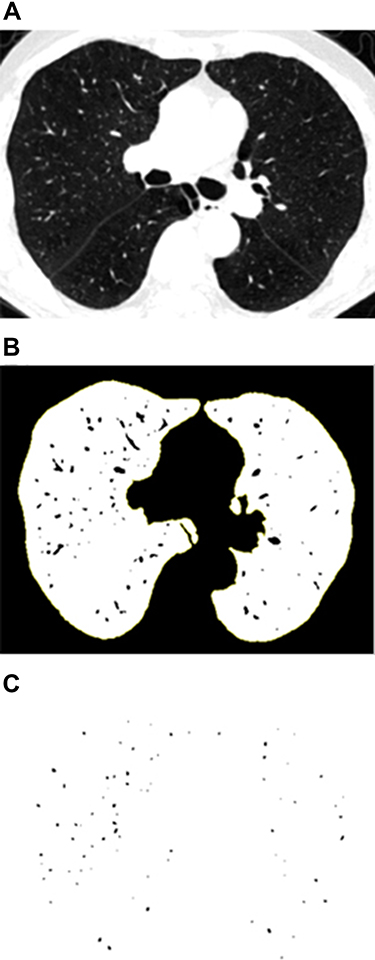 |
Figure 2 (A) Segmented lung field by setting the threshold between −500 HU and −1024 HU; (B) Converted into binary image where pulmonary vessels were displayed in black with a window level of −720 HU; (C) Mask image after setting the circularity from 0.9 to 1.0 and the vascular size range from 0–5mm2. |
Measurement of Large Pulmonary Vessels
The diameter of the main pulmonary artery (PA) at the level of the bifurcation or its tubular portion, and the mean of the two perpendicular diameters of the ascending aorta (AO) on the same image with a mediastinal window (Figure S1) was measured according to previous studies. The ratio of the PA to AO was used for analysis.18
To ensure consistency in measurements, CSA and PA:AO were independently measured by two respiratory physicians who were blinded to all of the clinical information. The average of the two measurements was used for analysis.
Measurements of Airway Wall and Emphysema
The CT data was imported into workstations of the VIDA software version 2.2 (Apollo; VIDA Diagnostics, Coralville, IA, USA) to automatically segment the lung and bronchial tree (Figure S2). Then, the segmented bronchial trees were carefully reviewed and modified by an experienced respiratory clinician. To measure the structural airway changes, we obtained the average wall thickness (WT), wall area percentage (WA%), and thickness–diameter ratio (TDR) of the midpoint cross section of six bronchial segments, including the apical segment of right upper lobe (RB1), lateral segment of the right middle lobe (RB4), posterior segment of the right lower lobe (RB10), posterior segment of the left lower lobe (LB10), the apicoposterior segment (LB1+2), and the superior lingular segment (LB4) of the left upper lobe. These indexes were calculated automatically according to the formula as follows: WA% = (outer airway area − inner airway area)/outer airway area*100%; TDR = wall thickness/mean external diameter. The average value of the six segments was used for analysis. In addition, the percentage of low-attenuation areas (ie, < −950 HU) (%LAA-950) was calculated to evaluate the degree of emphysema.19
Statistical Analysis
SPSS software version 25.0 (IBM Corp., Armonk, NY, USA) was used to analyze the characteristics of participants. Continuous variables are presented as mean with standard deviation or median with interquartile ranges, based on the results of the normality test. Categorical variables are presented as number of subjects. Independent t-test and Mann–Whitney U-test were used to compare continuous variables, as appropriate. Chi-square test was used to compare the categorical variables between healthy controls and COPD patients. Linear regression was used for the trend test of all variables across the GOLD stages. Intraclass correlation coefficients (ICC) were calculated to identify the intra-observer and inter-observer agreement for %CSA<5, %CSA5-10, PA:AO. Spearman correlation was used to analyze the relationship between %CSA<5 and FEV1%pred. The classification performance of %CSA<5 for discriminating COPD patients was evaluated using receiver operating characteristic (ROC) curves. A segmented package in the R (R version 3.5.3) (a statistical method offering piecewise linear regression of a given dataset and further providing the inflection point where the slope of the regression line suddenly changes) was used to further explore the relationship between %CSA<5 and emphysema and to determine the inflection point of the correlation. Finally, independent t-test, Mann–Whitney U-test, and chi-square test were used to compare the characteristics between subjects above and below the inflection point.
Results
Study Population
Among a total of 355 individuals screened for study inclusion, 287 (37 never smoking control subjects, 34 smoking control subjects and 216 COPD patients) were included in the study. The ICC value for intra-observer agreement for %CSA<5, %CSA5–10, PA:AO were 0.973 (0.933–0.989), 0.768 (0.497–0.901) and 0.710 (0.443–0.856), respectively. And ICC value for inter-observer agreement were 0.954 (0.942–0.963), 0.812 (0.768–0.848) and 0.866 (0.834–0.892), respectively. The clinical characteristics of eligible subjects, including healthy control subjects smoke or not, and COPD patients classified according to the GOLD stage, are presented in Table 1. The CT vascular parameters (including %CSA<5, %CSA5–10, and PA:AO), as well as emphysema index (%LAA-950) and airway wall thickness (WT), were not significantly different between never smoking and smoking control subjects, but were significant different between COPD patients and healthy control subjects. Both %CSA<5 and %CSA5–10 generally decreased, while emphysema severity increased with worsened airflow limitation.
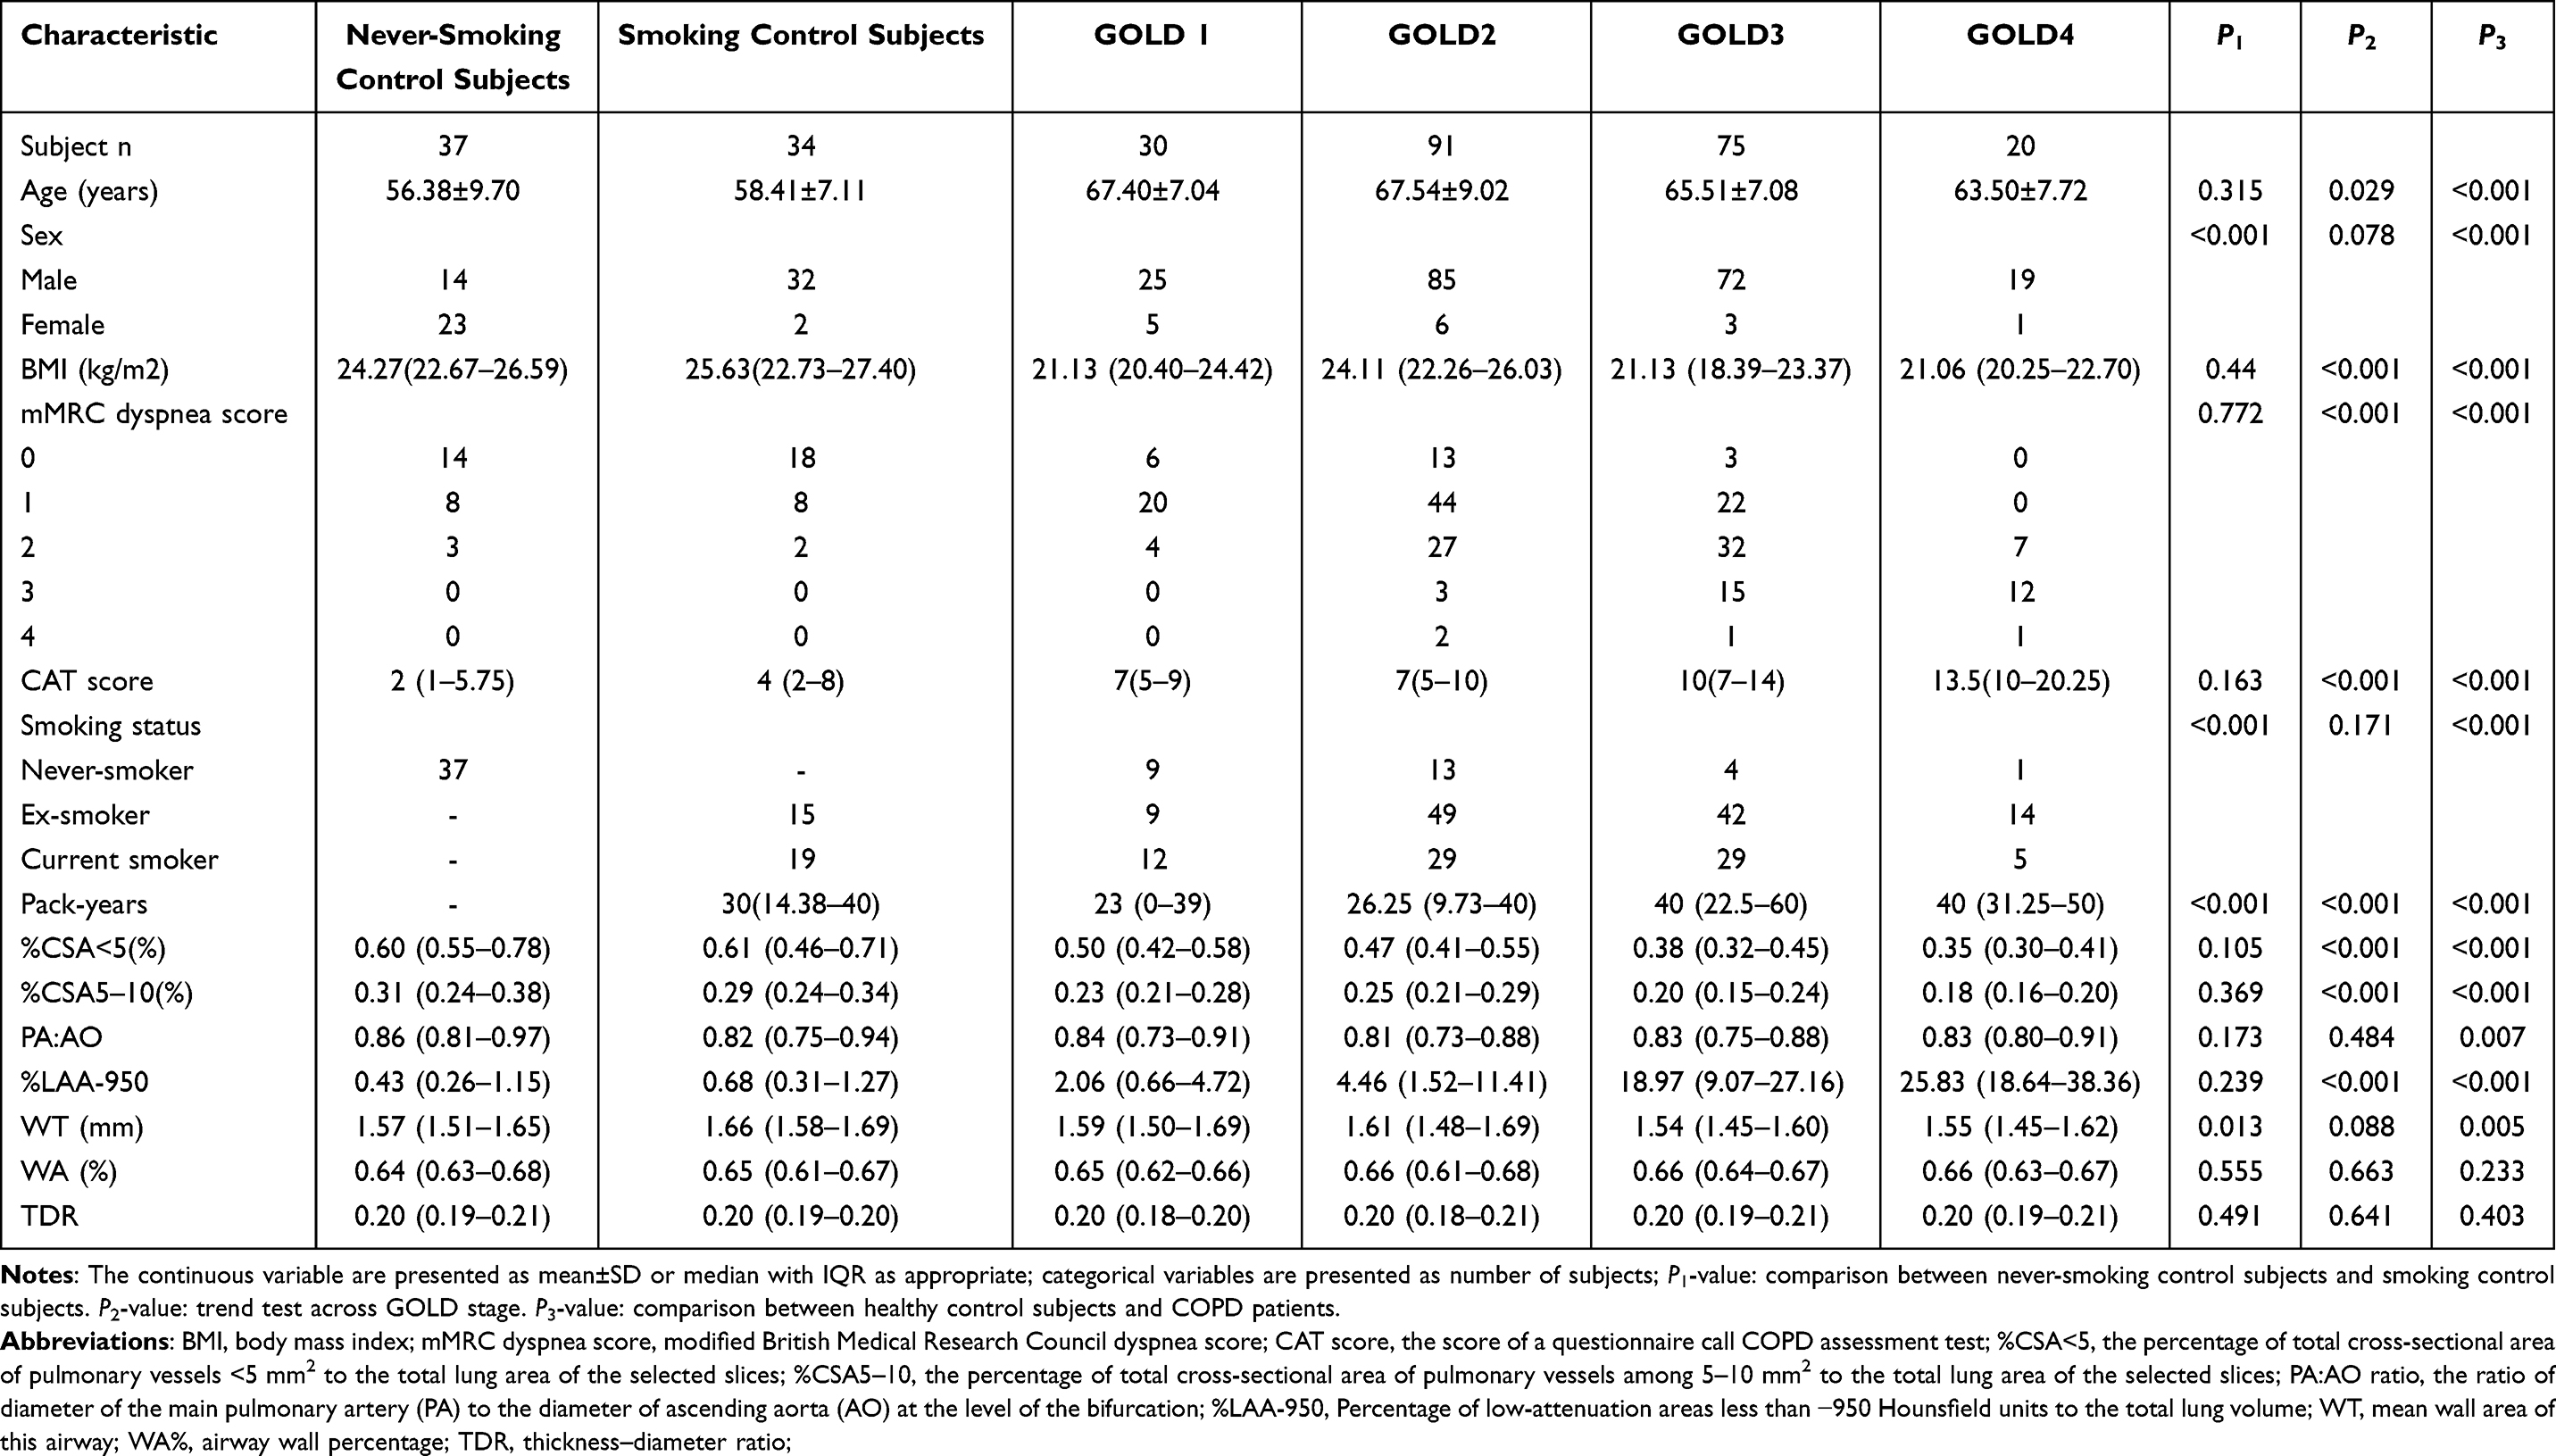 |
Table 1 Characteristics of Study Participants |
Correlation Between %CSA<5 and Airflow Limitation
The %CSA<5 was significantly higher in healthy individuals than COPD patients, and gradually decreased with increasing GOLD stage in COPD patients, indicating that %CSA<5 was associated with airflow limitation and may be used to identify COPD patients. As presented in Figure 3, %CSA<5 was significantly correlated with FEV1%pred (r = 0.564, P < 0.001). Then, we constructed an ROC curve to investigate the value of %CSA<5 in discriminating COPD patients from individuals without airflow limitation. As a result, we obtained the area under the curve (AUC) of 0.816, with a cut-off value of 0.537 (Youden index J,0.501; sensitivity, 78.24%; specificity, 71.83%) (Figure 4).
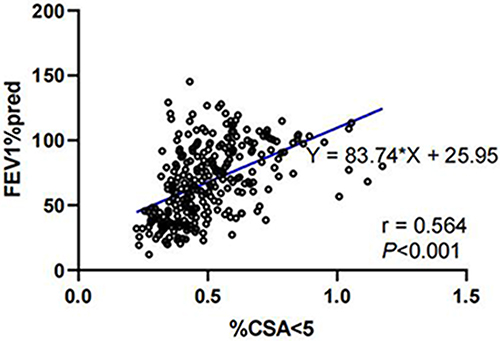 |
Figure 3 Relationship between %CSA<5 and FEV1%pred (r=0.564, P<0.001). |
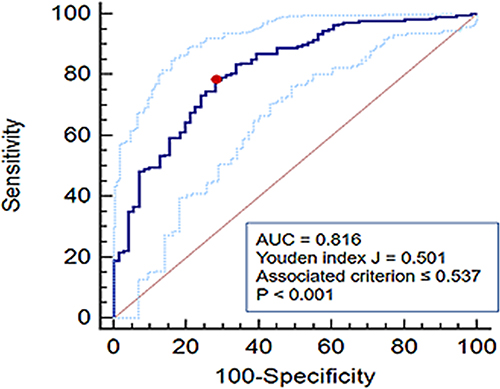 |
Figure 4 ROC curve of %CSA<5 for the discrimination of COPD. (AUC, 0.816; cut-off value, 0.537; Youden index J, 0.501; sensitivity, 78.24%; specificity, 71.83%). |
Correlation Between %CSA<5 and Emphysema
To explore the relationship between %CSA<5 and emphysema, we established an ordinary linear regression model and a segmented regression model. As shown in Figure 5, the predictive ability of segmented regression (adjusted R2, 0.474; P < 0.001) was superior to that of ordinary linear regression (adjusted R2, 0.332, P < 0.001). According to the segmented regression model, before %CSA<5 reached the inflection point (0.524), the regression line was nearly flat (β1 = −3.104, P < 0.001), while the slope of the regression line suddenly increased when the %CSA<5 went below the inflection point (β2 = −96.615, P < 0.001). Compared with individuals with %CSA<5 higher than 0.524, subjects with %CSA<5 less than 0.524 had elder ages, lower body mass index, lower PA:AO and exhibited more severe symptoms, emphysema, and airflow limitation (Table 2).
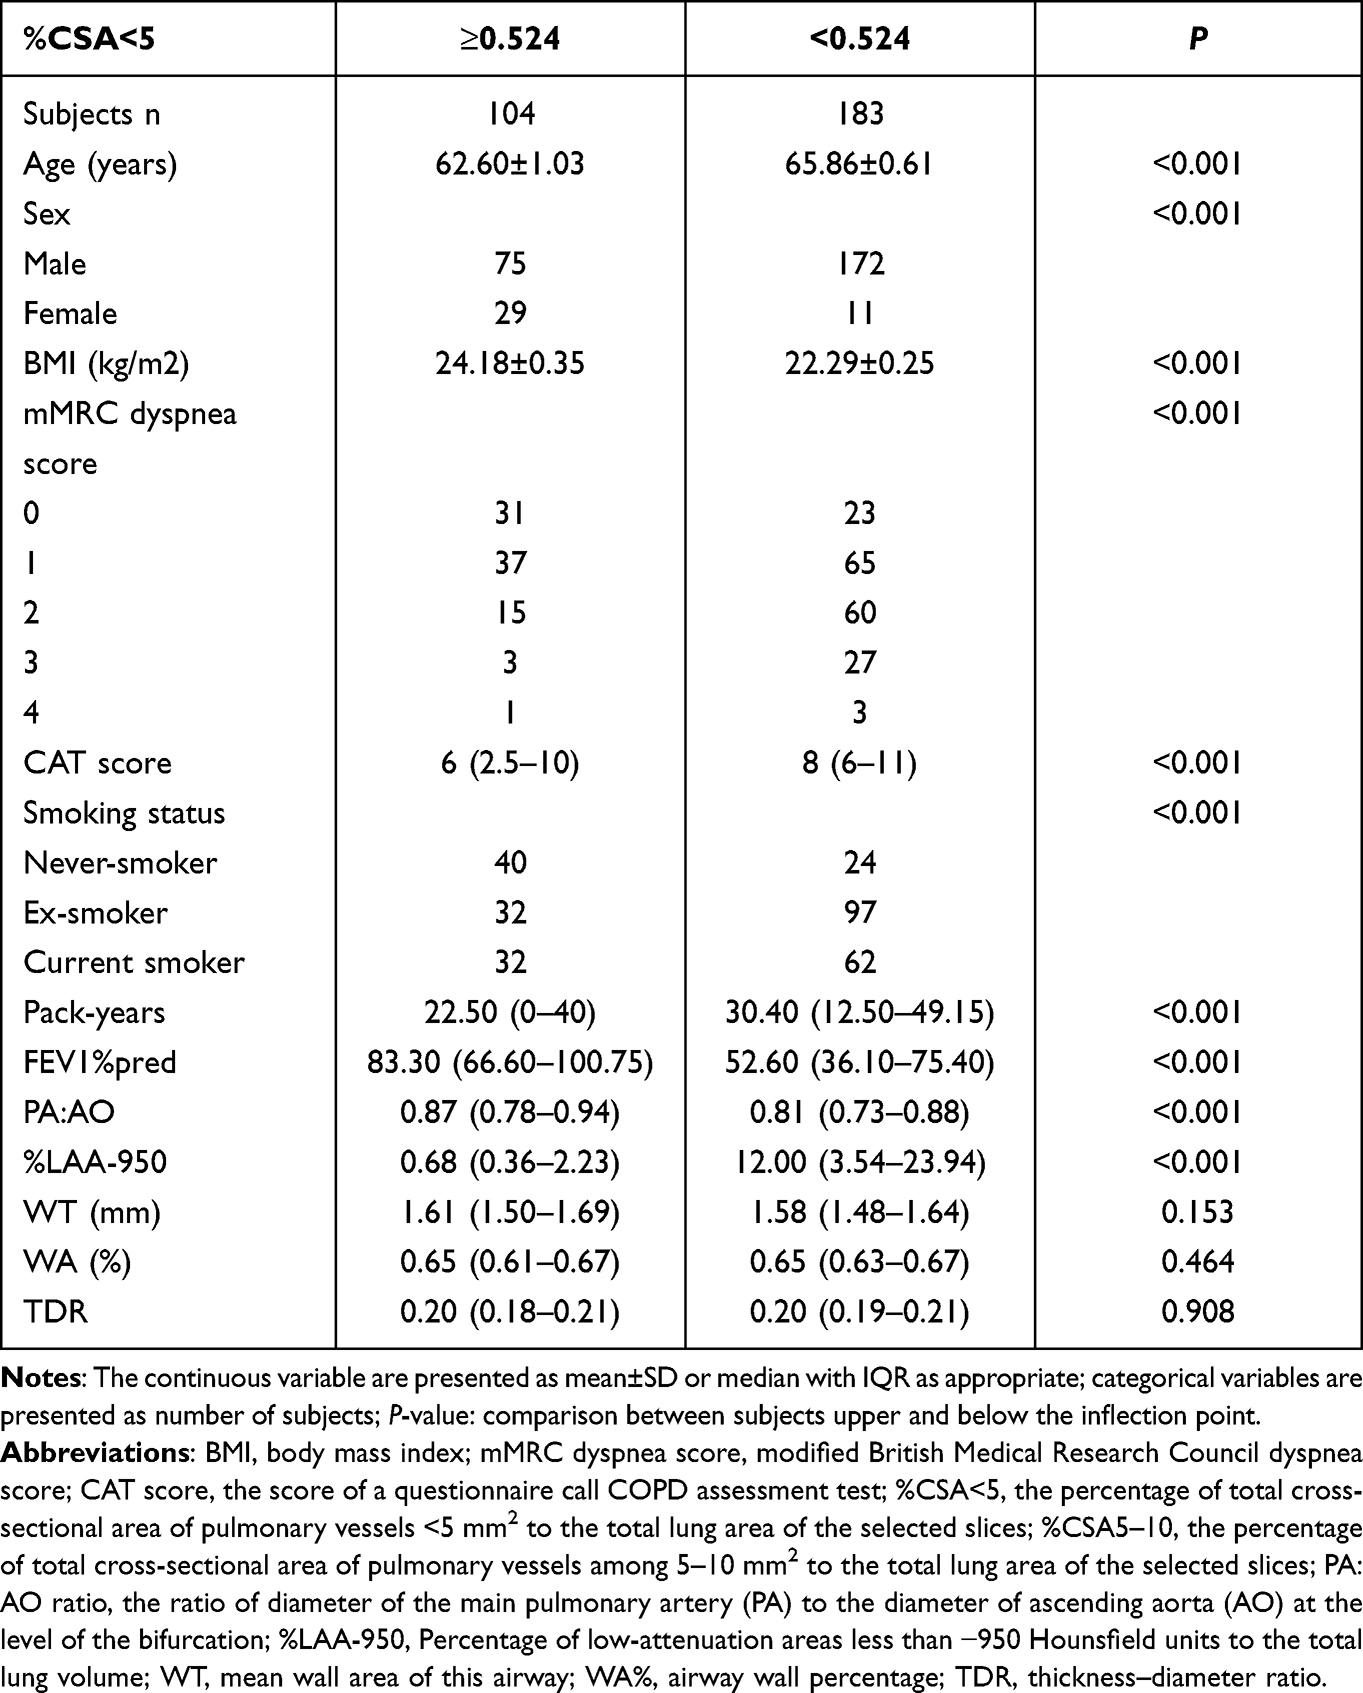 |
Table 2 Comparison of Characteristics of Participants Above and Below the Inflection Point |
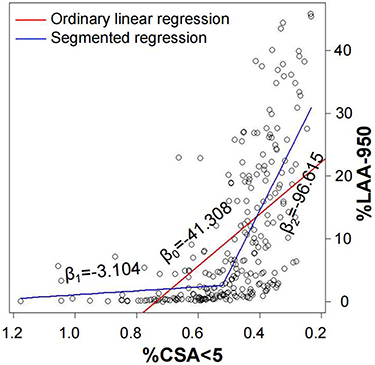 |
Figure 5 Association between %CSA<5 and %LAA-950. The fitting effect of segmented regression (adjust R2, 0.474; P <0.001) was much better than ordinary linear regression (adjust R2, 0.332, P<0.001). The slope of the ordinary linear regression line was β0 = −41.308. In the segmented regression, before %CSA<5 decrease to inflection point (0.524), the regression line was nearly flat (β1 = −3.104, P < 0.001), while the slope of the regression line suddenly flared up when the %CSA<5 went down below the inflection point (β2 = −96.615, P < 0.001). |
Discussion
In current study, our goal was to investigate the clinical relevance of distal pulmonary vascular pruning in COPD, which was mainly evaluated by %CSA<5. We found that peripheral pulmonary vascular pruning significantly correlated with airflow limitation, and %CSA<5 had a potential to discriminate patients of COPD from individuals without airflow limitation. Another interesting finding was that %CSA<5 was not always strongly negatively associated with emphysema. When %CSA<5 was greater than the inflection point (0.524), correlation between %CSA<5 and %LAA-950 was weak but statistically significant. When %CSA<5 decreased below the inflection point, the correlation sharply increased.
Pulmonary vascular alteration is a significant component of the pathophysiological mechanism of COPD. Histological studies demonstrated that smoking causes peripheral pulmonary vascular alteration, mainly including intimal thickening, smooth muscle cell hyperplasia, and elastin deposition.1,2 Furthermore, pulmonary angiography demonstrated peripheral pulmonary vascular pruning in smokers.3,20 Such vascular changes are also present in COPD patients given that smoking is one of the most significant risk factors of COPD.1,2,7 In our study, there was no significant difference in %CSA<5 between never-smoking and smoking control subjects, which we attributed to insufficient sample size. However, %CSA<5 in COPD patients was significantly lower than that in healthy individuals, which may further decrease with worsening airflow obstruction, indicating that %CSA<5 may be helpful for the discrimination and severity stratification of COPD. This hypothesis was proved to be reasonable since %CSA<5 had a significant correlation with FEV1%pred in our study. The ROC curve was built to investigate the value of %CSA<5 in discriminating COPD and obtained an AUC of 0.816 and a cut-off value of 0.537, implying that %CSA<5 has a potential for COPD identification; however, this must be tested in further studies with larger populations.
Airflow obstruction was affected by both small airway disease and emphysema. Distal pulmonary vascular pruning was closely associated with emphysema.2,3,21,22 Analysis of the COPDGene, a cohort with the aims of exploring the genetic risk factors as well as imaging features of COPD, demonstrated a strong correlation between pulmonary vessel pruning and emphysema,10 but there was no such association in the Framingham cohort, a general adult cohort with fewer participants with emphysema and airflow limitation.23 Our findings explain this inconsistency. In our study, %CSA<5 did not always show a strong negative correlation with %LAA-950. The negative correlation was evident after %CSA<5 declined to an inflection point (0.524). Pulmonary vasculopathy in COPD patients occurs because of smoking-induced endothelial dysfunction, which is also a notable cause of emphysema. This may be the reason for the slow rise in %LAA-950 as %CSA<5 decreased in patients with mild vascular pruning. As the disease progressed, development of peripheral vascular pruning and emphysema would result in ventilation-perfusion ratio (V/Q) mismatch, impaired gas exchange, and finally aggravation of hypoxia. Hypoxia not only causes pulmonary vasoconstriction but also causes an increase in the respiratory rate, which may accelerate the progression of emphysema and worsen the V/Q ratio mismatch.1,2,7 These changes eventually form a vicious circle that amplifies the influence of pulmonary vascular pruning on emphysema and airflow obstruction. This may be the reason for the sudden change in the relationship between %CSA<5 and %LAA-950 with disease progression. To the best of our knowledge, this is the first study to examine the relationship between peripheral pulmonary vascular pruning and emphysema using piecewise regression. In this study, for the first time, we demonstrated an inflection point of %CSA<5, which marked the beginning of its strong correlation with emphysema.
On the basis of these results, pulmonary vascular alteration was significantly correlated with airflow limitation and emphysema. The inflection point implied that when %CSA<5 decreased to a certain level, the destruction of lung parenchyma and impairment of lung function were accelerated. At that time, the traditional treatment strategies were insufficient and had to be coupled with appropriate pulmonary vascular therapy. In clinical work, the symptoms of COPD patients like degree of dyspnea often do not match the degree of airflow limitation and many COPD patients do not achieve symptom relief with traditional treatments.1,24–26 It is necessary to consider whether such patients are affected by pulmonary vascular alterations. In addition, Coster et al have demonstrated that %CSA<5 was one of the best predictors of mean pulmonary arterial pressure in COPD patients with and without severe pulmonary hypertension.27 Therefore, CT vascular measurement was expected to be a useful screening tool for PH in COPD patients and a noninvasive tool for the assessment of disease condition and therapeutic efficacy. All in all, CT vascular measurement showed considerable value for clinical application.
This study had some limitations that need to be addressed. First, CSA of pulmonary vessels was measured using a semi-automatic and two-dimensional method, which was time-consuming and may be affected by inter-measurer variation.9,10 To reduce this variation, we requested two independent physicians to record the measurements and calculated the average of the two measurements for analysis. Second, this was a cross-sectional observational study; therefore, we could not investigate the correlations of pulmonary vascularity with COPD exacerbation, progression, and prognosis.
Conclusion
CT measurement of pulmonary vascular pruning was associated with airflow obstruction, and %CSA<5 showed considerable potential to discriminate COPD patients from individuals without persistent airflow limitation. The relationship between pulmonary vascular pruning and emphysema was not invariable; rather, the relationship abruptly increased when %CSA<5 reduced below the inflection point.
Abbreviations
COPD, chronic obstructive pulmonary disease; CT, computed tomography; BMI, body mass index; mMRC dyspnea score, the medical research council dyspnea score; CAT score, the score of a questionnaire call COPD assessment test; FEV1, forced expiratory volume in 1 second; FVC, forced vital capacity; CSA, cross-sectional area; %CSA<5, the percentage of total cross-sectional area of pulmonary vessels <5 mm2 to the total lung area of the selected slices; %CSA5–10, the percentage of total cross-sectional area of pulmonary vessels among 5–10 mm2 to the total lung area of the selected slices; PA:AO, the ratio of diameter of the main pulmonary artery (PA) to the diameter of ascending aorta (AO) at the level of the bifurcation; HU, Hounsfield units; %LAA-950, Percentage of low-attenuation areas less than −950 Hounsfield units to the total lung volume; WT, mean wall area of this airway; WA%, airway wall percentage; TDR, thickness–diameter ratio; ROC, receiver operating characteristic curves; AUC, area under the curve; PH, pulmonary hypertension.
Data Sharing Statement
The datasets used in the current study are available from the corresponding author on reasonable request.
Ethics Approval and Informed Consent
The study complied with the Declaration of Helsinki and all participants provided informed consent before enrollment. The study was approved by the ethics committee of the hospital (approval no. 2017-22) and registered with www.clinicaltrials.gov (NCT 03240315).
Acknowledgments
We would like to thank all the participants and all the research team members in this study. And we thank LetPub (www.letpub.com) for its linguistic assistance during the modification of this manuscript. Guoyan Tang, Fengyan Wang, Zhenyu Liang, Cuixia Liang, and Jinling Wang are co-first authors for this study.
Author Contributions
G.T is the guarantor of the content of the manuscript, had full access to all the data in the study and takes responsibility for the integrity of the data and the accuracy of the data analysis. Z. L, F. W, Y. Y had great contribution on the participants enrollment, data analysis, the overall design of the project and manuscript writing and revising. C. L, J. W help a lot in the finalization of %CSA measurement method and the revision of the manuscript. W. T completed the measurement of emphysema and airway wall using VIDA software. GQ. T, J. W completed the measurement of %CSA and G. T and W. S completed the measurement of PA:AO. J.W, C. L, K. Y, Z. W, Q. L, H. L, J. X, D. C contributed to the data integration and analysis. R.C provided supervision and suggestions for the project, including data analysis, interpretation, writing and modification of the manuscript. All authors made substantial contributions to conception and design, acquisition of data, or analysis and interpretation of data; took part in drafting the article or revising it critically for important intellectual content; agreed to submit to the current journal; gave final approval of the version to be published; and agree to be accountable for all aspects of the work.
Funding
National Key R&D Program of China (2017YFC1310600, 2018YFC1311900); Medical Scientific Research Foundation of Guangdong Province (C2019001, A2019459); National Natural Science Foundation of China (82170042); the Shenzhen Science Technology and Innovative commission (KCXFZ202002011008256); Science and Technology Program of Guangzhou (202201020451).
Disclosure
Dr Yuqiong Yang reports grants from ATS MECOR Research Award, outside the submitted work. Cuixia Liang and Deyan Chen are affiliated with Neusoft Medical Systems Co., Ltd. All authors report no other conflicts of interest in this work.
References
1. Kovacs G, Agusti A, Barberà JA, et al. Pulmonary vascular involvement in chronic obstructive pulmonary disease. is there a pulmonary vascular phenotype? Am J Respir Crit Care Med. 2018;198(8):1000–1011. doi:10.1164/rccm.201801-0095PP
2. Peinado VI, Pizarro S, Barberà JA. Pulmonary vascular involvement in COPD. Chest. 2008;134(4):808–814. doi:10.1378/chest.08-0820
3. Humbert M, Guignabert C, Bonnet S, et al. Pathology and pathobiology of pulmonary hypertension: state of the art and research perspectives. Eur Respir J. 2019;53(1):1801887. doi:10.1183/13993003.01887-2018
4. Remy-Jardin M, Ryerson CJ, Schiebler ML, et al. Imaging of pulmonary hypertension in adults: a position paper from the Fleischner society. Radiology. 2021;298(3):531–549. doi:10.1148/radiol.2020203108
5. de Perrot M, Gopalan D, Jenkins D, et al. Evaluation and management of patients with chronic thromboembolic pulmonary hypertension - consensus statement from the ISHLT. J Heart Lung Transplant. 2021;40(11):1301–1326. doi:10.1016/j.healun.2021.07.020
6. Galiè N, Humbert M, Vachiery J-L, et al. 2015 ESC/ERS guidelines for the diagnosis and treatment of pulmonary hypertension. Rev Esp Cardiol. 2016;69(2):177. doi:10.1016/j.rec.2016.01.002
7. Blanco I, Piccari L, Barberà JA. Pulmonary vasculature in COPD: the silent component. Respirology. 2016;21(6):984–994. doi:10.1111/resp.12772
8. Takayanagi S, Kawata N, Tada Y, et al. Longitudinal changes in structural abnormalities using MDCT in COPD: do the CT measurements of airway wall thickness and small pulmonary vessels change in parallel with emphysematous progression? Int J Chron Obstruct Pulmon Dis. 2017;12:551–560. doi:10.2147/copd.S121405
9. Matsuoka S, Washko GR, Yamashiro T, et al. Pulmonary Hypertension and Computed Tomography Measurement of Small Pulmonary Vessels in Severe Emphysema. Am J Respir Crit Care Med. 2010;181(3):218–225. doi:10.1164/rccm.200908-1189OC
10. Matsuoka S, Washko GR, Dransfield MT, et al. Quantitative CT measurement of cross-sectional area of small pulmonary vessel in COPD: correlations with emphysema and airflow limitation. Acad Radiol. 2010;17(1):93–99. doi:10.1016/j.acra.2009.07.022
11. Santos S, Peinado VI, Ramírez J, et al. Characterization of pulmonary vascular remodelling in smokers and patients with mild COPD. Eur Respir J. 2002;19(4):632–638. doi:10.1183/09031936.02.00245902
12. Peinado VI, Barbera JA, Ramirez J, et al. Endothelial dysfunction in pulmonary arteries of patients with mild COPD. Am J Physiol. 1998;274(6):L908–L913. doi:10.1152/ajplung.1998.274.6.L908
13. Barberà JA, Riverola A, Roca J, et al. Pulmonary vascular abnormalities and ventilation-perfusion relationships in mild chronic obstructive pulmonary disease. Am J Respir Crit Care Med. 1994;149(2 Pt 1):423–429. doi:10.1164/ajrccm.149.2.8306040
14. Noma S, Moskowitz GW, Herman PG, Khan A, Rojas KA. Pulmonary scintigraphy in elastase-induced emphysema in pigs. Correlation with high-resolution computed tomography and histology. Invest Radiol. 1992;27(6):429–435. doi:10.1097/00004424-199206000-00006
15. Hale KA, Niewoehner DE, Cosio MG. Morphologic changes in the muscular pulmonary arteries: relationship to cigarette smoking, airway disease, and emphysema. Am Rev Respir Dis. 1980;122(2):273–278. doi:10.1164/arrd.1980.122.2.273
16. Vogelmeier CF, Criner GJ, Martinez FJ, et al. Global strategy for the diagnosis, management, and prevention of chronic obstructive lung disease 2017 report. GOLD executive summary. Am J Respir Crit Care Med. 2017;195(5):557–582. doi:10.1164/rccm.201701-0218PP
17. Miller MR, Hankinson J, Brusasco V, et al. Standardisation of spirometry. Eur Respir J. 2005;26(2):319–338. doi:10.1183/09031936.05.00034805
18. Wells JM, Farris RF, Gosdin TA, et al. Pulmonary artery enlargement and cystic fibrosis pulmonary exacerbations: a cohort study. Lancet Respir Med. 2016;4(8):636–645. doi:10.1016/S2213-2600(16)30105-9
19. Hammond E, Sloan C, Newell JD, et al. Comparison of low- and ultralow-dose computed tomography protocols for quantitative lung and airway assessment. Med Phys. 2017;44(9):4747–4757. doi:10.1002/mp.12436
20. Synn AJ, Zhang C, Washko GR, et al. Cigarette smoke exposure and radiographic pulmonary vascular morphology in the Framingham heart study. Ann Am Thorac Soc. 2019;16(6):698–706. doi:10.1513/AnnalsATS.201811-795OC
21. McDonough JE, Yuan R, Suzuki M, et al. Small-airway obstruction and emphysema in chronic obstructive pulmonary disease. N Engl J Med. 2011;365(17):1567–1575. doi:10.1056/NEJMoa1106955
22. Kim W-D, Ling SH, Coxson HO, et al. The association between small airway obstruction and emphysema phenotypes in COPD. Chest. 2007;131(5):1372–1378. doi:10.1378/chest.06-2194
23. Synn AJ, Li W, San José Estépar R, et al. Radiographic pulmonary vessel volume, lung function and airways disease in the Framingham heart study. Eur Respir J. 2019;54(3):1900408. doi:10.1183/13993003.00408-2019
24. Vitulo P, Stanziola A, Confalonieri M, et al. Sildenafil in severe pulmonary hypertension associated with chronic obstructive pulmonary disease: a randomized controlled multicenter clinical trial. J Heart Lung Transplant. 2017;36(2):166–174. doi:10.1016/j.healun.2016.04.010
25. Rao RS, Singh S, Sharma BB, Agarwal VV, Singh V. Sildenafil improves six-minute walk distance in chronic obstructive pulmonary disease: a randomised, double-blind, placebo-controlled trial. Indian J Chest Dis Allied Sci. 2011;53(2):81–85.
26. Valerio G, Bracciale P, Grazia D’Agostino A. Effect of bosentan upon pulmonary hypertension in chronic obstructive pulmonary disease. Ther Adv Respir Dis. 2009;3(1):15–21. doi:10.1177/1753465808103499
27. Coste F, Dournes G, Dromer C, et al. CT evaluation of small pulmonary vessels area in patients with COPD with severe pulmonary hypertension. Thorax. 2016;71(9):830–837. doi:10.1136/thoraxjnl-2015-207696
 © 2022 The Author(s). This work is published and licensed by Dove Medical Press Limited. The full terms of this license are available at https://www.dovepress.com/terms.php and incorporate the Creative Commons Attribution - Non Commercial (unported, v3.0) License.
By accessing the work you hereby accept the Terms. Non-commercial uses of the work are permitted without any further permission from Dove Medical Press Limited, provided the work is properly attributed. For permission for commercial use of this work, please see paragraphs 4.2 and 5 of our Terms.
© 2022 The Author(s). This work is published and licensed by Dove Medical Press Limited. The full terms of this license are available at https://www.dovepress.com/terms.php and incorporate the Creative Commons Attribution - Non Commercial (unported, v3.0) License.
By accessing the work you hereby accept the Terms. Non-commercial uses of the work are permitted without any further permission from Dove Medical Press Limited, provided the work is properly attributed. For permission for commercial use of this work, please see paragraphs 4.2 and 5 of our Terms.