Back to Journals » Diabetes, Metabolic Syndrome and Obesity » Volume 13
Correlation Profile of Suppression of Tumorigenicity 2 and/or Interleukin-33 with Biomarkers in the Adipose Tissue of Individuals with Different Metabolic States
Authors Hasan A ![]() , Kochumon S, Al-Ozairi E
, Kochumon S, Al-Ozairi E ![]() , Tuomilehto J, Al-Mulla F
, Tuomilehto J, Al-Mulla F ![]() , Ahmad R
, Ahmad R ![]()
Received 29 February 2020
Accepted for publication 1 August 2020
Published 20 October 2020 Volume 2020:13 Pages 3839—3859
DOI https://doi.org/10.2147/DMSO.S251978
Checked for plagiarism Yes
Review by Single anonymous peer review
Peer reviewer comments 2
Editor who approved publication: Prof. Dr. Juei-Tang Cheng
Amal Hasan,1 Shihab Kochumon,1 Ebaa Al-Ozairi,2,3 Jaakko Tuomilehto,4– 6 Fahd Al-Mulla,7 Rasheed Ahmad1
1Department of Immunology and Microbiology, Dasman Diabetes Institute, Kuwait City, Kuwait; 2Clinical Research Unit, Medical Division, Dasman Diabetes Institute, Kuwait City, Kuwait; 3Department of Medicine, Faculty of Medicine, Kuwait City, Kuwait; 4Research Division, Dasman Diabetes Institute, Kuwait City, Kuwait; 5Department of Public Health, University of Helsinki, Helsinki, Finland; 6National School of Public Health, Madrid, Spain; 7Department of Genetics and Bioinformatics, Functional Genomics, Dasman Diabetes Institute, Kuwait City, Kuwait
Correspondence: Amal Hasan Email [email protected]
Purpose: The suppression of tumorigenicity 2 (ST2) has two main splice variants including a membrane bound (ST2) form, which activates the myeloid differentiation primary response 88 (MyD88)/nuclear factor-kappa B (NF-κB) signaling pathway, and a secreted soluble form (sST2), which acts as a decoy receptor for ST2 ligand, interleukin (IL)-33. The IL-33/ST2 axis is protective against obesity, insulin resistance, and type 2 diabetes (T2D). In humans, adipose tissue IL-33 displays distinct correlation profiles with glycated hemoglobin, ST2, and other immunometabolic mediators, depending on the glycemic health of the individuals. We determined whether adipose tissue ST2 displays distinct correlation profiles with immunometabolic mediators and whether ST2 and/or IL-33 are correlated with intracellular signaling molecules.
Patients and Methods: A total of 91 adults with normal glycemia, prediabetes, and T2D were included. After measuring their anthropometric and biochemical parameters, subcutaneous adipose tissues were isolated and mRNA expression of biomarkers was measured.
Results: In individuals with normal glycemia, adipose tissue ST2 was directly correlated with chemokine (C-C motif) ligand (CCL)-2, CCL5, IL-12, fibrinogen-like protein 2 (FGL2) and interferon regulatory factor (IRF)-4, but inversely correlated with cytochrome C oxidase subunit 7A1. IL-33 and ST2 were directly correlated with tumor necrosis factor receptor-associated factor 6 (TRAF6), NF-κB, and nuclear factor of activated T-cells 5 (NFAT5). In individuals with prediabetes, ST2 was inversely correlated with IL-5, whereas IL-33 but not ST2 was directly correlated with MyD88 and NF-κB. In individuals with T2D, ST2 was directly correlated with CCL2, IL-1β, and IRF5. IL-33 and ST2 were directly correlated with MyD88, TRAF6, and NF-κB.
Conclusion: Adipose tissue ST2 and IL-33 show different correlation profiles with various immunometabolic biomarkers depending on the metabolic state of the individuals. Therefore, targeting the IL-33/ST2 axis might form the basis for novel therapies to combat metabolic disorders.
Keywords: obesity, prediabetes, type 2 diabetes, suppression of tumorigenicity 2, interleukin-33
Introduction
Adipose tissue inflammation plays a major role in the development of insulin resistance and type 2 diabetes (T2D). The suppression of tumorigenicity 2 (ST2) gene has two main splice variants; one encodes for a transmembrane isoform (ST2L), and the other isoform encodes for a soluble and secreted protein (sST2).1 ST2L confers the downstream functions of the ligand interleukin (IL)-33, while sST2 serves as an antagonistic decoy receptor.2 ST2L is expressed by innate and adaptive immune cells, including monocytes, macrophages, dendritic cells, innate lymphoid cell (ILC)-2, B1 B-cells, T helper (Th)-2 cells, T cytotoxic (Tc)-1 cells, T regulatory (Treg) cells, and Th9 cells.1,3-27 IL-33 can have a dual-function: acting extracellularly as a cytokine (cleaved/mature IL-33), or intracellularly as a nuclear factor (proteolytically uncleaved full-length IL-33).28 In this regard, IL-33 is constitutively expressed in the nucleus of certain cell types, including pre-adipocytes, adipocytes, endothelial cells and epithelial cells.29–31 The main function of intranuclear IL-33 is regulation of gene expression.28 However, IL-33 is rapidly and passively released from cells in response to cell damage, hence, referred to as an “alarmin”. In addition, IL-33 can be secreted by activated immune cells, including monocytes/macrophages,32–35 dendritic cells,36 and mast cells,34 and thus, play an important role in immune regulation.37 Extracellular IL-33 interacts with ST2L forming a complex with the IL-1 receptor accessory protein (IL-1RAP), which signals via the myeloid differentiation primary response 88 (MyD88)/interleukin-1 receptor-associated kinase 1 (IRAK1)/tumor necrosis factor (TNF) receptor-associated factor 6 (TRAF6) intracellular signaling pathways. This leads to activation of mitogen-activated protein kinase (MAPK)/activator protein 1 (AP1) or nuclear factor-kappa B (NF-κB) transcription factors38,39 (Figure 1; previously published).40
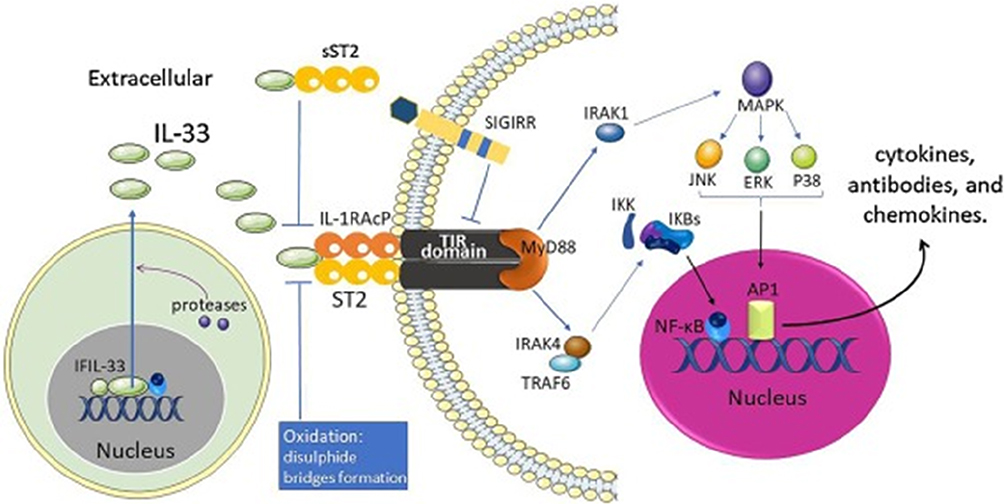 |
Figure 1 IL-33/ST2 signaling pathway.Note: Reprinted from Cytokine & Growth Factor Reviews, 50, Liu X, Xiao Y, Pan Y, Li H, Zheng SG, Su W, The role of the IL-33/ST2 axis in autoimmune disorders: Friend or foe?, 60–74, Copyright (2019), with permission from Elsevier.40 |
Previous studies in animal models have demonstrated that the IL-33/ST2 axis is protective against obesity, insulin resistance, and T2D.31,41,42 In addition, circulating IL-33 may confer protective metabolic effects in humans, specifically, in individuals with normal-weight/glycemia but not in those with obesity and/or T2D.43 The mechanisms by which IL-33 exerts protective metabolic effects include reduction of resistin expression,31 accumulation of protective Th2 cells and associated cytokines, and polarization of resident macrophages toward a protective alternatively activated phenotype.31,41 In a recent study, we found no difference in the expression level of adipose tissue IL-33 or ST2 among individuals with normal glycemia, prediabetes and T2D. However, adipose tissue IL-33 displayed distinct correlation profiles with overall glycemia, and related immunometabolic biomarkers, depending on whether the participants had normal glycemia, prediabetes or T2D. More specifically, adipose tissue IL-33 was inversely correlated with glycated hemoglobin (HbA1c), and directly correlated with adipose tissue ST2, in individuals with normal glycemia and in those with T2D and managed with glucose-lowering medications (T2D/med) but not in persons with prediabetes.44 This suggests an important dynamic relationship between IL-33 and ST2 in the adipose tissue, which may influence overall glycemia; and importantly, its potential dysfunction during metabolic disease development, and its potential reversal with glucose-lowering medications.44 Therefore, we conducted this study to explore the correlation between adipose tissue ST2 and chemokines/cytokines, transcription factors and other signaling molecules in the adipose tissue of individuals with normal glycemia, prediabetes and T2D/med.
Patients and Methods
Study Participants
The study was approved by the Ethical Review Committee of Dasman Diabetes Institute, State of Kuwait, and was conducted in accordance with the ethical principles of the Declaration of Helsinki. This work was conducted using samples obtained as part of the Adult Obesity Program (RA 2010-0003). For the current study, the inclusion criteria included adult volunteers (age ≥21 years), body mass index (BMI) ≥18 kg/m2, lack of exercise regimen for at least one year, and having an overall glycemia in the normal (HbA1c <5.7%) or prediabetes (HbA1c 5.7–6.4%) range, or a diagnosis of T2D. The exclusion criteria included the presence of any disease/consumption of medication in individuals with normal glycemia, and treatment with any type of glucose-lowering medications in those with prediabetes. According to these criteria, the study included 91 adults between the ages of 23 and 72. All participants had provided written informed consent, and were grouped based on their HbA1c (in accordance with the American Diabetes Association criteria45) into three groups, namely normal glycemia (HbA1c <5.7%), prediabetes (HbA1c 5.7–6.4%; not on glucose-lowering medications) and T2D/med (a diagnosis of T2D; on any type of glucose-lowering medications) (Flowchart shown in Figure 2).45–47 Comorbid health conditions included hypertension, dyslipidemia, cardiovascular disease, kidney disease and neuropathy (Table 1). Details of the types of prescribed medications taken by individuals with prediabetes and/or T2D are listed in Table 2.
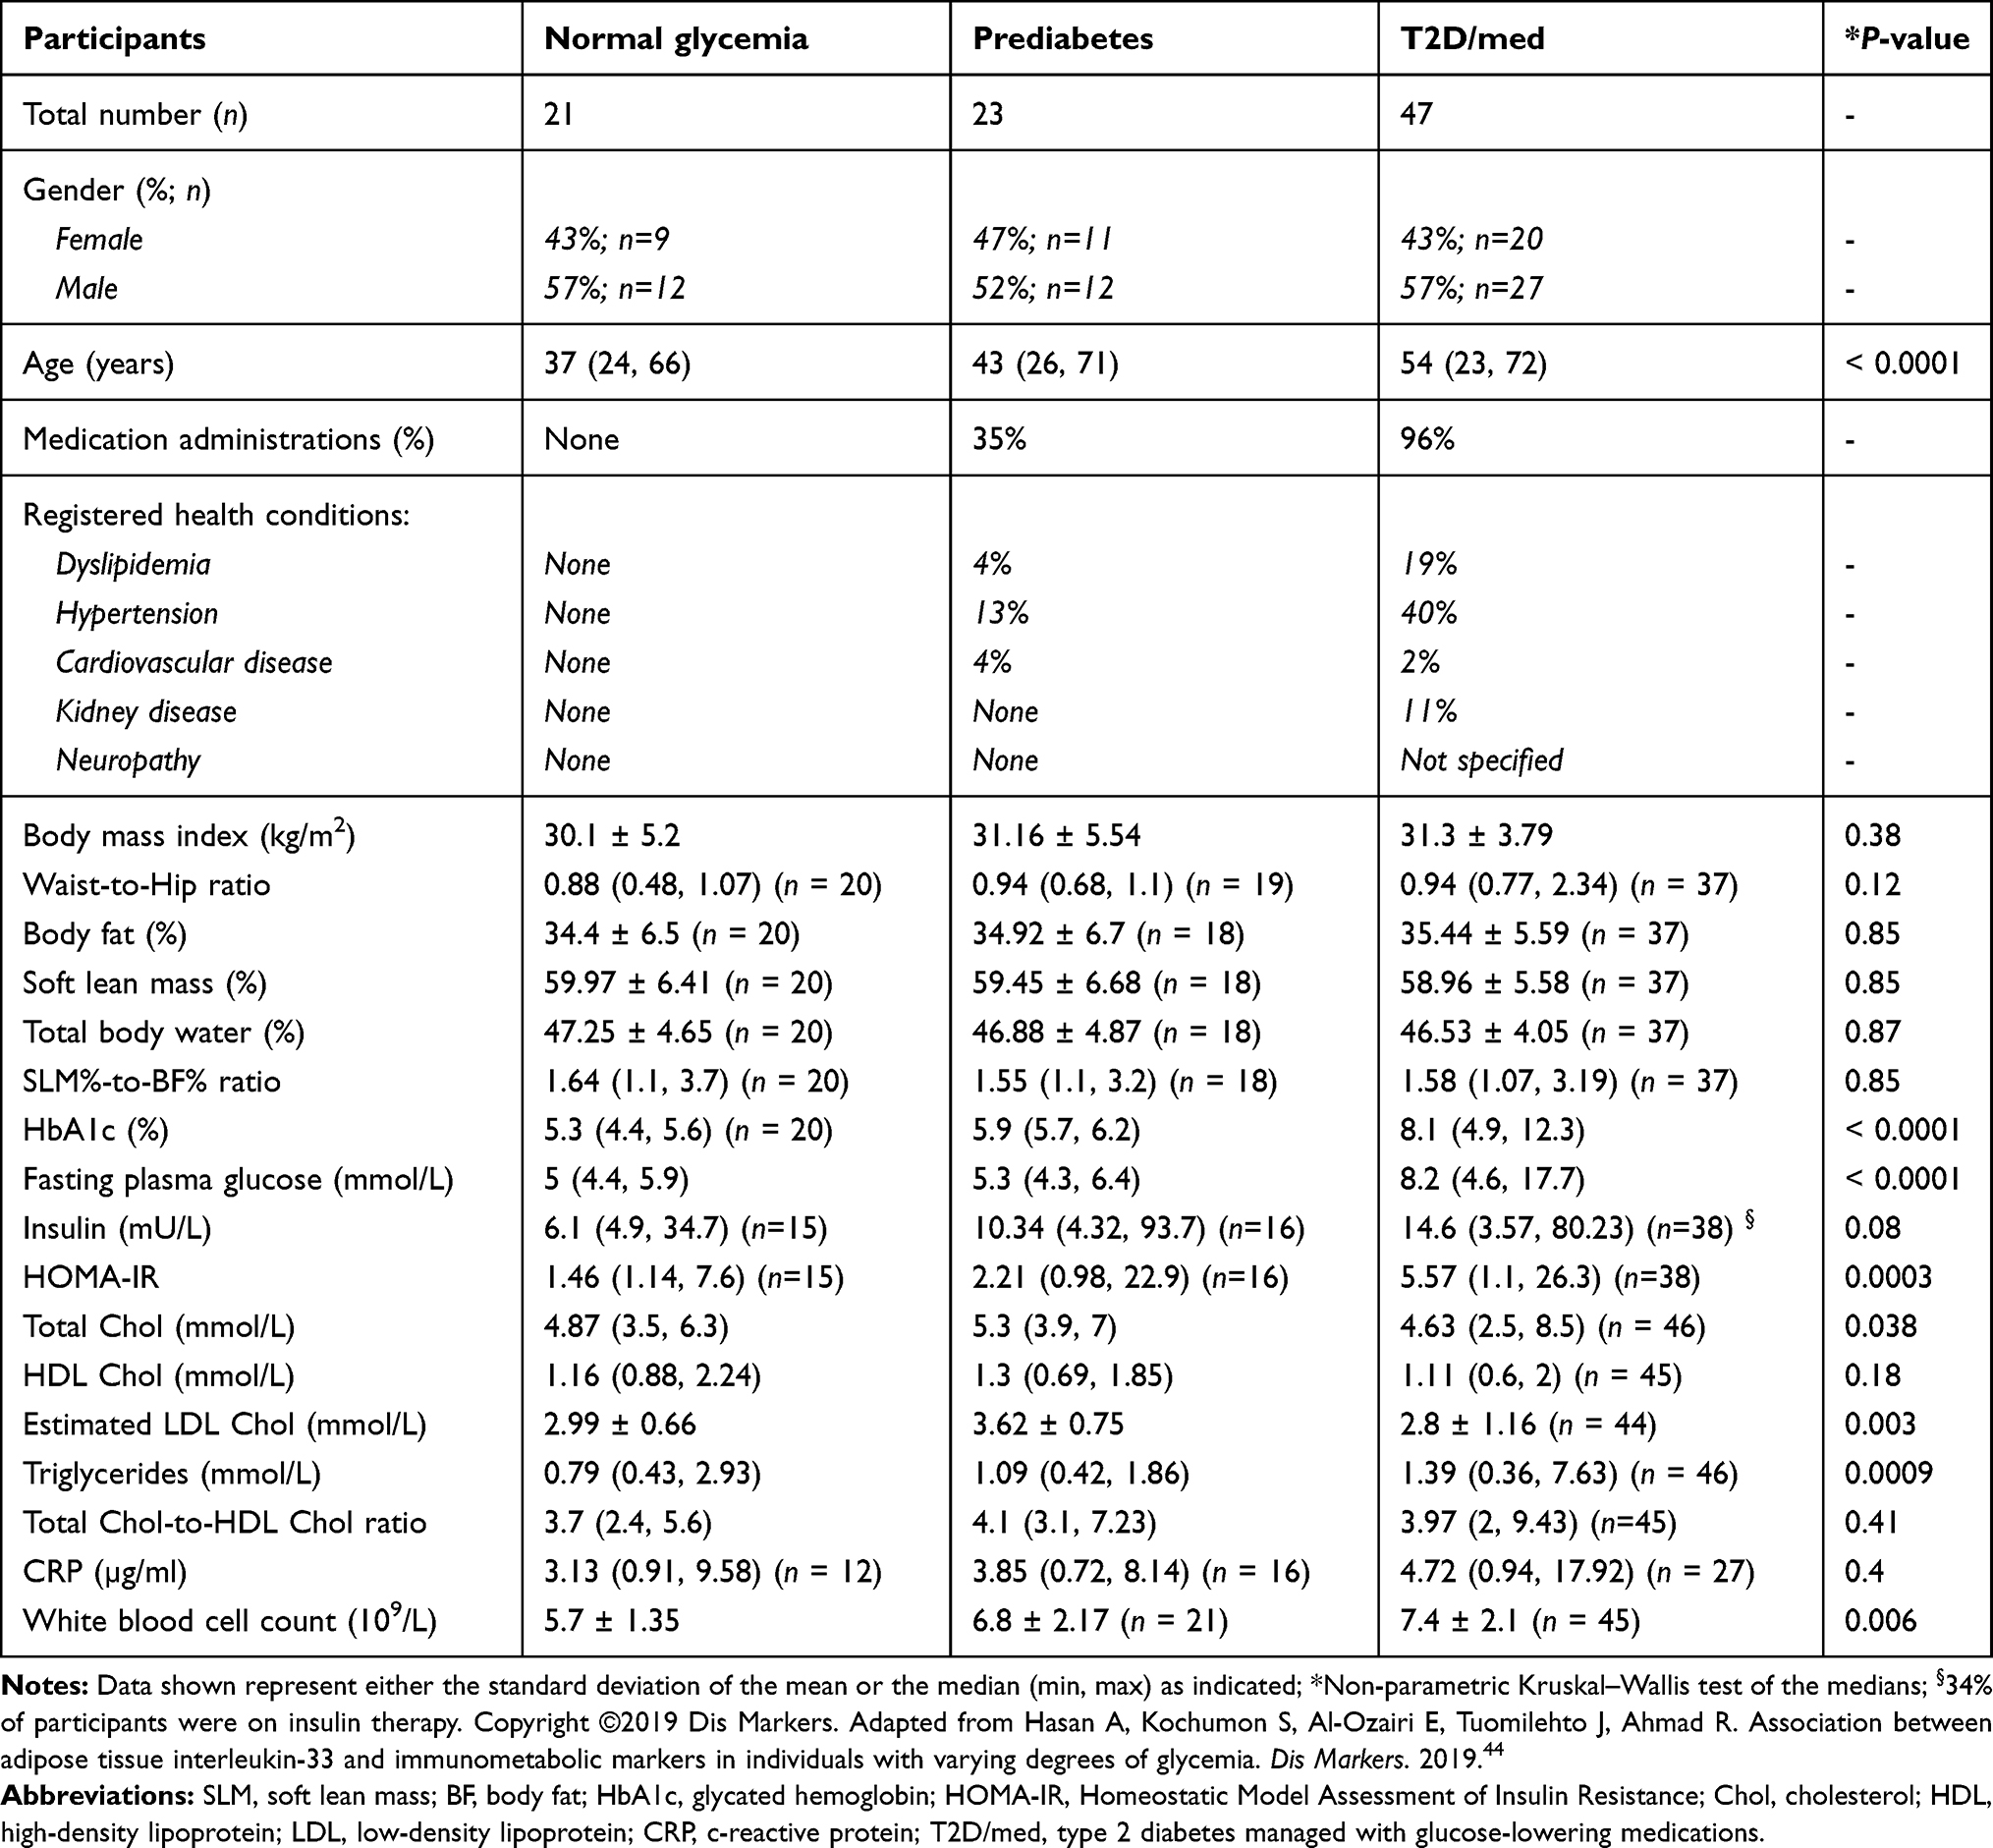 |
Table 1 Anthropometric, Biochemical and Metabolic Characteristics of the Study Groups |
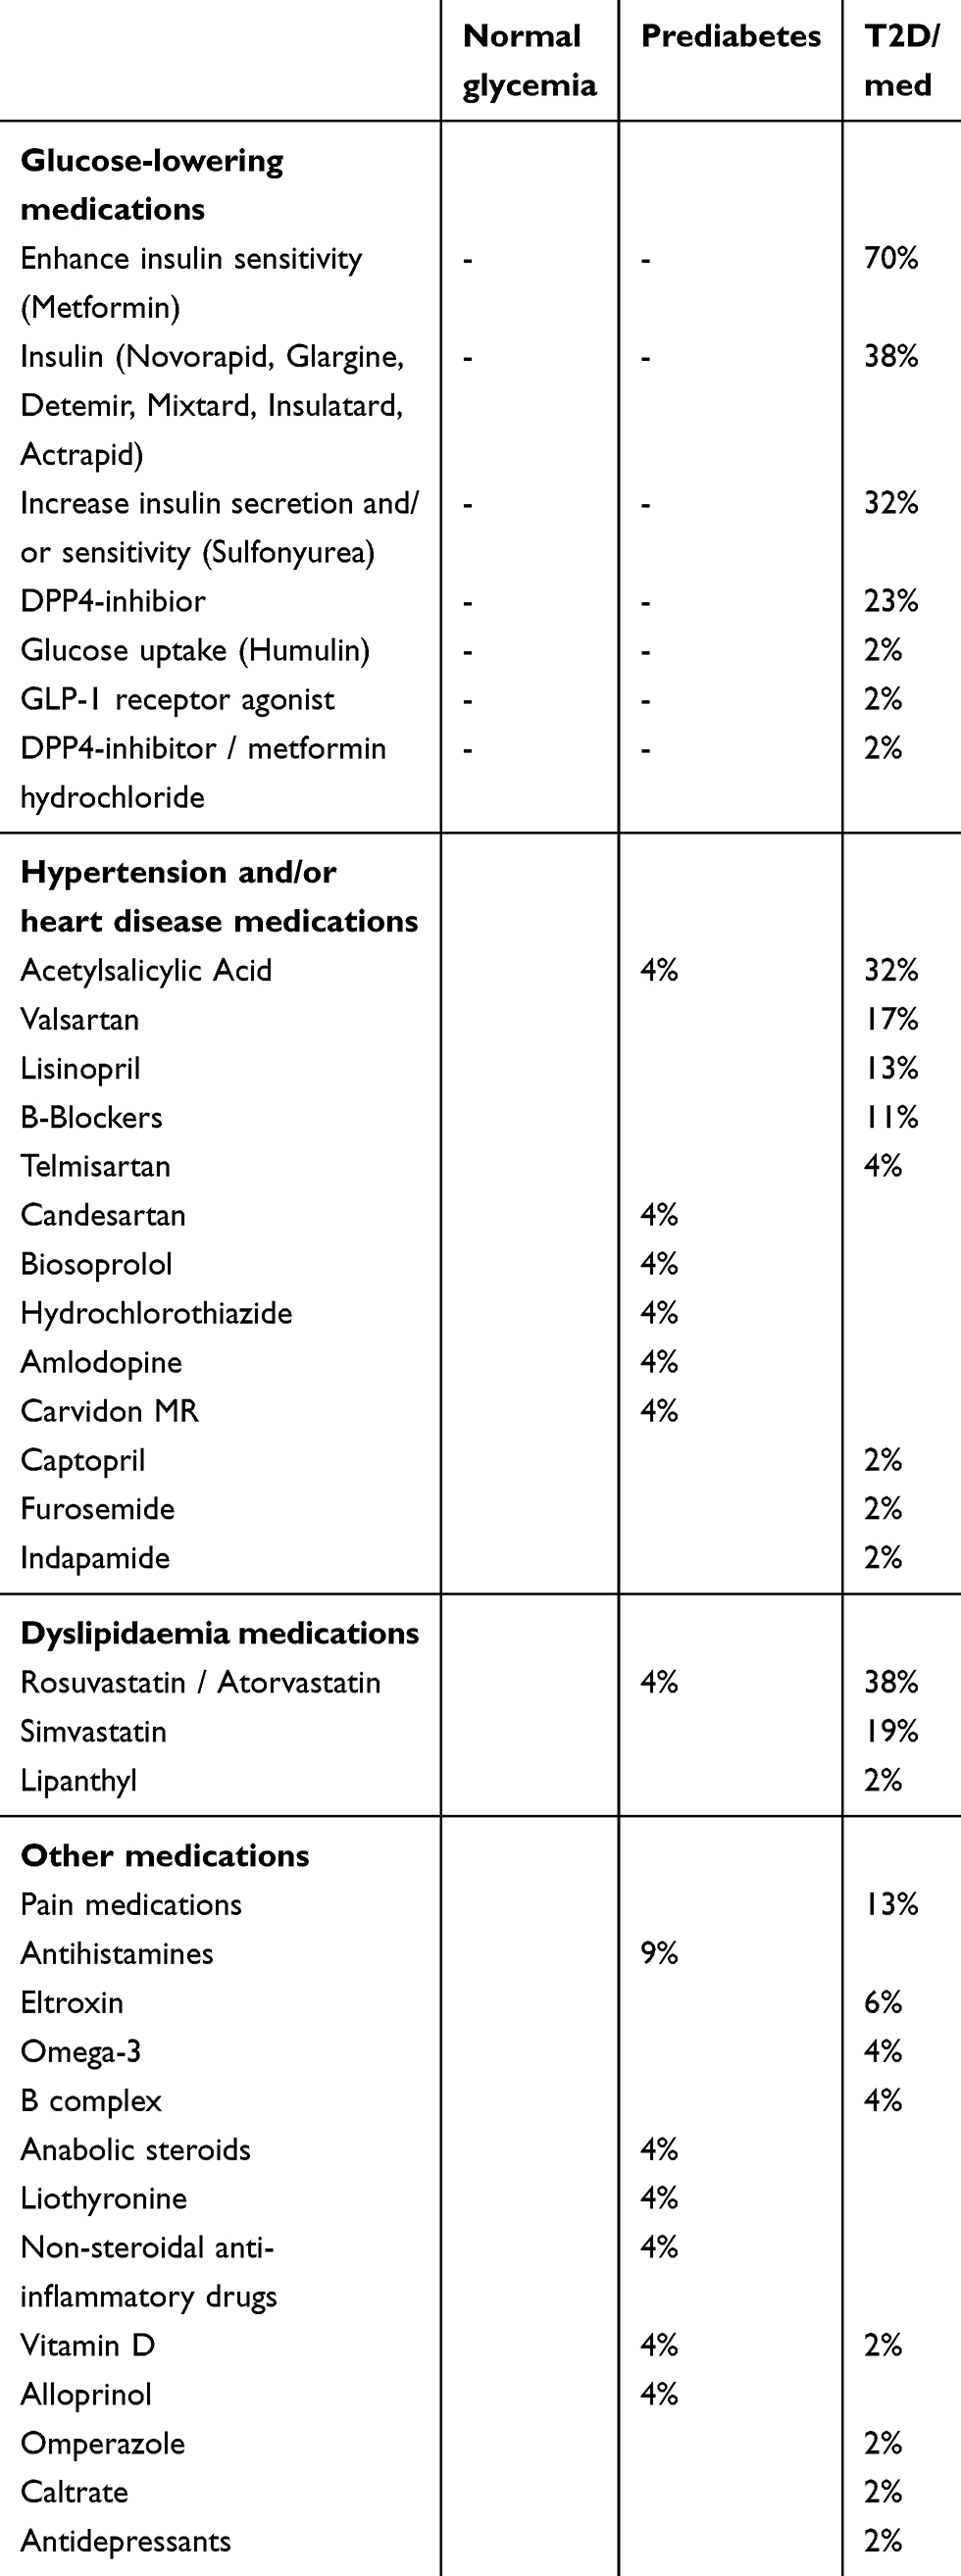 |
Table 2 Health Conditions and on-Going Medications of the Study Groups |
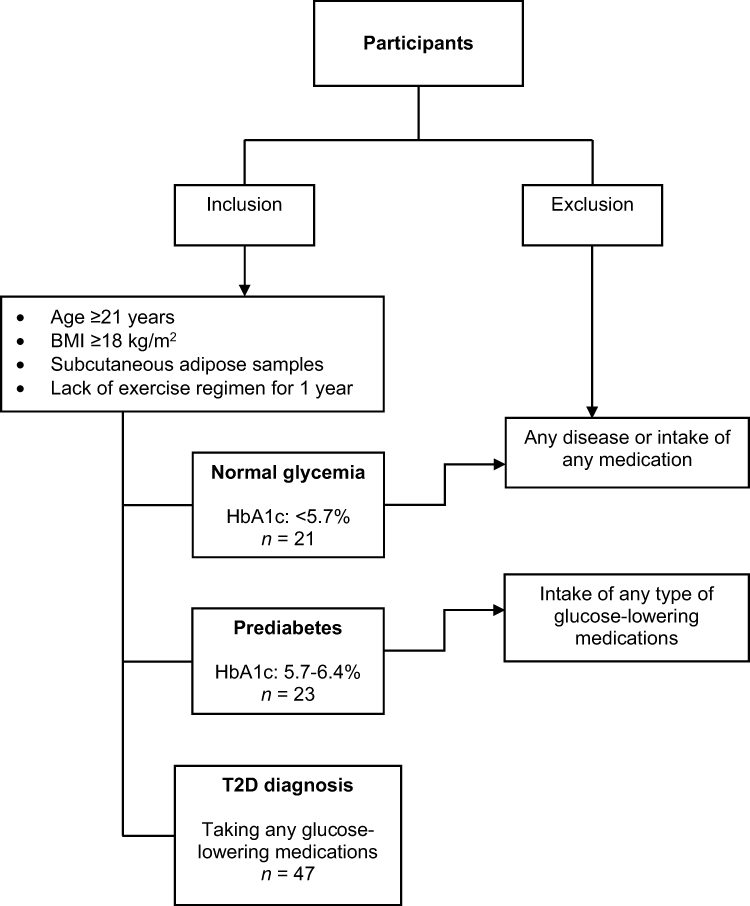 |
Figure 2 Flowchart of inclusion and exclusion criteria. |
Anthropometric and Laboratory Measurements
The participant’s body weight (kg) and height (to the nearest 0.5 cm) were measured, and the BMI was calculated as weight/height2 (kg/m2) and used as an overall index of adiposity. The waist and hip circumferences were measured using a flexible tape according to the guidelines of the International Diabetes Federation (IDF). After the participant exhaled, the waist circumference was measured on a horizontal plane at a point that was equally distant from the lowest rib and the upper border of the iliac crest. Hip circumference was measured on a horizontal plane at the maximum protuberance of the buttocks which parallels the ischiopubic symphysis in the front. The waist-to-hip ratio (WHR) was calculated by dividing the waist perimeter by the hip perimeter. The body composition, including body fat (%), soft lean mass (SLM) (%) and total body water (%), were measured using IOI 353 Body Composition Analyzer (Jawon Medical) (Table 1).
Fasting blood samples were obtained, and plasma glucose, serum total cholesterol, triglycerides (TG), high-density lipoprotein (HDL) cholesterol were measured using the Siemens Dimension RXL chemistry analyser (Diamond Diagnostics, Holliston, MA, USA). Low-density lipoprotein (LDL) cholesterol was estimated. HbA1c was measured using VariantTM (Bio-Rad, Hercules, CA, USA). The white blood cell count was measured using XN-1000 Haematology Analyser (Sysmex, USA). C-reactive protein (CRP) was measured using commercially available Enzyme-Linked Immunosorbent Assay (ELISA) kits (BioVendor, USA). Insulin was measured using commercially available Iso-insulin ELISA kits (Mercodia, Uppsala, Sweden). Homeostatic Model Assessment of Insulin Resistance (HOMA-IR) was calculated using the following formula: glucose in mmol/L x insulin in mIU/mL/22.5 (Tables 1 and 3). General linear model of covariance analysis is shown in Supplementary Table 1.
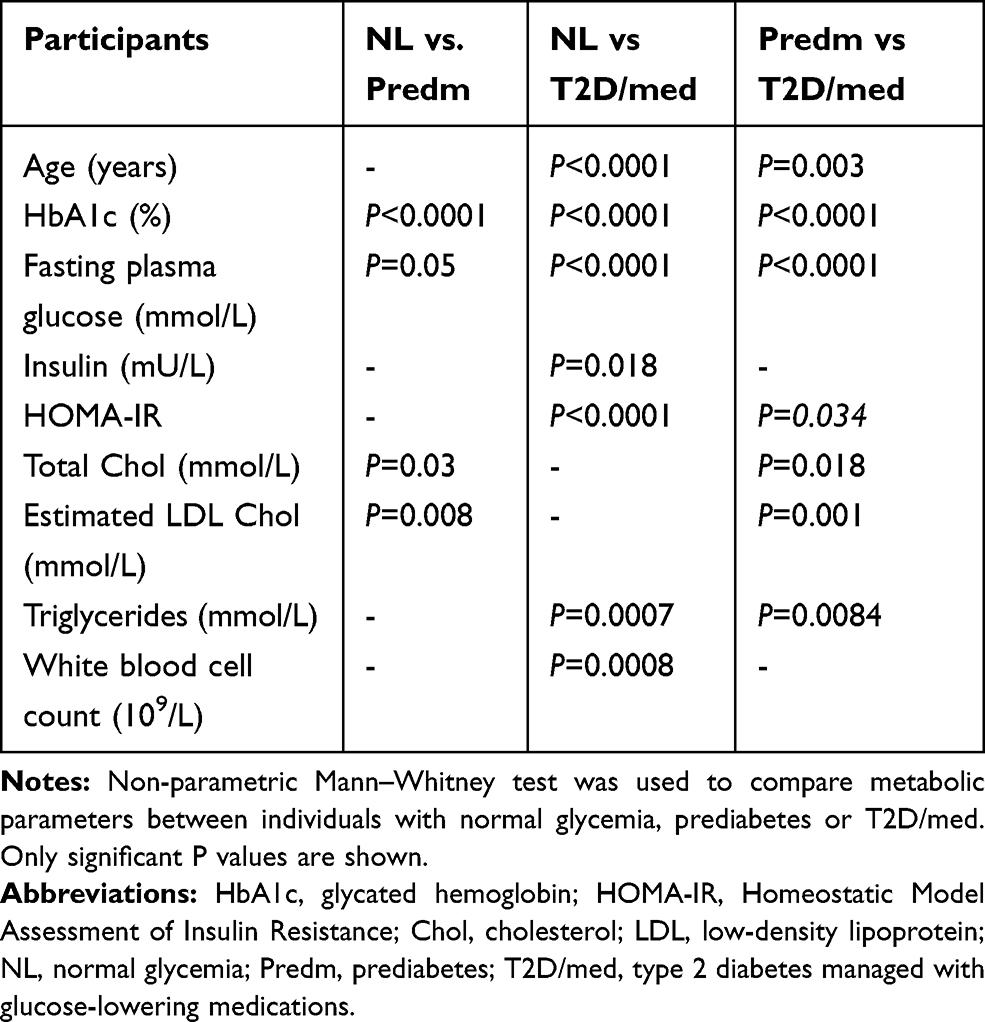 |
Table 3 A Comparison of the Parameters Between Two Groups of Participants with Different Metabolic States |
Real-Time Reverse-Transcription Polymerase Chain Reaction
Real-time reverse-transcription polymerase chain reaction was conducted, as previously described.44,48 Briefly, cDNA samples (reverse transcribed from RNA samples) were amplified using TaqMan® Gene Expression Master Mix (Applied Biosystems, CA, USA) and gene-specific 20× TaqMan Gene Expression Assay (Applied Biosystems, CA, USA)54 using a 7500 Fast Real-Time PCR System (Applied Biosystems, CA, USA). Amplified glyceraldehyde 3-phosphate dehydrogenase (GAPDH) expression was used as an internal control. The comparative CT method was used to analyze the relative gene expression of various immunometabolic biomarkers using the formula 2-ΔΔCT whereby ΔΔCT = [CT gene of interest – CT endogenous control; ΔCT] – normal weight control with highest ΔCT. The relative mRNA fold expression for each specific gene was calculated by normalizing CT values to the endogenous control GAPDH (ΔCT) followed by normalizing ΔCT of each gene expression to the highest ΔCT of normal weight control. The assays IDs of the analyzed genes are shown in Supplementary Table 2.
Isolation of RNA from Subcutaneous Adipose Tissue
Human adipose tissues (~0.5 g) were collected from abdominal subcutaneous fat pads as described previously,44 and preserved in RNAlater or embedded in optimal cutting temperature compound and stored at −80 °C. Total cellular RNA was purified using the RNeasy kit (Qiagen, Valencia, CA, USA) as per manufacturer’s instructions. The quantity and quality of the isolated RNA were determined using the Epoch™ Spectrophotometer System (BioTek, Winooski, VT, USA) and formaldehyde–agarose gel electrophoresis, respectively.
Statistical Methods
The non-parametric Spearman’s r test was used for the correlation analysis, and a heat-map of the correlations was generated. To compare between groups of data, the non-parametric Kruskal–Wallis test, as well as the Mann–Whitney test, were used. Correlations and group comparisons were conducted using the GraphPad Prism software (Version 8.0.2; San Diego, CA, USA). Analysis of covariance and linear regression were conducted using the IBM SPSS software (Version 25; New York, USA). A P-value of <0.05 was considered statistically significant.
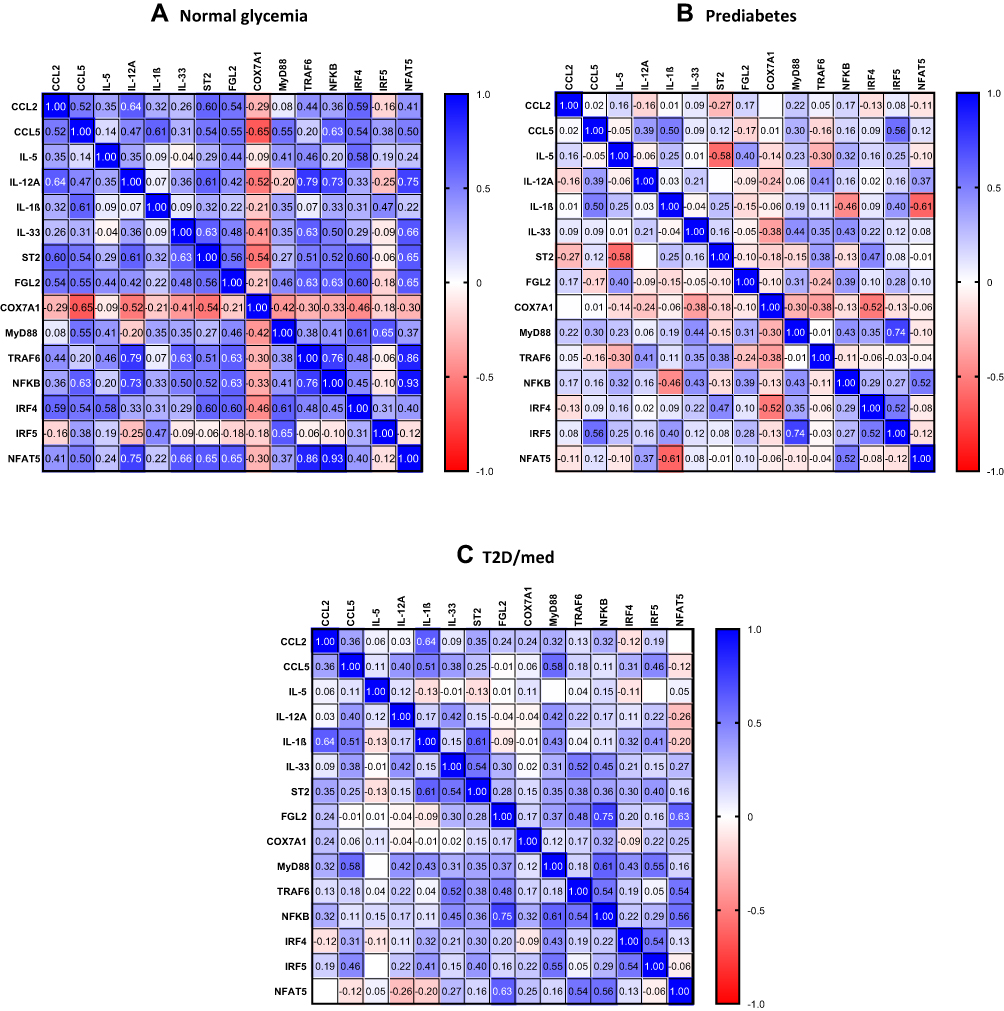 |
Figure 3 Heat-map of the correlations found in individuals with normal glycemia (A), prediabetes (B), and T2D/med (C).Abbreviations: CCL, chemokine (C-C motif) ligand; IL, interleukin; ST2, suppression of tumorigenicity 2; FGL2, fibrinogen-like protein 2; COX7A1, cytochrome C oxidase subunit 7A1; MyD88, myeloid differentiation primary response 88; TRAF6, tumor necrosis factor receptor-associated factor 6; NFκB, nuclear factor-kappa B; IRF, interferon regulatory factor; NFAT5, nuclear factor of activated T-cells 5. |
Results
Adipose Tissue ST2 Shows Distinct Correlation Profiles with Chemokines Depending on the Glycemic Status of the Individuals
We investigated the correlation between ST2 and various chemokines (chemokine (C-C motif ligand (CCL)-2, CCL5, CCL7, CCL8, CCL11, CCL15, CCL19, CCL20, (C-X-C motif) ligand (CXCL)-9 and CXCL10) in the adipose tissue of individuals with normal glycemia, prediabetes and T2D/med. ST2 was directly correlated with CCL2 (r = 0.6, P = 0.0085, n = 18; after adjustment for age (r = 0.6, P = 0.01), gender (r = 0.6, P = 0.009) and BMI (r = 0.586, P = 0.013)) and CCL5 (r = 0.53, P = 0.04, n = 15; after adjustment for age (r = 0.49, P = 0.076), gender (r = 0.54, P = 0.048) and BMI (r = 0.54, P = 0.048)) in the adipose tissue of individuals with normal glycemia but not in those with prediabetes. In individuals with T2D/med, ST2 showed a similar correlation profile to those with normal glycemia; in this regard, ST2 was directly correlated with CCL2 (r = 0.35, P = 0.03, n = 39; after adjustment for age (r = 0.364, P = 0.02), gender (r = 0.372, P = 0.017) and BMI (r = 0.336, P = 0.032)) (Figure 4A and B; Heat-map shown in Figure 3). When the levels of these two chemokines were compared between the three groups, it was found that individuals with prediabetes (median = 2.76, n = 19) had significantly (P = 0.009) higher levels of CCL5 compared to those with T2D/med (median = 1.87, n = 36). Moreover, individuals with T2D/med (median = 2.4, n = 42) had significantly (P = 0.02) higher levels of CCL2 compared to those with normal glycemia (median = 2, n = 21) (data not shown). The correlation between these chemokines and metabolic parameters are shown in Table 4.
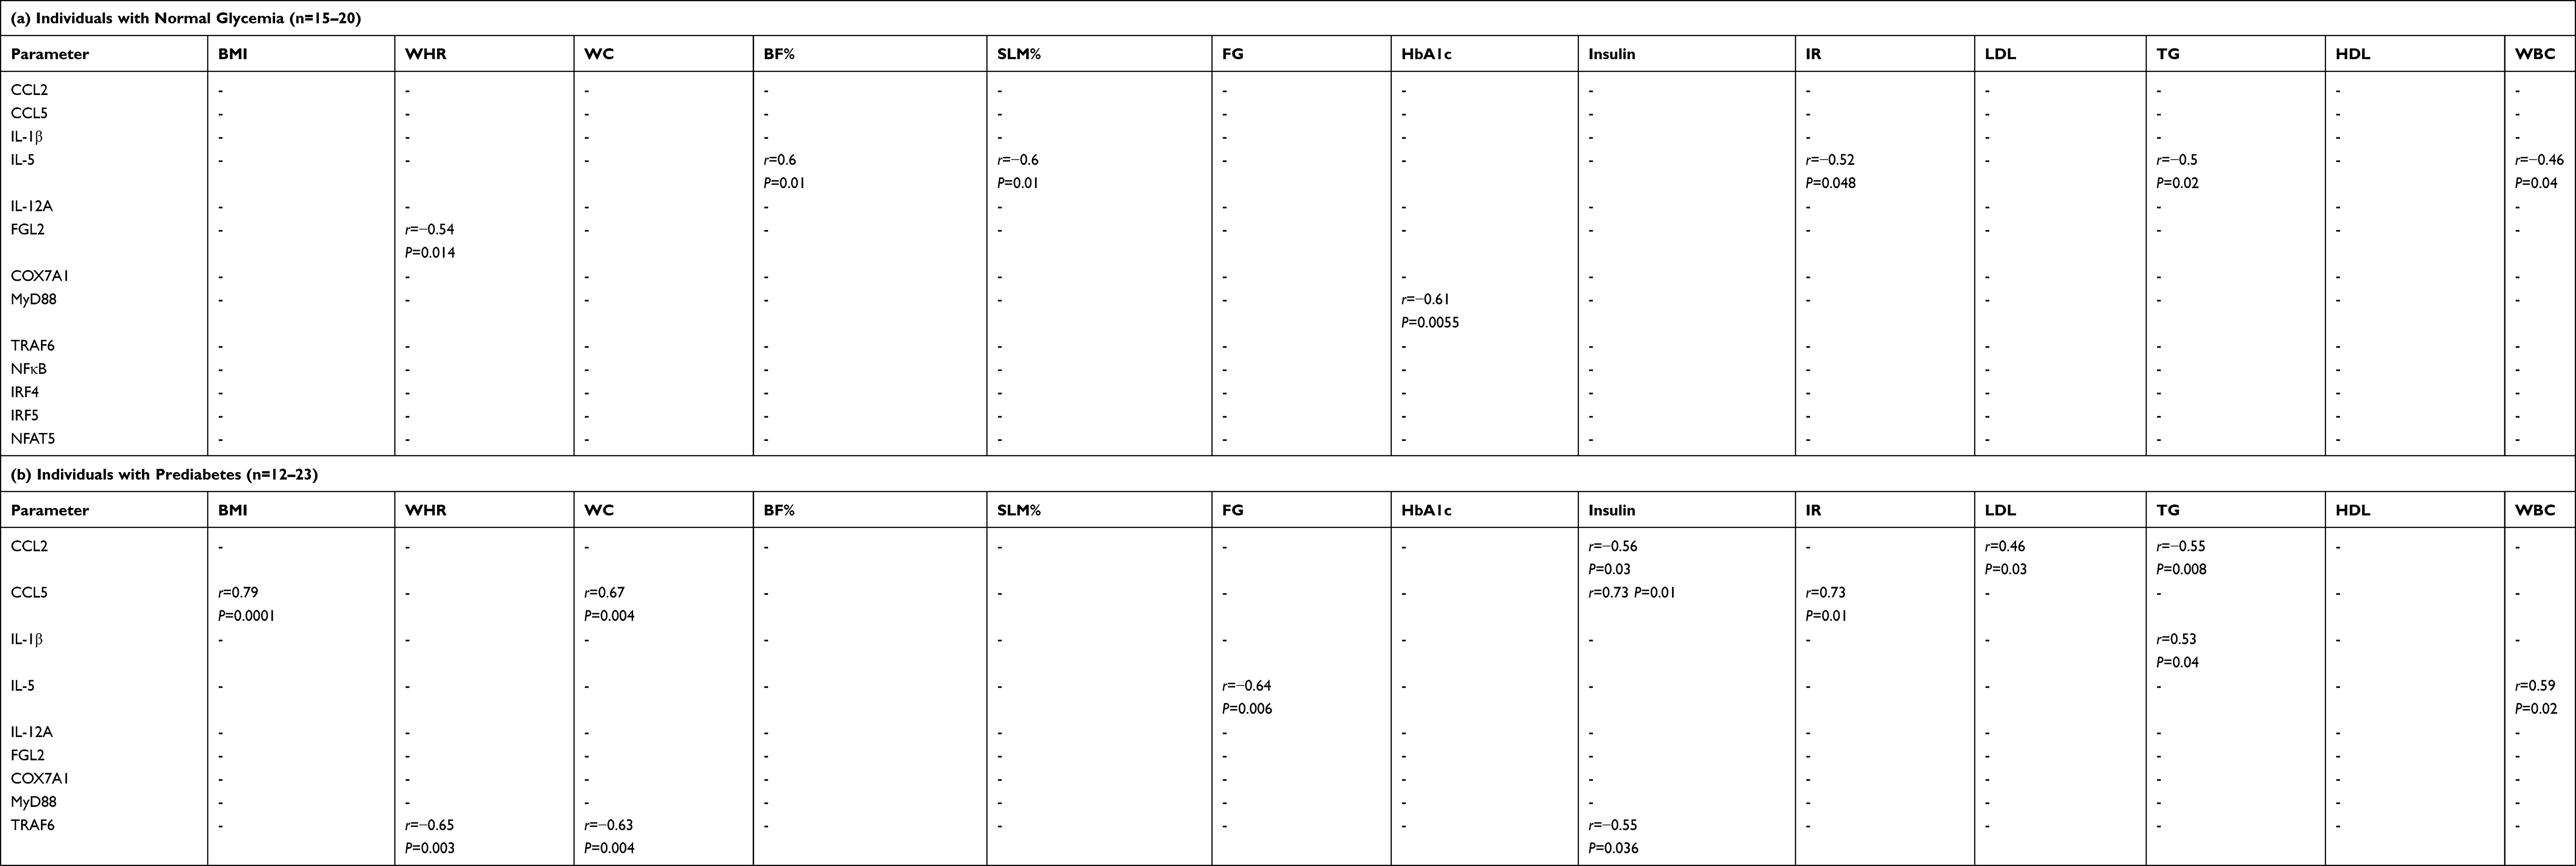 |
Table 4 Correlation Between Adipose Tissue Biomarkers and Metabolic Parameters |
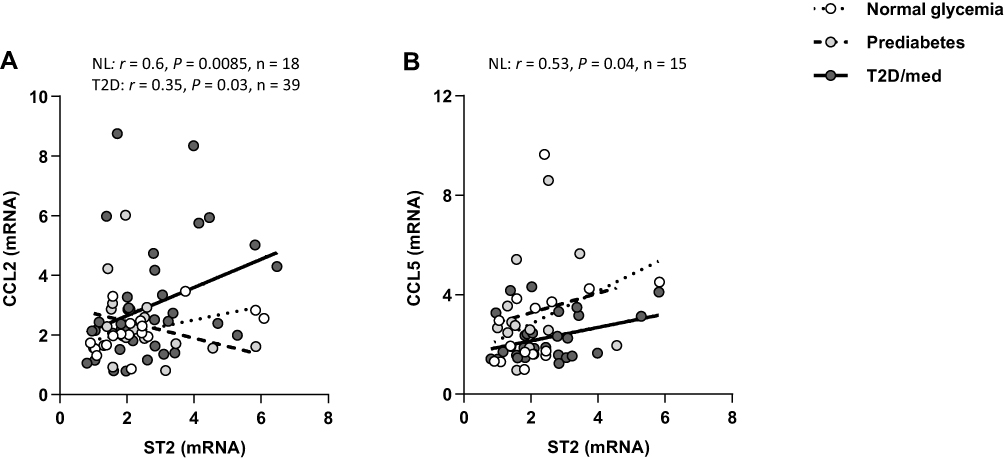 |
Figure 4 ST2 displays distinct correlation profiles with chemokines in the adipose tissue of individuals with normal glycemia, prediabetes and T2D/med. (A) Direct correlation between ST2 and CCL2 in the adipose tissue of individuals with normal glycemia (n = 18) and T2D/med (n = 39). (B) Direct correlation between ST2 and CCL5 in the adipose tissue of individuals with normal glycemia (n = 15).Abbreviations: ST2, suppression of tumorigenicity 2; CCL, chemokine (C-C motif) ligand; NL, normal glycemia; T2D/med, type 2 diabetes managed with glucose-lowering medications. |
Adipose Tissue ST2 Shows Distinct Correlation Profiles with Th1/Th2 Cytokines and FGL2 Depending on the Glycemic Status of the Individuals
We investigated the correlation between ST2 and inflammatory and Th1 cytokines (IL-1β, TNF-α, IL-6, IL-8, IL-12A, IL-18, and IL-23A), Th2 cytokines (IL-5 and IL-13), regulatory cytokines (IL-10 and transforming growth factor-β) and fibrinogen-like protein 2 (FGL2), in the adipose tissue of individuals with normal glycemia, prediabetes and T2D/med. ST2 was directly correlated with IL-12 (r = 0.61, P = 0.03, n = 13; after adjustment for age (r = 0.61, P = 0.036), gender (r = 0.73, P = 0.007) and BMI (r = 0.614, P = 0.034)) in the adipose tissue of individuals with normal glycemia. ST2 was inversely correlated with IL-5 (r = −0.58, P = 0.03, n = 14; after adjustment for age (r = −0.57, P = 0.035), gender (r = −0.615, P = 0.02) and BMI (r = −0.73, P = 0.003)) in the adipose tissue of individuals with prediabetes. In individuals with T2D/med, ST2 was directly correlated with IL-1β (r = 0.61, P = 0.0005, n = 28; after adjustment for age (r = 0.48, P = 0.006), gender (r = 0.46, P = 0.009) and BMI (r = 0.423, P = 0.018)) (Figure 5A–C; Heat-map shown in Figure 3). In addition, ST2 was directly correlated with FGL2 (r = 0.56, P = 0.015, n = 18; after adjustment for age (r = 0.573, P = 0.016), gender (r = 0.548, P = 0.023) and BMI (r = 0.61, P = 0.009)) in the adipose tissue of individuals with normal glycemia (Figure 6A; Heat-map shown in Figure 3). Of note, there was no significant difference in the level of IL-12, IL-5, IL-1β, or FGL2 between the three groups (data not shown). The correlation between these cytokines and FGL2 and metabolic parameters are shown in Table 4.
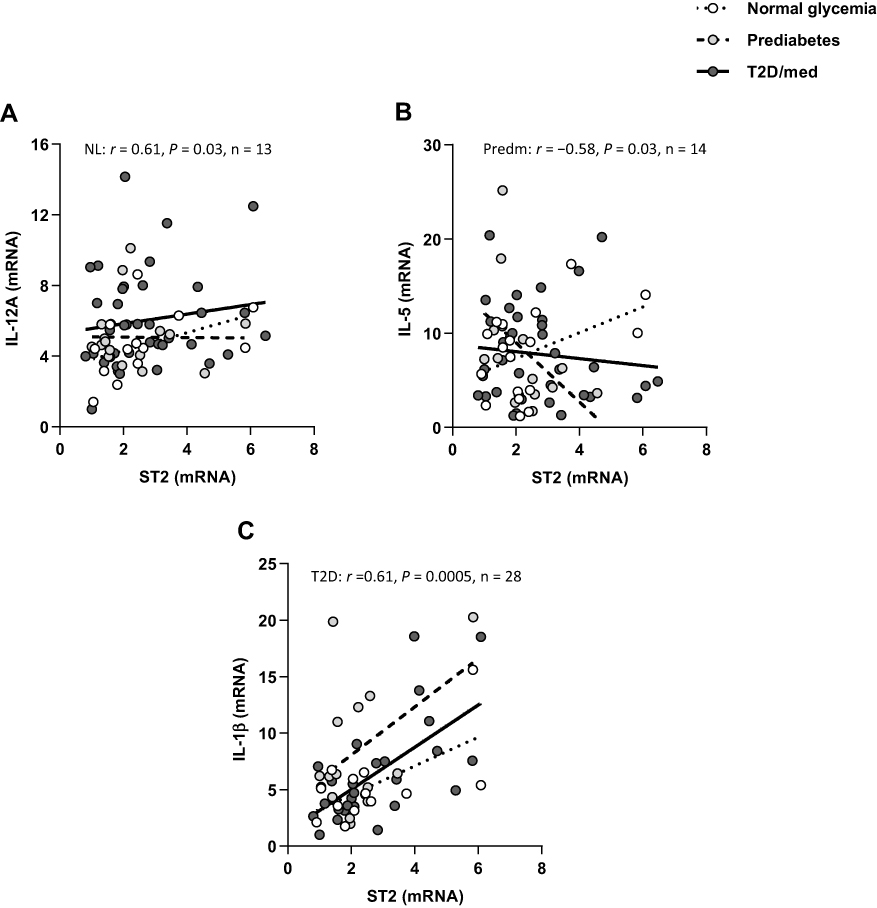 |
Figure 5 ST2 displays distinct correlation profiles with cytokines in the adipose tissue of individuals with normal glycemia, prediabetes and T2D/med. (A) Direct correlation between ST2 and IL-12A in the adipose tissue of individuals with normal glycemia (n = 13). (B) Inverse correlation between ST2 and IL-5 in the adipose tissue of individuals with prediabetes (n = 14). (C) Direct correlation between ST2 and IL-1β in the adipose tissue of individuals with T2D/med (n = 28).Abbreviations: ST2, suppression of tumorigenicity 2; IL, interleukin; NL, normal glycemia; Predm, prediabetes; T2D/med, type 2 diabetes managed with glucose-lowering medications. |
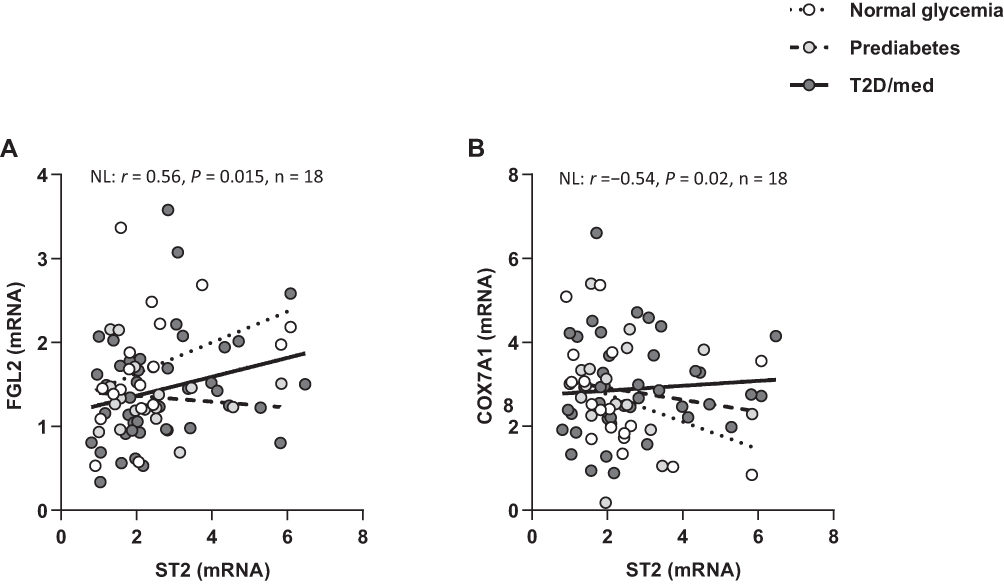 |
Figure 6 ST2 displays distinct correlation profiles with FGL2 and COX7A1 in the adipose tissue of individuals with normal glycemia, prediabetes and T2D/med. (A) Direct correlation between ST2 and FGL2 in the adipose tissue of individuals with normal glycemia (n = 18). (B) Inverse correlation between ST2 and COX7A1 in the adipose tissue of individuals with normal glycemia (n = 18).Abbreviations: ST2, suppression of tumorigenicity 2; FGL2, fibrinogen-like protein 2; COX7A1, cytochrome C oxidase subunit 7A1; NL, normal glycemia; T2D/med, type 2 diabetes managed with glucose-lowering medications. |
Adipose Tissue ST2 Shows Distinct Correlation Profiles with Mitochondrial Protein COX7A1 Depending on the Glycemic Status of the Individuals
We investigated the correlation between ST2 and transcriptional coregulators and mitochondrial proteins (PR domain containing 16 (PRDM16), uncoupling protein 1 (UCP1) and cytochrome C oxidase subunit 7A1 (COX7A1)) in the adipose tissue of individuals with normal glycemia, prediabetes and T2D/med. ST2 was inversely correlated with COX7A1 (but not UCP1 or PRDM16) in the adipose tissue of individuals with normal glycemia (r = −0.54, P = 0.02, n = 18; after adjustment for age (r = −0.55, P = 0.023), gender (r = −0.555, P = 0.021) and BMI (r = −0.535, P = 0.027)) but not in those with prediabetes or T2D/med (Figure 6B; Heat-map shown in Figure 3). Of note, the expression of adipose tissue COX7A1 was significantly (P = 0.046) higher in individuals with prediabetes (median = 2.99, n = 22) compared to those with normal glycemia (median = 2, n = 21) (data not shown). The correlation between COX7A1 and metabolic parameters are shown in Table 4.
Adipose Tissue IL-33 and ST2 Show Distinct Correlation Profiles with MyD88/TRAF6/NF-κB Depending on the Glycemic Status of the Individuals
We assessed the correlation between IL-33 or ST2 and the signaling molecules MyD88, TRAF6, and NF-κB in the adipose tissue of individuals with normal glycemia, prediabetes and T2D/med. In individuals with normal glycemia, IL-33 was directly correlated with TRAF6 (r = 0.63, P = 0.002, n = 21; after adjustment for age (r = 0.67, P = 0.001), gender (r = 0.64, P = 0.003) and BMI (r = 0.65, P = 0.002)) and NF-κB (r = 0.5, P = 0.02, n = 21; after adjustment for age (r = 0.48, P = 0.034), gender (r = 0.48, P = 0.032) and BMI (r = 0.85, P = 0.068)) but not MyD88. Similarly, ST2 was directly correlated with TRAF6 (r = 0.51, P = 0.03, n = 18; after adjustment for age (r = 0.513, P = 0.035), gender (r = 0.5, P = 0.042) and BMI (r = 0.5, P = 0.04)) and NF-κB (r = 0.52, P = 0.03, n = 18; after adjustment for age (r = 0.523, P = 0.031), gender (r = 0.55, P = 0.023) and BMI (r = 0.522, P = 0.032)) but not MyD88. In individuals with prediabetes, IL-33 was directly correlated with MyD88 (r = 0.44, P = 0.036, n = 23; after adjustment for age (r = 0.45, P = 0.037), gender (r = 0.46, P = 0.033) and BMI (r = 0.49, P = 0.022)) and NF-κB (r = 0.43, P = 0.04, n = 23; after adjustment for age (r = 0.46, P = 0.03), gender (r = 0.43, P = 0.045) and BMI (r = 0.475, P = 0.026)) but not TRAF6. No correlation was observed between ST2 and down-stream signaling molecules. In individuals with T2D/med, IL-33 was directly correlated with MyD88 (r = 0.31, P = 0.04, n = 44; after adjustment for age (r = 0.29, P = 0.058), gender (r = 0.32, P = 0.038) and BMI (r = 0.285, P = 0.064)), TRAF6 (r = 0.52, P = 0.0002, n = 47; after adjustment for age (r = 0.48, P = 0.001), gender (r = 0.56, P = 0.000) and BMI (r = 0.532, P = 0.000)) and NF-κB (r = 0.45, P = 0.001, n = 47; after adjustment for age (r = 0.463, P = 0.001), gender (r = 0.483, P = 0.001) and BMI (r = 0.436, P = 0.002)). Similarly, ST2 was directly correlated with MyD88 (r = 0.35, P = 0.02, n = 42; after adjustment for age (r = 0.343, P = 0.028), gender (r = 0.353, P = 0.024) and BMI (r = 0.4, P = 0.01)), TRAF6 (r = 0.38, P = 0.01, n = 43; after adjustment for age (r = 0.36, P = 0.02), gender (r = 0.373, P = 0.015) and BMI (r = 0.38, P = 0.013)) and NF-κB (r = 0.36, P = 0.02, n = 43; after adjustment for age (r = 0.35, P = 0.023), gender (r = 0.352, P = 0.022) and BMI (r = 0.393, P = 0.01)) (Figure 7A–F; Heat-map shown in Figure 3). There was no significant difference in the level of adipose tissue MyD88, TRAF6 or NF-κB between the three groups (data not shown).
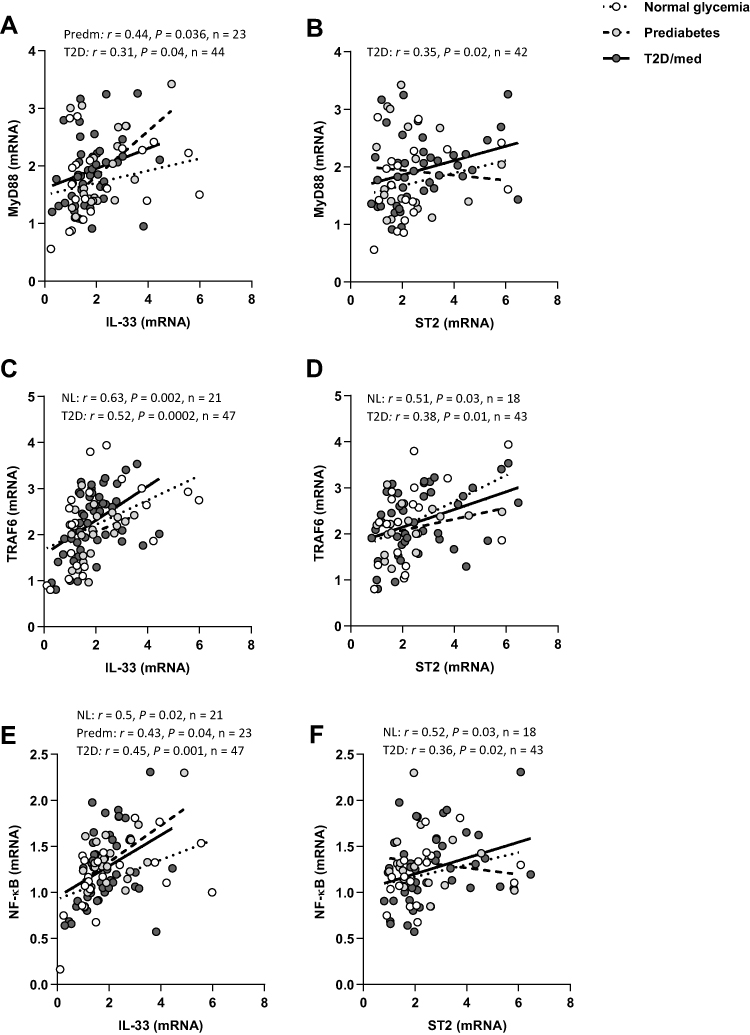 |
Figure 7 IL-33 and ST2 display distinct correlation profiles with MyD88/TRAF6/NF-κB in the adipose tissue of individuals with normal glycemia, prediabetes and T2D/med. (A) Direct correlation between IL-33 and MyD88 in the adipose tissue of individuals with prediabetes (n = 23) and T2D/med (n = 44). (B) Direct correlation between ST2 and MyD88 in the adipose tissue of individuals with T2D/med (n = 42). (C) Direct correlation between IL-33 and TRAF6 in the adipose tissue of individuals with normal glycemia (n = 21) and T2D/med (n = 47). (D) Direct correlation between ST2 and TRAF6 in the adipose tissue of individuals with normal glycemia (n = 18) and T2D/med (n = 43). (E) Direct correlation between IL-33 and NF-κB in the adipose tissue of individuals with normal glycemia (n = 21), prediabetes (n = 23) and T2D/med (n = 47). (F) Direct correlation between ST2 and NF-κB in the adipose tissue of individuals with normal glycemia (n = 18) and T2D/med (n = 43).Abbreviations: IL, interleukin; ST2, suppression of tumorigenicity 2; MyD88, myeloid differentiation primary response 88; TRAF6, tumor necrosis factor receptor -associated factor 6; NF-κB, nuclear factor-kappa B; NL, normal glycemia; Predm, prediabetes; T2D/med, type 2 diabetes managed with glucose-lowering medications. |
Adipose Tissue IL-33 and ST2 Show Distinct Correlation Profiles with IRFs and NFAT5 Depending on the Glycemic Status of the Individuals
We assessed whether IL-33 or ST2 were correlated with interferon regulatory factors (IRF)-3, IRF4 and IRF5, and additionally, nuclear factor of activated T-cells 5 (NFAT5). ST2 was directly correlated with IRF4 (r = 0.6, P = 0.019, n = 15; after adjustment for age (r = 0.6, P = 0.022), gender (r = 0.58, P = 0.03) and BMI (r = 0.61, P = 0.02)) in individuals with normal glycemia but not in those with prediabetes. In individuals with T2D/med, ST2 was directly correlated with IRF5 (r = 0.4, P = 0.008, n = 42; after adjustment for age (r = 0.4, P = 0.009), gender (r = 0.4, P = 0.009) and BMI (r = 0.39, P = 0.011)) (Figure 8A and B; Heat-map shown in Figure 3). Overall, there was no correlation between ST2 and IRF3, and between IL-33 and IRF3, IRF4 or IRF5. When the levels of IRF3, IRF4 and IRF5 were compared between the three groups, it was found that individuals with T2D/med had higher levels (P = 0.05, median = 2.7, n = 42) of IRF3 compared to those with prediabetes (median = 2.3, n = 21); and similarly, had significantly (P = 0.04, median = 2.9, n = 45) higher levels of IRF5 compared to those with prediabetes (median = 2.16, n = 22). Moreover, individuals with T2D/med (median = 4.14, n = 40) had significantly higher levels of IRF4 compared to those with normal glycemia (P = 0.023, median = 2.7, n = 16) and prediabetes (P = 0.021, median = 2.98, n = 21) (data not shown).
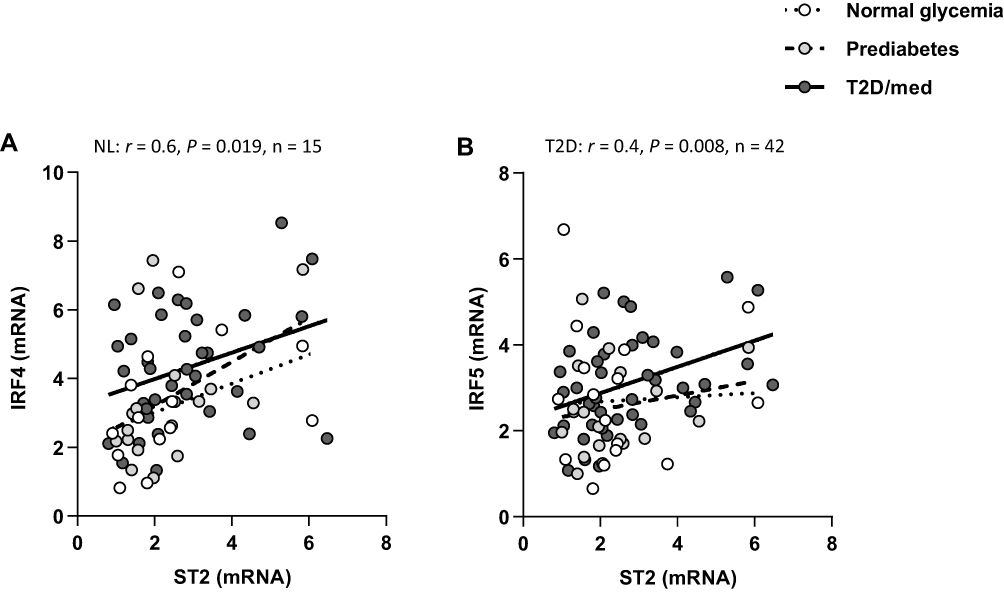 |
Figure 8 ST2 displays distinct correlation profiles with IRFs in the adipose tissue of individuals with normal glycemia, prediabetes and T2D/med. (A) Direct correlation between ST2 and IRF4 in the adipose tissue of individuals with normal glycemia (n = 15). (B) Direct correlation between ST2 and IRF5 in the adipose tissue of individuals with T2D/med (n = 42).Abbreviations: ST2, suppression of tumorigenicity 2; IRF, interferon regulatory factor; NL, normal glycemia; T2D/med, type 2 diabetes managed with glucose-lowering medications. |
Moreover, IL-33 was directly correlated with NFAT5 in individuals with normal glycemia (r = 0.66, P = 0.001, n = 21; after adjustment for age (r = 0.67, P = 0.001), gender (r = 0.655, P = 0.002) and BMI (r = 0.685, P = 0.001)) but not in those with prediabetes or T2D/med. Similarly, ST2 was directly correlated with NFAT5 (r = 0.65, P = 0.003, n = 18; after adjustment for age (r = 0.65, P = 0.005), gender (r = 0.69, P = 0.002) and BMI (r = 0.68, P = 0.003)) in individuals with normal glycemia but not in those with prediabetes or T2D/med (Figure 9A and B; Heat-map shown in Figure 3). There was no difference in the level of NFAT5 between the three groups (data not shown). The correlation between these biomarkers and metabolic parameters are shown in Table 4.
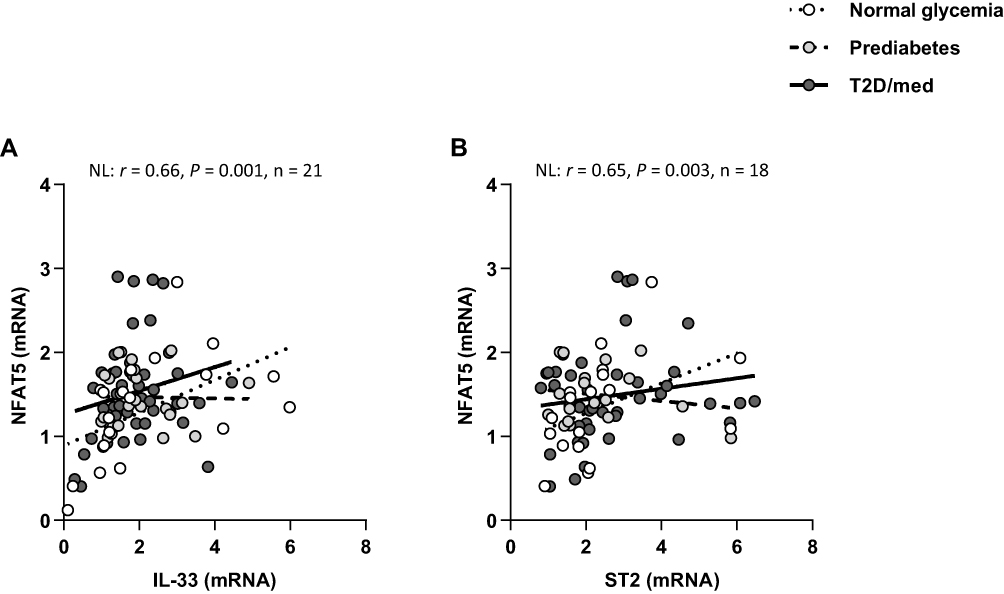 |
Figure 9 IL-33 and ST2 display distinct correlation profiles with NFAT5 in the adipose tissue of individuals with normal glycemia, prediabetes and T2D/med. (A) Direct correlation between IL-33 and NFAT5 in the adipose tissue of individuals with normal glycemia (n = 21). (B) Direct correlation between ST2 and NFAT5 in the adipose tissue of individuals with normal glycemia (n = 18).Abbreviations: ST2, suppression of tumorigenicity 2; IL, interleukin; NFAT5, nuclear factor of activated T-cells 5; NL, normal glycemia; T2D/med, type 2 diabetes managed with glucose-lowering medications. |
Discussion
Previous studies using animal models have demonstrated that the IL-33/ST2 axis is involved in protection against obesity, insulin resistance, and T2D.31,41,42 Recently, we reported that adipose tissue IL-33 displays distinct correlation profiles with HbA1c, ST2 and related immunometabolic biomarkers, depending on whether the participants had normal glycemia, prediabetes or T2D.44 In the present study, we assessed whether ST2 displays distinct correlation profiles with chemokines/cytokines, mitochondrial proteins, and signaling molecules, in the adipose tissue of individuals with normal glycemia, prediabetes and T2D/med.
Chemokines, a family of low molecular weight cytokines, play a key role in the trafficking of leukocytes to areas of inflammation and in leukocyte activation. Generally, the chemokine system functions to maintain homeostasis or to induce inflammation.49 In our study, individuals with T2D/med had significantly higher levels of circulating white blood cells (WBCs) compared to those with normal glycemia. Since there was no difference in the BMI between the groups, this suggests that individuals with T2D have an increased overall inflammatory status regardless of adiposity. Moreover, individuals with T2D/med had higher levels of adipose tissue CCL2 when compared to those with normal glycemia. This is expected since chemokines, particularly CCL2, promote the infiltration of monocytes into the adipose tissue where they differentiate into pro-inflammatory macrophages and promote insulin resistance.50,51
Importantly, ST2 displayed distinct correlation profiles with chemokines in the adipose tissue of individuals with normal glycemia, prediabetes and T2D/med. ST2 was directly correlated with CCL2 and CCL5 in the adipose tissue of individuals with normal glycemia; whereas no such correlation was observed in those with prediabetes. In fact, individuals with prediabetes showed a direct correlation between CCL5 and the BMI, waist circumference, insulin and HOMA-IR. This is not surprising since CCL5 participates in adipose tissue inflammation by recruiting monocytes and exerting anti-apoptotic effects on macrophages,52 which leads to metabolic dysfunction. Interestingly, however, individuals with prediabetes showed an inverse correlation between CCL2 and insulin and TG, and a direct correlation with LDL. In individuals with T2D/med, ST2 was directly correlated with CCL2; a similar finding to that found in individuals with normal glycemia. The direct correlation between ST2 and CCL2 (and CCL5 in individuals with normal glycemia) may suggest an ST2-related protective mechanism in individuals with normal glycemia and T2D/med, with the latter possibly being due to glucose-lowering medications. Since the IL-33/ST2 axis is considered metabolically protective, the observed correlation between ST2 and chemokines in individuals with normal glycemia and T2D/med might be a sign of increased recruitment of anti-inflammatory ST2+ immune cells (mainly Th2 cells, alternatively activated macrophages, and regulatory T-cells), as opposed to pro-inflammatory cells, as an attempt to dampen inflammation.
Adipose tissue expansion and hypertrophic adipocytes leads to the secretion of pro-inflammatory cytokines including IL-6, IL-1β and TNF-α. These cytokines downregulate insulin sensitivity via activation of pro-inflammatory signaling and inhibition of insulin receptor signaling.53 Since ST2 may confer protective metabolic effects, we assessed its correlation with pro-inflammatory cytokines. ST2 was directly correlated with IL-1β, an inflammatory cytokine that was directly correlated with the BMI and waist circumference, in individuals with T2D/med. No such correlation was observed between ST2 and IL-1β, IL-6 or TNF-α in individuals with prediabetes (or normal glycemia).
Studies using animal models suggest that Th1/Tc1 cells are involved in the attraction and differentiation of pro-inflammatory macrophages, while Th2 and Treg cells are protective against adipose tissue inflammation.54–56 We found that ST2 was directly correlated with IL-12 in the adipose tissue of individuals with normal glycemia. This may indicate an increase in the recruitment of ST2+ immune cells in the presence of IL-12. Interestingly, however, ST2 was inversely correlated with IL-5 (a downstream Th2 cytokine of IL-33/ST2 interaction) in individuals with prediabetes. It was previously shown that the IL-33/ST2 axis induces the production of Th2 cytokines, mainly IL-5 and IL-13,57 and is involved in Treg cell responses,58–60 which is protective against metabolic inflammation. Importantly, we previously reported a lack of correlation between ST2 and IL-33 in individuals with prediabetes.44 Taken together, these findings may suggest a dysfunction in the regulatory mechanism of the IL-33/ST2 axis, whereby a lack of concomitant increase in IL-33 and ST2 appears to be associated with a decrease in IL-5. Intriguingly, however, while IL-5 was inversely correlated with fasting glucose, which is in keeping with the protective role of Th2 cytokines,54–56 it was directly correlated with WBCs in these individuals.
In contrast, people with T2D/med showed no correlation between ST2 and IL-5, however, this Th2 cytokine was directly (but weakly) correlated with fasting glucose. Taking into consideration our previous work where we found a direct correlation between IL-33 and ST2 in individuals with T2D/med (which is similar to that found in those with normal glycemia),44 the association between IL-5 and fasting glucose may suggest a protective response. It may also suggest that the observed correlations between IL-5 and fasting glucose is distinct from the IL-33/ST2 axis, at least in individuals with T2D/med. Our previous work showed similar findings with IL-33 whereby no correlation was observed between IL-5 and IL-33 in the adipose tissue of individuals with normal glycemia, prediabetes or T2D/med.44 As a Th2 cytokine, IL-5 is generally regarded as metabolically protective; indeed, IL-5 was inversely correlated with HOMA-IR, TG and WBCs in individuals with normal glycemia. However, adipose tissue IL-5 was also inversely correlated with SLM (%) and directly correlated with body fat (%) in these individuals.
In addition, we assessed whether adipose tissue ST2 was correlated with FGL2, which is a protein that promotes regulatory T cell function, suppresses Th1 cell responses, enhances Th2 skewing, and downregulates antigen presentation.61–65 We found that ST2 was directly correlated with FGL2 in the adipose tissue of individuals with normal glycemia; although FGL2 was not correlated with the BMI, it was inversely correlated with the WHR in these individuals. There was no correlation between ST2 and FGL2 in individuals with prediabetes or T2D/med. However, in individuals with T2D/med, FGL2 was directly correlated with SLM (%) and inversely correlated with body fat (%). Similarly, we previously showed that IL-33 was directly correlated with FGL2 in individuals with normal glycemia and T2D/med but not in those with prediabetes. Overall, FGL2 appears to be metabolically protective in individuals with normal glycemia and T2D/med. These findings may support the notion that the IL-33/ST2 axis promotes immune regulation.44
Subcutaneous white adipose tissue can convert to a brown-like “beige” adipose,66,67 which may facilitate thermogenesis.66,67 Both white and brown adipose tissue contain innate immune cells, including macrophages, eosinophils and ILC2s, which play a role in white adipose browning.68 The transcriptional coregulator PRDM16 and mitochondrial proteins UCP1 and COX7A1 are involved in beiging of adipose tissue.67,69-74 In this study, we found that ST2, although not correlated with UCP1 or PRDM16, was inversely correlated with COX7A1 in individuals with normal glycemia only. When COX7A1 was assessed for correlations with metabolic parameters, none were found in individuals with normal glycemia or prediabetes; however, a direct correlation was observed between COX7A1 and HDL in patients with T2D/med. Interestingly, the expression of adipose tissue COX7A1 was significantly higher in individuals with prediabetes compared to those with normal glycemia. Previous studies have shown that the level of COX7A1 is substantially higher in adipose tissue from mice fed a high fat diet,75 which suggests its association with gluco-metabolic disease. Therefore, the inverse correlation between ST2 and COX7A1 in our study may indicate another mechanism by which ST2 confers protective metabolic effects.
Extracellular mature IL-33 interacts with ST2L forming a complex with the IL-1RAP, which signals via the MyD88/TRAF6 intracellular signaling pathway. This leads to activation of MAPK/AP1 or NF-κB transcription factors.38,39 Here, we found that both IL-33 and ST2 were directly correlated with downstream signaling molecules TRAF6 and NF-κB but not MyD88 in individuals with normal glycemia; interestingly, MyD88 was inversely correlated with HbA1c in these individuals. In contrast, in individuals with prediabetes, IL-33 was directly correlated with MyD88 and NF- κB but not TRAF6, and importantly, no correlation was observed between ST2 and any of the signalling molecules; moreover, TRAF6 was inversely correlated with WHR, waist circumference and insulin, while NF-κB was directly correlated with HbA1c in these individuals. In individuals with T2D/med, both IL-33 and ST2 were directly correlated with TRAF6, NF-κB and MyD88; in addition, TRAF6 and NF-κB were both inversely correlated with body fat (%) and directly correlated with SLM (%), while TRAF6 was inversely correlated with HbA1c in these individuals.
Our data suggest that IL-33 correlation with MyD88 is restricted to individuals with prediabetes and T2D/med, and that in the latter, ST2 is additionally correlated with MyD88. Previous studies have shown that the binding of IL-33 to membrane ST2L can lead to its internalization with the receptor.76,77 Given that related receptors such as toll-like receptor 4 (TLR4) can signal via a MyD88-dependent or independent pathway,78 it may be possible to hypothesize that, in the setting of normal glycemia, adipose tissue IL-33 may induce ST2 internalization in response to TLR4 activation, which may cause a switch to the MyD88-independent pathway. This may explain the lack of correlation between IL-33 (as well as ST2) and MyD88 in individuals with normal glycemia but not in those with metabolic disease. Therefore, our findings suggest that ST2 may signal via a MyD88-independent pathway leading to TRAF6/NF-κB activation and/or resolution of inflammation in individuals with normal glycemia, and its possible restoration (at least partially) with glucose-lowering medications in individuals with T2D/med. Moreover, intracellular IL-33 may associate with a critical cofactor in the nucleus forming a complex, which may then interact with a network of transcriptional regulators promoting the activity of NF-κB and its induction of genes.
In our previous work, we found a direct correlation between IL-33 and ST2 in individuals with normal glycemia and T2D/med but not in those with prediabetes.44 The direct correlation between IL-33 and ST2 may reflect a positive feedback loop in which enhanced expression of IL-33 induces a concomitant increase in ST2 expression,44 which in turn acts as a negative regulator of the MyD88-dependent TLR4 signaling pathway leading to a MyD88-independent pathway. Therefore, it may be possible that ST2, acting as a negative regulator of TLR4 signaling, may promote a MyD88-independent pathway. Individuals with T2D/med showed a similar profile to those with normal glycemia (except for MyD88), which may be explained by the fact that these patients were on glucose-lowering medications which may have partially restored the IL-33/ST2 regulatory function in the adipose tissue. In individuals with prediabetes, the lack of correlation between ST2 and MyD88/TRAF6/NF-κB shown in this study, taken together with our previous work showing a lack of a correlation between ST2 and IL-33,44 may suggest a dysfunction in the IL-33/ST2 signaling pathway. Additionally, we hypothesize that ST2, in the absence of a positive feedback loop with IL-33, may prove to be pro-inflammatory, and that IL-33 may regulate ST2 expression.
IRFs are key transcription factors involved in the innate immune response and other physiological functions.79–81 Here, we assessed whether IL-33 and ST2 display distinct correlation profiles with IRFs in the adipose tissue of individuals with normal glycemia, prediabetes and T2D/med. ST2 was directly correlated with IRF4 in individuals with normal glycemia and with IRF5 in individuals with T2D/med. IRF4 has been shown to inhibit IRF5 activity by competing with IRF5 for its interaction with MyD88.82 In this study, a correlation was found between ST2 and MyD88, however, this correlation was limited to individuals with T2D/med. Therefore, ST2 signaling may activate IRF4 via a MyD88-independent pathway in the normal state, leading to inhibition of IRF5 activity and thus minimizing inflammatory responses. The correlation between ST2 and MyD88 and IRF5 in individuals with T2D/med but not in those with prediabetes may suggest a pathway that occurs specifically in established T2D, or some other un-known effect of glucose-lowering medications. When IRFs were assessed for correlations with metabolic parameters, IRF4 and IRF5 were found to be directly correlated with body fat (%) and inversely correlated with SLM (%) in individuals with prediabetes. In patients with T2D/med, IRF4 was directly correlated with WBCs, while IRF5 was directly correlated with waist circumference.
Previous studies have demonstrated that an extensive metabolic remodeling of white adipose tissue precedes the infiltration of inflammatory cells as well as the overt decrease in mitochondrial abundance. These metabolic changes in adipocytes involves alterations in glucose and lipid pathways, which promote fat storage and prevent excessive lipid oxidation, and are also associated with osmotic stress and adipocyte inflammation.75 The transcription factor NFAT5, which is expressed by almost all cells, is activated in response to osmotic stress83 and regulates the expression of osmoprotective genes.84 In this study, we assessed whether IL-33 and ST2 were correlated with NFAT5 in the adipose tissue. Our data showed that both IL-33 and ST2 were directly correlated with NFAT5 in the adipose tissue of individuals with normal glycemia but not in those with prediabetes or T2D/med. Interestingly, NFAT5 was inversely correlated with body fat (%) and directly correlated with SLM (%) in individuals with T2D/med.
NFAT5 has a highly conserved nuclear localization signal sequence motif which plays an important role in nuclear translocation. When cytosolic NFAT5 is activated by osmotic stress, it translocates to the nuclei where it regulates osmoprotective and inflammatory genes such as CCL2 and TNF-α.85 Indeed, NFAT5 has been shown to bind to TNF-α and lymphotoxin-β promoter, suggesting that NFAT5 plays other roles in immune cells, especially T-cells.86 In our study, since the observed correlation between NFAT5 and IL-33/ST2 was restricted to individuals with normal glycemia, it may be possible to hypothesize that in the presence of osmotic stress (being an early metabolic derangement in adipocytes), NFAT5 activation may regulate genes involved in the IL-33/ST2 axis leading to favorable metabolic outcome. Depending on partner proteins, NFATs can either enhance immune responses or induce immune tolerance.87 As NFATs are involved in diverse molecular interactions, they are tightly regulated by post-translational modifications in the normal state.88 In response to osmotic stress, NFAT5 is activated by p38/MAPK signaling and regulates the expression of osmoprotective genes required for normal function.84 In addition, since NFAT5 is expressed by activated T-cells,83 it may be possible that NFAT5 upregulates gene transcription of IL-33 during T cell activation. Indeed, a previous study had identified two regulatory regions upstream of the IL-33 transcription site that contain NFAT binding sites, and it is thought that IL-33, in addition to having dual functions (extracellular and intranuclear), possesses dual pathways that regulate its expression.89 In addition, it may be possible that NFAT5 has some other function that is independent of osmostress.90 Future studies are required to investigate the relationship between NFAT5 and the IL-33/ST2 axis in the context of obesity and T2D.
Conclusion
Adipose tissue ST2 and IL-33 show distinct correlation profiles with various immunometabolic biomarkers depending on the metabolic state of the individuals. Therefore, the IL-33/ST2 axis may play a regulatory role in adipose tissue inflammation. Importantly, a dysfunction in the regulatory mechanism of the IL-33/ST2 axis may lead to metabolic disorders, which might be partially restored by glucose-lowering medications. Our observations have important implications for understanding the immunometabolic effects of the IL-33/ST2 axis and suggest that targeting this axis could form the basis for novel therapies to combat metabolic disorders.
Study Limitations
This study has some limitations; firstly, the study was a single center study with a small sample size, thereby increasing the margin of error; secondly, the group with T2D included individuals along a wide range of spectrum with regards to several factors; these include duration and type of T2D (eg obesity-associated versus older age onset), type and dosage of glucose-lowering medications, different medications taken for comorbid health conditions, duration of medication treatments, and the level of glycemic control. With regards to the latter, some patients with T2D/med did not have adequate glycemic control, which may have affected the data. Therefore, a much larger multi-center study is required to confirm these findings and to directly evaluate the effect of medications.
Acknowledgments
This work was conducted on a sample of participants that were recruited as part of the Adult Obesity Program (grant number RA 2010-0003). The program was financially supported by the Kuwait Foundation for the Advancement of Sciences. We thank the staff from Clinical Services, Clinical Laboratory Department, Medical Fitness Center, and the National Dasman Diabetes BioBank for their support. We also acknowledge Ms. Samia Warsame for her involvement in the recruitment of participants and data entry. We thank all individuals who participated in the study.
Disclosure
The authors report no potential conflicts of interest in this work.
References
1. Lohning M, Grogan JL, Coyle AJ, et al. T1/ST2 expression is enhanced on CD4+ T cells from schistosome egg-induced granulomas: analysis of Th cell cytokine coexpression ex vivo. J Immunol. 1999;162:3882–3889.
2. Hayakawa H, Hayakawa M, Kume A, Tominaga S. Soluble ST2 blocks interleukin-33 signaling in allergic airway inflammation. J Biol Chem. 2007;282:26369–26380. doi:10.1074/jbc.M704916200
3. Mun SH, Ko NY, Kim HS, et al. Interleukin-33 stimulates formation of functional osteoclasts from human CD14(+) monocytes. Cell Mol Life Sci. 2010;67:3883–3892. doi:10.1007/s00018-010-0410-y
4. Kurowska-Stolarska M, Stolarski B, Kewin P, et al. IL-33 amplifies the polarization of alternatively activated macrophages that contribute to airway inflammation. J Immunol. 2009;183:6469–6477. doi:10.4049/jimmunol.0901575
5. Joshi AD, Oak SR, Hartigan AJ, et al. Interleukin-33 contributes to both M1 and M2 chemokine marker expression in human macrophages. BMC Immunol. 2010;11:52. doi:10.1186/1471-2172-11-52
6. Neill DR, Wong SH, Bellosi A, et al. Nuocytes represent a new innate effector leukocyte that mediates type-2 immunity. Nature. 2010;464:1367–1370. doi:10.1038/nature08900
7. Moro K, Yamada T, Tanabe M, et al. Innate production of T(H)2 cytokines by adipose tissue-associated c-Kit(+)Sca-1(+) lymphoid cells. Nature. 2010;463:540–544. doi:10.1038/nature08636
8. Rank MA, Kobayashi T, Kozaki H, Bartemes KR, Squillace DL, Kita H. IL-33-activated dendritic cells induce an atypical TH2-type response. J Allergy Clin Immunol. 2009;123:1047–1054. doi:10.1016/j.jaci.2009.02.026
9. Turnquist HR, Sumpter TL, Tsung A, et al. IL-1β-driven ST2L expression promotes maturation resistance in rapamycin-conditioned dendritic cells. J Immunol. 2008;181:62–72. doi:10.4049/jimmunol.181.1.62
10. Xu K, Williams RM, Holowka D, Baird B. Stimulated release of fluorescently labeled IgE fragments that efficiently accumulate in secretory granules after endocytosis in RBL-2H3 mast cells. J Cell Sci. 1998;111(Pt 16):2385–2396.
11. Lohning M, Stroehmann A, Coyle AJ, et al. T1/ST2 is preferentially expressed on murine Th2 cells, independent of interleukin 4, interleukin 5, and interleukin 10, and important for Th2 effector function. Proc Natl Acad Sci U S A. 1998;95:6930–6935. doi:10.1073/pnas.95.12.6930
12. Schmitz J, Owyang A, Oldham E, et al. IL-33, an Interleukin-1-like cytokine that signals via the IL-1 receptor-related protein ST2 and induces T helper type 2-associated cytokines. Immunity. 2005;23:479–490
13. Smithgall MD, Comeau MR, Yoon BR, Kaufman D, Armitage R, Smith DE. IL-33 amplifies both Th1- and Th2-type responses through its activity on human basophils, allergen-reactive Th2 cells, iNKT and NK cells. Int Immunol. 2008;20:1019–1030. doi:10.1093/intimm/dxn060
14. Suzukawa M, Iikura M, Koketsu R, et al. An IL-1 cytokine member, IL-33, induces human basophil activation via its ST2 receptor. J Immunol. 2008;181:5981–5989. doi:10.4049/jimmunol.181.9.5981
15. Suzukawa M, Koketsu R, Iikura M, et al. Interleukin-33 enhances adhesion, CD11b expression and survival in human eosinophils. Lab Invest. 2008;88:1245–1253. doi:10.1038/labinvest.2008.82
16. Alves-Filho JC, Sonego F, Souto FO, et al. Interleukin-33 attenuates sepsis by enhancing neutrophil influx to the site of infection. Nat Med. 2010;16:708–712. doi:10.1038/nm.2156
17. Komai-Koma M, Gilchrist DS, McKenzie AN, Goodyear CS, Xu D, Liew FY. IL-33 activates B1 cells and exacerbates contact sensitivity. J Immunol. 2011;186:2584–2591. doi:10.4049/jimmunol.1002103
18. Bourgeois E, Van LP, Samson M, et al. The pro-Th2 cytokine IL-33 directly interacts with invariant NKT and NK cells to induce IFN-gamma production. Eur J Immunol. 2009;39:1046–1055. doi:10.1002/eji.200838575
19. Trajkovic V, Sweet MJ, Xu D. T1/ST2–an IL-1 receptor-like modulator of immune responses. Cytokine Growth Factor Rev. 2004;15:87–95. doi:10.1016/j.cytogfr.2004.02.004
20. Zhang J, Ramadan AM, Griesenauer B, et al. ST2 blockade reduces sST2-producing T cells while maintaining protective mST2-expressing T cells during graft-versus-host disease. Sci Transl Med. 2015;7:308ra160. doi:10.1126/scitranslmed.aab0166
21. Xu D, Chan WL, Leung BP, et al. Selective expression of a stable cell surface molecule on type 2 but not type 1 helper T cells. J Exp Med. 1998;187:787–794. doi:10.1084/jem.187.5.787
22. Yang Q, Li G, Zhu Y, et al. IL-33 synergizes with TCR and IL-12 signaling to promote the effector function of CD8+ T cells. Eur J Immunol. 2011;41:3351–3360. doi:10.1002/eji.201141629
23. Bonilla WV, Frohlich A, Senn K, et al. The alarmin interleukin-33 drives protective antiviral CD8(+) T cell responses. Science. 2012;335:984–989. doi:10.1126/science.1215418
24. Schiering C, Krausgruber T, Chomka A, et al. The alarmin IL-33 promotes regulatory T-cell function in the intestine. Nature. 2014;513:564–568. doi:10.1038/nature13577
25. Matta BM, Reichenbach DK, Zhang X, et al. Peri-alloHCT IL-33 administration expands recipient T-regulatory cells that protect mice against acute GVHD. Blood. 2016;128:427–439. doi:10.1182/blood-2015-12-684142
26. Blom L, Poulsen BC, Jensen BM, Hansen A, Poulsen LK. IL-33 induces IL-9 production in human CD4+ T cells and basophils. PLoS One. 2011;6:e21695. doi:10.1371/journal.pone.0021695
27. Gerlach K, Hwang Y, Nikolaev A, et al. TH9 cells that express the transcription factor PU.1 drive T cell-mediated colitis via IL-9 receptor signaling in intestinal epithelial cells. Nat Immunol. 2014;15:676–686. doi:10.1038/ni.2920
28. Li D, Guabiraba R, Besnard AG, et al. IL-33 promotes ST2-dependent lung fibrosis by the induction of alternatively activated macrophages and innate lymphoid cells in mice. J Allergy Clin Immunol. 2014;134:1422–1432. doi:10.1016/j.jaci.2014.05.011
29. Carriere V, Roussel L, Ortega N, et al. IL-33, the IL-1-like cytokine ligand for ST2 receptor, is a chromatin-associated nuclear factor in vivo. Proc Natl Acad Sci U S A. 2007;104:282–287. doi:10.1073/pnas.0606854104
30. Moussion C, Ortega N, Girard JP. The IL-1-like cytokine IL-33 is constitutively expressed in the nucleus of endothelial cells and epithelial cells in vivo: a novel ‘alarmin’? PLoS One. 2008;3:e3331. doi:10.1371/journal.pone.0003331
31. Miller AM, Asquith DL, Hueber AJ, et al. Interleukin-33 induces protective effects in adipose tissue inflammation during obesity in mice. Circ Res. 2010;107:650–658. doi:10.1161/CIRCRESAHA.110.218867
32. Nile CJ, Barksby E, Jitprasertwong P, Preshaw PM, Taylor JJ. Expression and regulation of interleukin-33 in human monocytes. Immunology. 2010;130:172–180. doi:10.1111/j.1365-2567.2009.03221.x
33. Talabot-Ayer D, Lamacchia C, Gabay C, Palmer G. Interleukin-33 is biologically active independently of caspase-1 cleavage. J Biol Chem. 2009;284:19420–19426. doi:10.1074/jbc.M901744200
34. Ohno T, Oboki K, Kajiwara N, et al. Caspase-1, caspase-8, and calpain are dispensable for IL-33 release by macrophages. J Immunol. 2009;183:7890–7897. doi:10.4049/jimmunol.0802449
35. Anthony RM, Kobayashi T, Wermeling F, Ravetch JV. Intravenous gammaglobulin suppresses inflammation through a novel T(H)2 pathway. Nature. 2011;475:110–113. doi:10.1038/nature10134
36. Yanagawa Y, Suzuki M, Matsumoto M, Togashi H. Prostaglandin E(2) enhances IL-33 production by dendritic cells. Immunol Lett. 2011;141:55–60. doi:10.1016/j.imlet.2011.07.005
37. Drake LY, Kita H. IL-33: biological properties, functions, and roles in airway disease. Immunol Rev. 2017;278:173–184. doi:10.1111/imr.12552
38. Lee JS, Seppanen E, Patel J, Rodero MP, Khosrotehrani K. ST2 receptor invalidation maintains wound inflammation, delays healing and increases fibrosis. Exp Dermatol. 2016;25:71–74. doi:10.1111/exd.12833
39. Liew FY, Girard JP, Turnquist HR. Interleukin-33 in health and disease. Nat Rev Immunol. 2016;16:676–689. doi:10.1038/nri.2016.95
40. Liu X, Xiao Y, Pan Y, Li H, Zheng SG, Su W. The role of the IL-33/ST2 axis in autoimmune disorders: friend or foe? Cytokine Growth Factor Rev. 2019;50:60–74. doi:10.1016/j.cytogfr.2019.04.004
41. Miller AM, Liew FY. The IL-33/ST2 pathway–A new therapeutic target in cardiovascular disease. Pharmacol Ther. 2011;131:179–186. doi:10.1016/j.pharmthera.2011.02.005
42. Miller AM, Xu D, Asquith DL, et al. IL-33 reduces the development of atherosclerosis. J Exp Med. 2008;205:339–346. doi:10.1084/jem.20071868
43. Hasan A, Al-Ghimlas F, Warsame S, et al. IL-33 is negatively associated with the BMI and confers a protective lipid/metabolic profile in non-diabetic but not diabetic subjects. BMC Immunol. 2014;15:19. doi:10.1186/1471-2172-15-19
44. A KS H, Al-Ozairi E, Tuomilehto J, Ahmad R. Association between adipose tissue interleukin-33 and immunometabolic markers in individuals with varying degrees of glycemia. Dis Markers. 2019.
45. Marathe PH, Gao HX, Close KL. American diabetes association standards of medical care in diabetes 2017. J Diabetes. 2017;9:320–324. doi:10.1111/1753-0407.12524
46. American diabetes association. Diagnosis and classification of diabetes mellitus. Diabetes Care. 2014;37:S81–S90. doi:10.2337/dc14-S081
47. Gillett MJ. International expert committee report on the role of the A1c assay in the diagnosis of diabetes: diabetes care 2009; 32(7):1327–1334. Clin Biochem Rev. 2009;30:197–200.
48. Ahmad R, Shihab PK, Thomas R, et al. Increased expression of the interleukin-1 receptor-associated kinase (IRAK)-1 is associated with adipose tissue inflammatory state in obesity. Diabetol Metab Syndr. 2015;7:71. doi:10.1186/s13098-015-0067-7
49. Tourniaire F, Romier-Crouzet B, Lee JH, et al. Chemokine expression in inflamed adipose tissue is mainly mediated by NF-κB. PLoS One. 2013;8:e66515. doi:10.1371/journal.pone.0066515
50. Weisberg SP, Hunter D, Huber R, et al. CCR2 modulates inflammatory and metabolic effects of high-fat feeding. J Clin Invest. 2006;116:115–124. doi:10.1172/JCI24335
51. Kanda H, Tateya S, Tamori Y, et al. MCP-1 contributes to macrophage infiltration into adipose tissue, insulin resistance, and hepatic steatosis in obesity. J Clin Invest. 2006;116:1494–1505. doi:10.1172/JCI26498
52. Keophiphath M, Rouault C, Divoux A, Clement K, Lacasa D. CCL5 promotes macrophage recruitment and survival in human adipose tissue. Arterioscler Thromb Vasc Biol. 2010;30:39–45. doi:10.1161/ATVBAHA.109.197442
53. Ferrante AW. Macrophages, fat, and the emergence of immunometabolism. J Clin Invest. 2013;123:4992–4993. doi:10.1172/JCI73658
54. Feuerer M, Herrero L, Cipolletta D, et al. Lean, but not obese, fat is enriched for a unique population of regulatory T cells that affect metabolic parameters. Nat Med. 2009;15:930–939. doi:10.1038/nm.2002
55. Nishimura S, Manabe I, Nagasaki M, et al. CD8+ effector T cells contribute to macrophage recruitment and adipose tissue inflammation in obesity. Nat Med. 2009;15:914–920. doi:10.1038/nm.1964
56. Winer S, Chan Y, Paltser G, et al. Normalization of obesity-associated insulin resistance through immunotherapy. Nat Med. 2009;15:921–929. doi:10.1038/nm.2001
57. Schmitz J, Owyang A, Oldham E, et al. IL-33, an interleukin-1-like cytokine that signals via the IL-1 receptor-related protein ST2 and induces T helper type 2-associated cytokines. Immunity. 2005;23:479–490
58. Li M, Li Y, Liu X, Gao X, Wang Y. IL-33 blockade suppresses the development of experimental autoimmune encephalomyelitis in C57BL/6 mice. J Neuroimmunol. 2012;247:25–31. doi:10.1016/j.jneuroim.2012.03.016
59. Jiang HR, Milovanovic M, Allan D, et al. IL-33 attenuates EAE by suppressing IL-17 and IFN-γ production and inducing alternatively activated macrophages. Eur J Immunol. 2012;42:1804–1814. doi:10.1002/eji.201141947
60. Matta BM, Lott JM, Mathews LR, et al. IL-33 is an unconventional Alarmin that stimulates IL-2 secretion by dendritic cells to selectively expand IL-33R/ST2+ regulatory T cells. J Immunol. 2014;193:4010–4020. doi:10.4049/jimmunol.1400481
61. Chan CW, Kay LS, Khadaroo RG, et al. Soluble fibrinogen-like protein 2/fibroleukin exhibits immunosuppressive properties: suppressing T cell proliferation and inhibiting maturation of bone marrow-derived dendritic cells. J Immunol. 2003;170:4036–4044. doi:10.4049/jimmunol.170.8.4036
62. Shalev I, Wong KM, Foerster K, et al. The novel CD4+CD25+ regulatory T cell effector molecule fibrinogen-like protein 2 contributes to the outcome of murine fulminant viral hepatitis. Hepatology. 2009;49:387–397. doi:10.1002/hep.22684
63. Foerster K, Helmy A, Zhu Y, et al. The novel immunoregulatory molecule FGL2: a potential biomarker for severity of chronic hepatitis C virus infection. J Hepatol. 2010;53:608–615.
64. Zhao Z, Yang C, Wang L, et al. The regulatory T cell effector soluble fibrinogen-like protein 2 induces tubular epithelial cell apoptosis in renal transplantation. Exp Biol Med. 2014;239:193–201.
65. Shalev I, Liu H, Koscik C, et al. Targeted deletion of fgl2 leads to impaired regulatory T cell activity and development of autoimmune glomerulonephritis. J Immunol. 2008;180:249–260. doi:10.4049/jimmunol.180.1.249
66. Bartelt A, Heeren J. Adipose tissue browning and metabolic health. Nat Rev Endocrinol. 2014;10:24–36. doi:10.1038/nrendo.2013.204
67. Harms M, Seale P. Brown and beige fat: development, function and therapeutic potential. Nat Med. 2013;19:1252–1263. doi:10.1038/nm.3361
68. Brestoff JR, Kim BS, Saenz SA, et al. Group 2 innate lymphoid cells promote beiging of white adipose tissue and limit obesity. Nature. 2015;519:242–246. doi:10.1038/nature14115
69. Frontini A, Cinti S. Distribution and development of brown adipocytes in the murine and human adipose organ. Cell Metab. 2010;11:253–256. doi:10.1016/j.cmet.2010.03.004
70. Seale P, Bjork B, Yang W, et al. PRDM16 controls a brown fat/skeletal muscle switch. Nature. 2008;454:961–967. doi:10.1038/nature07182
71. Seale P, Kajimura S, Yang W, et al. Transcriptional control of brown fat determination by PRDM16. Cell Metab. 2007;6:38–54. doi:10.1016/j.cmet.2007.06.001
72. Kajimura S, Seale P, Tomaru T, et al. Regulation of the brown and white fat gene programs through a PRDM16/CtBP transcriptional complex. Genes Dev. 2008;22:1397–1409. doi:10.1101/gad.1666108
73. Kajimura S, Seale P, Kubota K, et al. Initiation of myoblast to brown fat switch by a PRDM16–C/EBP-β transcriptional complex. Nature. 2009;460:1154–1158. doi:10.1038/nature08262
74. Christian M, Parker MG. The engineering of brown fat. J Mol Cell Biol. 2010;2:23–25. doi:10.1093/jmcb/mjp035
75. Cummins TD, Holden CR, Sansbury BE, et al. Metabolic remodeling of white adipose tissue in obesity. Am J Physiol Endocrinol Metab. 2014;307:E262–77. doi:10.1152/ajpendo.00271.2013
76. Palmer G, Lipsky BP, Smithgall MD, et al. The IL-1 receptor accessory protein (AcP) is required for IL-33 signaling and soluble AcP enhances the ability of soluble ST2 to inhibit IL-33. Cytokine. 2008;42:358–364. doi:10.1016/j.cyto.2008.03.008
77. Zhao J, Wei J, Bowser RK, Traister RS, Fan MH, Zhao Y. Focal adhesion kinase-mediated activation of glycogen synthase kinase 3beta regulates IL-33 receptor internalization and IL-33 signaling. J Immunol. 2015;194:795–802. doi:10.4049/jimmunol.1401414
78. Yamamoto M, Sato S, Hemmi H, et al. Role of adaptor TRIF in the MyD88-independent toll-like receptor signaling pathway. Science. 2003;301:640–643. doi:10.1126/science.1087262
79. Honda K, Taniguchi T. IRFs: master regulators of signalling by Toll-like receptors and cytosolic pattern-recognition receptors. Nat Rev Immunol. 2006;6:644–658. doi:10.1038/nri1900
80. Paun A, Pitha PM. The IRF family, revisited. Biochimie. 2007;89:744–753. doi:10.1016/j.biochi.2007.01.014
81. Tamura T, Yanai H, Savitsky D, Taniguchi T. The IRF family transcription factors in immunity and oncogenesis. Annu Rev Immunol. 2008;26:535–584. doi:10.1146/annurev.immunol.26.021607.090400
82. Negishi H, Ohba Y, Yanai H, et al. Negative regulation of Toll-like-receptor signaling by IRF-4. Proc Natl Acad Sci U S A. 2005;102:15989–15994. doi:10.1073/pnas.0508327102
83. Trama J, Lu Q, Hawley RG, Ho SN. The NFAT-related protein NFATL1 (TonEBP/NFAT5) is induced upon T cell activation in a calcineurin-dependent manner. J Immunol. 2000;165:4884–4894. doi:10.4049/jimmunol.165.9.4884
84. Burg MB, Kwon ED, Kultz D. Regulation of gene expression by hypertonicity. Annu Rev Physiol. 1997;59:437–455. doi:10.1146/annurev.physiol.59.1.437
85. Romeo GR, Lee J, Shoelson SE. Metabolic syndrome, insulin resistance, and roles of inflammation–mechanisms and therapeutic targets. Arterioscler Thromb Vasc Biol. 2012;32:1771–1776. doi:10.1161/ATVBAHA.111.241869
86. Lopez-Rodriguez C, Aramburu J, Jin L, Rakeman AS, Michino M, Rao A. Bridging the NFAT and NF-kappaB families: NFAT5 dimerization regulates cytokine gene transcription in response to osmotic stress. Immunity. 2001;15:47–58.
87. Macian F, Lopez-Rodriguez C, Rao A. Partners in transcription: NFAT and AP-1. Oncogene. 2001;20:2476–2489. doi:10.1038/sj.onc.1204386
88. Macian F. NFAT proteins: key regulators of T-cell development and function. Nat Rev Immunol. 2005;5:472–484. doi:10.1038/nri1632
89. Hsu CL, Bryce PJ. Inducible IL-33 expression by mast cells is regulated by a calcium-dependent pathway. J Immunol. 2012;189:3421–3429. doi:10.4049/jimmunol.1201224
90. Berga-Bolanos R, Alberdi M, Buxade M, Aramburu J, Lopez-Rodriguez C. NFAT5 induction by the pre-T-cell receptor serves as a selective survival signal in T-lymphocyte development. Proc Natl Acad Sci U S A. 2013;110:16091–16096. doi:10.1073/pnas.1215934110
 © 2020 The Author(s). This work is published and licensed by Dove Medical Press Limited. The
full terms of this license are available at https://www.dovepress.com/terms
and incorporate the Creative Commons Attribution
- Non Commercial (unported, 3.0) License.
By accessing the work you hereby accept the Terms. Non-commercial uses of the work are permitted
without any further permission from Dove Medical Press Limited, provided the work is properly
attributed. For permission for commercial use of this work, please see paragraphs 4.2 and 5 of our Terms.
© 2020 The Author(s). This work is published and licensed by Dove Medical Press Limited. The
full terms of this license are available at https://www.dovepress.com/terms
and incorporate the Creative Commons Attribution
- Non Commercial (unported, 3.0) License.
By accessing the work you hereby accept the Terms. Non-commercial uses of the work are permitted
without any further permission from Dove Medical Press Limited, provided the work is properly
attributed. For permission for commercial use of this work, please see paragraphs 4.2 and 5 of our Terms.