Back to Journals » Diabetes, Metabolic Syndrome and Obesity » Volume 16
Correlation Between the Variability of Different Obesity Indices and Diabetic Kidney Disease: A Retrospective Cohort Study Based on Populations in Taiwan
Authors Sun Z ![]() , Wang K, Yun C, Bai F, Yuan X, Lee Y, Lou Q
, Wang K, Yun C, Bai F, Yuan X, Lee Y, Lou Q ![]()
Received 9 June 2023
Accepted for publication 31 August 2023
Published 12 September 2023 Volume 2023:16 Pages 2791—2802
DOI https://doi.org/10.2147/DMSO.S425198
Checked for plagiarism Yes
Review by Single anonymous peer review
Peer reviewer comments 3
Editor who approved publication: Professor Gian Paolo Fadini
Zhenzhen Sun,1,* Kun Wang,1,* Chuan Yun,1 Fang Bai,1 Xiaodan Yuan,2 Yaujiunn Lee,3 Qingqing Lou1
1The First Affiliated Hospital of Hainan Medical University, Hainan Clinical Research Center for Metabolic Disease, Haikou, Hainan, People’s Republic of China; 2Affiliated Hospital of Integrated Traditional Chinese and Western Medicine, Nanjing University of Chinese Medicine, Nanjing, Jiangsu, People’s Republic of China; 3Department of Endocrinology, Lee’s Clinic, Pingtung City, Pingtung County, Taiwan
*These authors contributed equally to this work
Correspondence: Qingqing Lou, The First Affiliated Hospital of Hainan Medical University, Hainan Clinical Research Center for Metabolic Disease, No. 31, Longhua Road, Haikou, 570102, Hainan, People’s Republic of China, Tel +86 15312019129, Email [email protected]
Purpose: To investigate the association of five obesity indices and the variability of these indices with diabetic kidney disease (DKD) in patients with type 2 diabetes and compare the predictive validity of these markers for the risk of DKD in this large longitudinal cohort study.
Patients and Methods: A total of 2659 patients with type 2 diabetes who did not have DKD were enrolled between 2006 and 2019 at Lee’s United Clinic in Taiwan. Data were collected for each subject, including demographic data, personal medical history, clinical parameters and calculated Body mass index (BMI), visceral adiposity index (VAI), lipid accumulation product (LAP), body roundness index (BRI) and variability of five obesity indices. Cox regression analysis was performed to determine the relationship between different obesity indicators and DKD risk. Cox’s proportional hazards model was evaluated the predictive effect of obesity indices on DKD.
Results: The risk of developing DKD increased with an increase in the BRI, LAP, VAI, WC and BMI (all P trend< 0.05), and the variability of VAI was significantly associated with DKD [HR=1.132, 95% CI (1.001, 1.281)] after adjusting for corresponding variables. BRI had the strongest predictive effect on DKD. BRI had the best predictive performance, with AUC of 0.807, 0.663 and 0.673 at 1, 3 and 5 years, respectively. Cox regression analysis of risk factors for DKD in patients stratified by BRI quartiles showed that patients in the Q4 group had the highest risk of developing DKD [HR=1.356, 95% CI (1.131, 1.626)].
Conclusion: BMI, WC, VAI, LAP, BRI and VAI variability were associated with a significant increase in the risk of DKD events, and BRI was superior and alternative obesity index for predicting DKD.
Keywords: visceral adiposity index, lipid accumulation product, body roundness index, diabetic kidney disease
Introduction
Diabetic kidney disease (DKD) is one of the diabetic chronic microvascular complications which may eventually lead to end-stage renal disease (ESRD) and all-cause mortality.1 The classical presentation of DKD is characterized by hyperfiltration and albuminuria in the early stages, followed by progressive decline in renal function.2 The number of people with DKD has been steadily increasing in recent years, with the prevalence of DKD in mainland China ranging from 29.6% to 49.6%,3 and has become a heavy economic and social burden due to its high prevalence and morbidity. Increasing evidence expressed that obesity has become an independent risk factor for DKD,4–6 which will increase the risk of ESRD. However, it is still unclear which obesity index is more suitable for predicting the risk of DKD in patients with type 2 diabetes.
Body mass index (BMI) and waist circumference (WC) are commonly used indicators of obesity, and their predictive values on DKD have been confirmed.6–8 However, these traditional indicators do not distinguish between visceral and subcutaneous adipose tissue.9 Studies have shown that evaluation of visceral adipose tissue is critical in determining the risk of developing type 2 diabetes.10 The methods to detect visceral adipose tissue include computed tomography (CT), and magnetic resonance imaging (MRI),11 which can distinguish between various types of body fat distribution, particularly subcutaneous and visceral adipose tissue. However, they are not practical for routine clinical practices in a general population on account of the radiation exposure, time requirements and high costs.12 Consequently, simple alternative markers are needed to quantify visceral adiposity. Recently, new obesity indices have been proposed that can reflect the degree of visceral fat accumulation and visceral fat content in human body, including visceral adiposity index (VAI), lipid accumulation product (LAP) and body roundness index (BRI). Among them, VAI is based on WC, BMI, triglycerides (TG) and high-density lipoprotein cholesterol (HDL-C), reflecting the function and distribution of visceral fat.13 LAP is associated with insulin resistance and cardiovascular disease,14,15 reflecting the degree of abdominal fat accumulation. Nevertheless, the cost-effectiveness of LAP and VAI for predicting DKD is not obvious, since both indices are generated from lipid parameters. Therefore, BRI has been proposed as an alternative to measuring visceral obesity. BRI is based on body WC and height to determine abdominal obesity, without collecting lipid parameters from the laboratory.16 BRI is a simple, convenient and cost-effective way to predict metabolic syndrome.17,18 However, the predictive effect of these new obesity indices on DKD in Chinese patients with type 2 diabetes mellitus is unclear.
We aimed to investigate the association of BMI, WC, VAI, LAP, BRI and the variability of five obesity indices with DKD in patients with type 2 diabetes mellitus and compare the predictive validity of these markers for the risk of DKD in this large longitudinal cohort study.
Materials and Methods
Study Participants
This was a retrospective cohort study. We used outpatient data from January 2006 to December 2019 from Lee’s United Clinics, which has six centers in Taiwan. Specific data details have been reported.19 Patients with type 2 diabetes were identified. The date of the first recorded kidney examination was defined as baseline.
The inclusion criteria were subjects (1) aged ≥18 years; (2) had T2DM (as defined by the WHO diagnostic criteria in 2019);20 (3) had Non-DKD at baseline;. Exclusion criteria were (1) less than 3-year follow-up; (2) alternative forms of kidney disease (such as nephrotic syndrome or glomerulonephritis, etc); (3) and subjects with missing or incomplete data. Eventually, 2659 patients were included in the study and 1080 patients developed DKD in the follow-up period (Figure 1). This study was approved by the Ethics Committee of the Taiwan Lee’s United Clinic, China (No.14–055-B) and was conducted according to the Declaration of Helsinki. All participants recruited to the study provided written informed consent.
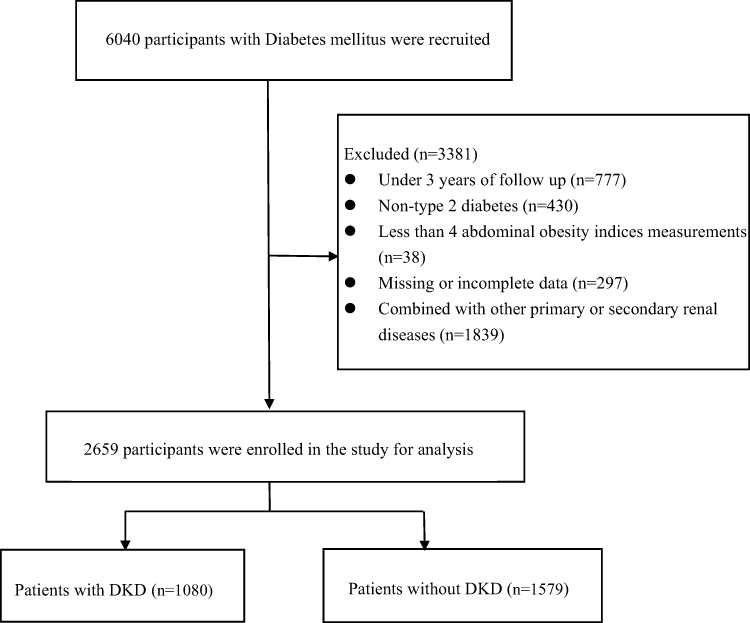 |
Figure 1 Flowchart of the cohort. |
Data Collection
Data for each subject were collected according to a standardized protocol from Lee’s Clinics in Taiwan. Demographic data included age, sex, duration of diabetes, smoking, drinking, exercise habits and medication (anti-hypertensive drugs, oral anti-diabetic drugs, insulin, and lipid-lowering agents). Personal medical history included diabetes mellitus, hypertension, hyperlipidemia, kidney disease, etc. Clinical parameters inculded height, weight, WC, hip circumference, systolic pressure (SBP), diastolic pressure (DBP), total cholesterol (TC), TG, low-density lipoprotein cholesterol (LDL-C), HDL-C, hemoglobin A1c (HbA1c), urinary albumin-to-creatinine ratio (UACR), estimated glomerular filtration rate (eGFR), serum creatinine (Scr) and calculated BMI, VAI, LAP, BRI and the variability of BMI, WC, VAI, LAP, BRI.
Assessment of Renal Function
In the morning of the examination, 2 tubes of clean catch midstream urine are taken from the patient and sent to the examination centre. Type 2 diabetes patients are examined four times annually to record SCr, urinary microalbumin, urine creatinine levels, UACR, and eGFR. The eGFR21 was determined using the following formula proposed by the Japanese Society of Nephrology: eGFR (mL/min/1.73m2) =194×SCr-1.094×age-0.287 (×0.739 for women). UACR=urinary microalbumin (mg/dL)/ urinary creatinine (g/dL). The baseline UACR for patients in this study was the mean of four UACR measurements from their first-year physical health examination. DKD was reevaluated every year during the follow-up period.
Diagnostic criteria for DKD: DKD can be diagnosed by eGFR < 60 mL/min/1.73 m2 and/or UACR≥30mg/g.22 DKD is not diagnosed if the patient has any condition of the following:23 i) rapid decrease in eGFR, ii) rapid increase in UACR or development of nephrotic syndrome, iii) resistant hypertension, iv) decrease in eGFR greater than 30% within 3 months after administration of angiotensin converting enzyme inhibitors or angiotensin receptor antagonists, v) or history of other renal diseases (acute and chronic kidney injury, primary glomerulonephritis, urinary tract infection and urinary tract stones, etc.).
Measurement and Calculation of Obesity Indices
The measurements were made according to the standard anthropometric protocols of the International Society for the Advancement of Kinanthropometry (ISAK). Height, weight and WC measurements are taken by trained physicians according to the standards. Patients are asked to wear minimal clothes, without shoes, hats or headgear. Body weight was measured to the nearest 0.1 kg with a weight scale (TANITA, USA) and height was measured to the nearest 0.1 cm with a stadiometer (SECA213, Germany). WC was measured using a tape measure to the nearest 0.1 cm, at both the level of the umbilicus and the level of the midpoint waist by measuring at the mid-point between the lowest palpable rib and the top of the iliac crest, in the mid-axillary line. The BMI, WHR, LAP, VAI and CVAI were calculated as follows:24
Variability in Obesity Indices
BMI, WC, VAI, LAP and BRI were collected every quarter. For each patient, intrapersonal standard deviation (SD) of all recorded BMI, WC, VAI, LAP and BRI measurements were calculated. BMI-SD, WC-SD, VAI-SD, LAP-SD and BRI-SD represented the measure of five obesity indices variability. For this analysis, at least five BMI, WC, VAI, LAP and BRI values were required to obtain reliable estimates of the five obesity indices variability during the follow-up period, and multiple imputation (10 imputations) to replace missing values by using a chained equation approach based on all candidate predictors and outcomes.
Statistical Analysis
SPSS version 22.0 and R version 4.2.3 were used for statistical analysis. Categorical variables were reported as percentages. Continuous variables are shown as means ± SD if normally distributed, or as median (interquartile range) if not. The Mann–Whitney U-test or Student’s t-test and Chi-square test were used for continuous and dichotomous variables, respectively.
Cox regression analysis was performed to determine a relationship between different obesity indices and the risk of DKD. Risks were displayed as hazard ratios (HR) with corresponding 95% confidence interval (CI). We adjusted none of the variables in model 1. Sex, age, duration of diabetes, smoking, drinking, hypertension, hyperlipidemia, medication (anti-hypertensive drugs, oral anti-diabetic drugs, insulin, and lipid-lowering agents) were adjusted in model 2, and HbA1c, SBP, DBP and SCr were further adjusted in model 3.
R 4.2.3 was used to evaluate the predictive performance using Cox’s proportional hazards model (using the R package “survival”, “survminer”, “rms”, “pec”). We calculated Time-dependent the area under the curve (AUC) and Time-dependent C-Index to evaluate the predictive effect of obesity indices on DKD.
Results
Comparison of Baseline Characteristics Between the Patients with and without DKD
A total of 2659 individuals, ranging in age from 18 to 88 years, were enrolled in our final analysis. The mean follow-up period was 4.29 ±2.2 years, and the number of new cases of DKD at the end of follow-up was 1080 (40.6%). Comparisons of the baseline characteristics between the patients with and without DKD are shown in Table 1. The difference between the proportions of subjects who smoked, drank and exercised between the DKD and NDKD groups was not statistically significant (P>0.05). Compared to the patients without DKD, those with DKD were older, and had longer duration of diabetes and higher rates of insulin injection. In addition, they had higher systolic blood pressure and diastolic blood pressure, and higher rates of anti-hypertensive drugs use. Moreover, the patients with DKD had higher values of all of the obesity indices (BMI, WC, VAI, LAP, BRI) and BMI and VAI variability.
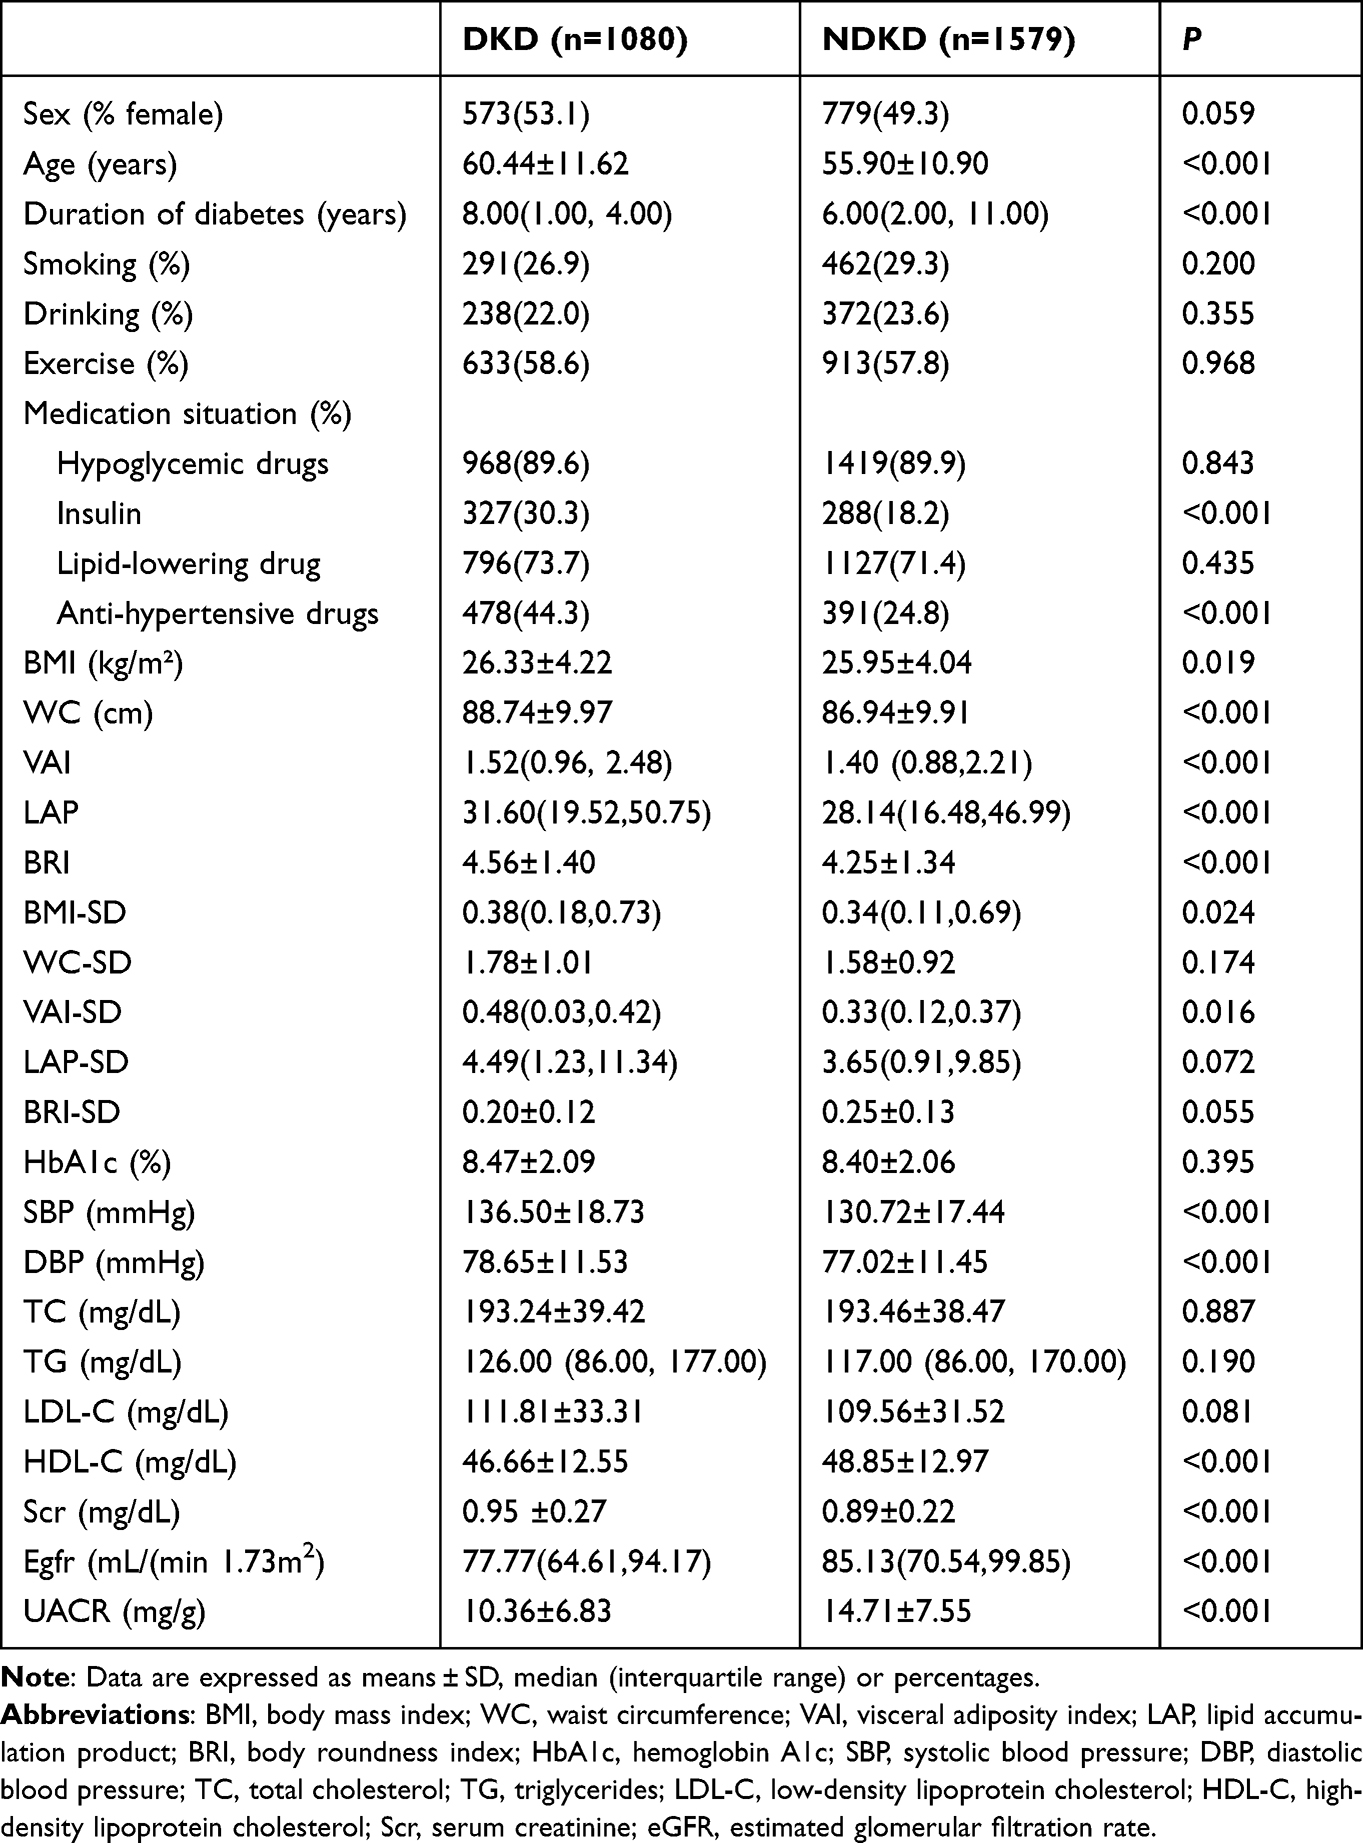 |
Table 1 Clinical Characteristics Between Two Groups at Baseline |
Relationship Between Obesity Indices and Variability with the Risk of DKD
An analysis of the association between the five obesity indices and development DKD is shown in Figure 2 and Table 2. The risk of developing DKD increased with an increase in the BRI, LAP, VAI, WC and BMI (Figure 2a). After further adjusted for age, sex, smoking, drinking, duration of diabetes and medication situation, HbA1c, SBP, DBP, Scr, the above associations decreased but remained statistically significant (Figure 2b and c). Quartile grouping of each obesity indices showed that in corrected model 3, the risk (HR) and 95% CI for DKD development at the highest quartile (Q4) compared with its lowest quartile (Q1) for each of the five obesity evaluation markers were BRI: 1.356 (1.131,1.626), LAP: 1.268 (1.058,1.521), VAI: 1.265 (1.101.1.398), WC: 1.379 (1.141,1.688), and BMI: 1.301 (1.088,1.556) (Table 2).
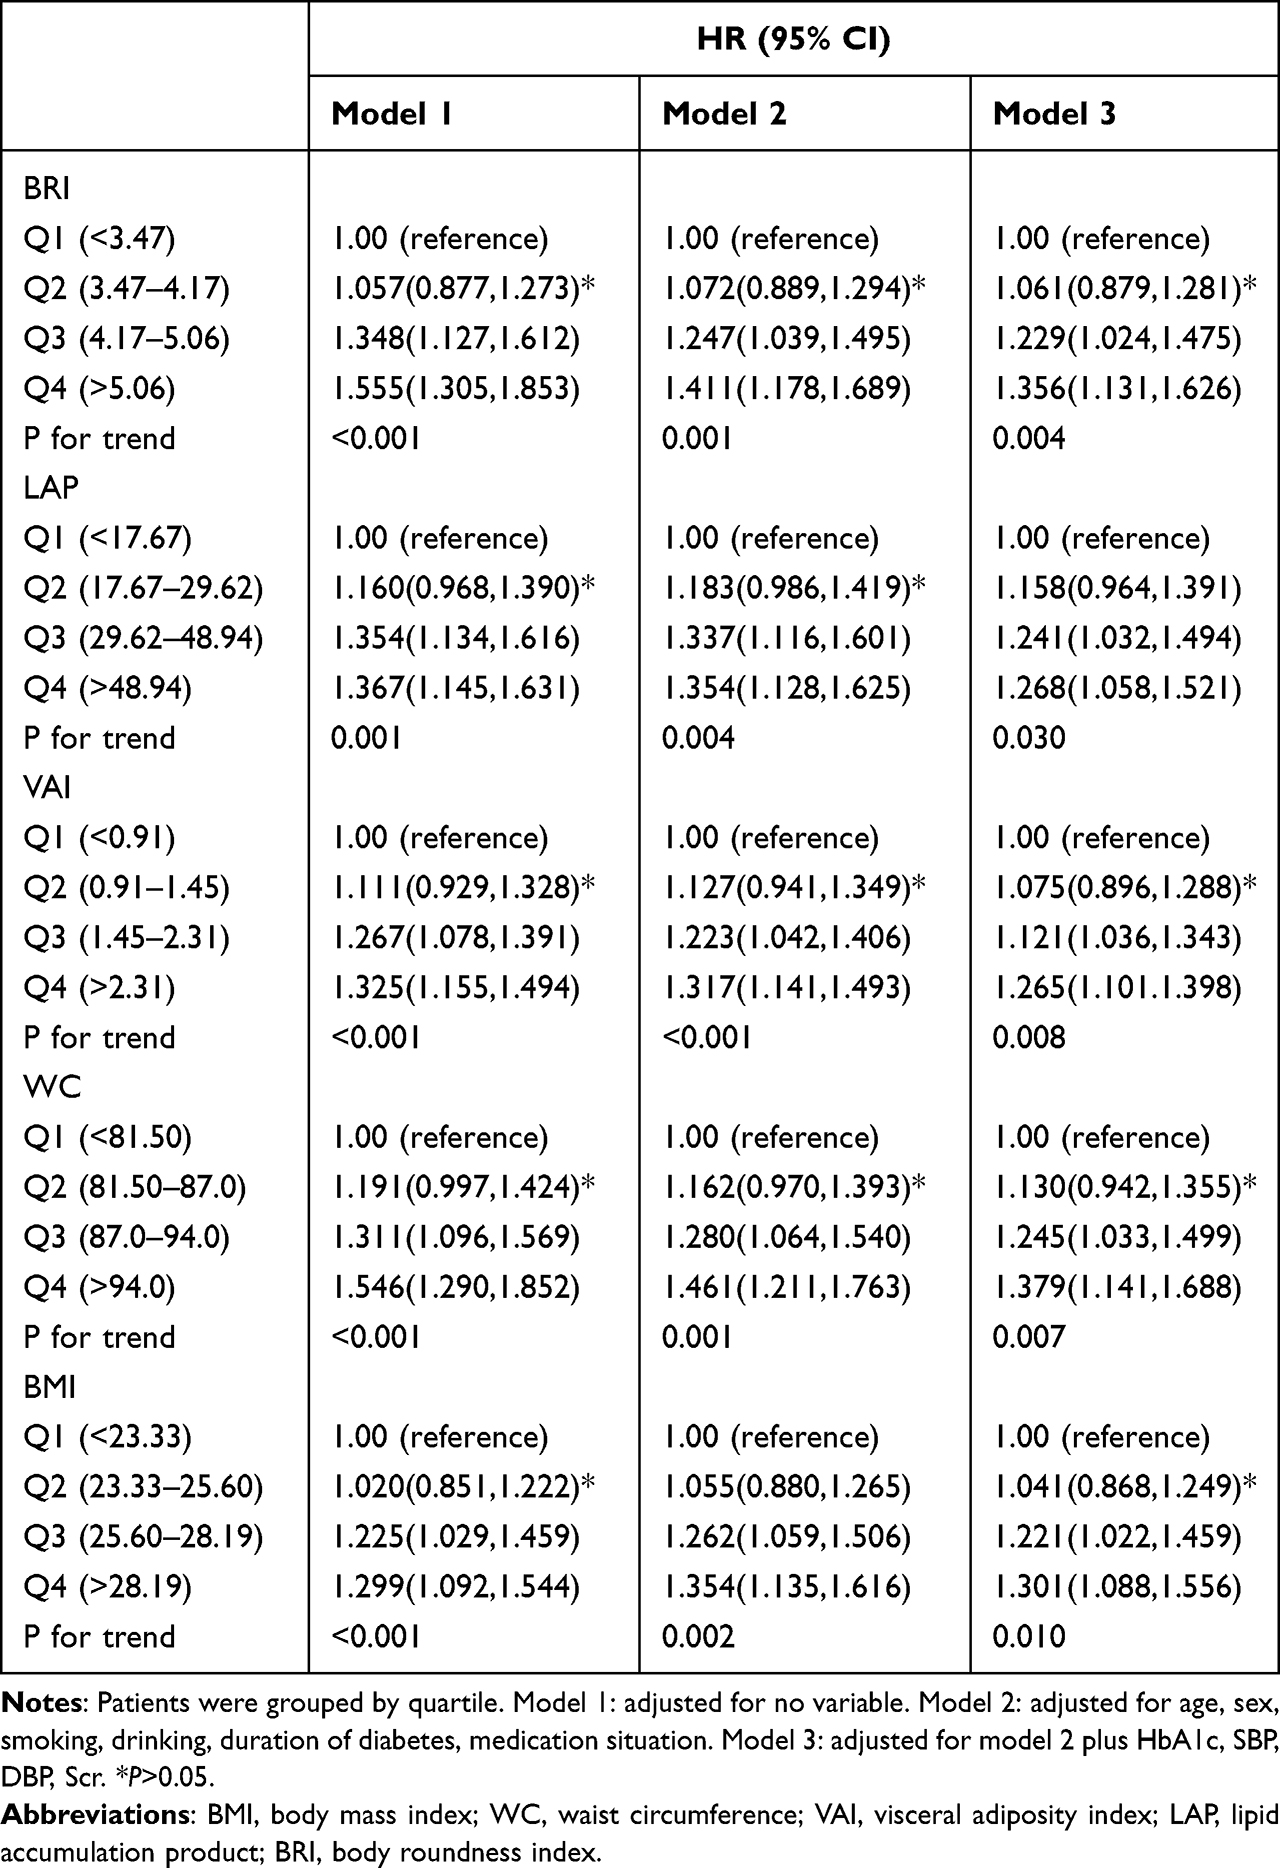 |
Table 2 Results of Cox Proportional Risk Regression Model Analysis of the Relationship Between Different Obesity Indices and the Development of DKD |
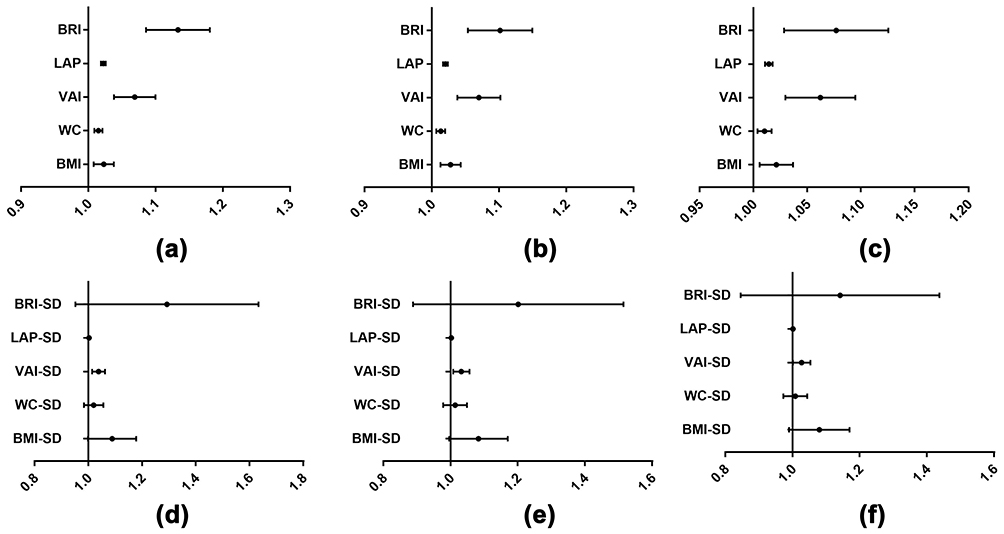 |
Figure 2 Associations between abdominal obesity indices and its variability and the prevalence of DKD. Abbreviations: BMI, body mass index; WC, waist circumference; VAI, visceral adiposity index; LAP, lipid accumulation product; BRI, body roundness index; HbA1c, hemoglobin A1c; SBP, systolic blood pressure; DBP, diastolic blood pressure; Scr, serum creatinine. Notes: (a) Adjusted for no variable. (b) Adjusted for age, sex, smoking, drinking, duration of diabetes and medication situation. (c) Model 3: adjusted for age, sex, smoking, drinking, duration of diabetes, medication situation, HbA1c, SBP, DBP, Scr. (d) Adjusted for no variable. (e) Adjusted for age, sex, smoking, drinking, duration of diabetes and medication situation. (f) Model 3: adjusted for age, sex, smoking, drinking, duration of diabetes, medication situation, HbA1c, SBP, DBP, Scr. |
As for the relationship between the variability of five obesity indices and DKD, it was found that the variability of VAI was significantly associated with DKD (Figure 2d). The relationship remained significant after further adjusting for age, sex, smoking, drinking, duration of diabetes and medication situation, HbA1c, SBP, DBP, Scr (Figure 2e and f). Median grouping of each obesity indices variability showed that in corrected model 3, the risk (HR) and 95% CI for DKD development at the upper median (M2) versus the lower median (M1) for each of the five obesity indices variability were BRI-SD:0.959 (0.846,1.087), LAP-SD:1.002 (0.996,1.009), VAI-SD:1.002 (0.996,1.009), WC-SD:0.928 (0.822,1.048), BMI-SD:1.074 (0.951,1.213) (Table 3).
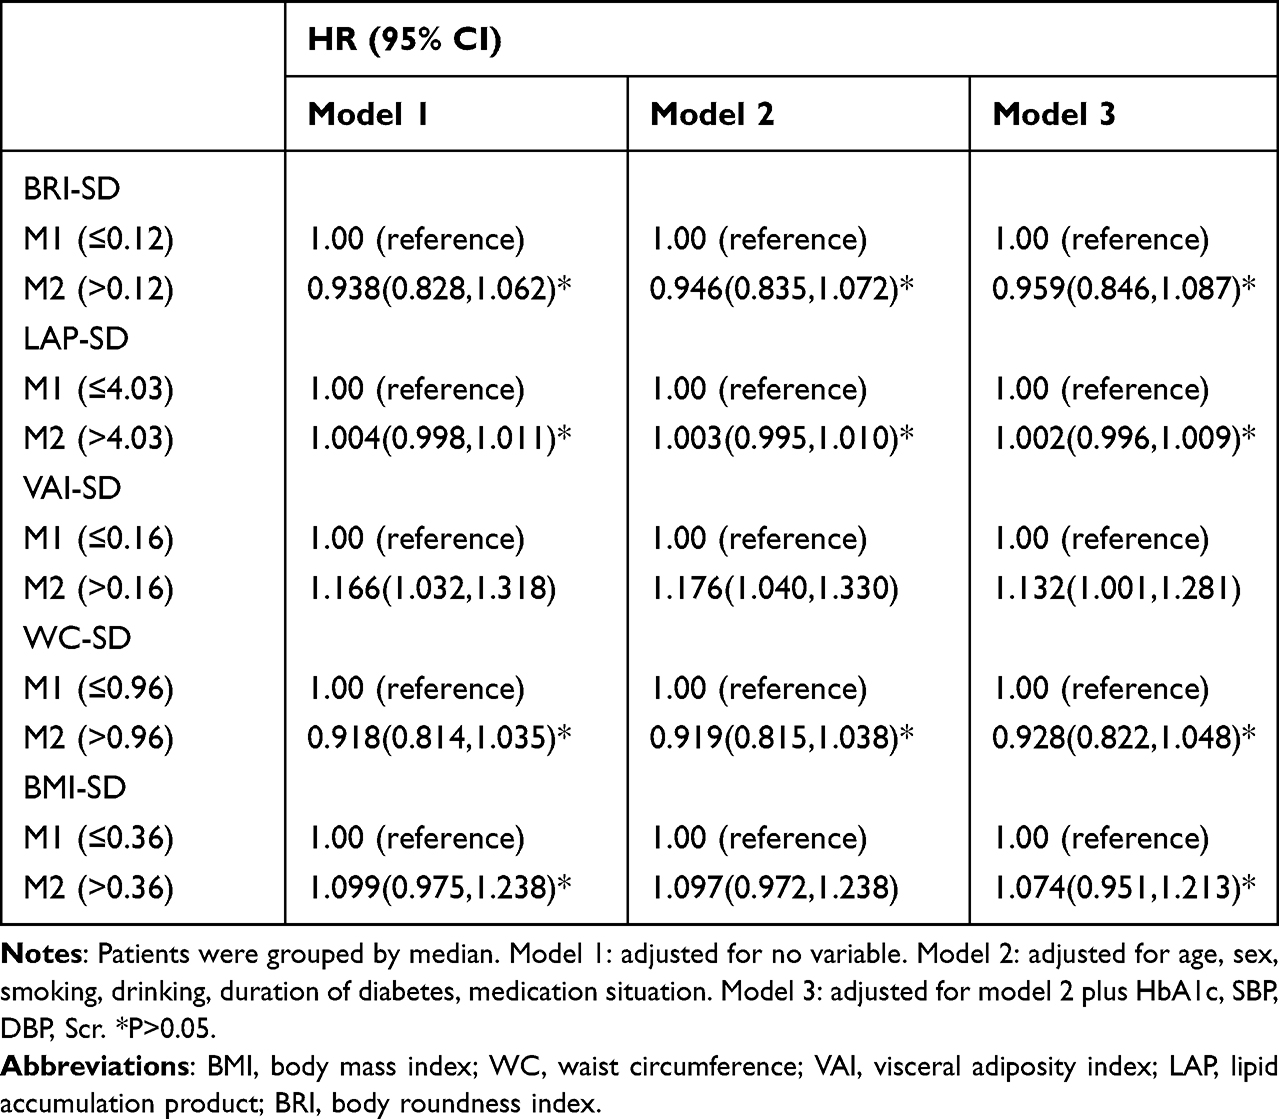 |
Table 3 Results of Cox Proportional Risk Regression Model Analysis of the Relationship Between Different Obesity Indices Variability and the Development of DKD |
Time-Dependent Predictions of Different Obesity Indices for DKD by AUC and C-Index
The test variables were obesity indicators associated with DKD, including BMI, WC, VAI, LAP, BRI and the variability of VAI, and the status variable was DKD. After further adjusted for age, sex, smoking, drinking, duration of diabetes and medication situation, HbA1c, SBP, DBP, Scr. The results of AUCs and C-Index with their corresponding 95% CI parameters are shown in Table 4. BRI had the best predictive performance, with AUC of 0.807, 0.663 and 0.673 at 1, 3 and 5 years, respectively, and BMI and WC had the weakest predictive effect among obesity indices associated with DKD, with AUC of 0.797, 0.657 and 0.665 at 1, 3 and 5 years, respectively.
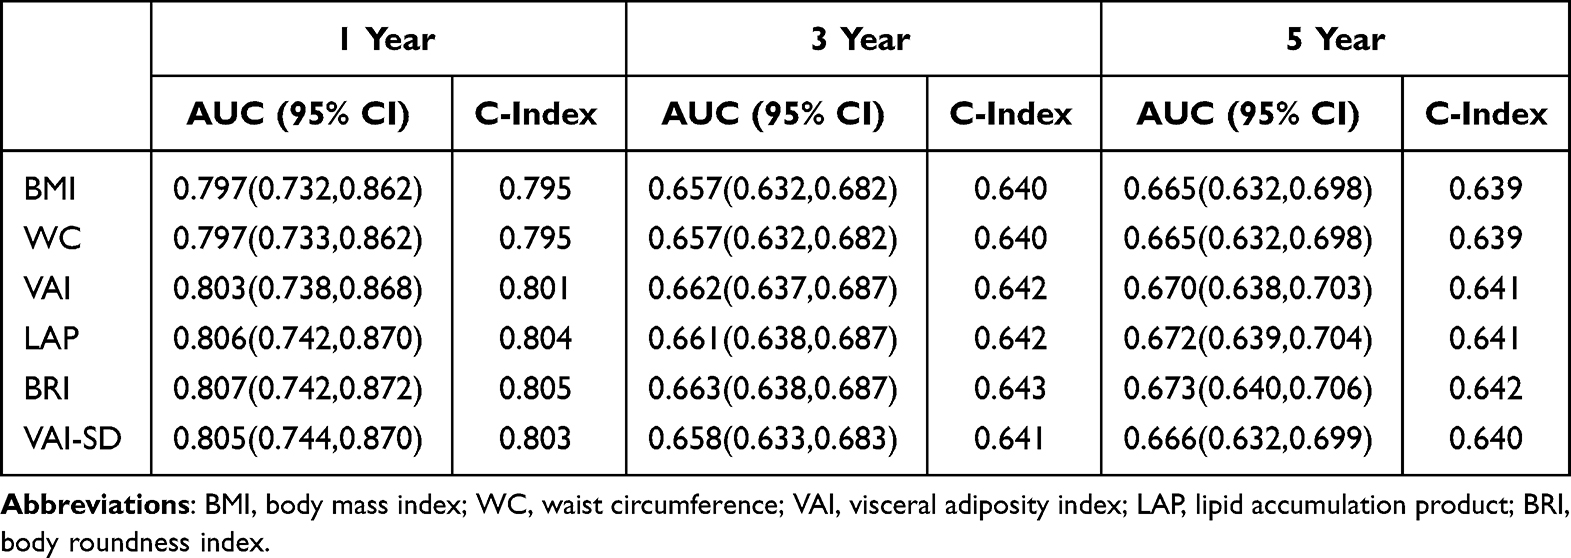 |
Table 4 Time-Dependent Predictions of Different Obesity Indices for DKD by AUC and C-Index |
Cox Regression Analysis of Risk Factors for DKD in Patients Stratified by BRI Quartiles
As presented in Figure 3 and Table 2, after adjusting for age, sex, smoking, drinking, duration of diabetes, medication situation, HbA1c, SBP, DBP, Scr and eGFR, patients in the Q4 group had the highest risk of developing DKD[HR=1.356,95% CI (1.131,1.626), P=0.001] and the Q1 group had the lowest risk. In addition, the risk of DKD in group Q3 [HR=1.229,95% CI (1.024,1.475), P=0.026] was higher than that in group Q2[HR=1.061,95% CI (0.879, 1281), P=0.536].
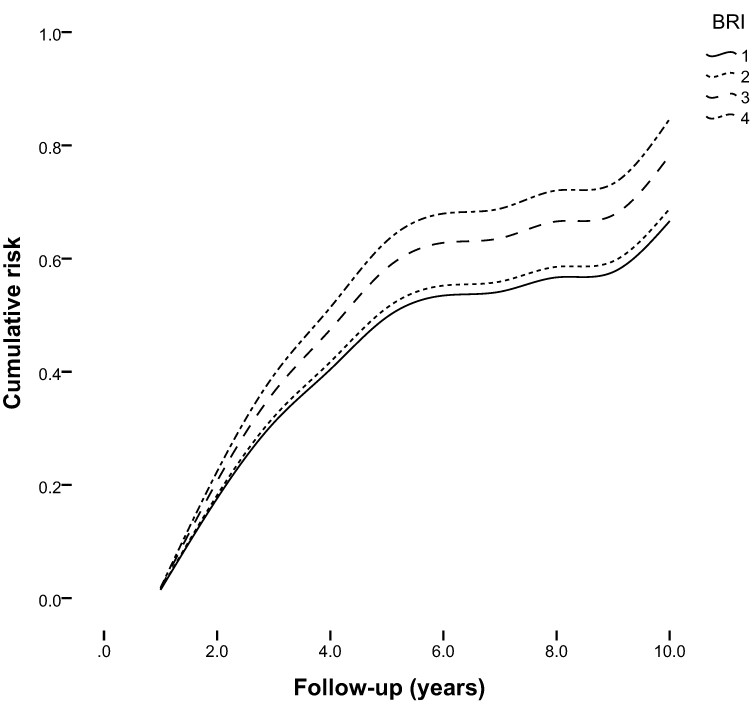 |
Figure 3 Cumulative prevalence of diabetic kidney disease (DKD) according to the body roundness index (BRI) quartile groups. Note: Grouping was based on quartiles of BRI. |
Discussion
Herein, we found a high prevalence of DKD (40.6%) in Taiwan T2DM, which was higher than most of previous studies in other countries. For example, in five European countries (Austria, Hungary, The Netherlands, Poland and Scotland), the prevalence of DKD was 34.8%.25 In the United States, DKD prevalence among adults with diabetes was 26.2%.26 Factors accounting for the high incidence of DKD may include poor glycated hemoglobin control (an average of 8.47%) in our study population. Furthermore, considerable variation between different countries is due to the use of different equations for estimating GFR, and the method of measuring albuminuria and differences in the timing. More importantly, the prevalence of DKD in China remains at a high level and should be taken seriously.27
Both general and central obesity has been well recognized as an independent risk factor for developing DKD in T2DM patients. Our study investigated and compared the performance of estimating elevated DKD risk among different obesity indices as well as their optimal cut-off values in T2DM patients. The current study demonstrated that these five indices were independently associated with a higher likelihood of DKD in T2DM patients. After adjusting for potential confounding factors, this association remained persisted, consistent with previous studies.24,28 The pathogenesis of obesity-related DKD remain inadequately understood. One hypothesis is that obesity induces an increase in glomerular filtration rate to compensate for the metabolic demands, leading to podocyte loss and focal segmental glomerulosclerosis that markedly diminished renal function.29 In addition, excess fat deposition into the kidneys caused by obesity also leads to the accumulation of toxic substances from fatty acid metabolism (such as diacylglycerol), which can lead to mitochondrial dysfunction, apoptosis, and eventual renal dysfunction.30 These results provide a reliable predictor and a simple and low-cost screening method for screening the high-risk DKD population in clinical practice, especially in primary hospitals.
Further, ROC curve analysis showed that BRI had the strongest predictive power of the risk for DKD compared to other anthropometric indices, while the BMI and showed the weakest predictive power of the risk. Previous study reported that the effect of obesity on blood glucose is not only related to the amount of body fat, but also related to the location of body fat accumulation.31 Nevertheless, BMI is the most commonly used obesity index, which cannot accurately reflect the distribution of body fat or distinguish fat from muscle, and it explains the reason that BMI was the weakest predictor. BRI was a novel anthropometric index first developed by Thomas et al,16 used for predicting both body fat and the percentage of visceral adipose tissue, which allows estimation of the shape of the human body figure as an ellipse or oval. To date, BRI has been used to predict diabetes, cardio-metabolic risk, metabolic syndrome in the general population, overweight and obese population, post-menopausal women, and all demonstrated comparatively good predictive performance.18,32 However, studies focused on the associations of BRI with diabetic complications, especially with DKD, are limited. Ou et al24 observed 1872 patients with T2DM and found that BRI was significantly associated with albuminuria and advanced kidney disease, while the ability of BRI to predict DKD was not studied. Our cohort study showed that BRI had a certain capable of identifying DKD (AUC: 0.663–0.807) in T2DM patients, with the C-index was from 0.642 to 0.805. Hence, we recommend that health care providers use BRI to replace traditional obesity index in screening patients for DKD risk, and accordingly, timely blood glucose monitoring and effective integrative intervention should be conducted for these patients.
The VAI and the LAP, which are new obesity indices, are good markers of visceral adiposity and visceral adiposity has a greater impact on metabolic disease than abdominal subcutaneous adiposity according to previous study.33 In addition, the VAI and LAP showed good correlation and predictive ability for metabolic syndrome, hypertension and diabetes.34,35 Hence, in our study, their abilities to predict the onset of DKD does not show obvious advantages compared with BRI, but it is still better than the traditional indicators (BMI and WC). The results were in line with prior cross-sectional study conducted in China.28 However, the cross-sectional study showed that the AUC values of VAI and LPA among males were 0.585 and 0.561, respectively, which was lower than our study. The inconsistent results may be owing to differences in factors such as population characteristics and research type.
When considering “variability”, previous studies have identified triglycerides and HDL- cholesterol variability are significant prognostic factors in DKD.36 Given these observations, in our study, a similar association be found for variability of VAI, which is calculated based on triglycerides and HDL-cholesterol and fluctuates to a certain extent. In addition, our study showed that BMI variability was not a risk factor for DKD, but the variability in the DKD group was significantly higher than that in the NDKD group. A study evaluated the relationship between BMI variability and DKD in 8720 participants with T2DM and found that BMI variability was associated with an increased risk of DKD.37 The results suggest that the most beneficial way to lose weight in diabetes mellitus maybe through minimal VAI and BMI variability to prevent DKD.
The results of this study have some implications for the management of patients with T2DM. Increasing evidence has been expressed that obesity has become an independent risk factor for DKD. We found that both general and central obesity indices and VAI variability were independently associated with a higher risk of DKD in T2DM patients. We recommend that health care providers pay attention to the management of obesity in diabetic patients and develop intervention plans based on the patient’s own condition. Moreover, the results show that the predictive power of the new obesity index for DKD is higher than that of the traditional obesity index, with BRI in particular showing better predictive power. This finding has good implications for clinical work and suggests that BRI, a low-cost obesity indicator, should be used in place of traditional indices (BMI and WC) in the management of T2DM patients, especially in primary hospitals.
The present study has some strengths. First, compared with previous cross-sectional studies, this study was a longitudinal study that conducted a relatively large sample of the T2DM patients. Second, we only included subjects with at least 3 years of follow-up and aimed to ensure that there was sufficient time to observe a valid end point event for each patient. Moreover, the relationship between BRI and DKD was discovered in this study, and the cut-off point was calculated at the same time. Some limitations should be considered when interpreting our results. First, our research was limited to T2DM patients in Taiwan, and the results may not be applied to other regions and ethnic groups. Second, because we lack data on insulin resistance, the possibility of residual confounding variables remains. Furthermore, glucocorticoids, antibiotics and immunosuppressants may affect urinary protein, unfortunately, we have no data about the use of these drugs. Additionally, some of our clinical data, such as diabetes duration, smoking status, drinking status were self-reported, which could confound the results to some extent.
Conclusion
In conclusion, the results of this retrospective observational cohort study suggest that the prevalence of DKD is high, which should be a concern for the local government. Importantly, we found that BMI, WC, VAI, LAP, BRI and VAI variability were associated with a significant increase in the risk of DKD events, and BRI was superior and alternative obesity index for predicting DKD risk in T2DM patients. Further prospective epidemiological research is needed to replicate these findings in other cohorts.
Acknowledgments
The authors sincerely thank all participants for their time and effort in this study.
Author Contributions
All authors made a significant contribution to the work reported, whether that is in the conception, study design, execution, acquisition of data, analysis and interpretation, or in all these areas; took part in drafting, revising or critically reviewing the article; gave final approval of the version to be published; have agreed on the journal to which the article has been submitted; and agree to be accountable for all aspects of the work.
Funding
This study was supported in part by grants from National key R&D program of China (2021YFE0204800) and key R&D program of Hainan Province (ZDYF2021SHFZ236).
Disclosure
The authors report no conflicts of interest in this work.
References
1. Sugahara M, Pak WLW, Tanaka T, Tang SCW, Nangaku M. Update on diagnosis, pathophysiology, and management of diabetic kidney disease. Nephrology. 2021;26(6):491–500. doi:10.1111/nep.13860
2. Chen Y, Lee K, Ni Z, He JC. Diabetic kidney disease: challenges, advances, and opportunities. Kidney Dis. 2020;6(4):215–225. doi:10.1159/000506634
3. Lin YK, Gao B, Liu L, et al. The prevalence of diabetic microvascular complications in China and the USA. Curr Diab Rep. 2021;21(6):16. doi:10.1007/s11892-021-01387-3
4. Kovesdy CP, Furth S, Zoccali C; World Kidney Day Steering Committee. Obesity and kidney disease: hidden consequences of the epidemic. Physiol Int. 2017;104(1):1–14. doi:10.1556/2060.104.2017.1.9
5. Xu T, Sheng Z, Yao L. Obesity-related glomerulopathy: pathogenesis, pathologic, clinical characteristics and treatment. Front Med. 2017;11(3):340–348. doi:10.1007/s11684-017-0570-3
6. Zhao Q, Yi X, Wang Z. Meta-analysis of the relationship between abdominal obesity and diabetic kidney disease in type 2 diabetic patients. Obes Facts. 2021;14(4):338–345. doi:10.1159/000516391
7. Duan JY, Duan GC, Wang CJ, et al. Prevalence and risk factors of chronic kidney disease and diabetic kidney disease in a central Chinese urban population: a cross-sectional survey. BMC Nephrol. 2020;21(1):115. doi:10.1186/s12882-020-01761-5
8. Man REK, Gan ATL, Fenwick EK, et al. The relationship between generalized and abdominal obesity with diabetic kidney disease in type 2 diabetes: a multiethnic asian study and meta-analysis. Nutrients. 2018;10(11):1685.
9. Haslam DW, James WP. Obesity. Lancet. 2005;366(9492):1197–1209. doi:10.1016/S0140-6736(05)67483-1
10. Maskarinec G, Raquinio PA, Setiawan VW, et al. Biomarker-based visceral adiposity score and incident type 2 diabetes in the multiethnic cohort. Ann Epidemiol. 2021;63:29–34. doi:10.1016/j.annepidem.2021.07.002
11. Fang H, Berg E, Cheng X, Shen W. How to best assess abdominal obesity. Curr Opin Clin Nutr Metab Care. 2018;21(5):360–365. doi:10.1097/MCO.0000000000000485
12. Omura-Ohata Y, Son C, Makino H, et al. Efficacy of visceral fat estimation by dual bioelectrical impedance analysis in detecting cardiovascular risk factors in patients with type 2 diabetes. Cardiovasc Diabetol. 2019;18(1):137. doi:10.1186/s12933-019-0941-y
13. Dong Y, Bai L, Cai R, Zhou J, Ding W. Visceral adiposity index performed better than traditional adiposity indicators in predicting unhealthy metabolic phenotype among Chinese children and adolescents. Sci Rep. 2021;11(1):23850. doi:10.1038/s41598-021-03311-x
14. Nunes SH, Nogueira Saad MA, da Cruz Filho RA, et al. Is lipid accumulation product a better cardiovascular risk predictor in elderly individuals than anthropometric measures? Rev Port Cardiol. 2021;40(8):539–544. doi:10.1016/j.repce.2020.09.007
15. Mazidi M, Kengne AP, Katsiki N, Mikhailidis DP, Banach M. Lipid accumulation product and triglycerides/glucose index are useful predictors of insulin resistance. J Diabetes Complications. 2018;32(3):266–270. doi:10.1016/j.jdiacomp.2017.10.007
16. Thomas DM, Bredlau C, Bosy-Westphal A, et al. Relationships between body roundness with body fat and visceral adipose tissue emerging from a new geometrical model. Obesity. 2013;21(11):2264–2271. doi:10.1002/oby.20408
17. Tian T, Zhang J, Zhu Q, Xie W, Wang Y, Dai Y. Predicting value of five anthropometric measures in metabolic syndrome among Jiangsu Province, China. BMC Public Health. 2020;20(1):1317. doi:10.1186/s12889-020-09423-9
18. Rico-Martín S, Calderón-García JF, Sánchez-Rey P, Franco-Antonio C, Martínez Alvarez M, Sánchez Muñoz-Torrero JF. Effectiveness of body roundness index in predicting metabolic syndrome: a systematic review and meta-analysis. Obes Rev. 2020;21(7):e13023. doi:10.1111/obr.13023
19. Sun Z, Wang K, Miller JD, Yuan X, Lee YJ, Lou Q. External validation of the risk prediction model for early diabetic kidney disease in Taiwan population: a retrospective cohort study. BMJ Open. 2022;12(12):e059139. doi:10.1136/bmjopen-2021-059139
20. Harreiter J, Roden M. Diabetes mellitus – definition, klassifikation, Diagnose, screening und prävention (update 2019) [Diabetes mellitus-definition, classification, diagnosis, screening and prevention (update 2019)]. Wien Klin Wochenschr. 2019;131(Suppl 1):6–15. German. doi:10.1007/s00508-019-1450-4
21. Matsuo S, Imai E, Horio M, et al. Revised equations for estimated GFR from serum creatinine in Japan. Am J Kidney Dis. 2009;53(6):982–992. doi:10.1053/j.ajkd.2008.12.034
22. Selby NM, Taal MW. An updated overview of diabetic nephropathy: diagnosis, prognosis, treatment goals and latest guidelines. Diabetes Obes Metab. 2020;22(Suppl 1):3–15. doi:10.1111/dom.14007
23. Microvascular Complications Group of Chinese Diabetes Society. Clinical guideline for the prevention and treatment of diabetic kidney disease in China (2021 edition), Chin J Diabetes Mellit. 2021;13(8):762–784. Chinese. doi:10.3760/cma.j.cn115791-20210706-00369
24. Ou YL, Lee MY, Lin IT, Wen WL, Hsu WH, Chen SC. Obesity-related indices are associated with albuminuria and advanced kidney disease in type 2 diabetes mellitus. Ren Fail. 2021;43(1):1250–1258. doi:10.1080/0886022X.2021.1969247
25. Eder S, Leierer J, Kerschbaum J, et al. Guidelines and clinical practice at the primary level of healthcare in patients with type 2 diabetes mellitus with and without kidney disease in five European countries. Diab Vasc Dis Res. 2019;16(1):47–56. doi:10.1177/1479164118795559
26. Afkarian M, Zelnick LR, Hall YN, et al. Clinical manifestations of kidney disease among US adults with diabetes, 1988–2014. JAMA. 2016;316(6):602–610. doi:10.1001/jama.2016.10924
27. Xia L, Cheng L, Jiang T, et al. Estimation of the prevalence of type 2 diabetes in combination with diabetic kidney disease and identification of the associated factors in patients attending primary hospitals in Anhui Province, China. J Int Med Res. 2021;49(10):3000605211051225. doi:10.1177/03000605211051225
28. Wan H, Wang Y, Xiang Q, et al. Associations between abdominal obesity indices and diabetic complications: Chinese visceral adiposity index and neck circumference. Cardiovasc Diabetol. 2020;19(1):118. doi:10.1186/s12933-020-01095-4
29. Chagnac A, Zingerman B, Rozen-Zvi B, Herman-Edelstein M. Consequences of glomerular hyperfiltration: the role of physical forces in the pathogenesis of chronic kidney disease in diabetes and obesity. Nephron. 2019;143(1):38–42. doi:10.1159/000499486
30. Nehus E. Obesity and chronic kidney disease. Curr Opin Pediatr. 2018;30(2):241–246. doi:10.1097/MOP.0000000000000586
31. Wisse BE. The inflammatory syndrome: the role of adipose tissue cytokines in metabolic disorders linked to obesity. J Am Soc Nephrol. 2004;15(11):2792–2800. doi:10.1097/01.ASN.0000141966.69934.21
32. Mohammad NS, Nazli R, Zafar H, Fatima S. Effects of lipid based multiple micronutrients Supplement on the birth outcome of underweight pre-eclamptic women: a randomized clinical trial. Pak J Med Sci. 2022;38(1):219–226. doi:10.12669/pjms.38.1.4396
33. Huang R, Cheng Z, Jin X, et al. Usefulness of four surrogate indexes of insulin resistance in middle-aged population in Hefei, China. Ann Med. 2022;54(1):622–632. doi:10.1080/07853890.2022.2039956
34. Xia MF, Lin HD, Chen LY, et al. Association of visceral adiposity and its longitudinal increase with the risk of diabetes in Chinese adults: a prospective cohort study. Diabetes Metab Res Rev. 2018;34(7):e3048. doi:10.1002/dmrr.3048
35. Yang J, Wang F, Han X, et al. Different anthropometric indices and incident risk of hypertension in elderly population: a prospective cohort study. Zhonghua Yu Fang Yi Xue Za Zhi. 2019;53(3):272–278. doi:10.3760/cma.j.issn.0253-9624.2019.03.007
36. Ceriello A, De Cosmo S, Rossi MC, et al. Variability in HbA1c, blood pressure, lipid parameters and serum uric acid, and risk of development of chronic kidney disease in type 2 diabetes. Diabetes Obes Metab. 2017;19(11):1570–1578. doi:10.1111/dom.12976
37. Hukportie DN, Li FR, Zhou R, Zheng JZ, Wu XX, Wu XB. Waist circumference and body mass index variability and incident diabetic microvascular complications: a post hoc analysis of ACCORD Trial. Diabetes Metab J. 2022;46(5):767–780. doi:10.4093/dmj.2021.0258
 © 2023 The Author(s). This work is published and licensed by Dove Medical Press Limited. The
full terms of this license are available at https://www.dovepress.com/terms
and incorporate the Creative Commons Attribution
- Non Commercial (unported, 3.0) License.
By accessing the work you hereby accept the Terms. Non-commercial uses of the work are permitted
without any further permission from Dove Medical Press Limited, provided the work is properly
attributed. For permission for commercial use of this work, please see paragraphs 4.2 and 5 of our Terms.
© 2023 The Author(s). This work is published and licensed by Dove Medical Press Limited. The
full terms of this license are available at https://www.dovepress.com/terms
and incorporate the Creative Commons Attribution
- Non Commercial (unported, 3.0) License.
By accessing the work you hereby accept the Terms. Non-commercial uses of the work are permitted
without any further permission from Dove Medical Press Limited, provided the work is properly
attributed. For permission for commercial use of this work, please see paragraphs 4.2 and 5 of our Terms.