Back to Journals » Journal of Inflammation Research » Volume 15
Correlation Between the RNA Methylation Genes and Immune Infiltration and Prognosis of Patients with Hepatocellular Carcinoma: A Pan-Cancer Analysis
Received 23 May 2022
Accepted for publication 8 July 2022
Published 13 July 2022 Volume 2022:15 Pages 3941—3956
DOI https://doi.org/10.2147/JIR.S373776
Checked for plagiarism Yes
Review by Single anonymous peer review
Peer reviewer comments 2
Editor who approved publication: Professor Ning Quan
Xin-Yu Li,1,2 Xi-Tao Yang1
1Department of Interventional Therapy, Multidisciplinary Team of Vascular Anomalies, Shanghai Ninth People’s Hospital, Shanghai Jiao Tong University, Shanghai, People’s Republic of China; 2Department of Neurosurgery, Shanghai Ninth People’s Hospital, Shanghai Jiao Tong University, Shanghai, People’s Republic of China
Correspondence: Xi-Tao Yang, Department of Interventional Therapy, Shanghai Ninth People’s Hospital, Shanghai Jiao Tong University School of Medicine, No. 639 Zhizaoju Road, Huangpu District, Shanghai, 200011, People’s Republic of China, Email [email protected]
Background: RNA methylation is one of the most common RNA modifications and is dynamic and reversible. The enzymes and downstream effectors associated with RNA methylation modifications can be targeted to regulate RNA methylation levels. This mechanism can affect RNA processing, metabolism, cell proliferation and migration, and regulation of physiological or pathological processes. The aim of this study was to investigate the role of RNA methylation-related genes in hepatocellular carcinoma (HCC).
Methods: Baseline RNA methylation data were extracted from The Cancer Genome Atlas database. The expression pattern, predictive value, mutational profile, and interaction network of RNA methylation genes in pancancer were examined. Then, the association between the expression of RNA methylation genes and immune infiltration was investigated. In addition, a risk score model for HCC was developed and analyzed.
Results: Cancer cells had a higher expression of RNA methylation genes than normal cells in some cancer cells, and a higher expression of RNA methylation genes could negatively affect patient prognosis. Enrichment analysis revealed that RNA methylation genes are involved in the mRNA surveillance pathway and RNA degradation and transport. A 4-gene (ALYREF, NSUN4, TRMT6, YTHDF1) prognostic signature was established to predict HCC prognosis based on RNA methylation-related genes. Finally, the role of prognostic models in HCC was validated.
Conclusion: RNA methylation genes can be an indicator of oncogenicity in relation to HCC prognosis and are associated with immune infiltration in the tumour microenvironment. This finding could provide clinicians with the opportunity to explore new strategic approaches.
Keywords: RNA methylation, pan-cancer, genes
Introduction
Cancer is a major public health issue worldwide.1 In recent years, as there is continuous development in technology, epigenetic research in cancer epidemiology has become popular.2 RNA methylation refers to the development of methylation modifications at different locations on RNA molecules. More than 150 RNA methylation modifications have been identified as post-transcriptional regulatory markers in eukaryotes,3 and these modifications can regulate biological metabolic processes such as variable RNA splicing, exonucleation, stabilization, and translation.4–6 Research about RNA methylation modifications in cancer has only started. Although several studies have assessed RNA methylation modifications in recent years, their mechanism of development in tumors is still not fully elucidated.7 The Cancer Genome Atlas (TCGA) is a tumor genomics program that aims to use high-throughput genomic analysis techniques to better understand tumor characteristics and improve tumor prevention, diagnosis, and treatment.8,9 Currently, TCGA contains information about sequencing results, transcriptome analysis, copy number variants, DNA methylation, and single nucleotide variants and covers 33 tumor types, thereby providing an advantage in pan-cancer research. This paper presents a pan-cancer analysis of the role of RNA methylation in tumors to provide novel ideas and targets for the assessment of tumor pathogenesis, diagnosis, and treatment. In addition, we have analysed the role of RNA methylation genes in HCC based on clinical samples of liver cancer and performed experimental validation.
Materials and Methods
Data Acquisition and Processing
To analyze differences, the gene expression data of normal tissues were obtained from the Genotype-Tissue Expression (GTEx) database and the expression data of tumor tissues from the TCGA database. Sequencing data and clinical follow-up information about tumors were extracted from the TCGA database and downloaded via the GDC. Meanwhile,100 patients with hepatocellular carcinoma (HCC) from Ninth People’s Hospital, Shanghai, China, were included in the validation group. The studies involving human participants were reviewed and approved by the Shanghai Ninth People’s Hospital Institutional Review Board (IRB) with informed consent. The patients provided written informed consent to participate in this study. Demographic data and clinical data at baseline are shown in Tables S1 and S2. Figure 1 shows the study flowchart.
 |
Figure 1 A flowchart for the study. |
Survival Rate and Clinical Analysis
The gene expression data of 33 cancer types and the corresponding clinical survival data were used in the expression-based survival analysis. Tumor samples were divided into the high and low expression groups based on the median RSEM gene value. R package was utilized to adjust the survival time and status of the two groups. The Cox proportional hazards model was used to calculate the survival risk of each gene. The Kaplan-Meier method and the Log rank test were applied to assess each gene.
Analysis of Copy Number Variation
Copy number variations (CNVs) are the major aberrations causing changes in gene expression during tumorigenesis and tumor growth.10 CNVs are divided into two subtypes (homozygous and heterozygous), which include amplifications and deletions. Heterozygous variants indicate CNVs occurring on a single chromosome. Meanwhile, homozygous variants are defined as variants on both chromosomes. The raw data of 33 cancer types with CNVs (n = 11,495) were collected from the TCGA database using GISTIC version 2.0 to extract the required fragment data, synthesize the signal data, and combine the data with human reference genomic data to obtain gene CNVs. To determine the proportion of RNA methylation CNV amplifications and deletions in pan-cancer, GISTIC-processed RNA methylation CNVs were analyzed. Only genes with CNVs greater than 5% were considered significant variants.11,12 The associations between matched mRNA levels and percentages of matched CNV samples were determined based on the Pearson product-moment correlation coefficient and t distribution.13 P values were adjusted for the false discovery rate (FDR).
Evaluation of the microRNA Regulatory Network
The expression data of miRNA transcripts, including that of 9105 samples and 33 cancer types, were collected from the TCGA database. Experimentally validated data from scientific papers, TarBase, miRTarBase, and miR2 Disease and data from Target Scan and miRanda were included. Only miRNA pairs of recorded genes were used to evaluate correlation. Subsequently, gene expression and miRNA levels were found to be correlated with barcodes from TCGA probes. Pearson correlation coefficients and T distributions were used to calculate associations between paired mRNA and miRNA levels. After determining the FDR-corrected P values (FDR cutoff of < 0.05 and R of < 0), correlations were calculated for all paired samples. Transcription factors were considered as positive regulators and negatively correlated miRNA-gene pairs as potential negative regulators. Finally, rule maps were constructed using the VisNetwork R package.
Pathway Activity Analysis
Reverse-phase protein array (RPPA) data from the TCPA database were used to calculate scores for 7876 samples, 10 cancer-related pathways, and 32 cancer types. RPPA is a high-throughput antibody-based assay with procedures similar to Western blot analysis. Proteins were extracted from tumor tissues or cultured cells, denatured with SDS, plated on nitrocellulose-coated slides, and, subsequently, probed with antibodies (TCPA database). All TCPA RPPA data were obtained from the TCGA samples. Gene expression data were divided into the high and low groups based on median expression. The significant difference in pathway activity score (PAS) between the two groups was determined using the t-test, and an FDR-corrected P value of ≤ 0.05 was considered significant. For example, if PAS (Gene A groupHigh) > PAS (Gene A groupLow), gene A might have an activating effect on the pathway; otherwise, it could have an inhibitory effect.
Construction and Evaluation of Prognostic Risk Model
To obtain a generalized linear model and error reduction, the R glmnet package was used to perform 1000 iterations of Cox LASSO regression and 10 cross-validations. In addition, multivariate Cox proportional hazards regression analysis was performed to obtain risk genes and establish a predictive risk model. The model defined by the parameter β of the multivariate Cox proportional hazards regression analysis, and the expression of each gene in the sample. Based on the median risk index, the predictive model was used to calculate risk scores for the validation and training sets and to classify the validation and training sets into the high- and low-risk groups. The capability of the regression model to predict survival at 1, 2, and 3 years was assessed using the R survival receiver operating curve (ROC) package to calculate subject operating curves as a function of time (ROC curves). The risk estimates were validated by constructing scatter plots and heat maps of high and low risk using survival time and genetic risk models, and by testing the value and stability of the regression models for predicting survival in patients with lung adenocarcinoma using a validation kit.
Enrichment Analysis and Assessment of Drug Sensitivity
Gene Ontology (GO) and Kyoto Encyclopedia of Genes and Genomes (KEGG) pathway analyses were used to assess the functional analysis of DEGs associated with RNA methylation.14 In the form of enrichment analysis, GO covers molecular functions (MF), cellular components (CC) and biological processes (BP) and provides a comprehensive overview of the functional information of a specific gene. We collected data about the half-maximal inhibitory concentrations of 265 small molecules from the Genomics of Drug Sensitivity in Cancer (GDSC) database in 860 cell lines as well as their corresponding mRNA levels, and that of 481 small molecules from the Cancer Therapeutics Response Portal (CTRP) database in 1001 cell lines as well as their corresponding mRNA levels.15–17 The mRNA and drug sensitivity data were combined. Pearson correlation analysis was performed to determine the correlation between mRNA levels and half-maximal inhibitory concentrations of drugs. P-values were adjusted using an FDR of < 0.05. Bubble plots were used to summarize the correlation between genes and drugs.
Quantitative Real-Time PCR (qRT-PCR)
Tumor tissue and normal tissue specimens (>4 cm from the tumor specimen) were collected from 100 HCC patients admitted to the Ninth People’s Hospital of Shanghai Jiaotong University School of Medicine, and all the specimens were diagnosed pathologically. Total RNA was extracted using the Trizol method, and the tested RNA was subjected to reverse transcription and PCR reactions according to the instructions on the reverse transcription kit (Takara, batch: AJ60796A) and PCR reagent (Roche, batch: 41,472,600). The relative expression levels of mRNA were calculated using the 2^-ΔΔCt method (ΔCt = Ct (target gene-internal reference gene); ΔΔΔCt = ΔCt – Δctmin), and the paired t-test was used to compare the differences in gene expression in tumor tissues and normal paracancerous tissues. P < 0.05 was considered statistically significant. The primers used in this study were obtained from TsingKe biological technology (Nanjing, China). The primers used are as follows: ALYREF (forward 5′- GCAGGCCAAAACAACTTCCC −3′, reverse 5′- AGTTCCTGAATATCGGCGTCT −3′), NSUN4 (forward 5′-CCATCAATCCGTGTCAGTCTC-3′, reverse 5′- GCTTAGCACTTACATGATCCCAG-3′), TRMT6 (forward 5′-GGTGCTGAAACGTGAAGATGT-3′, reverse 5′- CTTGGGCTGTAGACTTCCTCC-3′), YTHDF1 (forward 5′-ACCTGTCCAGCTATTACCCG-3′, reverse 5′- TGGTGAGGTATGGAATCGGAG −3′).
Results
Dysregulation of RNA Methylation Genes in Different Cancer Types and Its Association with Prognosis
Figure 2A shows the differential expression of RNA methylation genes between tumor and adjacent normal tissues in all tumor types. Except for tumors without normal tissue data, the expression of RNA methylation gene was significantly higher in tumor samples than in normal samples. The expression of METTL1 was high in COAD, KIRP, LUAD, LUSC, and STAD. The expression of EIF4E3 was higher in normal tissues than in tumor tissues in LUSC, COAD, and LUAD. Hence, the dysregulated expressions of RNA methylation genes are involved in cancer development. Next, we examined whether the expression of RNA methylation genes were correlated with patient prognosis. Based on the one-way Cox regression analysis, a significant correlation was observed between prognosis and the expression of RNA methylation genes including KIRC, THCA, ACC, UVM, and KICH in several types of cancer (Figure 2B). With consideration of non-tumor-related factors contributing to mortality during follow-up, the correlation between gene expression and DSS was analyzed. In particular, the expression of RNA methylation genes could significantly affect prognosis in 15 types of cancer including LIHC, KIRC, LUAD, BLCA, and HNSC (Figure 2B). To further examine the prognostic potential of RNA methylation genes in different types of cancers, we evaluated the PFI of 33 types of cancer. Higher expression of RNA methylation genes were associated with shorter PFI in ACC, LGG, UVM, COAD, and KICH (Figure 2B). In addition, the Kaplan–Meier method was used to establish survival curves. Results showed that in ACC, BLCA, and BRCA, patients with a high expression of RNA methylation genes had a poor prognosis (Figure 2C). Interestingly, patients with CESC and CHOL who had a high expression of RNA methylation genes had a better prognosis (Figure 2C). Hence, a high expression of RNA methylation genes is an independent risk factor for poor prognosis in most types of tumors.
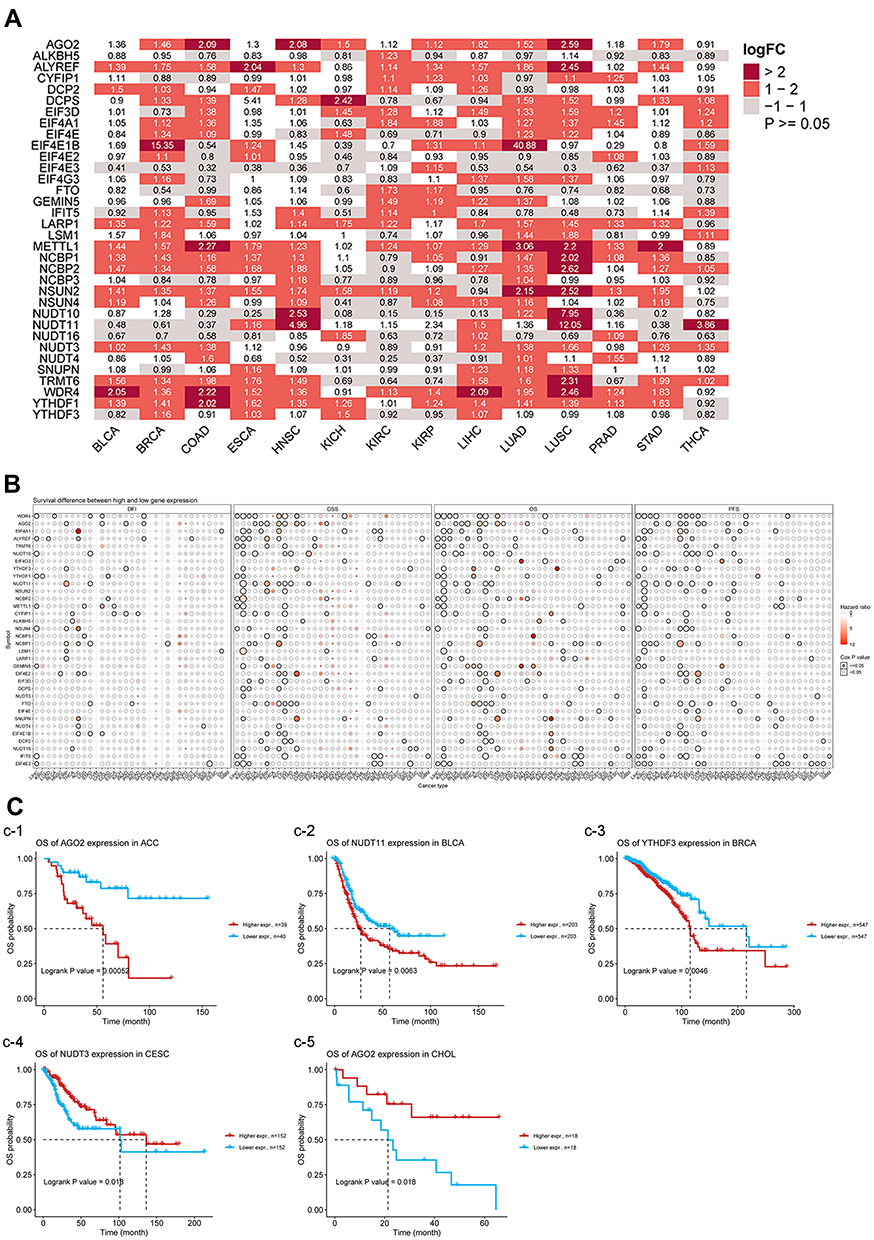 |
Figure 2 (A) The heatmap shows the expression profiles of the RNA methylation genes in the TCGA dataset. (B) Survival difference between high and low gene expression groups. (C) Survival curves used the Kaplan-Meier method (C-1: OS of AGO2 expression in ACC; C-2: OS of NUDT11 expression in BLCA; C-3: OS of YTHDF 3 expression in BRCA; C-4: OS of NUDT3 expression in CESC; C-5: OS of AGO2 expression in CHOL). |
Association Between CNV of RNA Methylation Genes and Prognosis
CNV has a significant diagnostic, prognostic, and/or therapeutic value in different cancer types.18 Based on the pie chart of CNV distribution, the main types of CNV were heterozygous amplification (Hete Amp) or deletion (Hete Del) (Figure 3A). We performed a subsequent analysis of the proportion of hete amp and hete del CNV in specific cancer subtypes. Results showed that the ratio of NCBP2 to LUSC, TGCT, and BLCA and the ratio of AGO2 to OV, UCS, and LUSC were > 84% in hete amp (Figure 3B). Meanwhile, TEIF4A1, NCBP3 and ALKBH5 in OV and LUSC exhibited greater than 80% of Hete Del (Figure 3B). In addition, AGO2 and NCBP2 in OV and LARP1, GEMIN5 in KIRC subtypes had greater than 30% Homo Amp, while DCPS in TGCT, IFIT5 in DLBC had greater than 20% Homo Del levels. Then, homozygous amplifications and deletions were analyzed (Figure 3C). Pearson correlation coefficient was used to investigate the correlation between mRNA expression and CNV. Results showed that the mRNA expression was positively correlated with CNV. Among them, YTHDF1, NCBP2, and LSM1 had the most significant correlation with LUSC, BRCA, and OV (Figure 3D). Therefore, the RNA methylation genes of CNV might mediate the aberrant expression of its mRNA and might play a key role in mediating tumor progression.
 |
Figure 3 (A) CNV percentage in each cancer. (B) Heterozygous CNV profile show percentage of heterozygous CNV, including amplification and deletion percentage of heterozygous CNV about each gene in each cancer. Only genes with > 5% CNV in cancers will show corresponding point on the figure. (C) Homozygous CNV profile show percentage of homozygous CNV, including amplification and deletion percentage of homozygous CNV about each gene in each cancer. Only genes with > 5% CNV in cancers will show corresponding point on the figure. (D) The mRNA expression and CNV data were merged by TCGA barcode. We test the association between paired mRNA expression and CNV percent samples, based on Person’s product moment correlation coefficient, and follows a t distribution. |
Methylation Analysis of RNA Methylation Genes
We investigated epigenetic regulation via methylation analysis. As shown in Figure 4A, genes methylation varied significantly in different tumor types. There were more hypermethylated genes than hypomethylated genes in COAD, UCEC, LIHC, PRAD, KIRP, and HNSC. Meanwhile, the number of hypomethylated genes was higher than that of hypermethylated genes in LUSC, THCA, and KIRC. Correlation analysis of methylation and mRNA expression showed that the expression levels of most genes were negatively associated with their methylation levels (Figure 4B). Interestingly, LSM1 in SARC, LIHC, COAD, BLCA, and BRCA and DCP2 in THYM, READ, and GBM were positively correlated with methylation and gene expression (Figure 4B). Survival analysis indicated that the hypermethylation of NUDT4 in KIRC, KIRP, READ, UVM, and ACC as well as that of EIF4A1 in LGG, PAAD, STAD, UVM, and CYFIP1 in PCPG and KIRC were associated with a significantly poor prognosis (Figure 4C). Meanwhile, the hypomethylation of NCBP1, NSUN4, NUDT16 in DLBC as well as that of EIF3D, DCP2, NCBP2 and EIF4E2 in KIRC were correlated with a poor prognosis (Figure 4C).
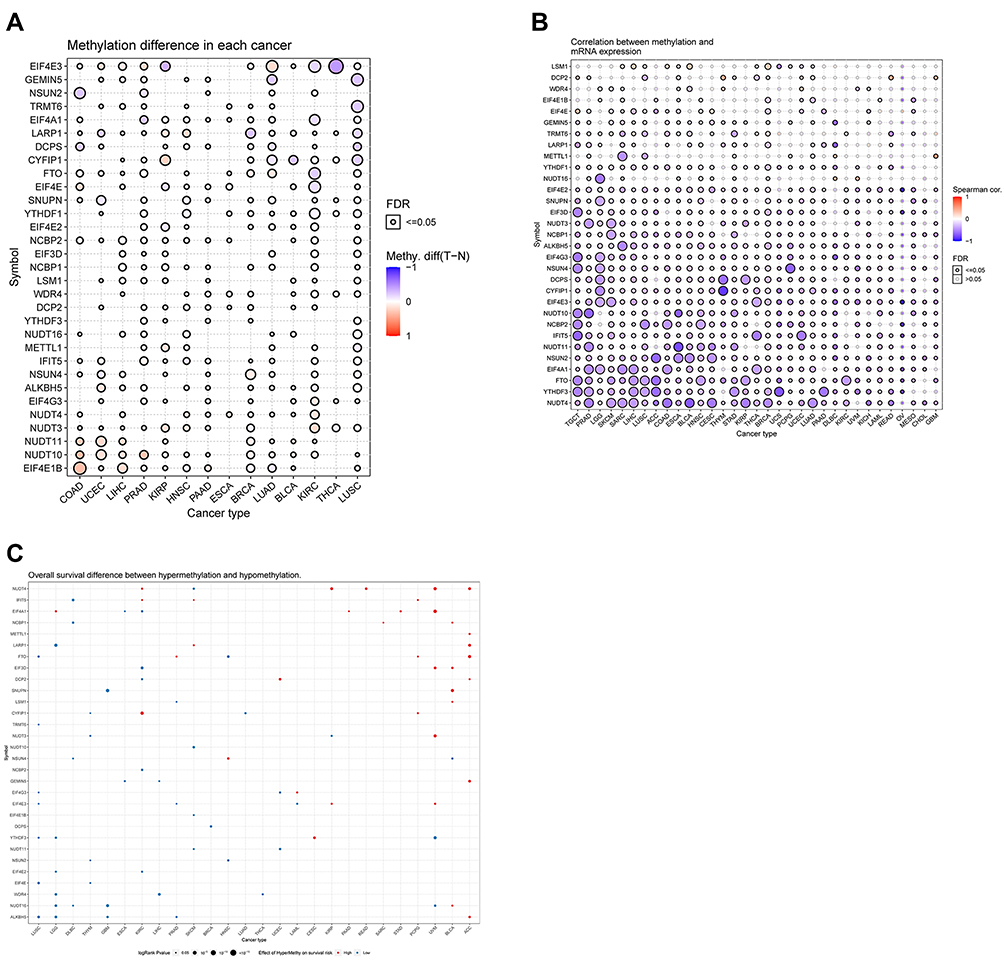 |
Figure 4 (A) Figure summarizes the methyaltion difference between tumor and normal samples of inputted genes in the selected cancers.(B) Figure summarizes the profile of correlations between methylation and mRNA expression of genes in the specific cancers.(C) Figure summarizes the overall survival difference between higher and lower methylation groups in the specific cancers. |
Pathway Activity Analysis and miRNA Regulation Analysis
The pathway included were TSC/mTOR, RTK, RAS/MAPK, PI3K/AKT, hormone ER, hormone AR, EMT, DNA damage response, cell cycle, and apoptosis pathways, which are cancer-related pathways. Based on the pathway relation network, RNA methylation genes are closely correlated with the cancer signaling pathways including apoptosis pathways, DNA damage response, and cell cycle (Sup.Figure S1). Therefore, RNA methylation genes played an essential role in regulating cancer signaling pathways. To determine the regulation of RNA methylation genes by miRNAs, the visNetwork was used to generate miRNA regulatory networks. Sup.Figure S2 shows that miRNAs might regulate the expression of mRNA of RNA methylation genes by targeting NUDT10, NUDT4, CYFP1, EIF4E3, EIF4E2, NUDT11, and EIF4E. In particular, EIF4E and NUDT11 may be downregulated by common miRNAs such as hsa-miR-802. Similarly, EIF4E3 and NUDT11 can be regulated by common miRNAs including hsa-miR-429 and hsa-miR-200b-3p. Thus, the expression of RNA methylation genes might be regulated by miRNA and might affect cancer progression.
Associations Between GSVA Scores and Clinical Stage and Patient Outcomes
A GSVA score for each tumor of the TCGA pan-cancer data was determined using the ssGSEA method of the R package GSVA. Among the 33 tumors, UVM had the highest GSVA score, whereas TGCT had the lowest score (Sup.Figure S3A). As shown in Sup.Figure S3B, there was an association between GSVA score and pan-cancer overall survival (OS), disease-free period (DFI), progression-free period (PFI), and disease-specific survival (DSS). In SARC, LIHC, HNSC, and BRCA, patients with a worse prognosis had a higher score. Hence, there was a close association between GSVA scores and patient outcomes. GSVA scores differed according to the clinical stage of tumors. In ACC, CESC, CHOL, DLBC, ESCA, HNSC, KICH, LUAD, PAAD, and UCEC, as the clinical stage increases, the GSVA scores also increases (Sup.Figure S3C). Pathway analysis of GSVA scores revealed that GSVA scores were positively correlated with apoptosis, cell cycle, and DNA damage and were negatively correlated with TSCmTOR, RTK, and RASMAPK (Sup.Figure S3D). Immuno-infiltration analysis revealed that GSVA scores were negatively correlated with CD4T, Tfh, NK, NKT, MAIT, CD8T, Gamma delta, cytotoxicity, Th2, and Tr1 and were positively correlated with neutrophil, nTreg, Th1, DC, CD8 naive, central memory, iTreg, and effector memory (Sup.Figure S4).
Construction and Evaluation of Prognostic Risk Model
Based on the abovementioned analysis and previous articles, genes had an important and complex role in HCC.19 The genes whose fold changes were >1.5 and with FDR adjusted p-value < 0.05 were determined as differential genes (DEGs).20 Figure 5A shows the association between DEGs, except for YTHDF3 and ALYREF, and most DEGs were positively correlated with each other, thereby suggesting the synergistic role of genes in the development of HCC. We performed LASSO regression analysis, and results showed the most useful predictive genes. LASSO explored the best prognostic model for four genes in HCC, and the following formula was utilized to calculate the risk score for each patient: RiskScore = 0.00437 * ALYREF + 0.21107* NSUN4 +0.12921 * TRMT6 + 0.02425* YTHDF1 (Figure 5B).The risk scores of each patient were calculated based on the risk prediction model. Then, patients with HCC were divided into the high- and low-risk groups based on the median risk score. Kaplan–Meier analysis showed that the high-risk group had a worse survival than the low-risk group (Figure 5C). The PCA determined that high and low risk groups were different components, indicating that a four-gene prognostic risk score model could be distinguished well between the high- and low-risk groups (Figure 5D). When the area under the curves (AUCs) of the ROC is close to 100% (ie the ROC curve approaches the upper left corner), the model is more predictive. In addition, based on the ROC curve analysis, the AUCswere 0.917 at 1 year, 0.803 at 2 years, and 0.896 at 3 years (Figure 5E). Therefore, since all the curves were > 0.65, the abovementioned model was highly accurate in predicting HCC prognosis. The beta values of the TCGA cohort and the expression levels of genes in the validation cohort were used to calculate the risk scores of patients in the validation cohort. Patients with HCC were divided into the high- and low-risk groups based on the median risk score (Figure 6A). It was shown by the Kaplan-Meier survival curve that patients at high-risk had statistically significantly worse prognosis (Figure 6B). Furthermore, the AUC of the 4-gene signature was 0.800, 0.717, and 0.690 at 1, 2, and 3 years, respectively (Figure 6C). PCR results showed that the four genes comprising the prognostic model were still differentially expressed in the validation cohort (Figure 6D). Accordingly, in the Human Protein Atlas, the expression of ALYREF, NSUN4, and TRMT6 proteins was upregulated in HCC tissues compared with normal tissues (Figure 6E).
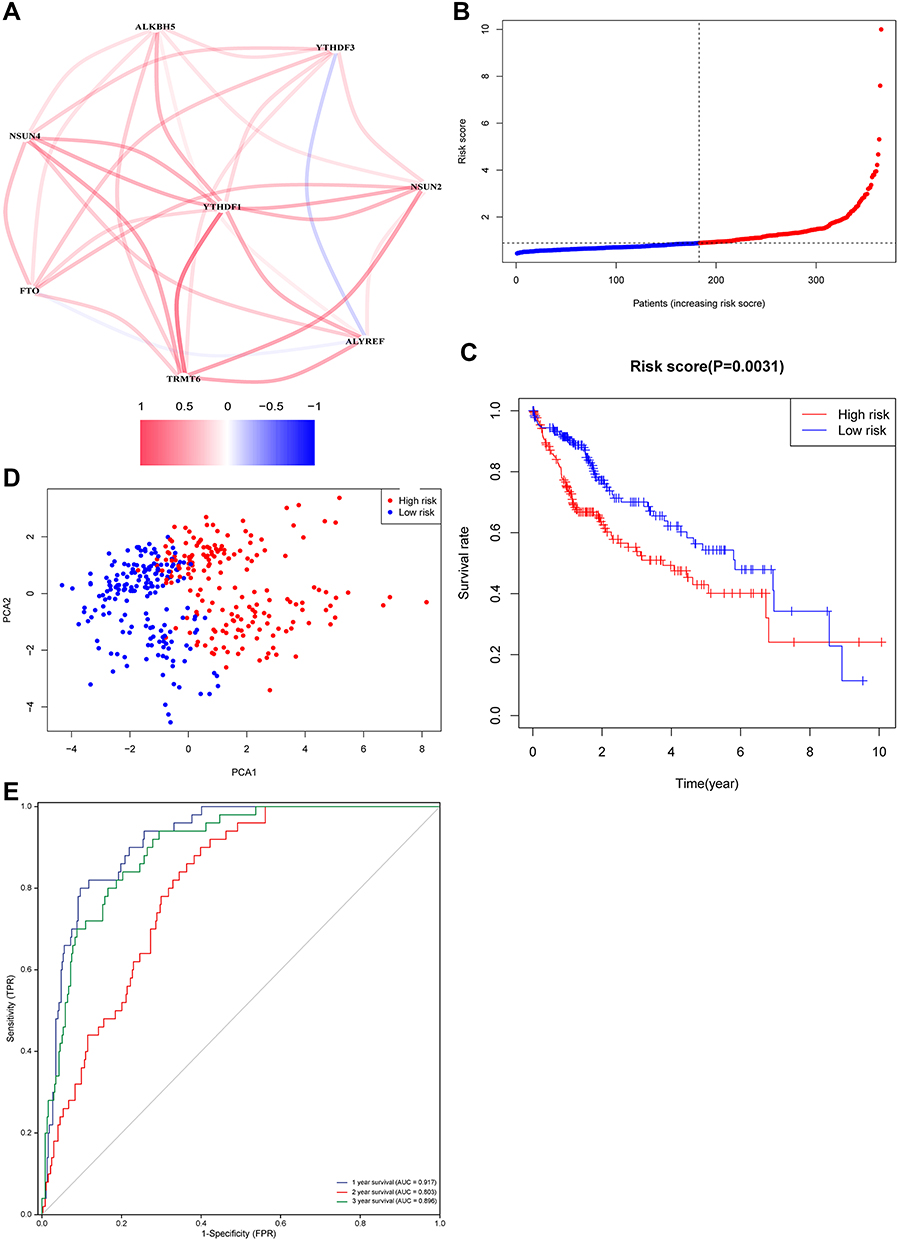 |
Figure 5 (A) The association between DEGs. (B) The risk score distribution and median values. (C) Kaplan–Meier curves showing overall survival of patients in the high-risk and low-risk groups. (D) Principal component analysis (PCA) of the two groups. (E) The area under the curves of time-dependent ROC curves indicates the risk score’s prognostic performance. |
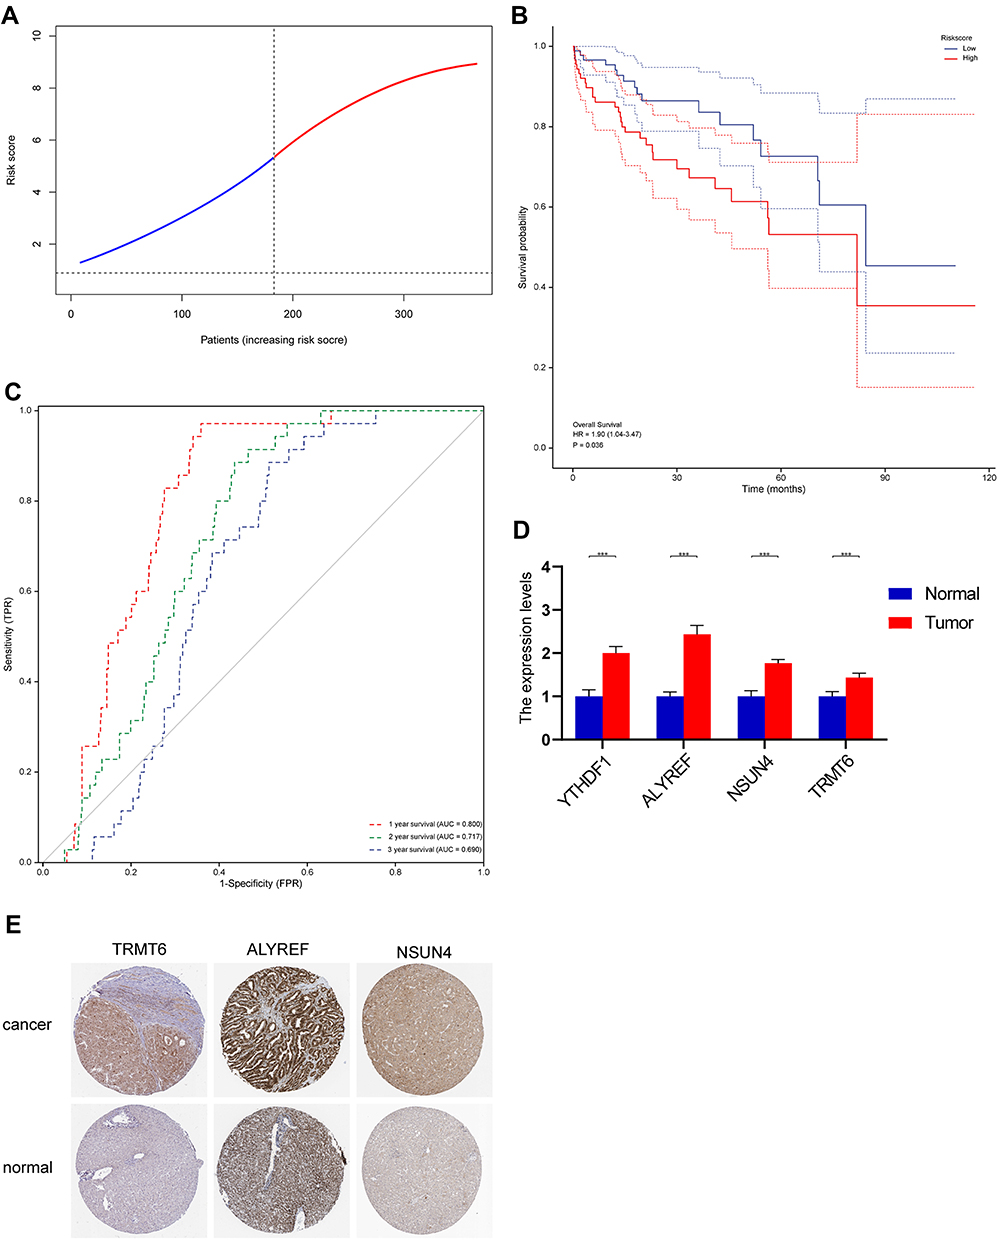 |
Figure 6 (A) Validation cohort was used to validate the genes. (B) Kaplan–Meier curves showing overall survival of patients in the high-risk and low-risk groups. (C) The area under the curves of time-dependent ROC curves indicates the risk score’s prognostic performance. (D) Results of quantitative real-time PCR analysis (***, p < 0.001). (E) The HPA database was used in order to determine protein expression level via immunohistochemistry (IHC) staining and the IHC images were obtained from the HPA database. |
Independent Prognostic Value of the Risk Model
Univariate and multifactorial Cox analyses of the clinicopathological characteristics of patients and the genetic prognostic model risk scores were performed. Univariate Cox analysis showed that age, pathologic stage, T stage, M stage and risk score were the important factors associated with OS. Increasing age, pathologic stage, T stage, M stage, and high risk were risk factors for OS. Multifactorial analysis showed that age and risk score were independent prognostic factors of OS (Table S3).
Enrichment Analysis
We performed GO ontology enrichment analysis of RNA methylation DEGs and found that BP focusing on regulation of cellular amide metabolic process, translational initiation, regulation of translation and CC mainly enriched in eukaryotic translation initiation factor 4F complex, mRNA cap binding complex, RNA cap binding complex, and MF focusing on translation initiation factor activity, RNA 7−methylguanosine cap binding, RNA cap binding. KEGG analysis showed that the mRNA surveillance pathway, RNA degradation, and RNA transport were significantly activated (Figure 7A). Results of ssGSEA showed that the low-risk group had higher levels of aDCs, B cells, DCs, mast cells, neutrophils, NK cells, pDC, T helper cells, and TIL than the high-risk group (Figure 7B). Meanwhile, in the low-risk group, immune-related functions such as cytolytic activity, parainflammation, type I IFN response, and type II IFN response were more active. Meanwhile, MHC class I was significantly more active in the high-risk group (Figure 7C). We analyzed the correlation between RNA methylation genes and immunosuppressive genes. Results showed that most RNA methylation genes were positively correlated with immunosuppressive gene expression, which could explain why high-risk patients had a poor prognosis (Figure 7D).
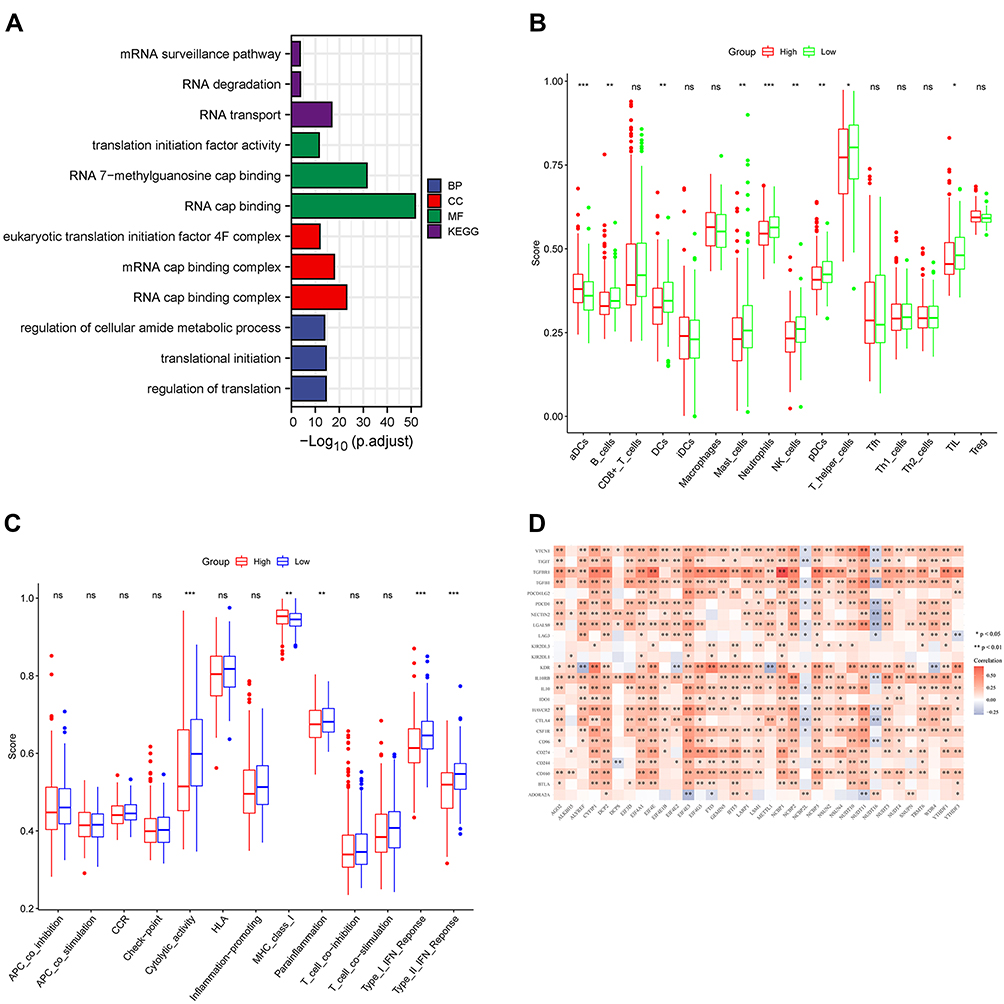 |
Figure 7 (A) Results from gene ontology functional and Kyoto Encyclopedia of Genes and Genomes pathway enrichment analyses for the identified differentially expressed genes. (B and C) The single-sample gene set enrichment analysis scores of different risk groups in the derivation cohort were compared. The scores of 16 immune cells and 13 immune-related functions are displayed in boxplots. (D).Correlation analysis with immunosuppressive genes. *, p < 0.05; **, p < 0.01; ***, p < 0.001; ns, Not significant. |
Drug Sensitivity Analysis
GDSC and CTRP could provide bubble plots to summarize the correlations between input genes and drugs. Blue bubbles represent negative correlations and red bubbles positive correlations. If the color was darker, the correlation was higher. The bubble size was positively correlated with the importance of FDR. Black outline borders indicate an FDR of ≤ 0.05. The positive correlation indicates that the gene expression is resistant to drugs, vise verse. Our analysis identified 30 potential drugs that had the most significant positive correlations with VAF-347, AZD1480, rigosertib, and KX2-391 (Figure 8A and B).
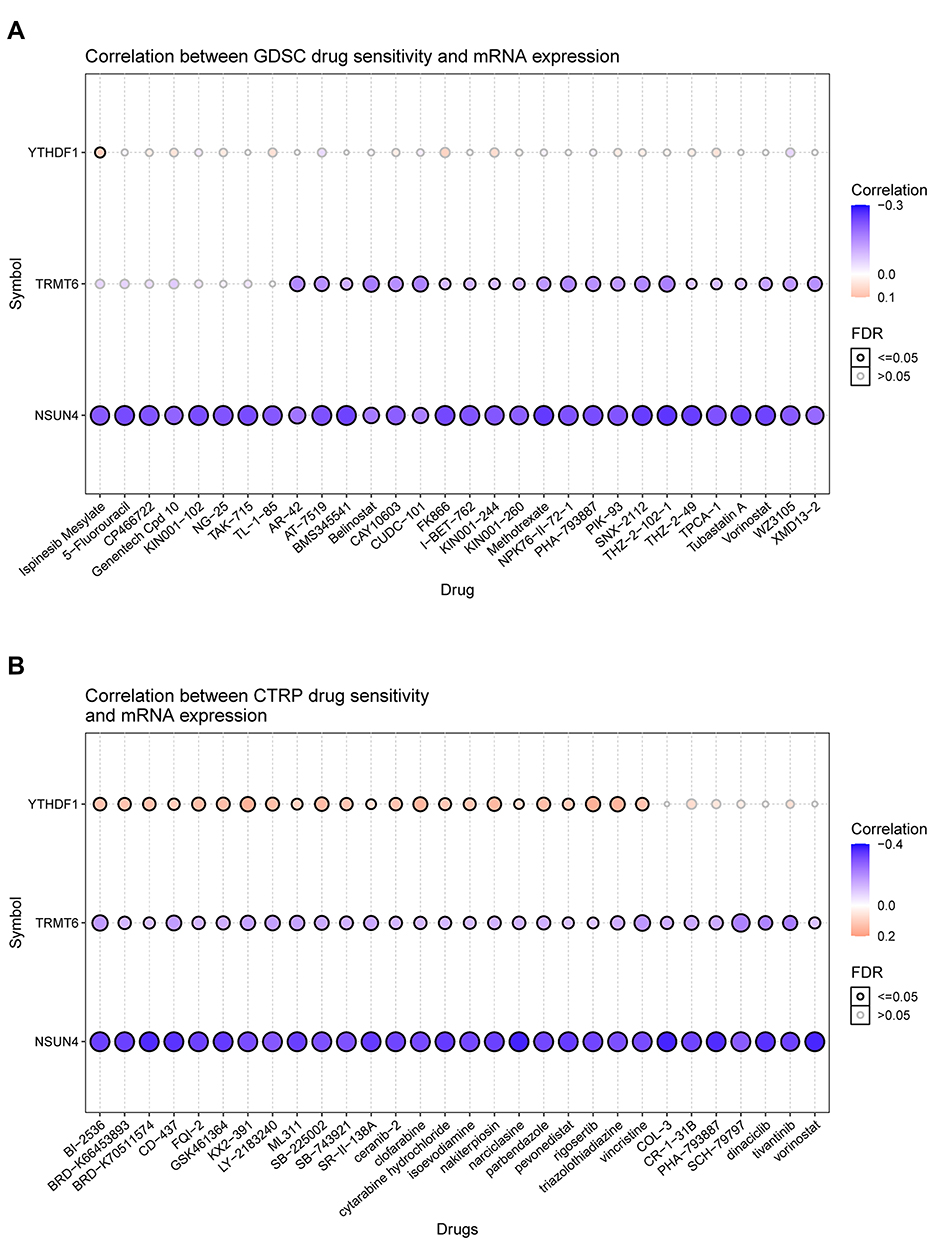 |
Figure 8 (A) Correlation between gene expression and the sensitivity of CTRP drugs (top 30) in pan-cancer. (B) Correlation between gene expression and the sensitivity of GDSC drugs (top 30) in pan-cancer. |
Discussion
Normal methylation modification is involved in regulating different biological processes. Abnormal methylation levels cause disruptions in biological functions, which in turn lead to associated clinical diseases.21,22 Previous studies have shown that RNA methylation is associated with HCC, AML, and cervical squamous cell carcinoma.22,23 In this study, we first provided information about the comprehensive and systematic characterization of RNA methylation genes via multi-omics data analysis. By cautiously examining gene transcription data from TCGA, GTEx, and HPA databases, the expression of RNA methylation genes in different cancer types was mapped, and its correlation with clinical features, prognosis, CNV, functional annotation, and related pathways was investigated. Moreover, a relevant prognostic 4-genes model for HCC was established based on gene expression. Based on this model, patients with HCC had an accurate prognosis. Real-time quantitative reverse transcription was performed to validate differences between cancer and paracancer tissues in terms of the expression of RNA methylation genes in HCC and the correlation between RNA methylation genes and immune genes in pan-cancer.
Based on expression profiling, the expression of RNA methylation genes were frequently high in different tumors. Therefore, the expression of dysregulated or excessive RNA methylation genes could lead to the onset and progression of diseases including cancer. Pan-cancer prognostic analyses indicated that RNA methylation genes were associated with a better survival in CESC and CHOL but with a worse prognosis in ACC, BLCA, and BRCA via Kaplan–Meier and univariate cox regression analyses. Meanwhile, genetic analysis revealed that the frequency of copy number alterations in RNA methylation genes was high. Gene expression analysis confirmed that CNV was positively correlated with the expression of RNA methylation genes, particularly YTHDF1, NCBP2, LSM1, and NSUN2. Hence, CNV may affect the expression of RNA methylation genes, which then results in tumorigenesis. Epigenetic analysis showed that NUDT16, EIF4E2, SNUPN, and EIF3D aberrant hypermethylation mediated their downregulation, and it was associated with poor survival in several cancer types. For example, hypermethylation of NUDT4, EIF4A1, EIF3D, and NUDT3 in UVM was associated with poor patient prognosis, and the same trend was observed in NUDT16, SNUPN, and FTO in BLCA. Therefore, genetic and epigenetic modifications of genes can lead to dysfunction and can be involved in tumorigenesis in some cases. RNA methylation genes play such an important role in cancer. Therefore, their regulatory molecules should be identified. Via the miRNA-mRNA interaction network, NUDT10, NUDT4, CYFP1, and EIF4E3 could be regulated by miRNAs.
In view of the role of RNA methylation genes in tumors, an RNA methylation gene-based prognostic model was established based on related studies.19 Results showed that the model was a more accurate predictor of patient prognosis and that low-risk patients had a higher degree of immune infiltration and expression of immunosuppressive genes than low-risk patients. In mRNA, m5C modification can have a significant effect on metabolism. ALYREF is thought to increase the efficiency of nuclear-cytoplasmic export by forming a complex with mRNA. Previous experiments have confirmed that NSUN2 mediates mRNA transport, which facilitates ALYREF binding to mRNA.6 High expression of ALYREF is associated with poor prognosis in patients with HCC.24 Previous studies claim that NSUN4 primarily catalyzes methylation modifications in 25s rRNA. NSUN4 protein is frequently found in mitochondria and also affects the regulation of the last step of ribosome biogenesis;25 HCC patients with high NSUN4 expression have a poorer prognosis. As an emerging hot topic for discussion, further exploration is still needed regarding m1A modification and HCC.26,27 TRMT6 may be involved in the regulation of the PI3K/Akt signaling pathway, which plays a key role in the proliferation and inhibition of apoptosis in HCC.27 YTHDF1 acts as a “reader” of m6A, and there is growing evidence that facilitated translation positively regulates the role of YTHDF1.19 YTHDF1 plays “Promote proliferation, migration, and invasion” role in HCC via PI3K/Akt/mTOR.19,26,28 In addition, GDSC and CTRP database analysis was performed to identify whether VAF-347, AZD1480, rigosertib, and KX2-391 are potential therapeutic agents in HCC. The sample size in the current study is a major limitation. We should subsequently expand the sample size and increase the variety of tumours. Confirmation of the results of the current study requires additional prospective studies.
Conclusion
Our prognostic model could accurately predict prognosis in patients with HCC. Moreover, RNA methylation genes were regulated by miRNAs, and RNA methylation genes could be targeted in drug therapy.
Abbreviations
ACC, adenoid cystic carcinoma; AR, androgen receptor; AUC, area under the receiver operating characteristic curve; BLCA, bladder urothelial carcinoma; BRCA, breast cancer; CHOL, cholangiocarcinoma; CNV, copy number variation; COAD, colon adenocarcinoma; CTRP, Cancer Therapeutics Response Portal; DFS, disease-free survival; DLBC, diffuse large B-cell lymphoma; DSS, disease-specific survival; EMT, epithelial-mesenchymal transition; ER, estrogen receptor; ESCA, esophageal carcinoma; FC, fold-change; FDR, false discovery rate; GBM, glioblastoma; GDSC, Genomics of Drug Sensitivity in Cancer; GTEx, Genotype-Tissue Expression Portal; HR, hazard ratio; IC50, half-maximal inhibitory concentration; ICB, immune-checkpoint blockade; KICH, kidney chromophobe; KIRC, renal clear cell carcinoma; KIRP, kidney renal papillary cell carcinoma; LAML, acute myeloid leukemia; LGGs, low-grade gliomas; LICH, liver hepatocellular carcinoma; LUAD, lung adenocarcinoma; LUSC, lung squamous cell carcinoma; MESO, mesothelioma; miRNA, microRNA; MSI, microsatellite instability; OS, overall survival; OS, overall survival; OV, ovarian cancer; PAAD, pancreatic adenocarcinoma; PAS, pathway activity score; PCPG, pheochromocytoma/paraganglioma; PFS, progression-free survival; PRAD, prostate adenocarcinoma; READ, rectum adenocarcinoma; RPPA, reverse-phase protein array; SKCM, skin cutaneous melanoma; SNV, single-nucleotide variation; TCGA, The Cancer Genome Atlas; TGCT, Tenosynovial giant cell tumor; THCA, thyroid cancer; THYM, thymoma; Ti, transitions; TMB, tumor mutational burden; TME, tumor microenvironment; TPM, transcripts per million; TV, transversions; UCEC, uterine corpus endometrial carcinoma; UCS, uterine carcinosarcomas; UVM, uveal melanoma.
Data Sharing Statement
Relevant data is shared through the following links https://www.jianguoyun.com/p/DTxwjYMQxIjqCRjvrowEIAA.
Ethics Approval and Consent to Participate
All procedures involving human participants were carried out in accordance with the Scientific Research Projects Approval Determination of Independent Ethics Committee of Shanghai Ninth People’s Hospital, Shanghai Jiao Tong University School of Medicine, with the 1964 Helsinki Declaration and its later amendments or comparable ethical standards.
Consent for Publication
We consent for publication.
Acknowledgments
We thank Bullet Edits Limited for the linguistic editing and proofreading of the manuscript. No matter the old village doctors who are going to retire or the young who just set foot on the job, they have no regrets, no conditions and actively participated in the front-line work of epidemic prevention and control in China.
Author Contributions
All authors made substantial contributions to conception and design, acquisition of data, or analysis and interpretation of data; took part in drafting the article or revising it critically for important intellectual content; agreed to submit to the current journal; gave final approval of the version to be published; and agree to be accountable for all aspects of the work.
Funding
This study received Fundamental research program funding of Ninth People’s Hospital affiliated to Shanghai Jiao Tong university School of Medicine (No. JYZZ076), Clinical Research Program of Ninth People’s Hospital, Shanghai Jiao Tong University School of Medicine (No. JYLJ201801, JYLJ201911), the China Postdoctoral Science Foundation (No. 2017M611585) and the National Natural Science Foundation of China (No. 81871458).
Disclosure
The authors report no conflicts of interest in this work.
References
1. Siegel RL, Miller KD, Jemal A. Cancer statistics, 2020. CA. 2020;70(1):7–30. doi:10.3322/caac.21590
2. Ozer B, Sezerman U. Analysis of the interplay between methylation and expression reveals its potential role in cancer aetiology. Funct Integr Genomics. 2017;17(1):53–68. doi:10.1007/s10142-016-0533-9
3. Feng P, Ding H, Yang H, et al. iRNA-PseColl: identifying the occurrence sites of different RNA modifications by incorporating collective effects of nucleotides into PseKNC. Mol Ther Nucleic Acids. 2017;7:155–163. doi:10.1016/j.omtn.2017.03.006
4. Roundtree IA, Evans ME, Pan T, et al. Dynamic RNA modifications in gene expression regulation. Cell. 2017;169(7):1187–1200. doi:10.1016/j.cell.2017.05.045
5. Liu N, Zhou KI, Parisien M, et al. N6-methyladenosine alters RNA structure to regulate binding of a low-complexity protein. Nucleic Acids Res. 2017;45(10):6051–6063. doi:10.1093/nar/gkx141
6. Yang X, Yang Y, Sun B, et al. 5-methylcytosine promotes mRNA export - NSUN2 as the methyltransferase and ALYREF as an m(5)C reader. Cell Res. 2017;27(5):606–625. doi:10.1038/cr.2017.55
7. Bolatkan A, Asada K, Kaneko S, et al. Downregulation of METTL6 mitigates cell progression, migration, invasion and adhesion in hepatocellular carcinoma by inhibiting cell adhesion molecules. Int J Oncol. 2022;60(1):4. doi:10.3892/ijo.2021.5294
8. Choi J, Hong S, Woo HG. Pan-cancer analysis of systematic batch effects on somatic sequence variations. BMC Bioinform. 2017;18(1):211. doi:10.1186/s12859-017-1627-7
9. Khezri A, Narud B, Stenseth E, et al. Sperm DNA hypomethylation proximal to reproduction pathway genes in maturing elite norwegian red bulls. Front Genet. 2020;11:922. doi:10.3389/fgene.2020.00922
10. Zengin T, önal-Süzek T. Analysis of genomic and transcriptomic variations as prognostic signature for lung adenocarcinoma. BMC Bioinform. 2020;21(Suppl 14):368. doi:10.1186/s12859-020-03691-3
11. Wang X, Li G, Zhang Y. Pan-cancer analysis reveals genomic and clinical characteristics of TRPV channel-related. Genes. 2022;2022:9125–9133.
12. Zhang J, Jiang H, Du K, et al. Pan-cancer analyses reveal genomics and clinical characteristics of the melatonergic regulators in cancer. J Pineal Res. 2021;71(3):e12758. doi:10.1111/jpi.12758
13. Schlattl A, Anders S, Waszak SM, et al. Relating CNVs to transcriptome data at fine resolution: assessment of the effect of variant size, type, and overlap with functional regions. Genome Res. 2011;21(12):2004–2013. doi:10.1101/gr.122614.111
14. Harris MA, Clark J, Ireland A, et al. The Gene Ontology (GO) database and informatics resource. Nucleic Acids Res. 2004;32:D258–D261. doi:10.1093/nar/gkh036
15. Che X, Qi X, Xu Y, et al. Genomic and transcriptome analysis to identify the role of the mTOR pathway in kidney renal clear cell carcinoma and its potential therapeutic significance. oxid med cell longev. 2021;2021(6613151). doi:10.1155/2021/6613151
16. Sharifnia T, Wawer MJ, Chen T, et al. Small-molecule targeting of brachyury transcription factor addiction in chordoma. Nat Med. 2019;25(2):292–300. doi:10.1038/s41591-018-0312-3
17. Woo XY, Giordano J, Srivastava A, et al. Conservation of copy number profiles during engraftment and passaging of patient-derived cancer xenografts. Nat Genet. 2021;53(1):86–99. doi:10.1038/s41588-020-00750-6
18. Su C, Li D, Li N, et al. Studying the mechanism of PLAGL2 overexpression and its carcinogenic characteristics based on 3’-untranslated region in colorectal cancer. Int J Oncol. 2018;52(5):1479–1490. doi:10.3892/ijo.2018.4305
19. Xu Y, Zhang M, Zhang Q, et al. Role of main RNA methylation in hepatocellular carcinoma: N6-methyladenosine, 5-methylcytosine, and N1-methyladenosine. Front Cell Dev Biol. 2021;9:767668. doi:10.3389/fcell.2021.767668
20. Li X, Zhang L, Li X, et al. A pyroptosis-related gene signature for predicting survival in glioblastoma. Front Oncol. 2021;11:697198. doi:10.3389/fonc.2021.697198
21. Shao X, Dong J, Zhang H, et al. Systematic analyses of the role of the reader protein of N (6)-methyladenosine RNA methylation, YTH domain family 2, in liver hepatocellular carcinoma. Front Mol Biosci. 2020;7:577460. doi:10.3389/fmolb.2020.577460
22. Du K, Zhang L, Lee T, et al. m(6)A RNA methylation controls neural development and is involved in human diseases. Mol Neurobiol. 2019;56(3):1596–1606. doi:10.1007/s12035-018-1138-1
23. Chen X, Zhang J, Zhu J. The role of m(6)A RNA methylation in human cancer. Mol Cancer. 2019;18(1):103. doi:10.1186/s12943-019-1033-z
24. Mann GV, Newton P. The membrane transport of ascorbic acid. Ann N Y Acad Sci. 1975;258(1 Second Confer):243–252. doi:10.1111/j.1749-6632.1975.tb29285.x
25. Metodiev MD, Spåhr H, Loguercio Polosa P, et al. NSUN4 is a dual function mitochondrial protein required for both methylation of 12S rRNA and coordination of mitoribosomal assembly. PLoS Genet. 2014;10(2):e1004110. doi:10.1371/journal.pgen.1004110
26. Fu H, Lin X, Zhu Y, et al. Circ-IGF1R has pro-proliferative and anti-apoptotic effects in HCC by activating the PI3K/AKT pathway. Gene. 2019;716:144031. doi:10.1016/j.gene.2019.144031
27. Shi Q, Xue C, Yuan X, et al. Gene signatures and prognostic values of m1A-related regulatory genes in hepatocellular carcinoma. Sci Rep. 2020;10(1):15083. doi:10.1038/s41598-020-72178-1
28. Li Q, Ni Y, Zhang L, et al. HIF-1α-induced expression of m6A reader YTHDF1 drives hypoxia-induced autophagy and malignancy of hepatocellular carcinoma by promoting ATG2A and ATG14 translation. Signal Transduct Target Ther. 2021;6(1):76. doi:10.1038/s41392-020-00453-8
 © 2022 The Author(s). This work is published and licensed by Dove Medical Press Limited. The
full terms of this license are available at https://www.dovepress.com/terms
and incorporate the Creative Commons Attribution
- Non Commercial (unported, 3.0) License.
By accessing the work you hereby accept the Terms. Non-commercial uses of the work are permitted
without any further permission from Dove Medical Press Limited, provided the work is properly
attributed. For permission for commercial use of this work, please see paragraphs 4.2 and 5 of our Terms.
© 2022 The Author(s). This work is published and licensed by Dove Medical Press Limited. The
full terms of this license are available at https://www.dovepress.com/terms
and incorporate the Creative Commons Attribution
- Non Commercial (unported, 3.0) License.
By accessing the work you hereby accept the Terms. Non-commercial uses of the work are permitted
without any further permission from Dove Medical Press Limited, provided the work is properly
attributed. For permission for commercial use of this work, please see paragraphs 4.2 and 5 of our Terms.