Back to Journals » Diabetes, Metabolic Syndrome and Obesity » Volume 13
Correlation Between Serum Uric Acid Level and Central Body Fat Distribution in Patients with Type 2 Diabetes
Authors Zong J, Sun Y, Zhang Y, Yuan J, Wang X ![]() , Zhang R, Zhao X, Zhao X, Gu Y
, Zhang R, Zhao X, Zhao X, Gu Y
Received 1 May 2020
Accepted for publication 25 June 2020
Published 16 July 2020 Volume 2020:13 Pages 2521—2531
DOI https://doi.org/10.2147/DMSO.S260891
Checked for plagiarism Yes
Review by Single anonymous peer review
Peer reviewer comments 2
Editor who approved publication: Professor Ming-Hui Zou
Jing Zong,1,2,* Yi Sun,1,* Yiqian Zhang,1,3 Jin Yuan,1 Xinlei Wang,1 Rongping Zhang,1 Xiaoqin Zhao,1 Xuying Zhao,1 Yunjuan Gu1
1Department of Endocrinology and Metabolism, The Affiliated Hospital of Nantong University, Nantong, Jiangsu Province, People’s Republic of China; 2Geriatric Department, Nantong First Geriatric Hospital, Nantong, Jiangsu Province, People’s Republic of China; 3Department of Endocrinology and Metabolism, Changshu No.1 People’s Hospital, Nantong, Jiangsu Province, People’s Republic of China
*These authors contributed equally to this work
Correspondence: Yunjuan Gu
Department of Endocrinology and Metabolism, The Affiliated Hospital of Nantong University, 20 Xisi Road, Nantong, Jiangsu Province, People’s Republic of China
Tel +86 15851207860
Fax +86-513-8116-1906
Email [email protected]
Background: The aim of this study was to investigate the correlation between serum uric acid level and central body fat distribution in patients with type 2 diabetes (T2DM).
Methods: A total of 867 patients with T2DM were enrolled. Measurements of central fat distribution were obtained by dual energy X-ray absorptiometry. Patients were stratified into three groups according to their levels of serum uric acid (SUA). Multiple linear regression analysis was used to determine the association between SUA and central body fat distribution. Logistic regression analysis was used to estimate the risk factors for hyperuricemia (HUA). Mediation analysis was applied to assess the overall, direct, and indirect mediators of SUA levels.
Results: Multiple linear regression analysis showed that SUA levels were significantly positively correlated with waist circumference (WC), body mass index (BMI), visceral adipose tissue (VAT), subcutaneous adipose tissue (SAT), Android fat mass, Gynoid fat mass, fasting c-peptide (F-CP), and area under the curve of C-peptide (P < 0.05 for all). VAT [odds ratio (OR), 2.367; 95% confidence interval (CI), 1.078– 5.197; P < 0.001)], WC (OR, 1.041; 95% CI, 1.011– 1.072; P < 0.001), high-density lipoprotein (OR, 0.274; 95% CI, 0.104– 0.727; P < 0.001), and estimated glomerular filtration rate (OR, 0.966; 95% CI, 0.959– 0.973; P < 0.001) were found to be independent risk factors for T2DM patients with HUA. After mediation analysis, BMI and central obesity were found to have different partial effects on the association between SUA and F-CP (P < 0.001).
Conclusion: In patients with T2DM, HUA was positively correlated with F-CP and central body fat distribution, especially VAT. These results suggest that central obesity may play a role in the positive correlation between HUA and insulin resistance (IR).
Keywords: serum uric acid, central obesity, type 2 diabetes, insulin resistance
Background
Type 2 diabetes mellitus (T2DM) and hyperuricemia (HUA) are the two most common metabolic diseases in the world. They can occur together or sequentially in any given individual. In China, the prevalence of T2DM with HUA has risen to 32.6%.1 Previous studies have shown that there is a correlation between serum uric acid (SUA) levels and T2DM.2–4 For every 1 mg/dL increment in SUA, the overall incidence of diabetes, diabetic microvascular complications, and death increases by 17%,5 28%, and 9%, respectively.6 However, factors that impact the correlation between T2DM and SUA are still unknown.
Cross-sectional studies have confirmed a positive association between HUA and insulin resistance (IR) in patients with T2DM.7,8 Recently, the potential effect of adipose tissue on IR has attracted attention. Basic studies have found that soluble uric acid upregulates the tissue level of reduced nicotinamide adenine dinucleotide phosphate (NADPH) oxidase in mature adipose tissue and increases the production of reactive oxygen species (ROS).9 Under oxidative stress, adipose tissue can lead to decreased insulin sensitivity. Adipose tissue can also secrete uric acid, possibly owing to upregulation of xanthine oxidase (XOR) expression and enzymatic activity in adipose cells.10
There are two types of adipose tissue distribution: subcutaneous adipose tissue (SAT) and visceral adipose tissue (VAT), which have different morphologies and functions.11 A major difference between SAT and VAT is that VAT has strong fat decomposition activity. Once VAT accumulates, it releases free fatty acids (FFA) into the portal circulation, which then flow to the liver and other organs, such as muscle, pancreas, and kidney. This process, which is referred to as “ectopic fat disposition” leads to lipotoxicity, IR, release of inflammatory cytokines and chemokines, and metabolic disorders.12,13 Compared with abdominal subcutaneous fat, SUA level is more significantly associated with visceral fat.14 Non-alcoholic fatty liver disease (NAFLD) is a serious manifestation of visceral fat accumulation.15,16 In 1,365 obese adults, Liu et al reported that SUA level independently correlated with the risk of NAFLD.17 After 6 years of follow-up in 14,442 healthy adults, Yang et al found that 29.2% of participants developed new metabolic diseases with NAFLD being the main risk factor.18 For each 1 mg/dL increase in SUA, NAFLD risk increased 1.094 and 1.148 times in male and female participants, respectively.
Serum uric acid levels were also associated with cardiovascular disease, metabolic syndrome and non-dipping hypertension.19–21 Cortese et al19 showed a strong correlation between uric acid and cardiovascular disease, and that serum uric acid has a direct impact on arterial hypertension, asymptomatic and overt atherosclerotic cardiovascular diseases, heart failure and atrial fibrillation through multiple pathogenic mechanisms. De Pergola et al20 showed that hyperuricemia is not a product of the metabolic syndrome, but high uric acid level may predict the risk of metabolic syndrome. Zupo et al21 found that obese non-dipping hypertension patients tended to have lower serum uric acid levels than dipping hypertension patients, which may be related to the antioxidant properties of uric acid.
Factors underlying the association between SUA, IR, and central obesity remain unclear. The aim of this study was to determine the association between SUA, IR, and central fat distribution in patients with T2DM and to identify mediators of this correlation in patients with T2DM.
Patients and Methods
Participants
A total of 867 people with T2DM, ranging in age from 20 to 89 years, that were inpatients in the Department of Endocrinology and Metabolism at the Affiliated Hospital of Nantong University between February 2017 and October 2018 were enrolled in the study. The T2DM diagnostic criteria were based on the 1999 WHO diabetes diagnosis and classification standard.
Exclusionary criteria included type 1 diabetes; other special types of diabetes and secondary diabetes; acute complications of diabetes; infection; serious diseases of heart, lung, brain, liver, kidney, and mental health; malignant tumor; pregnancy or lactation; other serious systemic diseases; and the use of drugs that affect uric acid metabolism.
Based on the optimal reference range for SUA,22 participants were divided into three groups: 64 patients had a SUA ≤ 3 mg/dL; 412 patients had a SUA > 3 mg/dL and ≤ 5 mg/dL; and 391 patients had a SUA > 5 mg/dL.
This study was performed in accordance with the Declaration of Helsinki and approved by the Clinical Ethics Committee of the Affiliated Hospital of Nantong University (2018-K016). Written informed consent was obtained from each patient.
Clinical Parameters and Laboratory Measurements
Data regarding patients’ sex, age, duration of diabetes and treatments were collected. Anthropometric parameters, including blood pressure [systolic blood pressure (SBP) and diastolic blood pressure (DBP)], body height and weight, and waist circumstance (WC), were measured. BMI was calculated as kg/m2. Blood samples were collected in the morning after an overnight fast of at least 8 hours. Serum fasting plasma glucose (FPG), triglycerides (TG), total cholesterol (TC), low-density lipoprotein cholesterol (LDL-c), high-density lipoprotein cholesterol (HDL-c), serum creatinine (SCr), alanine aminotransferase (ALT), and serum uric acid (SUA) levels were measured with a Hitachi 7600–110 (Hitachi; Tokyo, Japan). HbA1c was assessed by high-performance liquid chromatography (BioRad; Hercules, CA). A BioSystems A25 automatic specific protein analyzer was used to measure the second urine microalbumin/creatinine ratio (UACR) in the morning. A Roche e411 automatic electrochemiluminescence immunoassay (Tokyo, Japan) was used to determine Insulin and C-peptide levels at 0, 30, 60, 90, 120, 150, and 180 min via a 100 g standard steamed bread meal insulin release test. The area under the curve of insulin (AUCINS) and C-peptide (AUCCP) was calculated.
Central Fat Distribution Measurements
Central fat distribution was measured by dual energy X-ray absorptiometry (DXA) (GE Healthcare, Madison, WI, USA) using enCORE software.23 All participants were scanned by the same operator according to the same protocol. A quality control scan was performed daily using a calibration phantom provided by the manufacturer. Before and during their scan, participants removed all metal objects and laid flat on the scanning table with their arms at their sides and their palms facing their thighs.
The region of interest (ROI)24 in the body was automatically drawn by the software based on anatomical landmarks and then double checked by the operator to ensure the best position. Two ROIs were used in this study: an Android ROI and a Gynoid ROI. The Android area, also known as the male fat area (approximately 10 cm high), contains part of the abdomen. Its lower boundary is the transverse line of the ilium. And its upper border is above the transverse line of the ilium, which is about 20% of the distance between the transverse line of the ilium and the tangent line below the head. The side boundary is the arm tangent. The Gynoid area, also known as the female fat area, is twice the Android area. It is the part of the leg, includes part of the hip and the strand. The upper border is the transverse line of the greater trochanter and the lower border is twice the distance of the Android area from the upper border. The lateral boundary is the tangent to the lateral leg.
The central fat distribution pattern is defined as the ratio of Android/Gynoid fat or, in other words, the ratio of male area fat mass (g) divided by female area fat mass (g). The Android ROI visceral fat mass was automatically calculated using the CoreScan algorithm in enCORE. Abdominal subcutaneous fat mass25 = Android fat mass - visceral fat mass.
Formulas
Modification of Diet in Renal Disease equation - estimated glomerular filtration rate (MDRD-eGFR) [mL/(min. 1.73 m2)] = 30,849 × [serum creatinine (μmol/L) - 1.154 × (age) - 0.203] × 0.742 (female).26 IR index (HOMA-IR) = [fasting insulin (μIU/mL) × fasting blood glucose (mmol/L)]/22.5.27 Insulin sensitivity index (HOMA-IS) = 22.5/[fasting insulin (μIU/mL) × fasting blood glucose (mmol/L)].27 AUC28 = 15 × fasting value + 30 × (30 min value + 180 min value) + 45 × 60 min value + 60 × 120 min value. AUCINS and AUCCP represent the area under the insulin curve and the area under the C-peptide curve, respectively. HUA is defined as SUA greater than 7 mg/dL in men and 6 mg/dL in women.29
Statistical Analysis
A statistical analysis was performed using SPSS 24.0 (SPSS Inc.; Chicago, IL, USA). Basic descriptive statistics were calculated, including means, standard deviations, ranges, and percentages. The normality of the distribution was examined by the Kolmogorov–Smirnov test. Mean values between two independent groups were compared using the Mann–Whitney U-test for continuous variables and the χ2 test for categorical parameters. Comparisons between more than two subgroups were performed using ANOVA and Kruskal–Wallis H-tests. Correlations were analyzed using Pearson and Spearman correlation tests. Multiple linear regression analysis was used to analyze the association between SUA and central obesity-related parameters and islet β-cell function-related parameters. Logistic regression analysis was used to estimate the risk factors for HUA in patients with T2DM. Differences were considered statistically significant if the two-tailed P-value was < 0.05.
Mediation analysis was used to assess the overall, direct, and indirect effects of measured parameters, including fasting C-peptide, BMI, and variables of central obesity distribution, on SUA.30,31 Using this approach, the “total effect” can be broken down into “direct effects” (not mediated by BMI or central obesity parameters; Supplemental Figure 1) and “indirect effects” (mediated by BMI and central obesity parameters; Supplemental Figure 1). This analysis was performed using the SPSS macro developed by Preacher and Hayes.32 The coefficient product test was used because it has the potential to detect mediated effects without significant intervention effects.30,31 First, the “total effect” (gamma coefficient) of SUA on the outcome variable (F-CP) was estimated by regression, while the covariates used in the first step were adjusted but the medium was not. The “action theory” was then used to examine the effect of SUA on the hypothetical medium (BMI, central fat parameters; alpha coefficient). The “conceptual theory” test determines the association between the change in the hypothetical medium and the change in the outcome variable (BMI, central obesity parameter; beta coefficient). This analysis also estimates the direct (γ’ path) and indirect (coefficient product α#β) effects. The ratio of the mediation effect was calculated using the following equation [α#β/(α#β+γ)]. When the total effect (γ path) is significant, the direct effect (γ’ path) is not significant, and α#β is significant, then there is a complete mediating effect. When the total effect is significant and the direct effect and α#β are both significant, then there is a partial or incomplete mediating effect. When the total effect is significant, the direct effect is significant, and α#β is not significant, then there is no mediating effect.
Results
Clinical Characteristics
There were 377 (40.98%) women and 543 (59.02%) men in the study. The average age was 63.2 ± 8.8 and 56.2 ± 14.7 years for women and men, respectively. Of all patients, 86.5% were treated with insulin or insulin combined with oral hypoglycemic agents to control T2DM. According to the reference range for SUA,22 all subjects were divided into three groups as shown in Table 1.
 |
Table 1 Comparisons of Clinical Characteristics of T2DM Patients with Different Serum Uric Acid Levels |
There was no significant difference in age, diabetic duration or treatments among the three groups (Table 1, P > 0.05). In the higher SUA group, there was a significantly higher proportion of men; significantly higher levels of SBP, DBP, WC, BMI, TG, TC, ALT, and UACR; and significantly lower eGFR and HDL levels (P < 0.05 for all). There was no significant difference in LDL among the three groups (P = 0.177).
The higher SUA group had significantly lower levels of HbA1c, FPG, and HOMA-IS while fasting insulin, F-CP, HOMA-IR, and AUCCP were significantly increased compared with the other two groups (P < 0.05 for all). There was no significant difference in AUCINS among the three groups (P = 0.082).
Central Obesity Distribution
As shown in Figure 1, Android fat mass, Gynoid fat mass, Android/Gynoid fat mass ratio, SAT mass, VAT mass, and VAT/SAT ratio were significantly increased in the higher SUA group (P < 0.001).
 |
Figure 1 Comparison of central obesity distribution among different uric acid levels. (A) difference of Android fat mass (g) among the three groups; (B) difference of Gynoid fat mass (g) among the three groups; (C) difference of Android/Gynoid ratio among the three groups; (D) difference of abdominal subcutaneous fat mass among three groups; (E) difference of visceral fat mass among three groups; (F) difference of visceral fat/abdominal subcutaneous fat ratio among three groups. *: P values for the comparison of two groups. **: P values for the comparison of two groups. Abbreviations: SUA, uric acid; SAT, subcutaneous adipose tissue; VAT, visceral adipose tissue. |
Correlation Between SUA and Clinical Variables
As shown in Table 2, SUA was significantly positively correlated with SBP, DBP, weight, BMI, WC, TG, TC, UACR, ALT, F-CP, and AUCCP; while SUA was significantly negatively correlated with age, eGFR, HDL, HbA1c, FPG, and HOMA-IS (P < 0.05 for all). SUA was not correlated with diabetic duration, LDL, fasting insulin, HOMA-IR, or AUCINS (P > 0.05 for all).
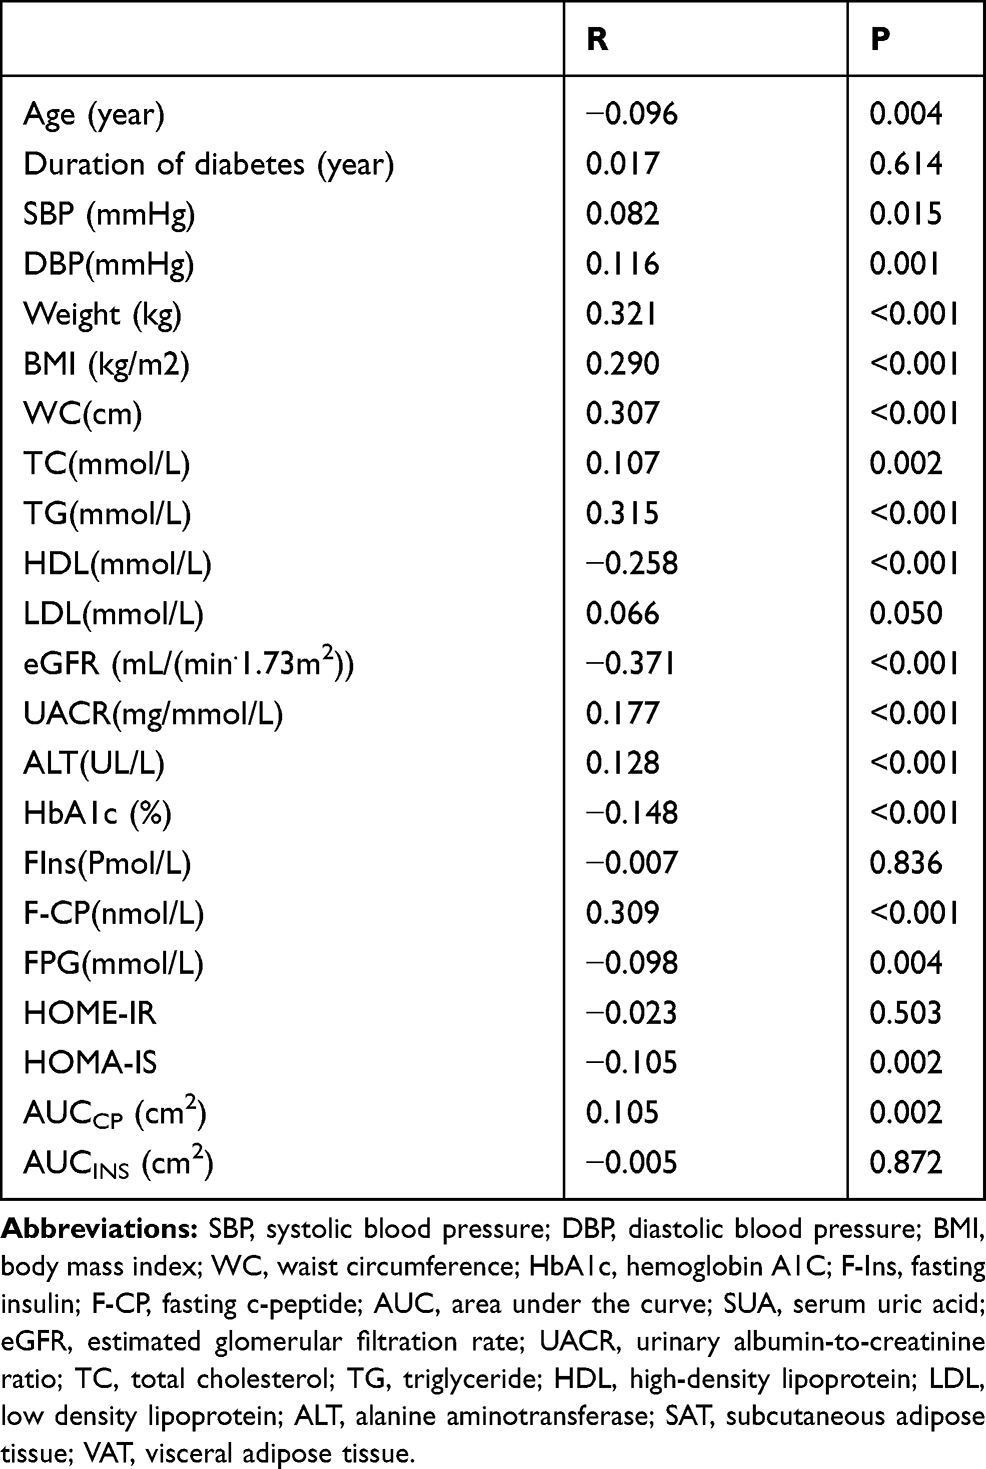 |
Table 2 Correlation Between Serum Uric Acid Level and Clinical Variables |
Correlation Between SUA and Central Obesity Distribution
SUA was significantly positively correlated with Android fat mass, Gynoid fat mass, Android/Gynoid fat mass ratio, SAT, VAT, and VAT/SAT ratio (Figure 2, P < 0.05 for all).
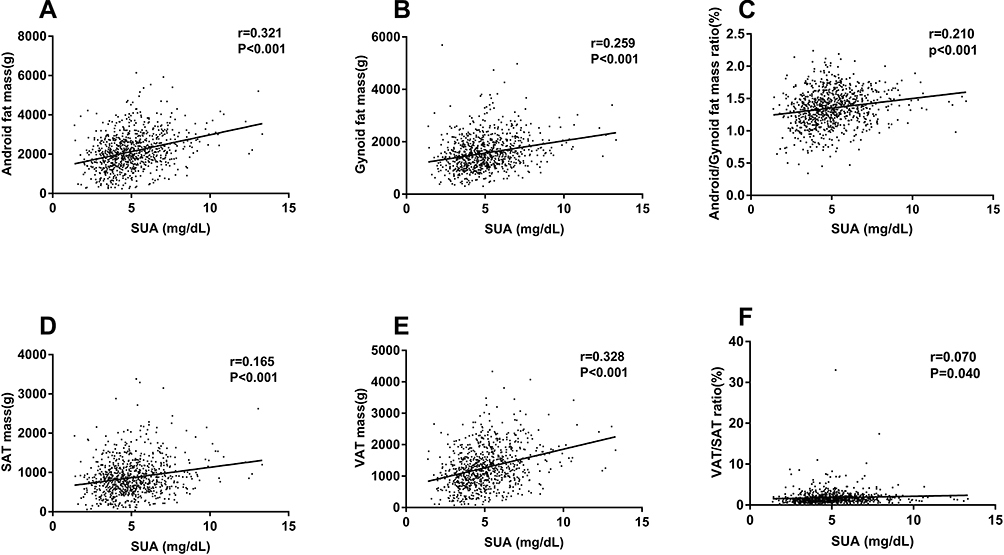 |
Figure 2 Correlation between serum uric acid and central obesity distribution. (A) correlation between serum uric acid and Android fat mass; (B) correlation between serum uric acid and Gynoid fat mass; (C) correlation between serum uric acid and Android/Gynoid fat ratio; (D) correlation between serum uric acid and abdominal subcutaneous fat mass; (E) correlation between serum uric acid and visceral fat quality; (F) correlation between serum uric acid and visceral fat/abdominal subcutaneous fat mass. Abbreviations: SUA, uric acid; SAT, subcutaneous adipose tissue; VAT, visceral adipose tissue. |
Factors Affecting SUA Level
The results of multiple linear regression analysis showed that BMI, WC, Android fat mass, Gynoid fat mass, SAT, VAT, VAT/SAT ratio, F-CP, and AUCCP had a significant positive effect on SUA after adjustment for all confounding factors (P < 0.05 for all). Android/Gynoid ratio, HbA1c, FBG, and HOMA-IS had no significant effect on SUA (Table 3, P > 0.05 for all).
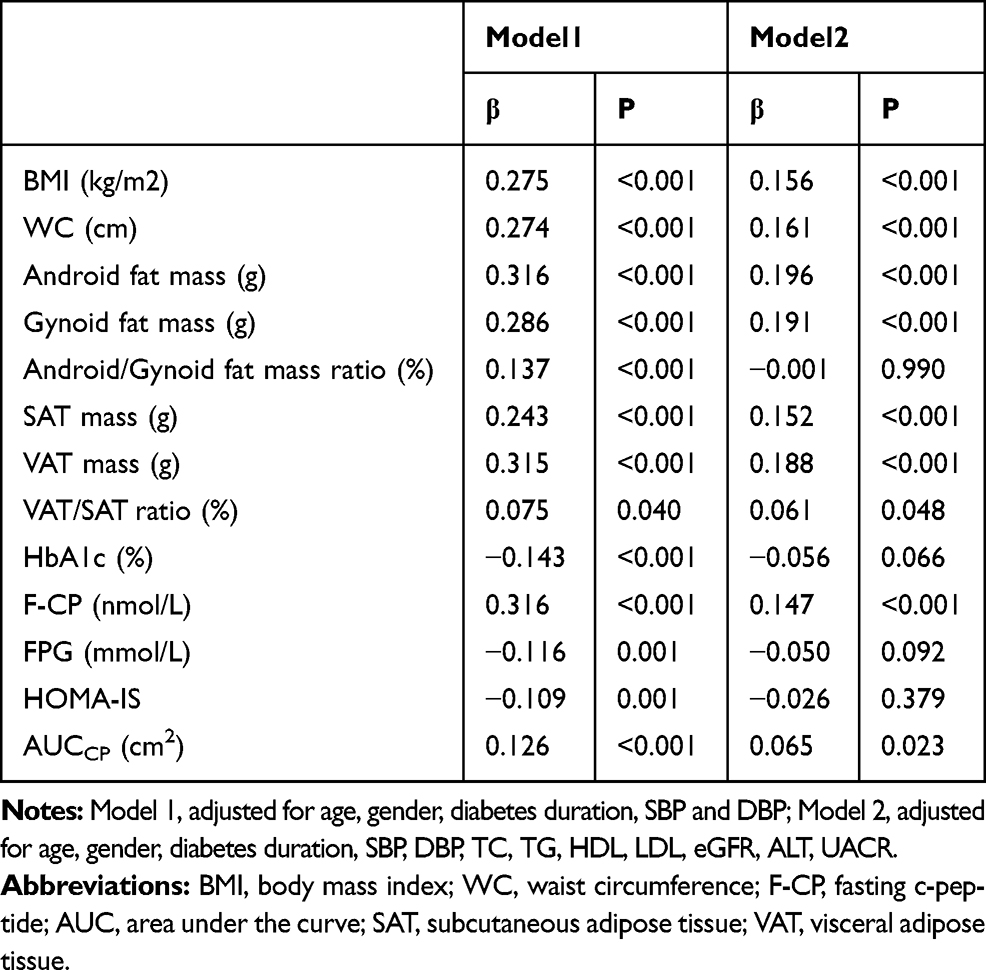 |
Table 3 Effect Factors of SUA Level Analyzed by Multiple Linear Regression in Patients with T2DM |
Risk Factors for HUA
As shown in Table 4 Model4, with further adjustment for VAT and SAT based on Model3, female sex (OR = 2.229, 95% CI: 1.268–3.916, P < 0.05), VAT (OR = 1.001, 95% CI: 1.001–1.001, P < 0.05), and WC (OR = 1.040, 95% CI: 1.010–1.072, P < 0.05) were independently correlated with and found to be risk factors (OR value > 1) for HUA in T2DM patients. HDL (OR = 0.248, 95% CI: 0.092–0.671, P < 0.05) and eGFR (OR = 0.967, 95% CI: 0.960–0.974, P < 0.05) were found to be protective factors for HUA in T2DM patients (OR value < 1).
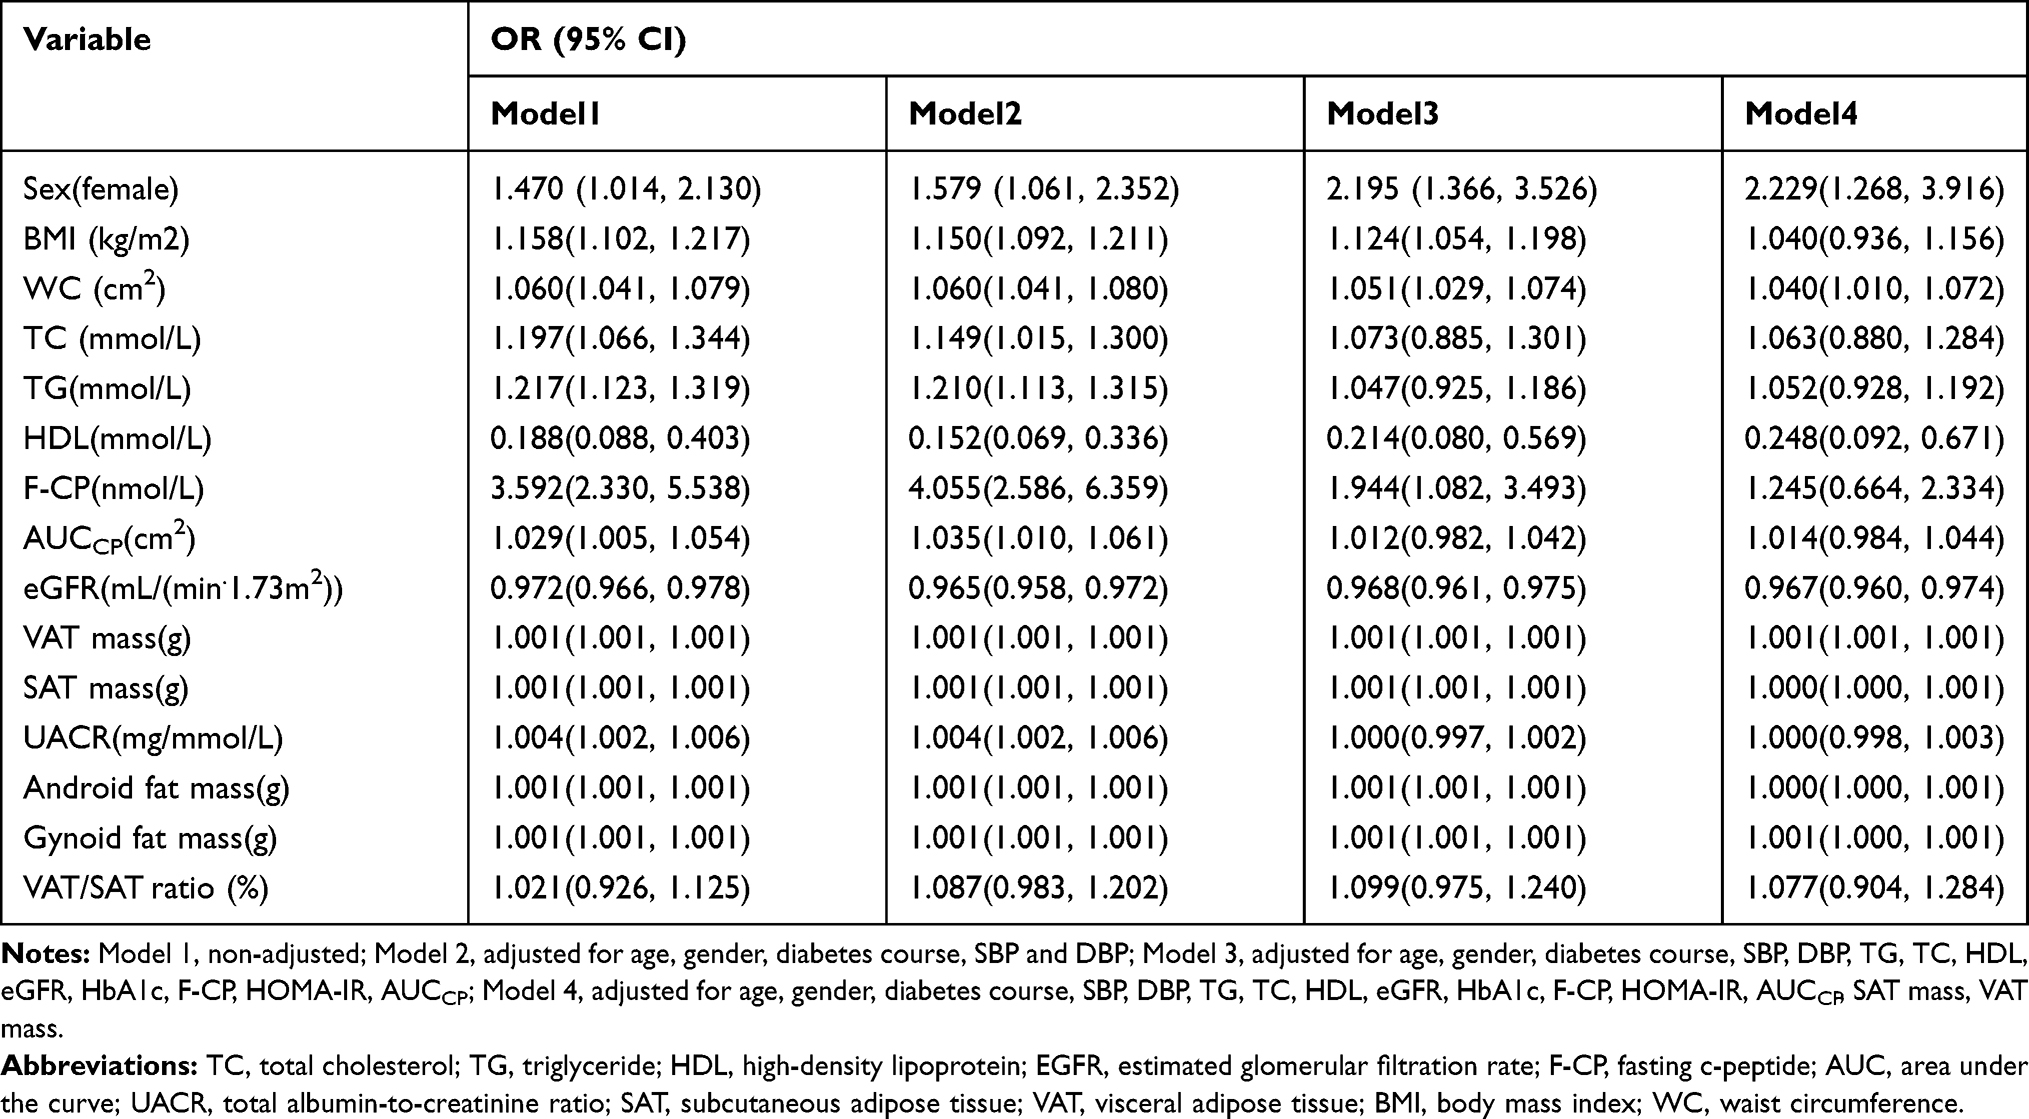 |
Table 4 Risk Factors of Hyperuricemia Analyzed by Logistic Regression in Patients with T2DM |
To determine the effect of differing degrees of VAT mass on SUA, we stratified patients into quartiles based on VAT mass and performed further analysis. Having the highest quartile VAT mass was found to be an independent risk factor for T2DM with HUA (Figure 3, OR = 2.421, 95% CI: 1.091–5.373, P < 0.001).
 |
Figure 3 Logistic regression analysis of different degrees of visceral fat mass and hyperuricemia. Adjusted for age, gender, diabetes course, SBP, DBP, TG, TC, HDL, eGFR, HbA1c, F-CP, HOMA-IR, AUCCP, SAT mass, VAT mass. |
Mediation Analysis Found SUA and F-CP to Be Mediated by BMI and Central Obesity
Table 5 shows the direct and indirect mediating effects of SUA on F-CP. The mediation power of the variables, ranked from the highest to the lowest, is as follows: Android fat mass (40.1%), VAT mass (39.4%), BMI (31.7%), Gynoid fat mass (26.5%), WC (26.5%), and SAT mass (14.2%).
 |
Table 5 Direct and Indirect Effects of SUA on Fasting c-Peptide Mediated by BMI and Central Obesity Distribution |
Discussion
The results from the present study showed that SUA levels in T2DM patients were correlated with abdominal subcutaneous fat, visceral fat, Android fat, Gynoid fat, fasting insulin (FINS), AUCINS, F-CP, and AUCCP. Our study also determined risk factors for HUA. Central obesity distribution may play a key role in mediating the relationship between SUA and IR.
Risk Factors of HUA
In our study, we observed that central obesity distribution, including WC and VAT mass (especially the highest quartile VAT mass), were independent risk factors for HUA in patients with T2DM. Compared with SAT mass, VAT mass was a more powerful mediator of the association between SUA and F-CP. Our results are consistent with those of recent studies from Japan.33–35 Evidence from these studies showed that visceral fat area is significantly related to SUA level. Upon reduction of VAT, SUA levels significantly declined.36 Lowering SUA can prevent fat accumulation in HepG2 cells and reduce liver steatosis in mice,37 indicating that excessive accumulation of VAT can upregulate purine and uric acid metabolism. In addition, a variety of adipokines released from VAT have been shown to have potential effects on SUA production.38
In our study, we found that female sex was an independent risk factor for HUA in T2DM patients. This finding could be explained by the observation that SAT has higher levels of estrogen and progesterone receptors than VAT while VAT has a higher concentration of androgen receptors than SAT. Testosterone inhibits fat accumulation from diet and induces VAT to SAT transformation while estrogen promotes the accumulation of both SAT and VAT.39 However, all female patients enrolled were postmenopausal. It is well known that after menopause, the ability of estrogen to inhibit urate reabsorption reduces, which resultingly increases SUA levels.40
The Mediating Effect of Central Obesity on the Relationship Between HUA and IR
A large amount of evidence indicates that SUA is associated with IR.8,35,41 Studies have shown that HUA upregulates insulin receptor substrate 1 (IRS1) phosphorylation by inducing oxidative stress,42 which inhibits protein kinase B (PKB) phosphorylation, thereby leading to IR and glucose metabolism dysfunction. Additionally, IR reduces renal excretion of uric acid and increases uric acid production through the hexose monophosphate shunt.43 However, we did not find any association between SUA and FINS or HOMA-IR. In the present study, the average duration of diabetes was more than 5 years and 86.5% of participants were receiving intensive exogenous insulin therapy in a hospital. Therefore, FINS and HOMA-IR do not accurately reflect the magnitude of IR. As the degradation product of endogenous insulin, serum C-peptide was used as a proxy for insulin levels. C-peptide has been used as one of the indexes of IR in previous studies.44,45 The results of our study showed that levels of F-CP and AUCCP were associated with HUA, which also verified the relationship between HUA and IR. However, after adjustment for SAT and VAT mass, the association between HUA and F-CP and AUCCP disappeared. To investigate the relationship between F-CP, central obesity, and HUA, mediation analysis was conducted to determine the direct and indirect effects of central obesity on the correlation between F-CP (a reflection of IR) and HUA. Our results showed that the mediation power of central obesity distribution variables, ranked from the highest to the lowest, is as follows: Android fat mass (40.1%), VAT mass (39.4%), BMI (31.7%), Gynoid fat mass (26.5%), WC (26.5%), and SAT mass (14.2%). Similar to our results, Campos et al reported that increased visceral fat was an independent predictor of increased IR.46 Mazidi and Yoo et al47,48 found that the association between SUA and IR was partially or entirely mediated by obesity, based on mediation analysis. Baldwin et al49 suggested that IR could be induced by the immune and inflammatory responses of adipose tissue.
Limitations
There were several limitations to our study. First, we used DXA instead of MRI to measure central obesity distribution owing to the lower dose of radiation and cheaper price of DXA measurements. Although MRI is the gold standard for quantification of visceral fat,50 evidence from previous studies confirmed that SAT and VAT mass and area measured by DXA is highly correlated with those measured by MRI.50 Second, as a single center, cross-sectional study, we cannot illustrate the mechanism of the results which should be cautious to extend. Third, information pertaining to confounding factors, such as smoking, diet (especially foods rich in purines and fructose), and physical activity, were lacking, Finally, quantification of adipokines, such as leptin, adiponectin, and inflammatory cytokines, were not incorporated, which may have influenced the results.38
In the future, a multi-center, prospective study with larger sample sizes should be designed and carried out. Experiments to investigate the mechanism underlying the association between central obesity, IR, and HUA should also be studied.
Conclusions
In summary, serum HUA in T2DM patients was positively correlated with F-CP and different types of fat distribution, especially VAT. In addition, the positive association between SUA levels and IR, represented by C-peptide, in T2DM patients may be at least partly mediated by central obesity. Therefore, controlling obesity, especially visceral fat mass, may effectively prevent HUA, thereby reducing the risk of cardiovascular disease in patients with T2DM.
Data Sharing Statement
The data used to support the findings of this study have been deposited in the figshare repository (DOI:10.6084/m9.figshare.11920041).
Ethics Approval and Consent to Participate
This study was performed in accordance with the Declaration of Helsinki and approved by the Clinical Ethics Committee of the Affiliated Hospital of Nantong University (2018-K016). Written informed consent was obtained from each patient. Written informed consent for publication was obtained from all participants.
Acknowledgments
We thank Michelle Goody, PhD, from Liwen Bianji, Edanz Editing China, for editing the English text of a draft of this manuscript.
Author Contributions
All authors contributed to data analysis, drafting or revising the article, gave final approval of the version to be published, and agree to be accountable for all aspects of the work.
Disclosure
The authors declare that there is no conflict of interest that could be perceived as prejudicing the impartiality of the research reported.
References
1. Wang J, Chen RP, Lei L, et al. Prevalence and determinants of hyperuricemia in type 2 diabetes mellitus patients with central obesity in Guangdong Province in China. Asia Pac J Clin Nutr. 2013;22(4):590–598. doi:10.6133/apjcn.2013.22.4.16
2. Juraschek SP, McAdams-Demarco M, Miller ER, et al. Temporal relationship between uric acid concentration and risk of diabetes in a community-based study population. Am J Epidemiol. 2014;179(6):684–691. doi:10.1093/aje/kwt320
3. Jia Z, Zhang X, Kang S, Wu Y. Serum uric acid levels and incidence of impaired fasting glucose and type 2 diabetes mellitus: a meta-analysis of cohort studies. Diabetes Res Clin Pract. 2013;101(1):88–96. doi:10.1016/j.diabres.2013.03.026
4. Sluijs I, Beulens JW, van der A DL, Spijkerman AM, Schulze MB, van der Schouw YT. Plasma uric acid is associated with increased risk of type 2 diabetes independent of diet and metabolic risk factors. J Nutr. 2013;143(1):80–85. doi:10.3945/jn.112.167221
5. Kodama S, Saito K, Yachi Y, et al. Association between serum uric acid and development of type 2 diabetes. Diabetes Care. 2009;32(9):1737–1742. doi:10.2337/dc09-0288
6. Xu Y, Zhu J, Gao L, et al. Hyperuricemia as an independent predictor of vascular complications and mortality in type 2 diabetes patients: a meta-analysis. PLoS One. 2013;8(10):e78206. doi:10.1371/journal.pone.0078206
7. Jiao Z, gao H, li H, et al. Correlation analysis of hyperuricemia in prediabetes. Chin J Epidemiol. 2013;34(7):725–727.
8. Krishnan E, Pandya BJ, Chung L, Hariri A, Dabbous O. Hyperuricemia in young adults and risk of insulin resistance, prediabetes, and diabetes: a 15-year follow-up study. Am J Epidemiol. 2012;176(2):108–116. doi:10.1093/aje/kws002
9. Sautin YY, Nakagawa T, Zharikov S, Johnson RJ. Adverse effects of the classic antioxidant uric acid in adipocytes: NADPH oxidase-mediated oxidative/nitrosative stress. Am J Physiol Cell Physiol. 2007;293(2):C584–96. doi:10.1152/ajpcell.00600.2006
10. Tsushima Y, Nishizawa H, Tochino Y, et al. Uric acid secretion from adipose tissue and its increase in obesity. J Biol Chem. 2013;288(38):27138–27149. doi:10.1074/jbc.M113.485094
11. Liu Q, Xiao XH. Subcutaneous adipose tissue and visceral adipose tissue. Int J Pathol Clin. 2013;(06):544–547.
12. Lima-Martínez MM, Blandenier C, Iacobellis G. Epicardial adipose tissue: more than a simple fat deposit? Endocrinol Nutr. 2013;60(6):320–328. doi:10.1016/j.endonu.2012.08.001
13. Girard J, Lafontan M. Impact of visceral adipose tissue on liver metabolism and insulin resistance. Part II: visceral adipose tissue production and liver metabolism. Diabetes Metab. 2008;34(5):439–445. doi:10.1016/j.diabet.2008.04.002
14. Bhole V, Choi JW, Kim SW, de Vera M, Choi H. Serum uric acid levels and the risk of type 2 diabetes: a prospective study. Am J Med. 2010;123(10):957–961. doi:10.1016/j.amjmed.2010.03.027
15. Culafic M, Vezmar Kovacevic S, Dopsaj V, et al. A simple index for nonalcoholic steatohepatitis-HUFA-based on routinely performed blood tests. Medicina. 2019;55(6):243.
16. Darmawan G, Hamijoyo L, Hasan I. Association between serum uric acid and non-alcoholic fatty liver disease: a meta-analysis. Acta Med Indones. 2017;49(2):136–147.
17. Liu CQ, He CM, Chen N, et al. Serum uric acid is independently and linearly associated with risk of nonalcoholic fatty liver disease in obese Chinese adults. Sci Rep. 2016;6:38605. doi:10.1038/srep38605
18. Yang YT, Hwan JJ, Cheol BJ, et al. Metabolism. 2016;4.
19. Cortese F, Giordano P, Scicchitano P, et al. Uric acid: from a biological advantage to a potential danger. A focus on cardiovascular effects. Vascul Pharmacol. 2019;120:106565. doi:10.1016/j.vph.2019.106565
20. De Pergola G, Cortese F, Termine G, et al. Uric acid, metabolic syndrome and atherosclerosis: the chicken or the egg, which comes first? Endocr Metab Immune Disord Drug Targets. 2018;18(3):251–259. doi:10.2174/1871530318666180212101548
21. Zupo R, Castellana F, Boninfante B, et al. Uric acid and potassium serum levels are independent predictors of blood pressure non-dipping in overweight or obese Subjects. Nutrients. 2019;11(12):
22. Chinese association of physicians in nephrology. Guidelines for the diagnosis and treatment of renal hyperuricemia in China (2017 edition). Chin Med J. 2017;97(25):1927–1936.
23. Kaul S, Rothney MP, Peters DM, et al. Dual-energy X-ray absorptiometry for quantification of visceral fat. Obesity. 2012;20(6):1313–1318. doi:10.1038/oby.2011.393
24. Kang SM, Yoon JW, Ahn HY, et al. Android fat depot is more closely associated with metabolic syndrome than abdominal visceral fat in elderly people. PLoS One. 2011;6(11):e27694. doi:10.1371/journal.pone.0027694
25. Seyed-Sadjadi N, Berg J, Bilgin AA, Grant R. Visceral fat mass: is it the link between uric acid and diabetes risk. Lipids Health Dis. 2017;16(1):142. doi:10.1186/s12944-017-0532-4
26. Levey AS, Bosch JP, Lewis JB, Greene T, Rogers N, Roth D. A more accurate method to estimate glomerular filtration rate from serum creatinine: a new prediction equation. Modification of diet in renal disease study group. Ann Intern Med. 1999;130(6):461–470. doi:10.7326/0003-4819-130-6-199903160-00002
27. Matthews DR, Hosker JP, Rudenski AS, Naylor BA, Treacher DF, Turner RC. Homeostasis model assessment: insulin resistance and beta-cell function from fasting plasma glucose and insulin concentrations in man. Diabetologia. 1985;28(7):412–419. doi:10.1007/BF00280883
28. He XX, Ma XJ, Ying LW, et al. Characteristics of islet cell function and insulin sensitivity in prediabetic population under new diagnostic criteria. J Shanghai jiao Tong Univ. 2018;38(08):
29. Li L, Yang C, Zhao Y, Zeng X, Liu F, Fu P. Is hyperuricemia an independent risk factor for new-onset chronic kidney disease? A systematic review and meta-analysis based on observational cohort studies. BMC Nephrol. 2014;15:122. doi:10.1186/1471-2369-15-122
30. VanderWeele TJ. A three-way decomposition of a total effect into direct, indirect, and interactive effects. Epidemiology. 2013;24(2):224–232. doi:10.1097/EDE.0b013e318281a64e
31. VanderWeele TJ. Mediation and mechanism. Eur J Epidemiol. 2009;24(5):217–224. doi:10.1007/s10654-009-9331-1
32. Preacher KJ, Hayes AF. Asymptotic and resampling strategies for assessing and comparing indirect effects in multiple mediator models. Behav Res Methods. 2008;40(3):879–891. doi:10.3758/BRM.40.3.879
33. Han T, Meng X, Shan R, et al. Temporal relationship between hyperuricemia and obesity, and its association with future risk of type 2 diabetes. Int J Obes. 2018;42(7):1336–1344. doi:10.1038/s41366-018-0074-5
34. Yamada A, Sato KK, Kinuhata S, et al. Association of visceral fat and liver fat with hyperuricemia. Arthritis Care Res. 2016;68(4):553–561. doi:10.1002/acr.22729
35. Kim TH, Lee SS, Yoo JH, et al. The relationship between the regional abdominal adipose tissue distribution and the serum uric acid levels in people with type 2 diabetes mellitus. Diabetol Metab Syndr. 2012;4(1):3. doi:10.1186/1758-5996-4-3
36. Tamba S, Nishizawa H, Funahashi T, et al. Relationship between the serum uric acid level, visceral fat accumulation and serum adiponectin concentration in Japanese men. Intern Med. 2008;47(13):1175–1180. doi:10.2169/internalmedicine.47.0603
37. Lanaspa MA, Sanchez-Lozada LG, Choi YJ, et al. Uric acid induces hepatic steatosis by generation of mitochondrial oxidative stress: potential role in fructose-dependent and -independent fatty liver. J Biol Chem. 2012;287(48):40732–40744. doi:10.1074/jbc.M112.399899
38. Kahl S, Gancheva S, Straßburger K, et al. Empagliflozin effectively lowers liver fat content in well-controlled type 2 diabetes: a randomized, double-blind, phase 4, placebo-controlled trial. Diabetes Care. 2020;43:298–305.
39. Blouin K, Boivin A, Tchernof A. Androgens and body fat distribution. J Steroid Biochem Mol Biol. 2008;108(3–5):272–280. doi:10.1016/j.jsbmb.2007.09.001
40. Antón FM, García Puig J, Ramos T, González P, Ordás J. Sex differences in uric acid metabolism in adults: evidence for a lack of influence of estradiol-17 beta (E2) on the renal handling of urate. Metabolism. 1986;35(4):343–348. doi:10.1016/0026-0495(86)90152-6
41. Jiao Z, Gao HL, Li H, et al. Pre-diabetes mellitus influenced by hyperuricemia. Zhonghua Liu Xing Bing Xue Za Zhi. 2013;34(7):725–727.
42. Zhu Y, Hu Y, Huang T, et al. High uric acid directly inhibits insulin signalling and induces insulin resistance. Biochem Biophys Res Commun. 2014;447(4):707–714. doi:10.1016/j.bbrc.2014.04.080
43. King C, Lanaspa MA, Jensen T, Tolan DR, Sánchez-Lozada LG, Johnson RJ. Uric acid as a cause of the metabolic syndrome. Contrib Nephrol. 2018;192:88–102.
44. Törn C, Landin-Olsson M, Lernmark A, et al. Prognostic factors for the course of beta cell function in autoimmune diabetes. J Clin Endocrinol Metab. 2000;85(12):4619–4623. doi:10.1210/jcem.85.12.7065
45. Li X, Zhou ZG, Qi HY, et al. Replacement of insulin by fasting C-peptide in modified homeostasis model assessment to evaluate insulin resistance and islet β cell function. J Cent South Univ. 2004;29(4):419–423.
46. Campos R, Masquio D, Corgosinho FC, et al. Effects of magnitude of visceral adipose tissue reduction: impact on insulin resistance, hyperleptinemia and cardiometabolic risk in adolescents with obesity after long-term weight-loss therapy. Diab Vasc Dis Res. 2019;16(2):196–206. doi:10.1177/1479164118825343
47. Yoo HG, Lee SI, Chae HJ, Park SJ, Lee YC, Yoo WH. Prevalence of insulin resistance and metabolic syndrome in patients with gouty arthritis. Rheumatol Int. 2011;31(4):485–491. doi:10.1007/s00296-009-1304-x
48. Mazidi M, Katsiki N, Mikhailidis DP, Banach M. The link between insulin resistance parameters and serum uric acid is mediated by adiposity. Atherosclerosis. 2018;270:180–186. doi:10.1016/j.atherosclerosis.2017.12.033
49. Baldwin W, McRae S, Marek G, et al. Hyperuricemia as a mediator of the proinflammatory endocrine imbalance in the adipose tissue in a murine model of the metabolic syndrome. Diabetes. 2011;60(4):1258–1269. doi:10.2337/db10-0916
50. Cheung AS, de Rooy C, Hoermann R, et al. Correlation of visceral adipose tissue measured by Lunar Prodigy dual X-ray absorptiometry with MRI and CT in older men. Int J Obes. 2016;40(8):1325–1328. doi:10.1038/ijo.2016.50
 © 2020 The Author(s). This work is published and licensed by Dove Medical Press Limited. The
full terms of this license are available at https://www.dovepress.com/terms
and incorporate the Creative Commons Attribution
- Non Commercial (unported, 3.0) License.
By accessing the work you hereby accept the Terms. Non-commercial uses of the work are permitted
without any further permission from Dove Medical Press Limited, provided the work is properly
attributed. For permission for commercial use of this work, please see paragraphs 4.2 and 5 of our Terms.
© 2020 The Author(s). This work is published and licensed by Dove Medical Press Limited. The
full terms of this license are available at https://www.dovepress.com/terms
and incorporate the Creative Commons Attribution
- Non Commercial (unported, 3.0) License.
By accessing the work you hereby accept the Terms. Non-commercial uses of the work are permitted
without any further permission from Dove Medical Press Limited, provided the work is properly
attributed. For permission for commercial use of this work, please see paragraphs 4.2 and 5 of our Terms.