Back to Journals » Journal of Multidisciplinary Healthcare » Volume 16
Correlation Between Postpartum Myometrial Elasticity and Obstetric Complications in Pregnant Women with Gestational Diabetes Mellitus
Authors Jin J, Xia H, Su Y, Qi T, Hong X, Xie Y, Xu J
Received 15 September 2023
Accepted for publication 7 December 2023
Published 20 December 2023 Volume 2023:16 Pages 4139—4147
DOI https://doi.org/10.2147/JMDH.S440448
Checked for plagiarism Yes
Review by Single anonymous peer review
Peer reviewer comments 2
Editor who approved publication: Dr Scott Fraser
Jing Jin,1,* Han Xia,1,* Yanan Su,2 Tingyue Qi,1 Xia Hong,3 Yanyan Xie,3 Jun Xu1
1Department of Ultrasound, Medical Imaging Center, Affiliated Hospital of Yangzhou University, Yangzhou University, Yangzhou, 225009, People’s Republic of China; 2Department of Radiology, Baoying County People’s Hospital, Yangzhou, 225800, People’s Republic of China; 3Department of Gynaecology and Obstetrics, Affiliated Hospital of Yangzhou University, Yangzhou University, Yangzhou, 225009, People’s Republic of China
*These authors contributed equally to this work
Correspondence: Jun Xu, Department of Ultrasound, Medical Imaging Center, Affiliated Hospital of Yangzhou University, Yangzhou University, No. 45 Taizhou Road, Guangling District, Yangzhou, 225009, People’s Republic of China, Tel +86 13665277765, Email [email protected]
Objective: To investigate postpartum myometrial elasticity in pregnant women with gestational diabetes mellitus (GDM) using shear wave elastography (SWE) and analyze the correlation between myometrial SWE values and obstetric complications.
Methods: Clinical data of women who gave birth at Affiliated Hospital of Yangzhou University from August 2022 to July 2023 were retrospectively analyzed and divided into two groups based on GDM diagnosis: the GDM group and the healthy control group. SWE was used to measure the elasticity values of the anterior and posterior myometrial walls in both groups. Differences in placental attachment position and SWE values at the placental attachment site were compared between the two groups. Spearman correlation analysis was utilized to evaluate the correlation between SWE values and obstetric complications.
Results: Glycated hemoglobin (HbA1c), homeostasis model assessment of insulin resistance (HOMA-IR), fasting plasma glucose (FPG), 2-hour postprandial glucose (2h PG), triglycerides (TG), and total cholesterol (TC) levels were higher in the GDM group than in the healthy control group (P< 0.05). There was a statistically significant difference in placental attachment position between the two groups (P< 0.05). In both the GDM (17.52± 0.42 vs 25.29± 0.74, P=0.001) and control groups (14.06± 5.01 vs 22.20± 6.34, P=0.001), mean SWE values were significantly lower for anterior versus posterior placental attachment, and mean SWE values were also significantly higher in the GDM versus control group for both anterior (17.52± 0.42 vs 14.06± 5.01, P=0.001) and posterior placental attachment (25.29± 0.74 vs 22.20± 6.34, P=0.001). Spearman correlation analysis showed that postpartum hemorrhage (r=0.632, P=0.017), preeclampsia (r=0.818, P=0.014), premature rupture of membranes (r=0.710, P=0.012), placental abruption (r=0.732, P=0.031), and ketoacidosis (r=0.729, P=0.022) were negatively correlated with average myometrial SWE values in the GDM group (P< 0.05).
Conclusion: SWE values at the placental attachment site were higher in GDM patients than in healthy pregnant women, and myometrial elasticity was positively correlated with obstetric complications.
Keywords: elastography, gestational diabetes, myometrium, pregnancy complications
Corrigendum for this paper has been published.
Introduction
Gestational diabetes mellitus (GDM) refers to glucose intolerance of variable severity with onset or first recognition during pregnancy, occurring in 1–10% of gravidas.1 The prevalence of GDM has progressively risen in tandem with elevated living standards in recent years.2 If not controlled in a timely manner, GDM can easily lead to adverse pregnancy outcomes for pregnant women such as polyhydramnios, hypertensive disorders in pregnancy, dystocia, cesarean section, macrosomia, respiratory distress and hypoglycemia in newborns, posing serious threats to the health of mothers and infants.3 Excessive glucose from pregnant women entering the fetus during pregnancy can lead to macrosomia, increasing the difficulty of delivery, and would also pose serious threats to the safety of mothers and infants.4 It has been reported that the placental structural and functional tissues in GDM pregnant women undergo pathological changes with the occurrence and development of GDM, leading to increased placental hardness.5,6 Also, the dysregulation of various hormones and cytokines caused by GDM can lead to placental and myometrial dysfunction, increasing the risks of adverse pregnancy outcomes and long-term maternal and infant complications.7,8
Shear wave elastography (SWE) is an imaging method used to evaluate tissue stiffness. Studies have reported that SWE can be utilized to evaluate endometrial lesions,9 preeclampsia,10 placental elasticity, and post-abortion myometrial elasticity.11 Research has been conducted on the elasticity of the myometrial measured by SWE of GDM patients during mid-pregnancy and its association with obstetric complications, however, there is currently a lack of studies on the elasticity of the myometrial postpartum in this population. Therefore, this study aims to explore the correlation between postpartum myometrial elasticity and obstetric complications.
Materials and Methods
General Information
Clinical data of 189 women delivering at Affiliated Hospital of Yangzhou University Obstetrics 8/2022-7/2023 were selected after retrospective review. Those with GDM (n=58) were assigned to the GDM group, with healthy cases without GDM (n=131) comprising the control group. Inclusion criteria: (1) singleton pregnancy, no history of abortion or termination; (2) placenta attached to the anterior or posterior myometrial wall; (3) no fetal malformation or intrauterine infection detected during pregnancy; (4) successful acquisition of myometrial SWE results; (5) GDM diagnostic criteria:12 FPG ≥ 5.1 mmol/L or 2-hour postprandial glucose ≥ 8.5 mmol/L after a 75g oral glucose tolerance test. Exclusion criteria: (1) hypertension, hyperlipidemia, endocrine/metabolic diseases, heart/liver/kidney comorbidities; (2) polyhydramnios or other comorbidities; (3) Patients with incomplete clinical information. All participants provided signed informed consent forms approved by the hospital’s ethics committee.
Examination Methods
SWE Measurement
Examinations were performed using a Resona 9 color Doppler ultrasonography system (Mindray, China) with probe frequencies set at 1–6 MHz. The participants were instructed to lie supine and breathe steadily. Following inspection of the myometrial position, the ultrasound transducer was set to SWE mode and applied over the central and peripheral regions of the uterus. Pregnant women were instructed to hold their breath at the end of exhalation in a calm state for imaging. When scanning, care was taken to evade myometrial vascular sinuses and sites of heavy calcification, ensuring complete, homogeneous and consistent color saturation of the elastography patterns. Target imaging criteria: 100% credibility index and 5 star M-STB rating. The scanning protocol was repeated to acquire 3 comparable measurements, of which the mean was calculated. After measurement of the anterior myometrial wall, the posterior myometrial wall was measured using the same method. The subjects were examined by a physician with more than five years of experience in the ultrasound department of our hospital, and this study was kept confidential among the various operators.
Blood Glucose Measurement
Blood glucose levels were measured using a glucose assay kit (GLU(HK) kit, cat:1000020106). Oral glucose tolerance test: Subjects at 24 weeks of gestation were instructed to fast for at least 8 hours overnight and then ingest 250 mL of water containing 75 g of glucose the next morning within 5 minutes. Venous blood samples were collected 1 hour before and 1 and 2 hours after the first glucose ingestion to measure blood glucose and insulin levels.
Observation and Evaluation Indices
Participant Data
Body mass index (BMI), glycated hemoglobin (HbA1c), fasting plasma glucose (FPG), 2-hour postprandial glucose (2h PG), triglycerides (TG), total cholesterol (TC), and homeostasis model assessment of insulin resistance (HOMA-IR) were collected for participants in both groups. Obstetric complications recorded included postpartum hemorrhage, preeclampsia, premature rupture of membranes, preterm birth, and ketoacidosis.
Insulin Resistance
Homeostasis model assessment of insulin resistance (HOMA-IR)13 was calculated using the following formula: fasting blood glucose (FPG, mmol/L) x fasting insulin (FINS, μU/mL)/22.5.
Statistical Analysis
Data were analyzed using SPSS 22.0. Normal distributed data were presented as mean ± standard deviation (x±s) and groups were compared by independent t-tests. Categorical and ordinal variables were compared by chi-square test or Fisher’s exact test. Spearman correlation analysis was used to evaluate associations between SWE and variables. P <0.05 indicates statistically significant differences.
Results
Comparison of Metabolic Indicators
The GDM group comprised individuals aged between 20 and 38 years, with a mean age of (29.34±3.57) years and an average BMI of 25.19±3.27 kg/m2. The healthy control group consisted of individuals aged between 24 and 39 years, with a mean age of (29.29±3.70) years and an average BMI of 24.38±4.51 kg/m2. In GDM group, 39 (67.24%) pregnant women had vaginal birth, 19 (32.76%) pregnant women had Caesarean section and number of deliveries was 1.40±0.50. In healthy group 97 (71.32%) pregnant women had vaginal birth, 37 (27.21%) pregnant women had Caesarean section and number of deliveries was 1.44±0.55. Statistical analysis revealed no significant differences between the two groups (P>0.05).
The GDM group exhibited higher HbA1c (5.29±1.31 vs 5.07±0.67), HOMA-IR (2.8±1.29 vs 1.3±0.50) levels, FBG (5.45±2.76 vs 4.79±2.14), 2h PG (9.21±3.31 vs 6.45±2.76), TG (3.72±2.02 vs 1.65±0.57), and TC (6.42±1.13 vs 5.14±2.12) levels, with statistically significant differences (P<0.05). as demonstrated in Table 1. The routine examinations confirmed the GDM status of enrolled subjects in corresponding cohort. These demographic details contribute to the robustness of our study, ensuring a comprehensive portrayal of the participant characteristics.
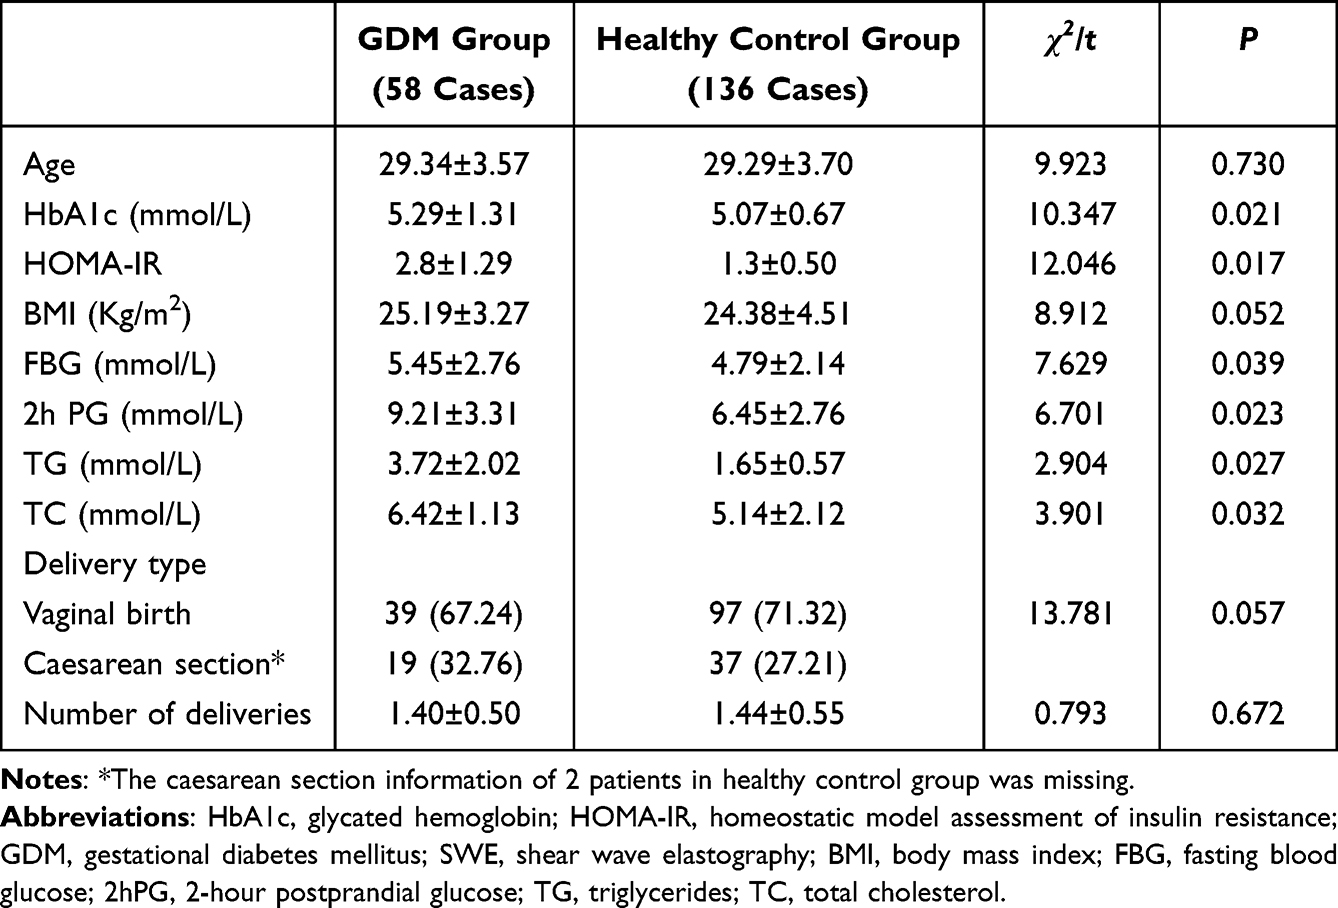 |
Table 1 Clinical Characteristics of the Study Groups |
Comparison of SWE Values by Placental Location
In the GDM group, 34 (58.62%) cases exhibited placental attachment to the anterior uterine wall, while 24 (41.38%) cases displayed attachment to the posterior uterine wall. Conversely, In the healthy control group, 65 (47.79%) cases demonstrated placental attachment to the anterior uterine wall, and 71 cases (52.21%) to the posterior uterine wall. The disparity between the two groups was statistically significant (P<0.05).
Both in the GDM (17.52±0.42 vs 25.29±0.74, P=0.001) and control groups (14.06±5.01 vs 22.20±6.34, P=0.001), mean SWE values were significantly lower for anterior placental attachment compared to posterior attachment. Additionally, mean SWE values were significantly higher in the GDM group compared to the control group for both anterior (17.52±0.42 vs 14.06±5.01, P=0.001) and posterior placental attachment (25.29±0.74 vs 22.20±6.34, P=0.001). Refer to Table 2 and Figures 1 and 2 for detailed information.
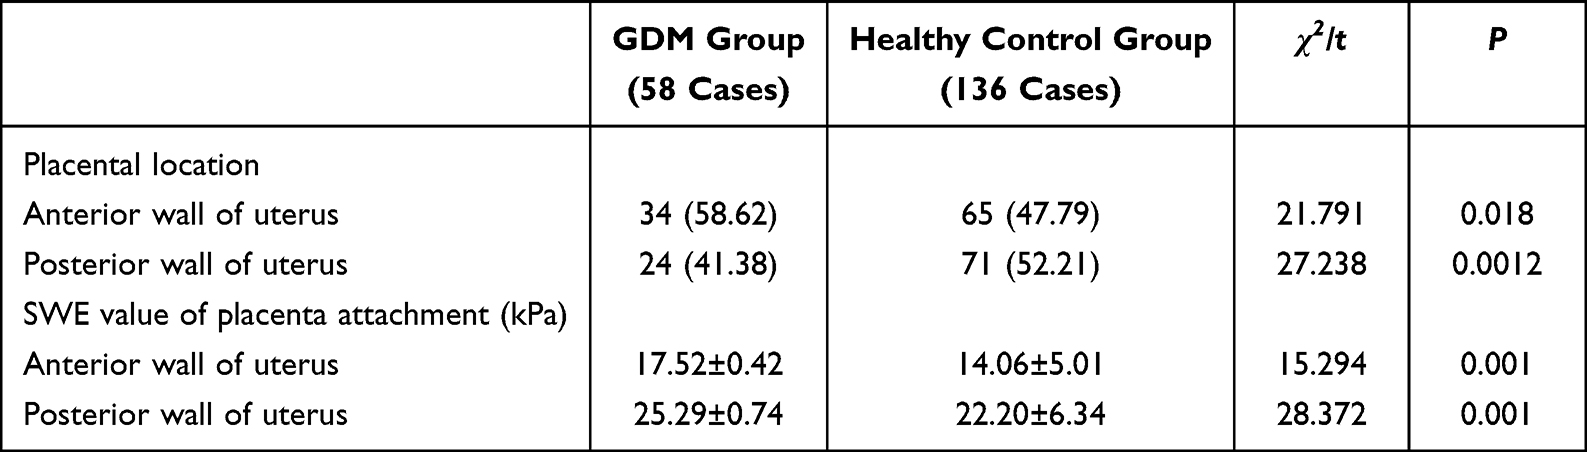 |
Table 2 SWE Measurements Results |
 |
Figure 1 Myometrial shear wave elastography (SWE) images from a healthy pregnant female, age 36. (A) Anterior myometrial SWE (5.32 kPa). (B) Posterior myometrial SWE (26.71 kPa). |
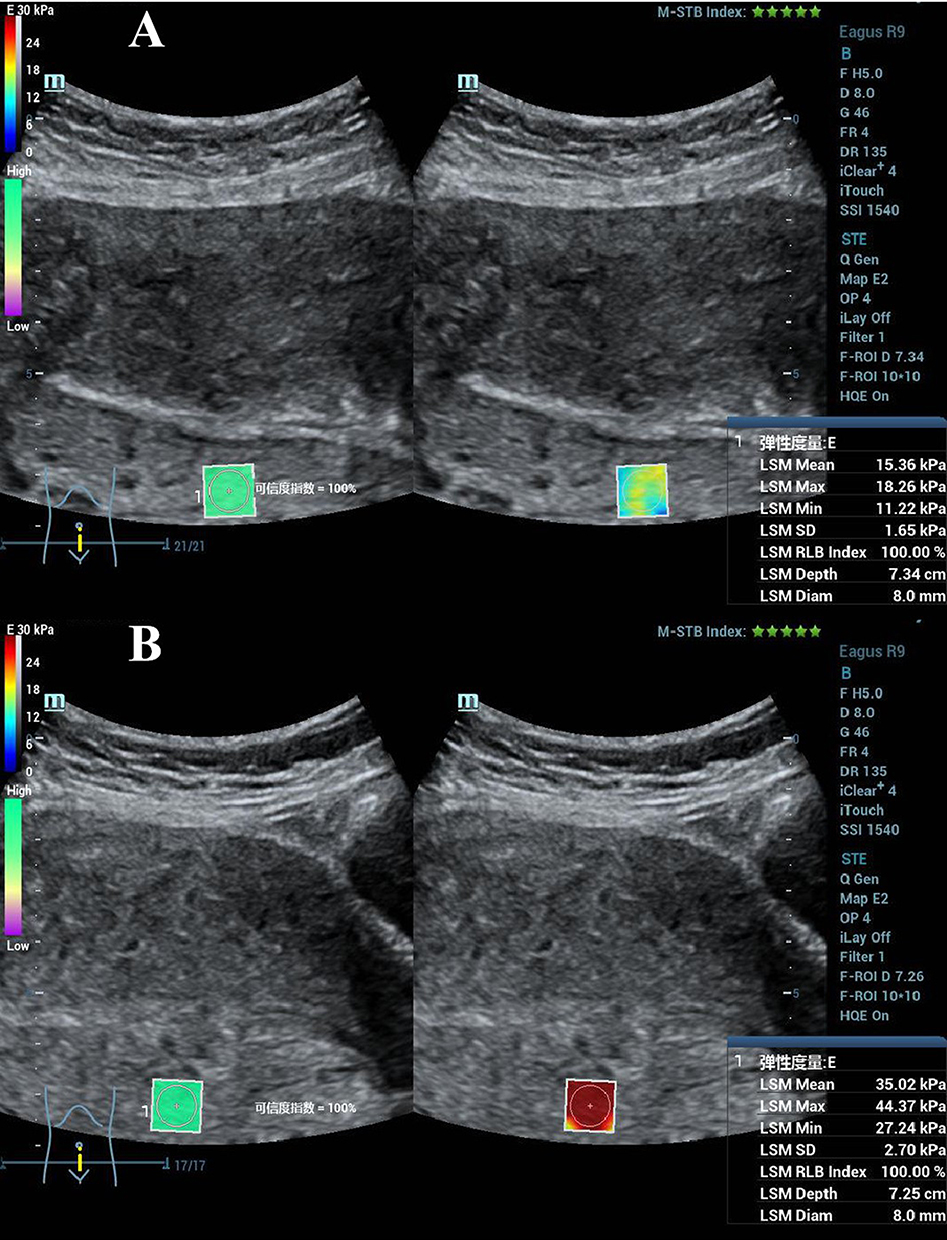 |
Figure 2 Anterior myometrial SWE image from a pregnant female with gestational diabetes mellitus, age 29. (A) Anterior myometrial SWE (15.36 kPa). (B) Posterior myometrial SWE (35.02 kPa). |
Comparison of Obstetric Complications Between Both Groups
Following the computation of the mean SWE values for the anterior and posterior uterine walls in both groups, we assessed the incidence of obstetric complications between them. Results indicated a significantly higher occurrence of postpartum hemorrhage (χ2=9.328, P=0.004), preeclampsia (χ2=10.457, P=0.027), premature rupture of membranes (χ2=21.794, P=0.012), placental abruption (χ2=16.674, P=0.038), and ketoacidosis (χ2=6.652, P=0.023) in the GDM group compared to the healthy control group, with statistically significant differences (P<0.05), refer to Table 3 for comprehensive details.
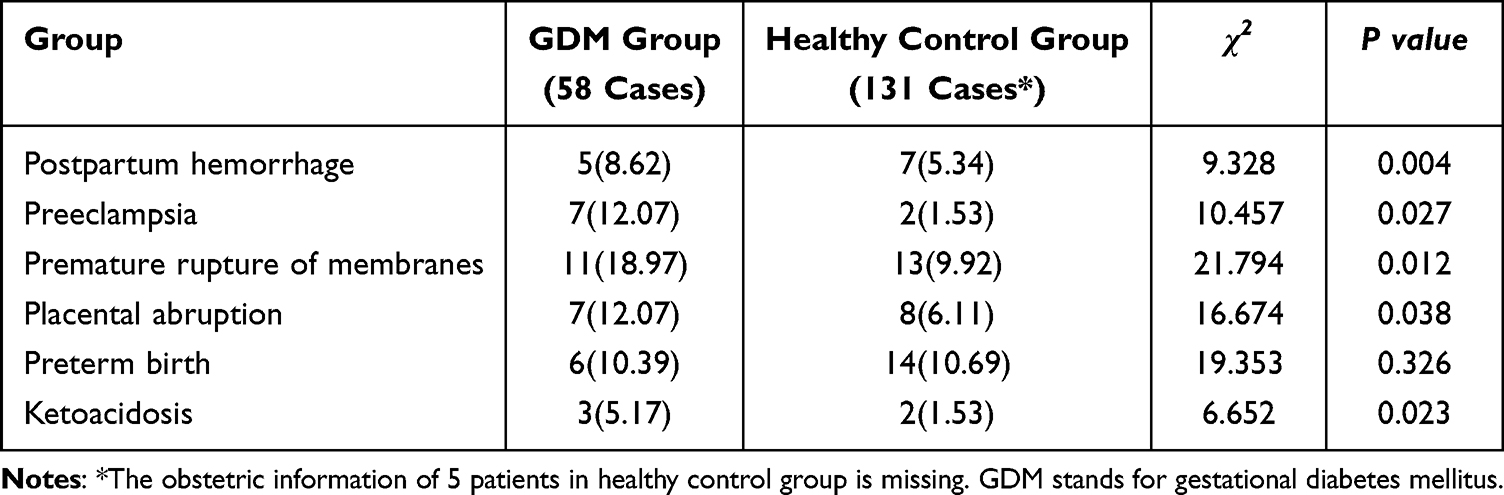 |
Table 3 Obstetric Complications in the Study Groups |
Correlation Between Obstetric Complications and SWE Values in the GDM Group
Following the computation of mean SWE values at the placental attachment site in the GDM group, we conducted an analysis to examine the correlation between maternal obstetric complications and the mean uterine SWE values. Spearman correlation analysis showed that postpartum hemorrhage (r=−0.632, P=0.017), preeclampsia (r=−0.818, P=0.014), premature rupture of membranes (r=−0.710, P=0.012), placental abruption (r=−0.732, P=0.031), and ketoacidosis (r=−0.729, P=0.022) exhibited a negative correlation with mean uterine SWE values (P<0.05). Comprehensive details are available in Table 4.
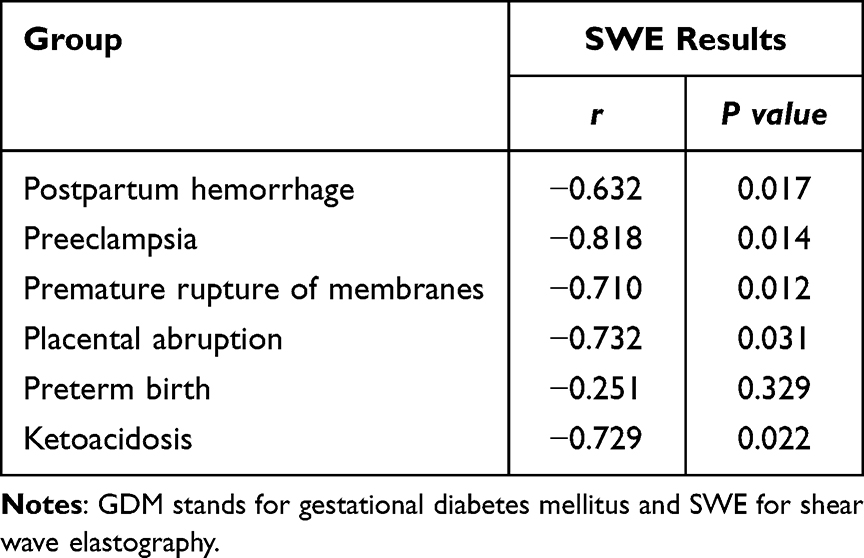 |
Table 4 Correlations Between SWE Values and Obstetric Complications in the GDM Group |
Discussions
The uterus plays a vital role in fostering fetal development, and maternal and uterine disorders can impact delivery outcomes. Clinical observations have found that changes in myometrial elasticity in mid to late pregnancy are related to pregnancy complications, although literature on postpartum myometrial elasticity and obstetric complications remains scarce.
While there have been studies focusing on the measurement of uterine muscle layer elasticity using SWE, the unique aspect of this research lies in dynamically observing the patterns of uterine contractions.14 To date, there is a lack of research specifically addressing the measurement of uterine muscle elasticity during contraction and relaxation using SWE. SWE is an imaging technique for assessing tissue stiffness by using ultrasound radiation force to induce shear waves in tissues. Stiffer tissues exhibit faster shear velocities and higher Young’s moduli. Yuan Shengmei et al15 performed SWE examinations on mid-pregnancy singleton placentas and found that the placenta elasticity values in the early-onset preeclampsia group were significantly higher than the normal pregnancy group, thereby identifying SWE as useful for evaluating placental function. This study used SWE to assess myometrial elasticity and found that the mean SWE values at the placental attachment site were significantly higher in GDM patients than the healthy controls. SWE values are thought to be related to myometrial and placental tissue changes during pregnancy in GDM patients. Focal thickening of the chorionic basement membrane and patchy necrosis of trophoblastic cells are accompanied by significant proliferation of trophoblastic cells, which can lead to increased placental hardness and higher SWE values.16 However, since the placental attachment site is adjacent to the placenta, trophoblastic cell proliferation can also cause stiffening and increased SWE values. SWE has also been applied for the assessment of uterine tonicity after vaginal delivery.17 For relative researches SWE using on myometrial elasticity, there have been studies in relation to ectopic pregnancy and the prediction of preterm birth probability, and myometrial elasticity presented to be a significant predictor for preterm delivery.18,19
The results of this study also showed that the incidence of postpartum hemorrhage, preeclampsia, premature rupture of membranes, low birth weight, macrosomia, neonatal asphyxia, and neonatal hypoglycemia in the GDM group was significantly higher than that in the healthy control group, and was negatively correlated with SWE values. The possible reason is that GDM pregnant women secrete excessive anti-islet substances and experience inflammatory reactions during pregnancy, while high expression of anti-islet substances and inflammatory mediators can affect maternal metabolic processes, causing vascular endothelial damage, uterine dysfunction, and thus lead to pathological histological changes in the uterus, resulting in increased tissue stiffness.20
There is a strong likelihood of a correlation between the thickness of the uterine myometrium and its elasticity. However, current research in this area is still lacking. Clinically, a decrease in myometrial thickness is associated with an increased risk of adverse pregnancy outcomes. Researchers have discovered21 that uterine muscular thickness is associated with preterm delivery if there is no premature rupture of membranes. Guo et al22 observed that spontaneous preterm birth patients exhibited markedly reduced anterior uterine muscular thickness in mid-gestation compared to full-term counterparts with intact membranes. Atarjavdan L et al23 demonstrated pronounced anterior and lower myometrial thickening in preterm premature rupture of membranes cases, arising after lengthy latency. Thus, late gestational assessment of myometrial muscularity could predict adverse pregnancy outcomes. Some studies have shown that uneven uterine muscular thickness during delivery may lead to uncoordinated myometrial contractions, resulting in dystocia. For such pregnant women, early evaluation of the uterine muscular condition is instructive in choosing the delivery method, which helps reduce pregnancy and obstetric complications and lower the risks faced by fetuses and mothers. In subsequent studies, we will specifically investigate the connection between mid-pregnancy myometrial thickness and uterine elasticity. Additionally, at the current clinical stage, there is no conclusive evidence from clinical research indicating a difference in elasticity between the anterior and posterior walls of the uterus. When establishing our control group, we initially considered it as a potential clinical variable to control for. Surprisingly, our results did reveal a lower elasticity in anterior uterine wall than posterior walls. We speculate that this outcome may be related to the physiological structure of the uterus and its ligaments.
In summary, SWE emerges as a valuable tool for assessing uterine elasticity, providing insights into pregnancy complications, placental function, and potential predictive value for preterm birth, particularly in the context of conditions like gestational diabetes mellitus. The findings suggest a promising avenue for further research and clinical applications to reduce risks and complications for both fetuses and pregnant women. However, this study has certain limitations: it only explored the correlation between postpartum myometrial elasticity at the placental attachment site and the occurrence of obstetric complications, without an in-depth investigation of changes in the myometrial layer. In addition, the sample size included in the study was small, which may have led to bias. Future studies should use more samples to explore how to reduce pregnancy and obstetric complications, thereby lowering the risks faced by fetuses and pregnant women.
Conclusions
SWE values measured at the placental attachment site were higher in GDM patients compared to healthy pregnant women and mean myometrial SWE values were strongly correlated with adverse pregnancy and delivery outcomes. Thus, SWE detection may be considered an effective means of myometrial functional assessment.
Disclosure
The authors report no conflicts of interest in this work.
References
1. Szmuilowicz ED, Josefson JL, Metzger BE. Gestational Diabetes Mellitus. Endocrinol Metab Clin North Am. 2019;48(3):479–493. doi:10.1016/j.ecl.2019.05.001
2. Sweeting A, Wong J, Murphy HR, Ross GP. A Clinical Update on Gestational Diabetes Mellitus. Endocr Rev. 2022;43(5):763–793. doi:10.1210/endrev/bnac003
3. Ye W, Luo C, Huang J, Li C, Liu Z, Liu F. Gestational diabetes mellitus and adverse pregnancy outcomes: systematic review and meta-analysis. BMJ. 2022;377:e067946. doi:10.1136/bmj-2021-067946
4. Alejandro EU, Mamerto TP, Chung G, et al. Gestational Diabetes Mellitus: a Harbinger of the Vicious Cycle of Diabetes. Int J Mol Sci. 2020;21(14):5003. doi:10.3390/ijms21145003
5. Carrasco-Wong I, Moller A, Giachini FR, et al. Placental structure in gestational diabetes mellitus. Biochim Biophys Acta Mol Basis Dis. 2020;1866(2):165535. doi:10.1016/j.bbadis.2019.165535
6. Bedell S, Hutson J, de Vrijer B, Eastabrook G. Effects of Maternal Obesity and Gestational Diabetes Mellitus on the Placenta: current Knowledge and Targets for Therapeutic Interventions. Curr Vasc Pharmacol. 2021;19(2):176–192. doi:10.2174/1570161118666200616144512
7. Yang Y, Guo F, Peng Y, et al. Transcriptomic Profiling of Human Placenta in Gestational Diabetes Mellitus at the Single-Cell Level. Front Endocrinol (Lausanne). 2021;12:679582. doi:10.3389/fendo.2021.679582
8. Ridder A, Giorgione V, Khalil A, Thilaganathan BP. The Relationship between Uterine Artery Blood Flow and Trophoblast Function. Int J Mol Sci. 2019;20(13):3263. doi:10.3390/ijms20133263
9. Fang Y, Zhang B, Huang H, et al. Clinical Study Based on Shear Wave Elastography to Evaluate the Efficacy of Qianyang Yuyin Granules in Reducing Early Renal Damage in the Hypertensive Elderly with the Syndrome of Yin Deficiency and Yang Hyperactivity. J Nanjing Univ Traditional Chine Med. 2022;38(04):285–290. doi:10.14148/j.issn.1672-0482.2022.0285
10. Chen L, Chen L, Liu Z. Value of Real-time Shear Wave Elastography in Evaluating Placentas in Late-stage Preeclampsia. Pract Clin Med. 2022;23(3):59–63. doi:10.13764/j.cnki.lcsy.2022.03.019
11. Qi X, Wang F. Application of Real-time Shear Wave Elastography for Post-abortion Endometrial Elasticity Diagnosis. Chine J Women Children Health. 2021;36(22):5330–5334. doi:10.19829/j.zgfybj.issn.1001-4411.2021.22.064
12. Obstetrics Group of Chinese Medical Association, Perinatal Medicine Group of Chinese Medical Association. Guidelines for Diagnosis and Treatment of Gestational Diabetes Mellitus (2014). Chine J Obstetrics Gynecol. 2014;49(08):561–569.
13. Matthews DR, Hosker JP, Rudenski AS, Naylor BA, Treacher DF, Turner RC. Homeostasis model assessment: insulin resistance and beta-cell function from fasting plasma glucose and insulin concentrations in man. Diabetologia. 1985;28(7):412–419. doi:10.1007/BF00280883
14. Gennisson J-L, Muller M, Gabor P, et al. Quantification of elasticity changes in the myometrium during labor using Supersonic Shear Imaging: a feasibility study. Ultrasonics. 2015;56:183–188. doi:10.1016/j.ultras.2014.07.013
15. Yuan S, Liu Y, Wang X, et al. Application of Real-time Shear Wave Elastography on Placental Elasticity in Hypertensive Disorders Complicating Pregnancy. Chine J Ultrasonography. 2017;33(1):38–41.
16. Yao C, Liu H, Zhang H. Analysis of Prediction Effect and Correlation between Mean Value of Placental Elasticity and Umbilical Artery S/D on Adverse Fetal Prognosis. Guizhou Med J. 2020;44(3):432–434.
17. Sichitiu J, Meuwly J-Y, Baud D, Desseauve D. Using shear wave elastography to assess uterine tonicity after vaginal delivery. Sci Rep. 2021;11(1):10420. doi:10.1038/s41598-021-89756-6
18. Akbas M, Koyuncu FM. The Utility of Myometrial and Cervical Ultrasound Shear Wave Elastography in the Diagnosis of Ectopic Pregnancy. Ultrasound Med Biol. 2020;46(9):2215–2221. doi:10.1016/j.ultrasmedbio.2020.04.035
19. Ozkaya E, Tosun A, Korkmaz V, Kucuk E, Sengul D, Kucukozkan T. Myometrial elasticity determined by elastosonography to predict preterm labor. J Matern Fetal Neonatal Med. 2014;27(15):1518–1521. doi:10.3109/14767058.2013.863864
20. Shao MJ, Hu MX, Xu XJ, et al. Management of caesarean scar pregnancies using an intrauterine or abdominal approach based on the myometrial thickness between the gestational mass and the bladder wall. Gynecol Obstet Invest. 2013;76(3):151–157. doi:10.1159/000351875
21. Wei M, Ye X. Feasibility of Point Shear Wave Elastography for Evaluating Diabetic Peripheral Neuropathy. J Ultrasound Med. 2020;39(6):1135–1141. doi:10.1002/jum.15198
22. Guo Y, Long X, Yao S, et al. Prospective Study on Mid-gestational Uterine Muscular Thickness and Preterm Birth. Chine J Obstetrics Gynecol. 2015;50(2):108–111.
23. Atarjavdan L, Khazaeipour Z, Shahbazi F. Corre- lation of myometrial thickness and the latency interval of women with preterm premature rupture of the membranes. Arch Gynecol Obstet. 2011;284(6):1339–1343. doi:10.1007/s00404-011-1841-x
 © 2023 The Author(s). This work is published and licensed by Dove Medical Press Limited. The
full terms of this license are available at https://www.dovepress.com/terms
and incorporate the Creative Commons Attribution
- Non Commercial (unported, 3.0) License.
By accessing the work you hereby accept the Terms. Non-commercial uses of the work are permitted
without any further permission from Dove Medical Press Limited, provided the work is properly
attributed. For permission for commercial use of this work, please see paragraphs 4.2 and 5 of our Terms.
© 2023 The Author(s). This work is published and licensed by Dove Medical Press Limited. The
full terms of this license are available at https://www.dovepress.com/terms
and incorporate the Creative Commons Attribution
- Non Commercial (unported, 3.0) License.
By accessing the work you hereby accept the Terms. Non-commercial uses of the work are permitted
without any further permission from Dove Medical Press Limited, provided the work is properly
attributed. For permission for commercial use of this work, please see paragraphs 4.2 and 5 of our Terms.