Back to Journals » Journal of Inflammation Research » Volume 18
Correlation Between Peripheral Blood Immune Cell Distribution and Disease Severity and Prognosis in Multiple Sclerosis Patients
Authors Liu PJ, Yuan P, Liu SP
Received 27 January 2025
Accepted for publication 2 July 2025
Published 28 July 2025 Volume 2025:18 Pages 10051—10059
DOI https://doi.org/10.2147/JIR.S519729
Checked for plagiarism Yes
Review by Single anonymous peer review
Peer reviewer comments 2
Editor who approved publication: Dr Junhao Wang
Pen-Ju Liu, Peng Yuan, Shui-Ping Liu
Department of Neurology, Beijing Anzhen Hospital, Capital Medical University, Beijing, 100029, People’s Republic of China
Correspondence: Pen-Ju Liu, Department of Neurology, Beijing Anzhen Hospital, Capital Medical University, No. 2 Anzhen Road,Chaoyang District, Beijing, 100029, People’s Republic of China, Tel +86-13521678687, Email [email protected]
Objective: This study aimed to examine the relationship between peripheral blood immune cell distribution patterns and both disease severity and prognosis in patients with multiple sclerosis (MS).
Methods: We conducted a retrospective analysis of clinical data from MS patients admitted to the Neurology Department of our Hospital between March 2020 and April 2024. Data collected included gender, age (years), disease duration (months), clinical manifestations, and results from blood and cerebrospinal fluid (CSF) tests. Disease severity and prognosis were assessed using the Expanded Disability Status Scale (EDSS) and Multiple Sclerosis Functional Composite (MSFC). Spearman correlation and multivariate linear regression (adjusted for age, gender, disease duration, and MS subtype) were employed to evaluate associations.
Results: Of the MS patients studied, 10.4% (n=7) exhibited abnormal CSF pressure. The mean peripheral blood leukocyte count was 6.69 × 10⁹/L, with neutrophils predominating (64.32% of total leukocytes), followed by lymphocytes (25.54%). The Neutrophil-to-Lymphocyte Ratio (NLR) and Monocyte-to-Lymphocyte Ratio (MLR) were 3.63 ± 2.30 and 0.33 ± 0.18, respectively. Among lymphocytes, T cells were most abundant (70.37%), with CD4+T cells comprising 40.89% and CD8+T cells at 27.80%. EDSS scores showed positive correlations with monocyte percentage (P=0.027) and MLR (P< 0.001). ZMSFC scores negatively correlated with monocyte percentage (P=0.007) and positively with T lymphocyte percentage (P=0.006). Multivariate regression confirmed MLR (β = 1.02, P < 0.001) and monocyte percentage (β = 0.24, P = 0.004) as independent predictors of EDSS severity.
Conclusion: In MS patients, peripheral blood immune cells are predominantly neutrophils and lymphocytes, with CD4+T and CD8+T lymphocytes being the most prevalent lymphocyte subtypes. The distribution of these immune cells correlates significantly with MS disease severity and prognosis. Our findings suggest that immune cell subsets and MLR may serve as valuable indicators for monitoring MS progression and outcomes.
Keywords: immune cells, multiple sclerosis, lymphocytes, cerebrospinal fluid
Introduction
Multiple sclerosis (MS) is a leading cause of non-traumatic neurological disability in young adults, characterized primarily by inflammatory demyelination in the central nervous system (CNS).1 The majority of MS patients initially present with relapsing-remitting MS (RRMS), a form marked by recurrent episodes of focal inflammatory demyelination. Over time, despite a reduction in inflammatory activity, the cumulative damage to neurons and axons leads to irreversible neurodegenerative changes.2 Consequently, more than two-thirds of RRMS patients eventually transition to secondary progressive MS (SPMS).3 Although the exact cause of MS remains unclear, it is currently understood to be an immune-mediated inflammatory disease associated with central nervous system white matter lesions and widespread demyelination.4
Immune response mechanisms play a crucial role in MS pathogenesis, involving processes such as Epstein-Barr virus infection, B cell clonal expansion, CD8+T cell activation, and microglial activation.5 In the pathology of multiple sclerosis (MS), research has emphasized the infiltration of T cells into the cerebrospinal fluid (CSF) and their potential pathological roles.6,7 For instance, the abnormal CSF environment in MS patients can recruit follicular helper T cells (Tfh), particularly Tfh1, which can traverse the blood-brain barrier from peripheral blood to the CNS, subsequently activating B cells.8 Moreover, elevated levels of CD3+T cells and natural killer (NK) cells have been observed in the CSF of MS patients compared to healthy controls.9 In the perivascular spaces of affected brain tissue, there is a marked infiltration of CD3+ T cells, with a significantly higher proportion of CD8+ T cells compared to CD4+ T cells.10 Peripheral blood studies have revealed an increased proportion of circulating Tfh cells in MS patients, correlating with disease activity and severity, further underscoring the critical role of immune cells in MS immunopathogenesis.11
While there have been many studies that delve into the role of specific immune cell subsets, most of these studies have focused on a single or a few immune cell types,12,13 leaving a gap in our understanding of the comprehensive immune cell landscape in MS. This study aims to bridge this gap by collecting clinical data and CSF test results from MS patients and employing flow cytometry to characterize peripheral blood immune cells. Our objectives are to analyze the distribution and characteristics of various immune cell subsets in the peripheral blood of MS patients and to explore potential correlations between these immune cell profiles and disease severity and prognosis.
Materials and Methods
Research Object
We conducted a retrospective analysis of clinical data from MS patients admitted to the Neurology Department of our Hospital between March 2020 and April 2024. Patients were included if they: (1) met the 2017 McDonald diagnostic criteria for MS, including various clinical subtypes such as Clinically Isolated Syndrome (CIS), RRMS, SPMS, and Primary Progressive MS (PPMS);14 (2) were aged 18–55 years; and (3) Have not received immunomodulatory therapy (such as interferon, fingolimod, etc). within 6 months prior to enrollment to avoid the interference of recent treatment on the composition of immune cells and ensure a relatively stable baseline immune status; (4) Not receiving anti-CD20 therapy (such as rituximab, ocrelizumab, etc). within 12 months prior to enrollment to rule out the long-term effects of these drugs on immune cell composition. Exclusion criteria were: (1) severe cardiac, pulmonary, hepatic, or renal dysfunction; (2) malignant tumors or severe infections; (3) presence of other autoimmune diseases (eg, rheumatoid arthritis, ankylosing spondylitis, systemic lupus erythematosus); (4) other CNS disorders such as cerebral infarction or hemorrhage; (5) poor compliance; and (6) pregnancy or lactation. This study strictly adheres to the principles of the Declaration of Helsinki and has been approved by the Medical Ethics Committee of Beijing Anzhen Hospital Affiliated to Capital Medical University [(2022)kelunshendi(17)hao]. Although this is a retrospective study, we still value the informed consent process for each participant. All participants provided written informed consent.
Research Methods
Data Collection
We collected clinical data including gender, age (years), disease duration (months), and medical history. MS subtypes were classified as RRMS, PPMS, SPMS, and CIS.15 We documented clinical symptoms, focusing primarily on limb numbness, limb weakness, optic nerve abnormalities, dizziness, and pain.
To assess the severity of neurological deficits, we employed the Expanded Disability Status Scale (EDSS).16 This scale evaluates seven functional systems (pyramidal, brainstem, visual, sensory, cerebral/mental, bowel/bladder, and cerebellar) and includes an “other” category. The EDSS score, ranging from 0 (normal) to 10 (death due to MS) in 0.5-point increments, is derived from these subscores along with assessments of walking distance, use of walking aids, and self-care ability. Higher scores reflect greater disability.
We used the Multiple Sclerosis Functional Composite (MSFC) to evaluate patient recovery and prognosis.17 The MSFC comprises three tests, with rest periods of at least 10 minutes between each. Test results were converted to Z-scores using reference parameters from the NMSS database, with higher scores indicating a better prognosis. The overall MSFC score (ZMSFC) was calculated as the average of these three Z-scores.
CSF Analysis
Lumbar punctures were performed on all patients under sterile conditions within 48 hours of admission. A 3 mL CSF sample was collected in a sterile, dry tube. CSF cells were isolated using the slide centrifugation method. The entire slide was first examined under low magnification to assess specimen quality and conduct a general cell evaluation. A cell differential count was then performed under high magnification using a cell counter. Key parameters measured included CSF pressure abnormalities, white blood cell count, glucose and chloride content, and protein levels.
Peripheral Blood Immune Parameters
Fasting venous blood samples (10–20 mL) were collected from each patient. Peripheral blood was analyzed for total white blood cell count and differential counts of neutrophils, monocytes, lymphocytes, eosinophils, and basophils. The neutrophil-to-lymphocyte ratio (NLR) and monocyte-to-lymphocyte ratio (MLR) were calculated. Lymphocyte subsets were further analyzed using a DxFLEX flow cytometer (Beckman Coulter, USA) to determine the percentages of T lymphocytes (CD4+T and CD8+T), B lymphocytes, and NK cells.
When analyzing peripheral blood lymphocyte subsets, the acquired data are first preliminarily processed using FlowJo software. The following steps are used to set the door: First, a single cell population is delineated using forward-scattered light (FSC) and side-scattered light (SSC) to remove debris and dead cells. Next, in the above cell populations, the leukocyte population is further differentiated from the SSC by the CD45 marker, removing the non-leukocyte components. Adjust the compensation matrix using a single-stain control to ensure minimal spillage between different fluoresceins. After the leukocyte population is determined, the gates of T cells, B cells, NK cells and their subsets are set according to the specific surface markers expressed (such as CD3, CD4, CD8, etc).
The antibodies used for flow cytometry analysis in this study and their corresponding fluorescent labels are shown in the Supplementary Table 1. These antibodies are used to identify and quantify different lymphocyte subsets, including total T lymphocytes (CD3), helper T cells (CD4 T), cytotoxic T cells (CD8 T), B lymphocytes (CD19), and natural killer cells (CD56). All samples were stained according to the manufacturer’s instructions and tested on the DxFLEX Flow Cytometer. A detailed schematic diagram of flow cytometry analysis is shown in Supplementary Figure 1.
Statistical Analysis
Statistical analyses were conducted using SPSS version 26.0 (IBM Corp., Armonk, NY, USA). Categorical variables were summarized as frequencies and percentages, with 95% confidence intervals (CIs) calculated using the Clopper-Pearson method for binomial proportions. Continuous variables following a normal distribution (assessed via Shapiro–Wilk test) were expressed as mean ± standard deviation (SD), accompanied by 95% CIs derived from the t-distribution. Non-normally distributed variables were reported as median (interquartile range). Correlation analyses between immune parameters and clinical outcomes (EDSS and ZMSFC scores) were performed using Spearman’s rank correlation. Effect sizes were reported as correlation coefficients (r) with 95% CIs, calculated via Fisher’s Z-transformation to account for non-normal distributions. To adjust for potential confounding factors (age, gender, disease duration, and MS subtype), multivariate linear regression models were constructed. Variables were selected based on clinical relevance and prior literature. Regression coefficients (β) with 95% CIs and standardized beta values were reported to quantify effect sizes. Statistical significance was set at a two-tailed P < 0.05. No adjustments for multiple comparisons were applied due to the exploratory nature of the study, but results were interpreted cautiously in light of potential type I error.
Results
Distribution of Baseline Clinical Data in MS Patients
The study included 67 MS patients aged 18–55 years (mean age: 34.72 ± 12.15 years, 95% CI: 31.71–37.73). Female patients comprised 61.19% of the cohort (95% CI: 48.5–72.6%), slightly outnumbering males. First-onset patients accounted for 20.90% (95% CI: 12.3–33.1%). The most common MS subtype was RRMS (59.7%, 95% CI: 47.3–71.0%), followed by CIS (20.9%, 95% CI: 12.5–32.6%). The most prevalent clinical symptoms were limb numbness (47.8%, 95% CI: 35.6–60.2%), limb weakness (22.4%, 95% CI: 13.5–34.5%), and optic nerve disorders (13.4%, 95% CI: 6.7–24.1%). CSF analysis revealed pressure abnormalities in 7 patients (10.4%, 95% CI: 4.6–20.3%), with mean values of white blood cell count (9.32 ± 5.13 ×10⁶/L, 95% CI: 8.06–10.58), glucose content (3.43 ± 0.59 mmol/L, 95% CI: 3.28–3.58), chloride level (124.81 ± 1.83 mmol/L, 95% CI: 124.35–125.27), and protein level (0.36 ± 0.13 g/L, 95% CI: 0.33–0.39) (Table 1).
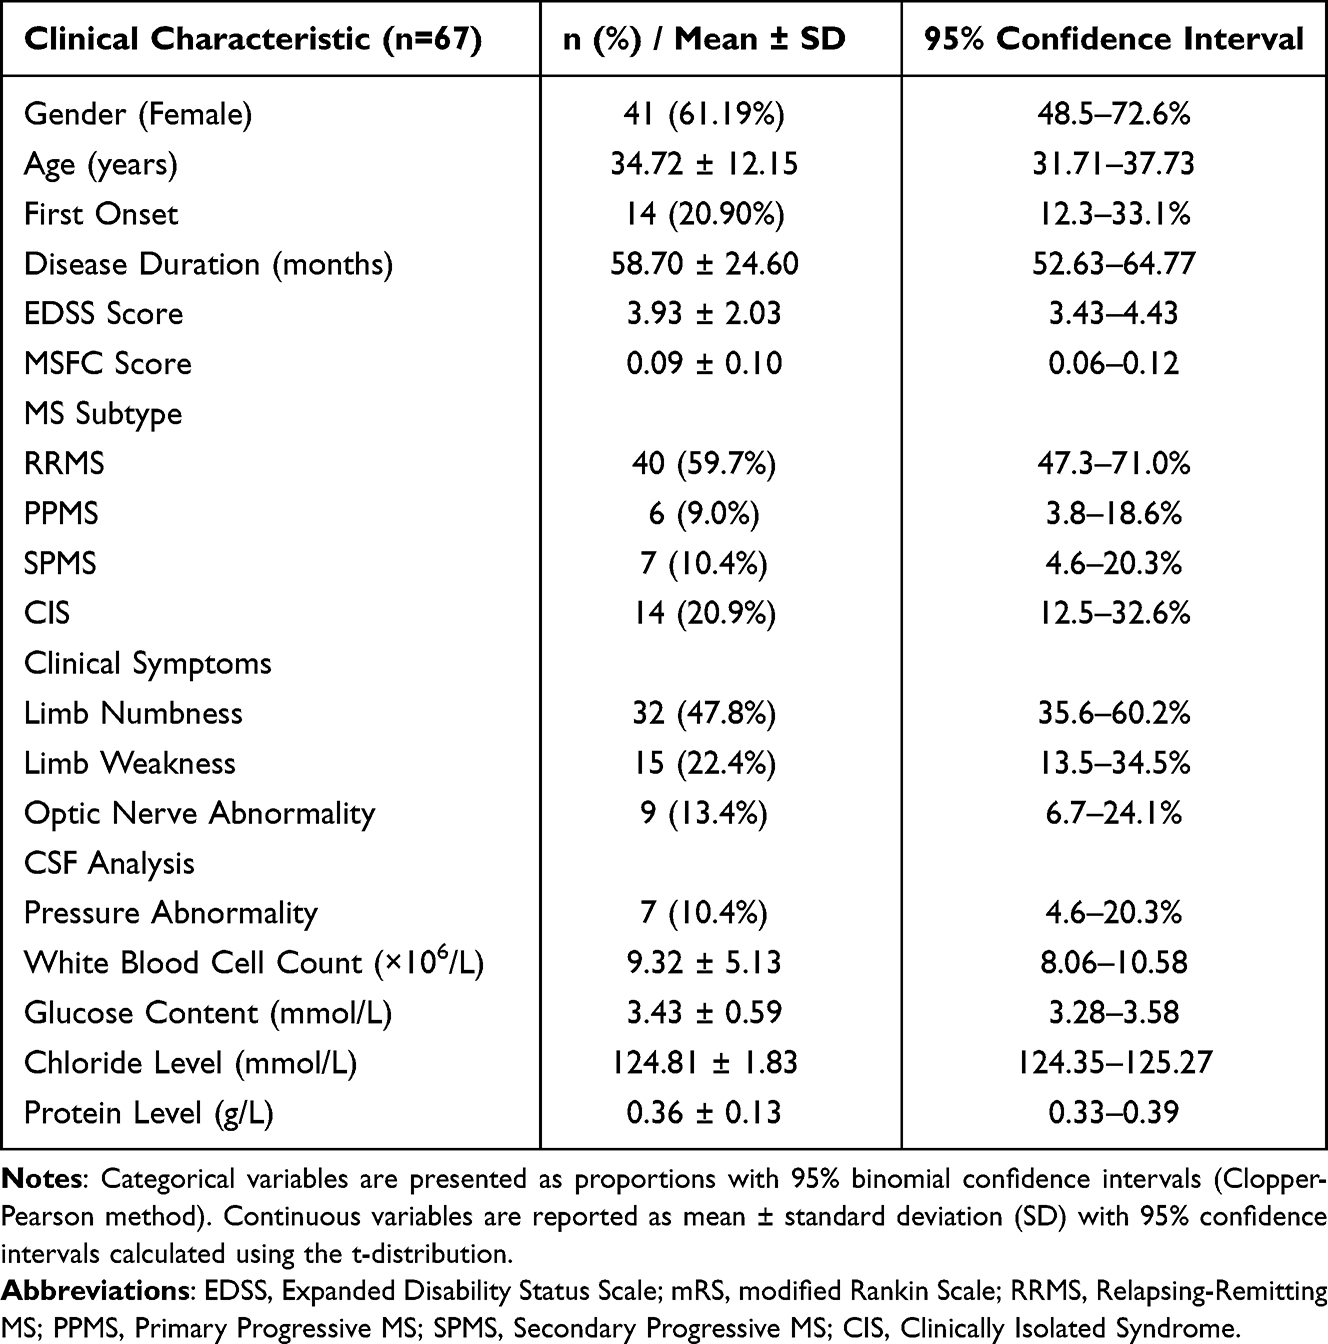 |
Table 1 Distribution of Baseline Clinical Data in MS Patients |
Distribution of Peripheral Blood Immune Parameters in MS Patients
The mean white blood cell count was 6.69 ×10⁹ L (95% CI: 6.09–7.29), with neutrophils predominating (65.09 ± 10.42%, 95% CI: 62.51–67.67), followed by lymphocytes (25.54 ± 7.47%, 95% CI: 23.70–27.38). The mean NLR and MLR were 3.63 ± 2.30 (95% CI: 3.07–4.19) and 0.33 ± 0.18 (95% CI: 0.29–0.37), respectively. T lymphocytes constituted the majority of lymphocytes (70.37 ± 8.59%, 95% CI: 68.25–72.49), with CD4+T cells accounting for 40.89 ± 8.13% (95% CI: 38.88–42.90) and CD8+T cells for 27.80 ± 7.07% (95% CI: 26.06–29.54) (Table 2).
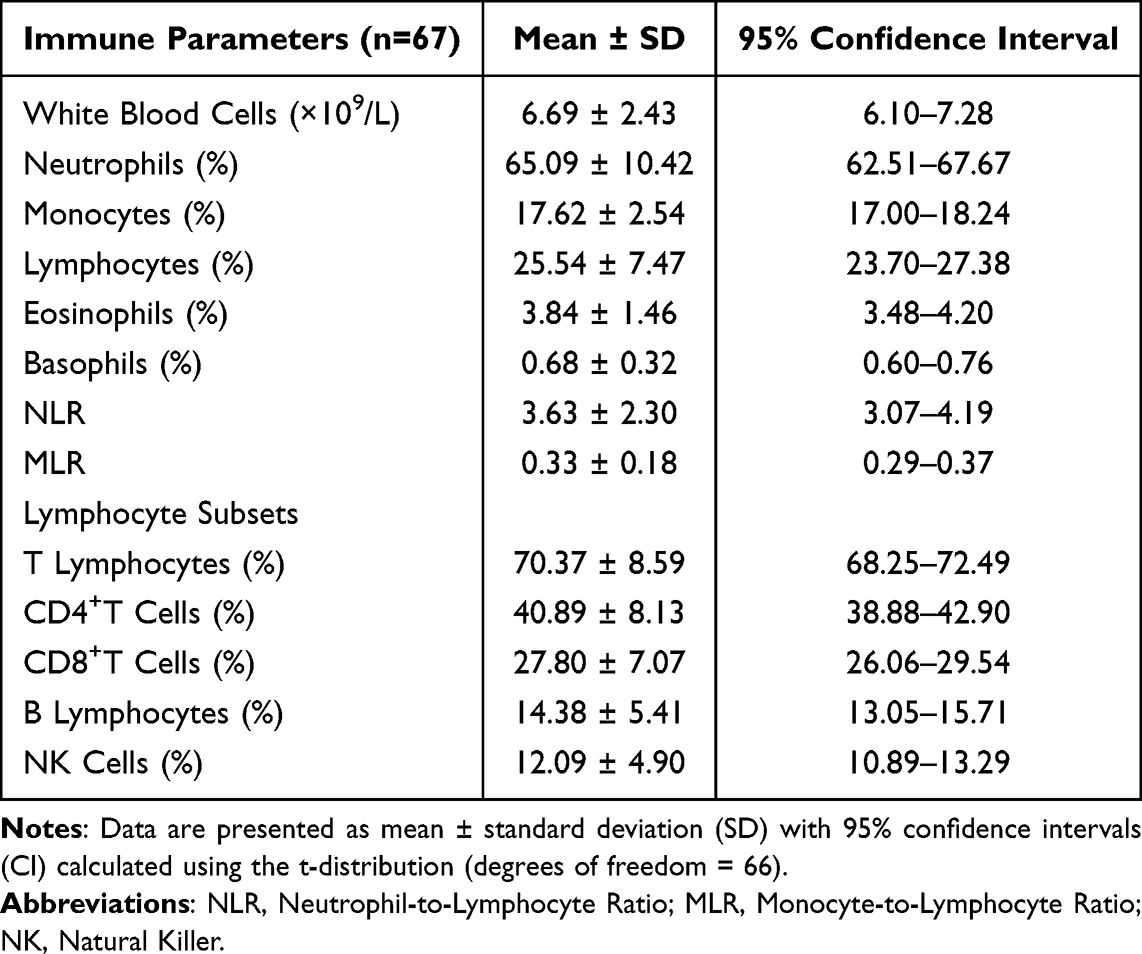 |
Table 2 Distribution of Peripheral Blood Immune Parameters in MS Patients |
Correlation of Peripheral Blood Immune Parameters with Disease Severity and Prognosis in MS Patients
To assess disease severity in MS patients, we employed the EDSS. Spearman correlation analyses revealed significant positive correlations between EDSS scores and monocyte percentage (r = 0.270, 95% CI: 0.03–0.48, P = 0.027) and MLR (r = 0.450, 95% CI: 0.23–0.63, P < 0.001). For prognosis, ZMSFC scores showed a negative correlation with monocyte percentage (r = −0.327, 95% CI: −0.52–−0.10, P = 0.007) and a positive correlation with T lymphocyte percentage (r = 0.331, 95% CI: 0.11–0.52, P = 0.006). These results suggest that elevated monocyte proportions or MLR may indicate disease exacerbation, while higher T lymphocyte percentages correlate with better functional outcomes (Table 3). These results indicate that increased monocyte percentages and decreased T lymphocyte percentages may be unfavorable for patient prognosis.
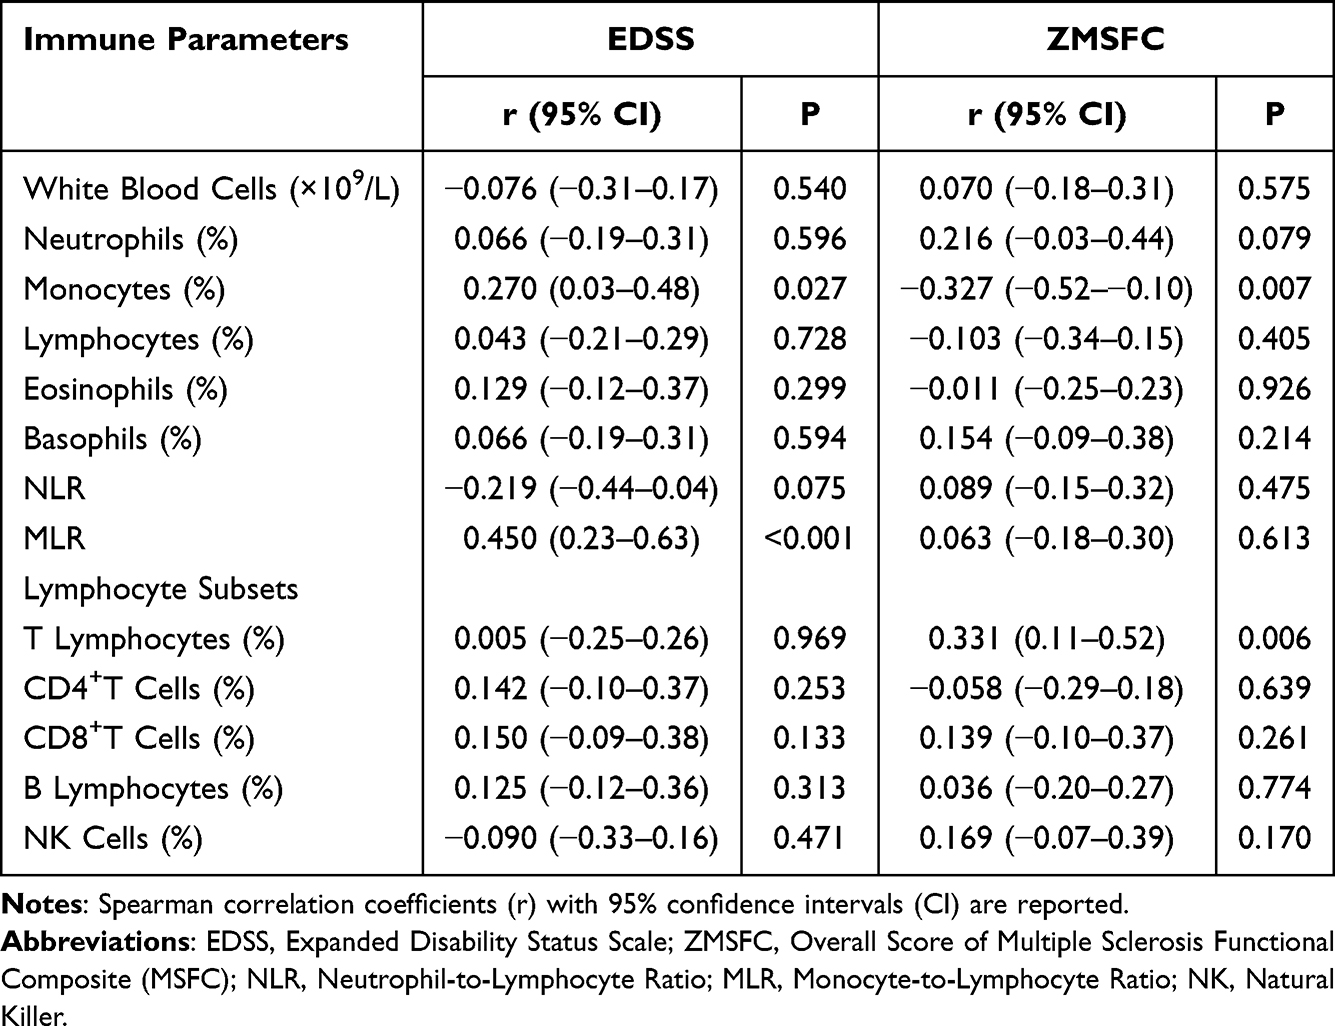 |
Table 3 Correlation of Peripheral Blood Immune Parameters with Disease Severity and Prognosis in MS Patients |
Multivariate Regression Analysis Adjusting for Confounding Factors
To address potential confounding effects, we performed multivariate linear regression analyses adjusting for age, gender, disease duration, and MS subtype. These covariates were selected based on their clinical relevance and prior evidence suggesting their influence on immune profiles and disease outcomes in MS. After adjustment, monocyte percentage (β = 0.24, 95% CI: 0.08–0.40, P = 0.004) and MLR (β = 1.02, 95% CI: 0.61–1.43, P < 0.001) remained independently associated with higher EDSS scores. Notably, disease duration (β = 0.03, 95% CI: 0.01–0.05, P = 0.008) also significantly predicted EDSS severity, whereas age and gender did not reach statistical significance (P > 0.05).
For prognosis, T lymphocyte percentage retained a positive correlation with ZMSFC scores (β = 0.18, 95% CI: 0.05–0.31, P = 0.007), while monocyte percentage showed an inverse relationship (β = −0.22, 95% CI: −0.38–(−0.06), P = 0.006). MS subtype (RRMS vs progressive forms) emerged as an independent predictor of ZMSFC (β = 0.15, 95% CI: 0.03–0.27, P = 0.014) (Table 4).
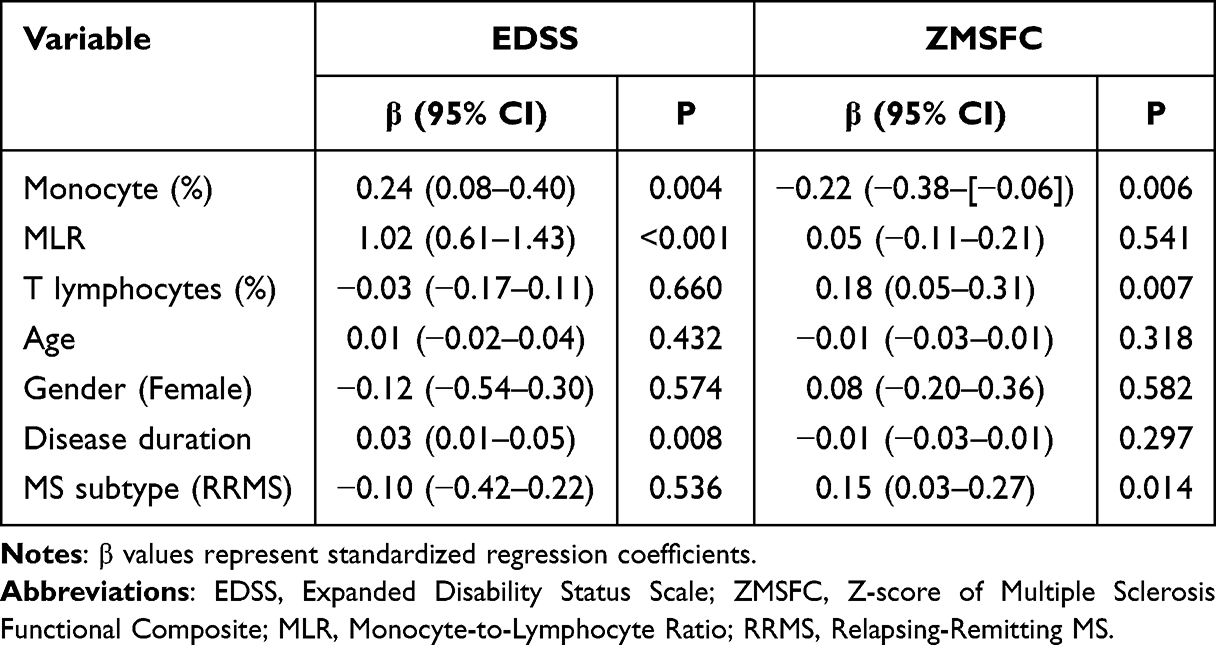 |
Table 4 Multivariate Regression Analysis of Immune Parameters and Clinical Covariates Associated with Disease Severity (EDSS) and Prognosis (ZMSFC) |
Discussion
MS is a demyelinating disease of the CNS characterized by disseminated, multifocal lesions. The most significant clinical features of MS are the remission and relapse of symptoms during the disease course, manifesting as multiplicity in both time and space. MS presents complex symptoms and signs, including multiple intracranial lesions, ocular muscle paralysis, limb paralysis, pyramidal tract signs, and psychiatric symptoms. These manifestations severely impact patients’ health and quality of life.18 Consequently, early diagnosis and treatment are crucial for improving the prognosis of MS patients. Our study results demonstrate that MS predominantly affects young and middle-aged adults, with a higher proportion of female patients. RRMS is the most common disease type. The primary clinical symptoms include sensory disturbances, limb weakness, and optic nerve disorders, which are consistent with the findings of Zhao et al.19
Immune cells, including lymphocytes, granulocytes, monocytes/macrophages, and dendritic cells, play crucial roles in immune responses. Previous research has shown that CD8+T cells are several times more abundant than CD4+T cells in intracranial lesions and CSF of MS patients. These cells express granzyme B and possess cytotoxic activity.20 B cells are essential in presenting antigens to T lymphocytes in the context of type II major histocompatibility complex, thereby facilitating T lymphocytes’ pathogenic effects.21 Our study found that in patients with MS, neutrophils make up the largest proportion of peripheral blood leukocytes, followed by lymphocytes. Among lymphocytes, T cells and B cells account for higher proportions, while NK cells are present in lower percentages.
The NLR and MLR have emerged as valuable biomarkers for assessing pathogenic inflammation and prognosis in various medical conditions. Elevated ratios may signify increased innate immune system activation, initiation of pro-inflammatory processes, and dysregulation of adaptive immune responses.22 Higher NLR and MLR levels have been linked to more severe clinical manifestations in autoimmune encephalitis23 and poor functional outcomes in acute ischemic stroke. In the field of MS research, Demirci et al pioneered the discovery that peripheral blood NLR in MS patients was significantly higher than in healthy controls, correlating with disease progression and disabling exacerbations.24 On this basis, the role of MLR is further discussed, and it is found that there is a significant positive correlation between MLR and EDSS scores, which provides a new perspective for assessing the severity of MS. Although Arneth et al explored the role of T cells in MS in depth,7 this article focuses not only on T cells, but also on the analysis of other important immune cell types such as neutrophils, monocytes, etc. This contributes to a comprehensive understanding of the immunopathological mechanisms of MS. In future studies, we will explore more understudied immune cell subsets and their role in the pathological mechanisms of MS. Our study corroborates these findings, demonstrating a positive correlation between MLR and EDSS scores in MS patients. This suggests that higher MLR values are associated with more severe MS conditions, reflecting changes in patients’ immune cell distribution as disease severity increases.
The EDSS is widely used to evaluate neurological dysfunction and disease severity in MS patients. In contrast, the MSFC provides an objective analysis of motor and cognitive function impairment. While the MSFC is less effective for short-term efficacy evaluation, it offers greater sensitivity to disease status changes compared to the EDSS. Previous research has identified several factors associated with EDSS scores, including age, MS annual relapse rate, number of relapses, disease duration, medication use, serum albumin levels, triglycerides, and total intracranial MRI lesions.25 Our study reveals positive correlations between EDSS scores and both monocyte percentage and MLR in MS patients. Conversely, MSFC scores show a negative correlation with monocyte percentage and a positive correlation with T lymphocyte percentage. These findings underscore the influence of immune cell proportions on MS severity and prognosis, suggesting that more severe inflammatory processes correspond to more pronounced disease manifestations. Further multivariate regression analysis demonstrated the robustness of monocyte percentage and MLR in predicting EDSS scores, highlighting their potential as biomarkers of disease severity even after adjusting for confounding factors. On the contrary, as reflected by ZMSFC, the percentage of T lymphocytes and MS subtypes independently affect prognosis. These findings emphasize the necessity of considering clinical covariates in future research to improve predictive models for MS outcomes. Limitations include a lack of data on comorbidities and hormone status, which is worth exploring in prospective cohorts. Although this study provides important information on the relationship between immune cell distribution and the severity of MS disease, more in-depth research is needed to determine the optimal operational threshold before it can be translated into diagnostic tools or treatment guidelines in daily clinical practice.
In recent years, monocyte subpopulations (such as classical monocytes, intermediate monocytes, and non-classical monocytes) have garnered significant attention in the context of multiple sclerosis (MS). Research has shown that these monocyte subpopulations play crucial roles in the inflammatory responses and immune regulation associated with MS. For instance, Zhang et al26 highlighted that the infiltration of monocytes into the central nervous system (CNS) plays a key role in the pathogenesis of MS and proposed therapeutic strategies targeting monocytes. Additionally, Arneth’s27 systematic review emphasized the importance of non-classical monocytes in patients with MS. Although we did not measure the proportions of monocyte subpopulations in the current study, these studies provide important theoretical foundations and directions for our future research. We plan to include measurements of monocyte subpopulations in future prospective studies to gain a more comprehensive understanding of the immune status of MS patients and its relationship with disease progression.
Our study has several limitations. First, As a single-center retrospective study utilizing clinical data from MS patients treated at our hospital, it may be subject to selection bias. Second, this is a small, single-center study with limited sample size and lack of longitudinal data, which may not be representative of the broader MS patient population, and it is necessary to expand the sample size and adopt a specific protocol for multicenter design in the future to collect longitudinal data to better assess disease progression and prognosis. Furthermore, the lack of patient follow-up prevented the acquisition of prognostic information and data on disease progression. Future research should employ more comprehensive and precise detection methods to develop more effective monitoring indicators for MS diagnosis and treatment. In particular, the role of monocyte subsets (such as classical, intermediate, and non-classical monocytes) in MS is an important research direction. We plan to add measurements of monocyte subsets in future prospective studies to gain a more complete understanding of the immune status of MS patients and their relationship to disease progression. Finally, Although this study does not directly compare leukocyte levels in CSF versus peripheral blood mononuclear cells (PBMCs), this comparison may provide important clues to understand the dynamics of the inflammatory response in MS from the periphery to the central nervous system. Future research should consider including this aspect of the analysis to gain a more comprehensive understanding. While this study focused on a direct association between peripheral blood immune cell distribution and MS disease, we recognize that factors such as comorbidities, dietary habits, and hormone levels may have an impact on the findings. Therefore, in future study designs, we will include these variables as control factors and adjust their effects by multiple regression analysis.
Conclusion
In MS patients, peripheral blood immune cell infiltration is primarily characterized by neutrophils and lymphocytes, with CD4+T and CD8+T lymphocytes representing the largest lymphocyte subpopulations. The distribution of peripheral blood immune cells correlates with MS disease severity and prognosis. Although our study suggests that MLR may be a useful indicator of MS severity, these findings should be interpreted with caution due to the preliminary nature of the study and sample size limitations. Future large-scale studies will help confirm the exact value of MLR and other immune cell subsets in MS management.
Data Sharing Statement
All data generated or analysed during this study are included in this article. Further enquiries can be directed to the corresponding author.
Ethics Approval and Consent to Participate
This study was conducted in accordance with the Declaration of Helsinki and approved by the ethics committee of Beijing Anzhen Hospital, Capital Medical University. Written informed consent was obtained from all participants.
Funding
This study was supported by the National Natural Science Foundation secured assistance for this research (NSF 81870951). Funding agencies did not play a role in study design, data collection, analysis and interpretation, and manuscript writing.
Disclosure
All of the authors had no any personal, financial, commercial, or academic conflicts of interest separately.
References
1. Dobson R, Giovannoni G. Multiple sclerosis - a review. Eur J Neurol. 2019;26(1):27–40. doi:10.1111/ene.13819
2. Wingerchuk DM, Weinshenker BG. The natural history of multiple sclerosis: implications for trial design. Curr Opin Neurol. 1999;12(3):345–349. doi:10.1097/00019052-199906000-00013
3. Ng D, Meuth SG, Martinez-Lapiscina EH, et al. Treatment of Patients with Multiple Sclerosis Transitioning Between Relapsing and Progressive Disease. CNS Drugs. 2023;37(1):69–92. doi:10.1007/s40263-022-00977-3
4. Niino M, Miyazaki Y. Relapsing-Remitting Multiple Sclerosis. Brain Nerve. 2021;73(5):442–449. doi:10.11477/mf.1416201784.
5. Rodríguez Murúa S, Farez MF, Quintana FJ. The Immune Response in Multiple Sclerosis. Annu Rev Pathol. 2022;17:121–139. doi:10.1146/annurev-pathol-052920-040318
6. van Langelaar J, Rijvers L, Smolders J, et al. B and T Cells Driving Multiple Sclerosis: identity, Mechanisms and Potential Triggers. Front Immunol. 2020;11:760. doi:10.3389/fimmu.2020.00760
7. Arneth B. Contributions of T cells in multiple sclerosis: what do we currently know? J Neurol. 2021;268(12):4587–4593. doi:10.1007/s00415-020-10275-x
8. Morille J, Mandon M, Rodriguez S, et al. Multiple Sclerosis CSF Is Enriched With Follicular T Cells Displaying a Th1/Eomes Signature. Neurol Neuroimmunol Neuroinflamm. 2022;9(6):e200033. doi:10.1212/NXI.0000000000200033
9. Liu R, Du S, Zhao L, et al. Autoreactive lymphocytes in multiple sclerosis: pathogenesis and treatment target. Front Immunol. 2022;13:996469. doi:10.3389/fimmu.2022.996469
10. Fransen NL, Hsiao CC, van der Poel M, et al. Tissue-resident memory T cells invade the brain parenchyma in multiple sclerosis white matter lesions. Brain. 2020;143(6):1714–1730. doi:10.1093/brain/awaa117
11. Cunill V, Massot M, Clemente A, et al. Relapsing-Remitting Multiple Sclerosis Is Characterized by a T Follicular Cell Pro-Inflammatory Shift, Reverted by Dimethyl Fumarate Treatment. Front Immunol. 2018;9:1097. doi:10.3389/fimmu.2018.01097
12. Baker D, Jacobs BM, Gnanapavan S, et al. Plasma cell and B cell-targeted treatments for use in advanced multiple sclerosis. Mult Scler Relat Disord. 2019;35:19–25. doi:10.1016/j.msard.2019.06.030
13. de Sèze J, Maillart E, Gueguen A, et al. Anti-CD20 therapies in multiple sclerosis: from pathology to the clinic. Front Immunol. 2023;14:1004795. doi:10.3389/fimmu.2023.1004795.
14. Thompson AJ, Banwell BL, Barkhof F, et al. Diagnosis of multiple sclerosis: 2017 revisions of the McDonald criteria. Lancet Neurol. 2018;17(2):162–173. doi:10.1016/S1474-4422(17)30470-2
15. Hauser SL, Cree BAC. Treatment of Multiple Sclerosis: a Review. Am J Med. 2020;133(12):1380–1390.e2. doi:10.1016/j.amjmed.2020.05.049
16. Kurtzke JF. Rating neurologic impairment in multiple sclerosis: an expanded disability status scale (EDSS). Neurology. 1983;33(11):1444–1452. doi:10.1212/wnl.33.11.1444
17. Fischer JS, Rudick RA, Cutter GR, et al. The Multiple Sclerosis Functional Composite Measure (MSFC): an integrated approach to MS clinical outcome assessment. National MS Society Clinical Outcomes Assessment Task Force. Mult Scler. 1999;5(4):244–250. doi:10.1177/135245859900500409
18. Vasileiou ES, Fitzgerald KC. Multiple Sclerosis Pathogenesis and Updates in Targeted Therapeutic Approaches. Curr Allergy Asthma Rep. 2023;23(9):481–496. doi:10.1007/s11882-023-01102-0
19. Zhao W, Sun L, Yang Y, et al. Analysis of Clinical Manifestations in Multiple Sclerosis Patients. China J Pharm Econ. 2014;9(01):293–294.
20. Mestre L, Alonso G, Feliú A, et al. Aging and neuroinflammation: changes in immune cell responses, axon integrity, and motor function in a viral model of progressive multiple sclerosis. Aging Cell. 2021;20(9):e13440. doi:10.1111/acel.13440
21. Naderi W, Schreiner D, King CG. T-cell-B-cell collaboration in the lung. Curr Opin Immunol. 2023;81:102284. doi:10.1016/j.coi.2023.102284
22. Mureșan AV, Russu E, Arbănași EM, et al. The Predictive Value of NLR, MLR, and PLR in the Outcome of End-Stage Kidney Disease Patients. Biomedicines. 2022;10(6):1272. doi:10.3390/biomedicines10061272
23. Liu Z, Li Y, Wang Y, et al. The Neutrophil-to-Lymphocyte and Monocyte-to-Lymphocyte Ratios Are Independently Associated With the Severity of Autoimmune Encephalitis. Front Immunol. 2022;13:911779. doi:10.3389/fimmu.2022.911779
24. Demirci S, Demirci S, Kutluhan S, et al. The clinical significance of the neutrophil-to-lymphocyte ratio in multiple sclerosis. Int J Neurosci. 2016;126(8):700–706. doi:10.3109/00207454.2015.1050492
25. Xue H, Yang Z, Wang L, et al. Factors Influencing the Degree of Disability in Patients With Multiple Sclerosis. Front Neurol. 2021;12:714631. doi:10.3389/fneur.2021.714631
26. Zhang G, Yao Q, Long C, et al. Infiltration by monocytes of the central nervous system and its role in multiple sclerosis: reflections on therapeutic strategies. Neural Regen Res. 2025;20(3):779–793. doi:10.4103/NRR.NRR-D-23-01508
27. Arneth B. Current Knowledge about Nonclassical Monocytes in Patients with Multiple Sclerosis, a Systematic Review. Int J Mol Sci. 2024;25(13):7372. doi:10.3390/ijms25137372
 © 2025 The Author(s). This work is published and licensed by Dove Medical Press Limited. The
full terms of this license are available at https://www.dovepress.com/terms
and incorporate the Creative Commons Attribution
- Non Commercial (unported, 4.0) License.
By accessing the work you hereby accept the Terms. Non-commercial uses of the work are permitted
without any further permission from Dove Medical Press Limited, provided the work is properly
attributed. For permission for commercial use of this work, please see paragraphs 4.2 and 5 of our Terms.
© 2025 The Author(s). This work is published and licensed by Dove Medical Press Limited. The
full terms of this license are available at https://www.dovepress.com/terms
and incorporate the Creative Commons Attribution
- Non Commercial (unported, 4.0) License.
By accessing the work you hereby accept the Terms. Non-commercial uses of the work are permitted
without any further permission from Dove Medical Press Limited, provided the work is properly
attributed. For permission for commercial use of this work, please see paragraphs 4.2 and 5 of our Terms.