Back to Journals » Journal of Multidisciplinary Healthcare » Volume 14
Correlation Between Mini Nutritional Assessment and Anthropometric Measurements Among Community-Dwelling Elderly Individuals in Rural Southern Thailand
Authors Sukkriang N ![]() , Somrak K
, Somrak K
Received 13 April 2021
Accepted for publication 26 May 2021
Published 18 June 2021 Volume 2021:14 Pages 1509—1520
DOI https://doi.org/10.2147/JMDH.S315652
Checked for plagiarism Yes
Review by Single anonymous peer review
Peer reviewer comments 5
Editor who approved publication: Dr Scott Fraser
Naparat Sukkriang,1,2 Kamlai Somrak2,3
1School of Medicine, Walailak University, Nakhon Si Thammarat, 80160, Thailand; 2Walailak University Hospital, Nakhon Si Thammarat, 80160, Thailand; 3School of Nursing, Walailak University, Nakhon Si Thammarat, 80160, Thailand
Correspondence: Naparat Sukkriang
School of Medicine, Walailak University, 222 Thaiburi, Thasala District, Nakhon Si Thammarat, 80160, Thailand
Email [email protected]
Purpose: The Mini Nutritional Assessment (MNA) can be applied to assess nutrition status among community-dwelling elderly individuals by health care professionals. This study aimed to evaluate the correlation of MNA score and anthropometric measurements, gait speed, and handgrip strength among elderly community members. The secondary outcome was to compare the performance of the MNA-SF with the full MNA.
Materials and Methods: The study was a cross-sectional study with 176 elderly individuals aged ≥ 60 years living in rural southern Thailand. The MNA-SF and full MNA scores were obtained by using the standard form in the Thai version of the MNA. We collected anthropometric measurements, gait speed, handgrip strength, and MNA data.
Results: There was a significant positive correlation between body weight, BMI, waist circumference, hip circumference, waist-to-height ratio, waist-to-hip ratio, mid-upper arm circumference, calf circumference, triceps skinfold thickness, handgrip strength and full MNA total score using the partial correlation coefficient after controlling for age and sex. The MNA-SF had sensitivity of 78.79%, specificity of 81.82%, PPV of 50%, NPV of 94.35%, LR+ of 4.33, LR- of 0.26, accuracy of 81.25% and AUC 0.901 when using the full MNA as a reference standard.
Conclusion: The MNA correlated with many anthropometric measurements. The MNA-SF had a high specificity, NPV and accuracy of more than 80% when compared with the full MNA.
Keywords: mini nutritional assessment, malnutrition, elderly, community, anthropometric measurement
Introduction
Malnutrition is an important problem in the elderly population. Nutrition status affects the process of aging and health in elderly people.1 Body composition changes during the aging process, and this also influences nutritional status. There is a progressive decrease in lean body mass and an increase in body fat.1–3 Malnutrition and unintentional weight loss contribute to progressive declines in health, impaired muscle and cognitive function, reduced physical activities, decreased immune function and increased mortality rates.1,4
The Mini Nutritional Assessment (MNA) is a screening and assessment tool for nutritional status. It has a reliable scale and clearly defined thresholds.5 The MNA has been used in primary care by health care professionals to assess nutrition status among community-dwelling elderly individuals because it is available in the community setting and easy to use. Furthermore, it can be used in in-patient department (IPD) and out-patient department (OPD) clinical settings.5–7 The MNA has been recommended by many national and international clinical and scientific organizations. It can be used worldwide by a variety of health professionals, such as physicians, dietitians, nurses, or research assistants.8 The MNA is a noninvasive, simple, well-validated screening tool for malnutrition in elderly individuals in the community, and is recommended for early detection of risk of malnutrition.9
There are two forms of the MNA for assessing nutritional status: the first is the full-form Mini Nutritional Assessment (full MNA), and the second is the short-form Mini Nutritional Assessment (short MNA) or MNA-SF. A limitation of the full screening tool is the large number of items and the length of time required to administer the full MNA, particularly in the primary care and community settings. Since the full MNA is long, has multiple questions and requires much time to complete, the MNA-SF was created in response, particularly for settings where time is limited.5,6,8,10 A previous study showed that the MNA-SF has validity and can be applied in clinical practice and used to assess nutritional status in elderly individuals.6 The full MNA contains 18 items to evaluate nutritional risk that were especially developed for elderly individuals and remains the gold standard for ambulatory elderly individuals.11
The MNA-SF was developed by selecting 6 optimal items from the full MNA to evaluate nutritional risk. The MNA-SF was revised to assess nutritional status with a standardized 6 items, and cut-points were developed to classify outcomes among elderly individuals into three groups, the normal nutritional status group, the at risk of malnutrition group and the malnourished group, the same groups as in the full MNA but using fewer items. Examples of items were reviewed in previous studies, and they are shown in the methods section and at www.mna-elderly.com.5,6,8,10 Furthermore, previous studies demonstrated that anthropometric measurements, such as body mass index (BMI), calf circumference, triceps skinfold thickness and mid-upper arm circumference can be co-evaluated with MNA for assessing nutritional risk.6,12
Anthropometric measurement is an essential feature of geriatric nutritional evaluation because some geriatric syndromes can be detected with anthropometry, such as frailty, malnutrition and sarcopenia.13,14 Anthropometry in elderly individuals included body weight, height, BMI, waist circumference, hip circumference, waist-to-height, waist-to-hip ratio, triceps skinfold thickness, and mid-upper arm circumference.15,16 These measurements can be used to determine malnutrition status and the prognosis of chronic and acute diseases and to assess risk factors for frailty in the elderly.17,18
In Thailand, the elderly population is the second-highest among the Association of Southeast Asian Nations (ASEAN) countries. Over the next 20 years, the proportion of elderly individuals in the population of Thailand is expected to increase.19 The nutritional status of the elderly population, as they represent a larger proportion of the total population, is salient to social welfare because malnutrition can cause impaired functional status and poor quality of life. There is no previous study on the validation of the MNA-SF compared with the full MNA in southern Thailand or on the correlation between the two MNA types and anthropometric assessments in southern Thailand. This study aimed to evaluate the correlation of the MNA and anthropometric measurements among community-dwelling elderly individuals in rural southern Thailand. The secondary outcome was to compare the performance of the MNA-SF with the full MNA in this population.
Materials and Methods
Study Design, Setting and Sample Size
This cross-sectional study was carried out in Pak Phanang District, Nakhon Si Thammarat, Thailand, a province in southern Thailand, from 30 April 2020 to 31 July 2020. Per sample size calculations, at least 168 patients were required for our study. Overall, 176 participants, 75 men and 101 women, aged ≥60 years, living in rural southern Thailand and who could communicate and answer the questionnaire voluntarily participated in this research after giving informed consent. The participants were selected by using simple random sampling from the communities. The exclusion criteria were participants who lived in a nursing home, were bed ridden, or who were admitted to the hospital. The sample size (N) was calculated by using the single proportion population formula:

where p = prevalence of malnutrition from a previous study, d = margin of error, and Z = statistic for a level of confidence, which equals 1.96 for a 95% CI. The sample size was calculated based on the prevalence of malnutrition found in a relevant previous study, 12.5%,20 with a precision of 0.05 and a confidence level of 95%. This study was approved by the Ethics Committee on Human Rights Related to Research Involving Human Subjects, Walailak University, Thailand (WUEC-20-112-01).
Data on Characteristics of the Elderly Participants
Demographic data were collected, including age, sex, marital status, religion, education, underlying disease, current working status, living alone status, history of hospital admission in the last year, history of falling in the last year, smoking, alcohol consumption and exercise. The validity of all questionnaires was evaluated by three experts in the field of internal medicine. The information was obtained through face-to-face interviews by community health volunteers at the patient’s home with COVID-19 precaution techniques, such as use of alcohol-based cleaners, hand washing and a simple face mask.21 All thirteen community health volunteers received a 1-hour orientation from the physician about the questionnaires before administering the survey. All demographic data were recorded by community health volunteers using a Google form.
The MNA-SF, full MNA, gait-speed test, handgrip strength and anthropometric measurements were obtained in the next step after completing demographic data. The researcher met with the participants for these assessments 1–2 weeks after recording demographic data. Figure 1 illustrates a summary of the step of study protocol. First, the demographic data in the Google form were rechecked by the physician in internal medicine before going to the next step. Second, systolic blood pressure and diastolic blood pressure were measured by an autonomic sphygmomanometer with an appropriate arm cuff at heart level after participants had been sitting quietly for 5–15 minutes by community health volunteers and using the standard method.22,23 Third, anthropometric measurements, such as body weight, height, BMI, waist circumference, hip circumference, waist-to-hip ratio, waist-to-height ratio, mid-upper arm circumference, calf circumferences and triceps skinfold thickness were evaluated by community health volunteers. All thirteen community health volunteers were trained by the physician in all anthropometric measurements, geriatric assessment and data collection. The anthropometric measurements were divided into three stations. The first station is body weight, height and BMI. The second station is waist circumference, hip circumference, waist-to-hip ratio and waist-to-height ratio. The third station is mid-upper arm circumference, calf circumferences and triceps skinfold thickness. Fourth, geriatric assessments were performed into two steps, such as assessing for slow gait by 15-foot walks and the strength of hand muscles by handgrip test. Each step in the third and the fourth process was run by two community health volunteers to avoid observer bias. The other three volunteers managed the data collection and arranged the participant’s approach to each station randomly. Finally, the MNA-SF and full MNA were administered by the physician in internal medicine. The MNA-SF consists of the same set of items as the first 6 items of the full MNA; when the physician had obtained responses for the first 6 items, the physician then continued and obtained the remaining items (7–18) of the full MNA.5,6,8,10 The malnutrition risk category of participants was classified after completing the MNA-SF and full MNA data records.
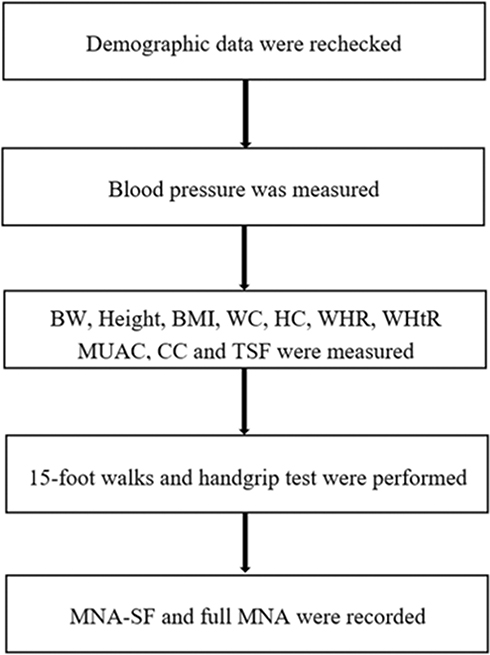 |
Figure 1 Step of study protocol. |
Anthropometric Measurements
Body weight and height were measured with the participants in a standing position and barefoot using an electronic digital scale and a stadiometer (NAGATA BW-2232MH, Taiwan), respectively. Body weight was obtained to the nearest 0.1 kg, and height was obtained to the nearest 0.1 cm. BMI was calculated as body weight (kg) divided by height squared (m2).24 The Regional Office for the Western Pacific (WPRO) definition classifies underweight as BMI <18.5 kg/m2, normal range as BMI 18.5–22.9 kg/m2, overweight as BMI 23–24.9 kg/m2, class I obesity as BMI 25.0–29.9 kg/m2 and class II obesity as BMI ≥30 kg/m2.25,26
Waist circumference (WC) was measured with inelastic tape at the midpoint between the lower rib cage and iliac crest in the horizontal plane around the body in the standing position with a relaxed abdomen and both arms resting at the sides. The WC was obtained to the nearest 0.1 cm at the end of a normal exhalation.27,28 Hip circumference (HC) was obtained at the widest point between the hips and buttocks. The WC and HC were obtained twice times and using the averaged value for the results. The waist-to-height ratio (WHtR) was calculated by dividing the WC by the height. The WHtR ≥ 0.5 was defined as increased risk of cardiovascular disease.29,30 The waist-to-hip circumference (WHR) was calculated by dividing the WC by the HC. An increased WC was defined as ≥ 90 cm in males and ≥ 80 cm in females. An increased WHR was defined as ≥ 0.9 in males and ≥ 0.85 in females.31
Mid-upper arm circumference measurement (MUAC) was measured in the left arm at the midpoint of the acromion process and olecranon process as the elbow flexed 90 degrees in the palm facing up position.32 Calf circumference (CC) was measured as the maximum horizontal distance around the left calf as the participants stood upright.33 MUAC and CC were measured with a measuring tape and recorded to the nearest 0.1 cm. The MUAC and CC were obtained twice times and using the averaged value for the results. MUAC and CC were interpreted by sex and age and into quantitative tertiles.32,33
Triceps skin fold (TSF) thickness was measured at the midpoint of the left arm (between the acromial process and the olecranon) with the arm freely stretched along the body. A fold of skin was then pinched with the fingers for 3–4 seconds, and a scientific caliper (Lange skin fold caliper, California) was applied.34 TSF thickness was measured with a measuring tape and recorded to the nearest 0.1 mm. The TSF was obtained twice times and using the averaged value for the results. TSF thickness was interpreted by sex- and age-specific normative reference standards.35
Gait Speed Test
The gait speed test is used to evaluate the slowness of elderly individuals. The participants walked on the floor from the starting point to the finishing point in a straight line, with a total distance from start to finish of 15 feet. The total time spent walking 15 feet was recorded to the nearest 0.1 minute by community health volunteers.36,37 The community health volunteers were trained by a physician before the test. The interpretation of slow gait depended on sex and height.38
Handgrip Strength
Handgrip strength is used to evaluate weakness in elderly individuals. The participants were tested in the sitting position with dominant hand by using a digital handgrip strength dynamometer (T.K.K. grip 5401, Japan). Handgrip strength was recorded 3 times to the nearest 0.1 kg by community health volunteers. The community health volunteers were trained by a physician before the test.39–41 The mean handgrip strength was calculated in the data analysis. The interpretation of handgrip strength depended on sex and BMI.38
Short MNA or MNA-SF
The short MNA or MNA-SF used the standard form from previous studies and the Thai version at www.mna-elderly.com. The MNA-SF is the common tool for screening of nutritional status in the elderly.10,42 The participants were classified in the normal nutritional status group if the MNA-SF total score was 12–14, at risk of malnutrition group if the MNA-SF total score was 8–11 and group if the malnourished group the MNA-SF total score was 0–7.5,6,8,10 The reliability of the questionnaire was pretested with thirty individuals in a nonstudy sample of elderly people who lived in a rural area outside the study area, and Cronbach’s alpha coefficient for the questionnaire was calculated to be 0.714.
Full MNA
The full MNA also used the standard form from previous studies and the Thai version at www.mna-elderly.com. The participants were classified in the normal nutritional status group if the full MNA total score was 24–30, at risk of malnutrition group if the full MNA total score was 17–23.5 and the malnourished group if the full MNA total score was <17.5,6,8,10 The reliability of the questionnaire was pretested with thirty individuals in a nonstudy sample of elderly people who lived in a rural area outside the study area, and Cronbach’s alpha coefficient for the questionnaire was calculated to be 0.721.
Data Analysis
Data were rechecked and cleaned before analysis. Statistical analysis was performed using the R environment version 4.0.5 for statistical computing. Quantitative variables are described as the mean ± standard deviation. Categorical variables are expressed as percentages and frequencies. Data were classified before data analysis into two groups: participants who had an abnormal nutritional status (those who had at risk of malnutrition or malnourished status by using full MNA) and participants who had a normal nutritional in Tables 1 and 2. The sensitivity, specificity, positive predictive value (PPV), negative predictive value (NPV), positive likelihood ratio (LR+), negative likelihood ratio (LR-), and accuracy of the MNA-SF compared with the full MNA as a reference standard were analyzed as a percentage with 95% CI. The correlations between anthropometric variables, 15-foot walk, handgrip strength and MNA total score were analyzed by score using the partial correlation coefficient after controlling for age and sex. The area under the curve (AUC), cut-off, sensitivity and specificity of functional assessments, anthropometric measurements and MNA-SF score to predict abnormal nutritional status were analyzed and created graphs of the ROC curve by using MedCalc version 20. Classification of AUC: acceptable 0.7–0.8, excellent 0.8–0.9 and outstanding > 0.9.43 The results were considered significant when the P value was <0.05.
 |
Table 1 The AUC, Cut-off, Sensitivity and Specificity of Functional Assessments, Anthropometric Measurements and MNA-SF Score to Predict Abnormal Nutritional Status (n=176) |
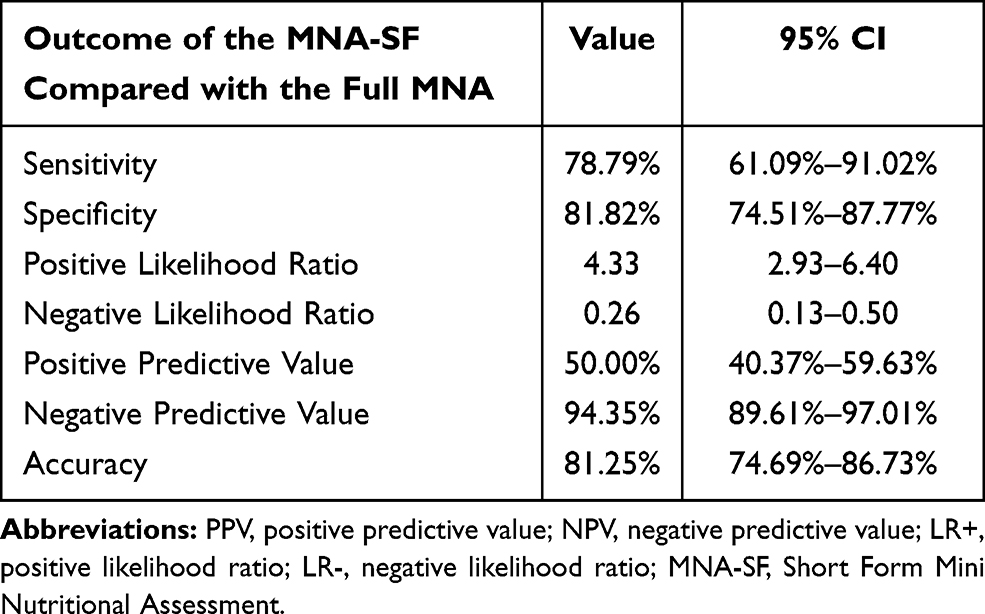 |
Table 2 The Sensitivity, Specificity, PPV, NPV, LR+, LR- and Accuracy of the MNA-SF Compared with the Full MNA (n=176) |
Results
Characteristics of the Elderly Participants
A total of 176 participants, 75 men and 101 women, between 60 and 87 years of age were included in this study. The mean age of the participants was 70.18 (standard deviation 6.72) years. Characteristics of elderly participants are presented in Table 3. Most participants were between the ages of 60 and 69 years (53.41%). Most participants were married (72.16%). Buddhism (96.60%) was the most common religion. Most participants’ educational attainment was primary school (44.89%). The most common underlying diseases in this study were hypertension (47.16%), hyperlipidemia (31.25%), diabetes mellitus (20.45%), osteoarthritis of the knee (17.61%), dyspepsia or GERD (7.39%), heart disease (7.39%), renal disease (5.68%), gout (2.84%), COPD or asthma (2.27%) and allergic rhinitis (2.27%). Most community-dwelling elderly individuals were classified as having a normal nutritional status, ie, very little risk of malnutrition. The prevalence of a malnourished group was 2.84% when using the MNA-SF and 2.27% when using the full MNA. The prevalence of at risk of malnutrition was 26.70% when using the MNA-SF and 16.48% when using the full MNA.
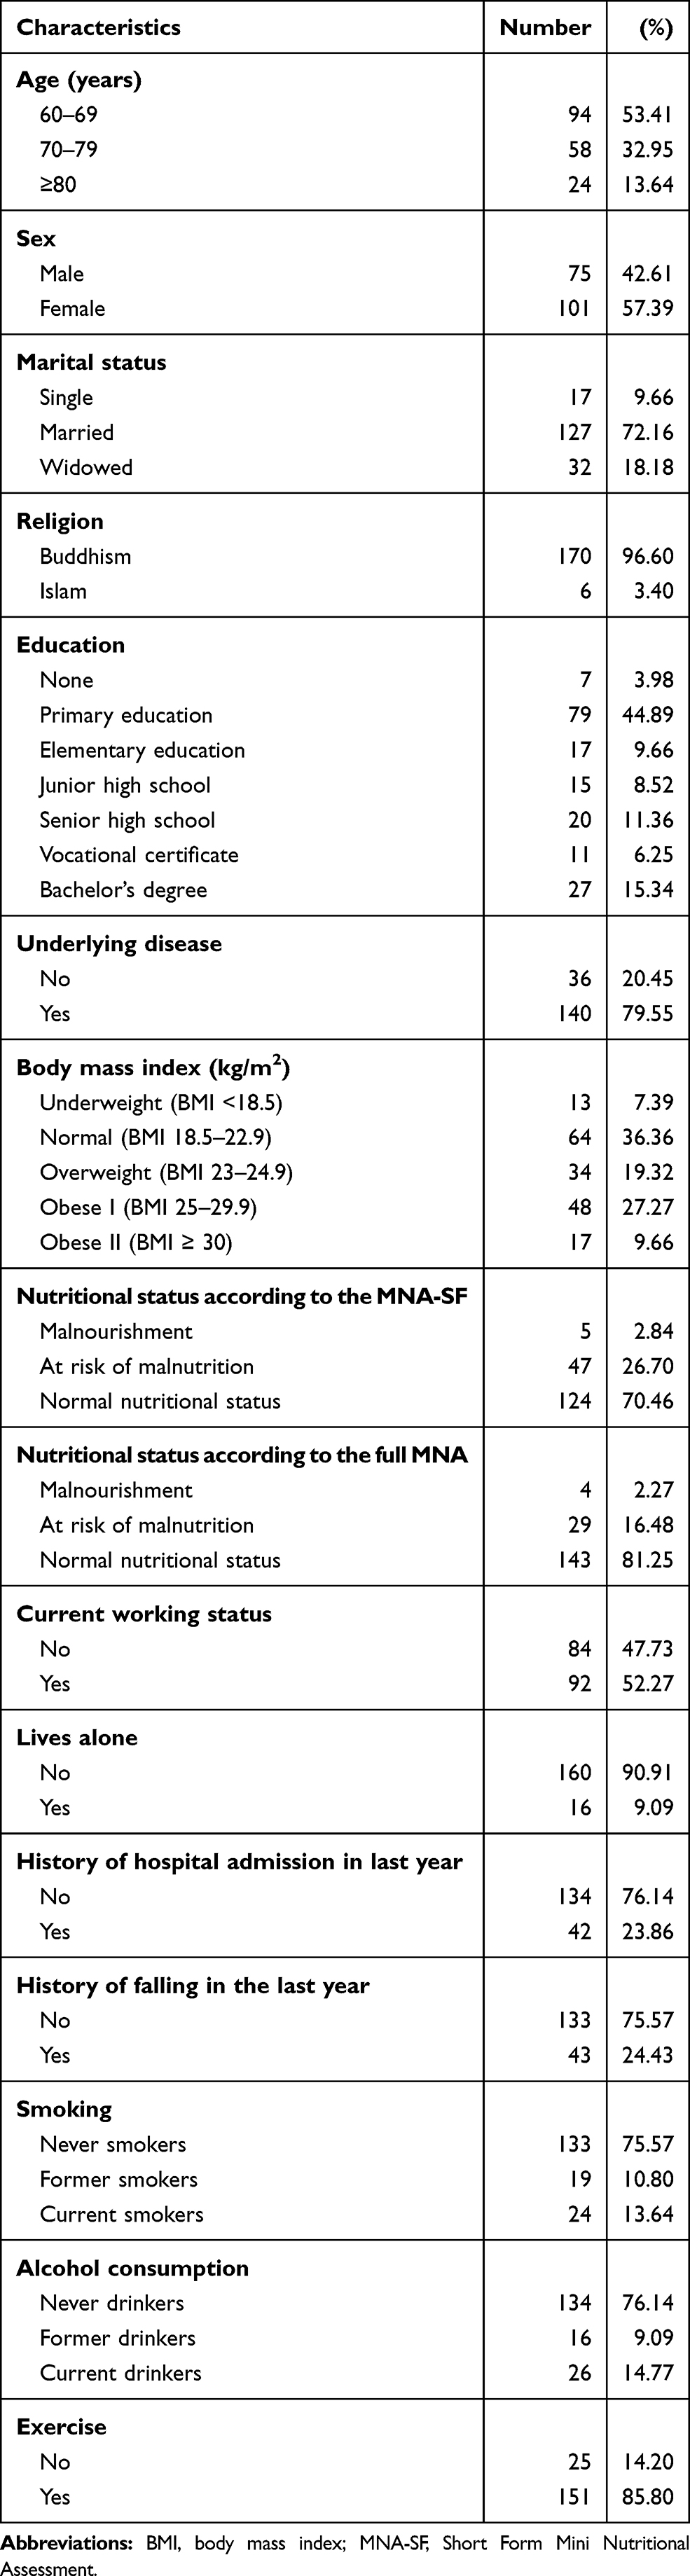 |
Table 3 Characteristics of the Elderly Participants (n=176) |
Outcome of the Full Mini Nutritional Assessment (18 Items)
The outcomes of the full MNA administered to elderly individuals are presented in Table 4. The percentage of severe decrease in food intake was 2.84%. The percentage of weight loss greater than 3 kg was 3.98%. All participants (100%) lived independently and self-fed without any problems. Only 1.14% perceived themselves to be malnourished. A majority of participants perceived their nutritional status to be as good as (51.14%) or better than others (34.66%).
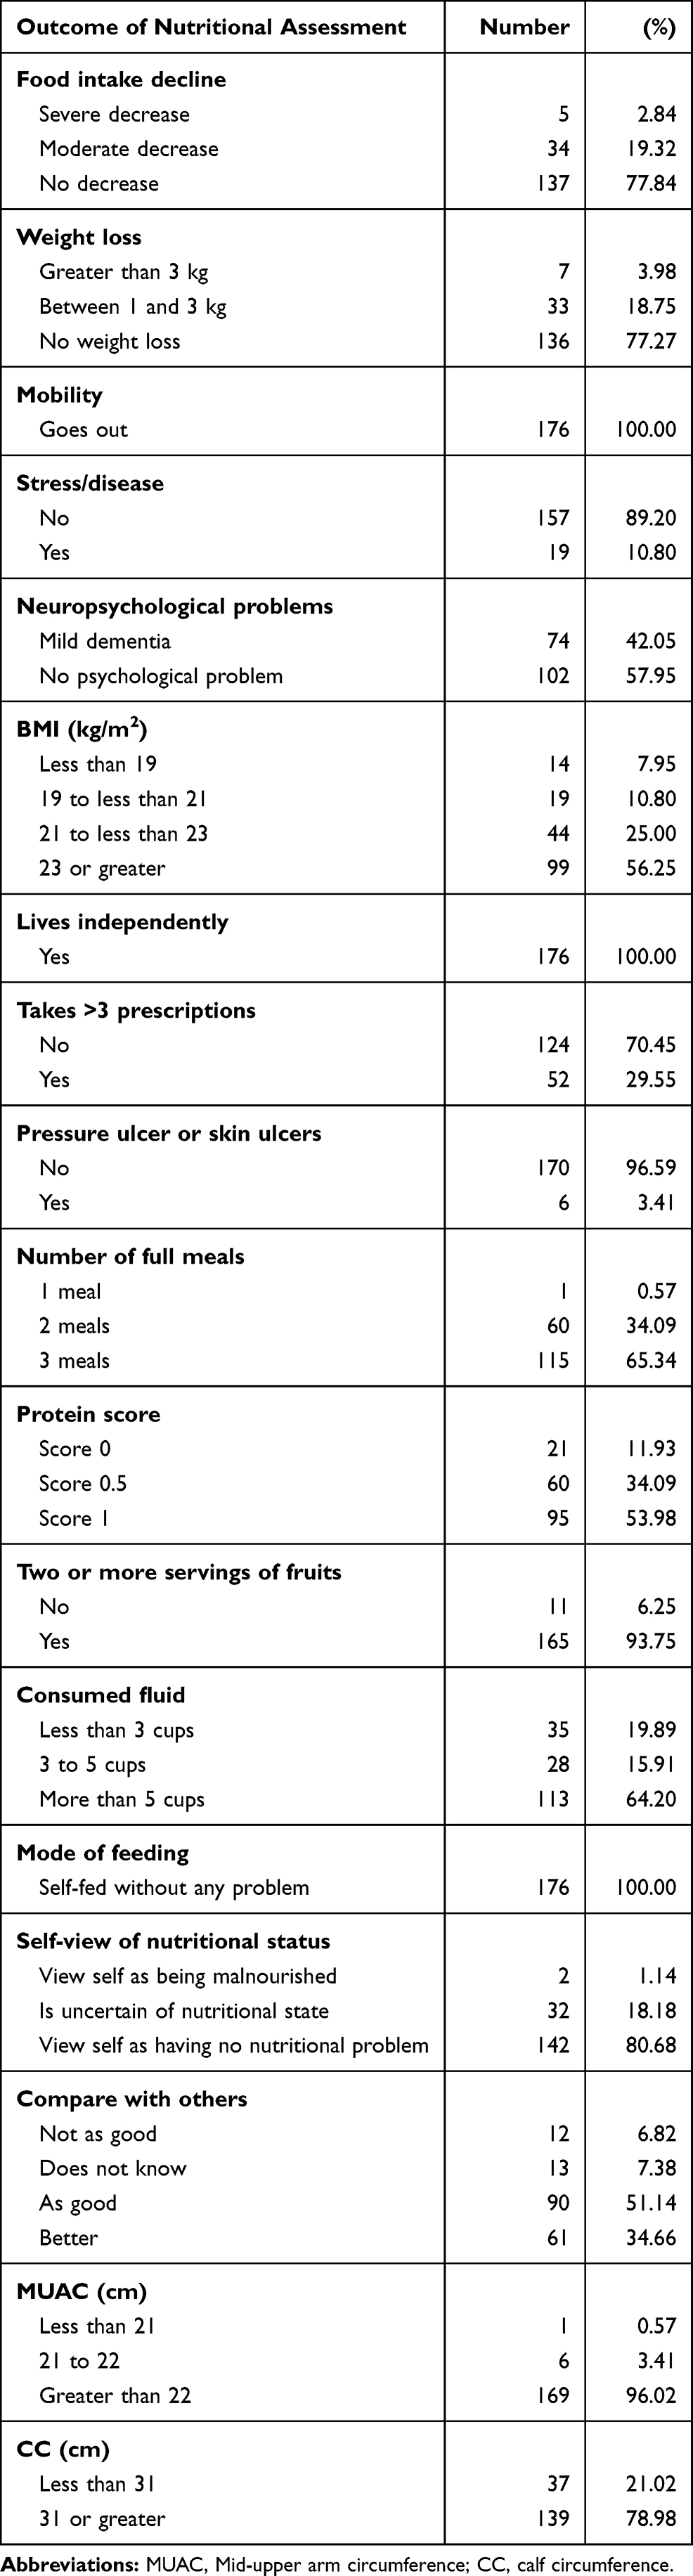 |
Table 4 Outcome of MNA Nutritional Assessment 18 Items (n=176) |
The AUC, Cut-off, Sensitivity and Specificity of Functional Assessments, Anthropometric Measurements and MNA-SF Score to Predict Abnormal Nutritional Status
Table 1 shows the AUC of calf circumference is 0.703 and has a sensitivity of 54.6% and specificity of 86.7% when using cut-off ≤ 30.50 cm. The outcome of the AUC and ROC curve in Figure 2 demonstrates that the calf circumference has acceptable accuracy in classifying abnormal nutritional status. The AUC of the MNA-SF score is 0.910, highest when compared with other tests and has a sensitivity of 66.7% and specificity of 95.1% when using cut-off ≤ 10. The outcome of the AUC and ROC curve in Figure 3 demonstrates that the MNA-SF total score has excellent accuracy in classifying abnormal nutritional status.
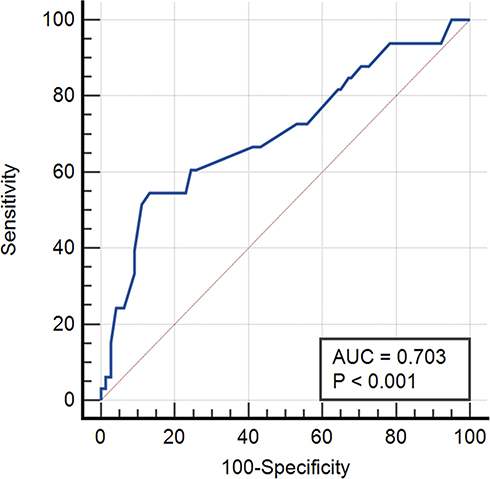 |
Figure 2 ROC curve of calf circumference. |
 |
Figure 3 ROC curve of MNA-SF. |
The Sensitivity, Specificity, PPV, NPV, LR+, LR- and Accuracy of the MNA-SF Compared with the Full MNA
The true positive rate was 26/176, the false positive rate was 26/176, the true negative rate was 117/176 and the false negative rate was 7/176. The sensitivity, specificity, LR+, LR-, PPV, NPV and accuracy are shown in Table 2.
Correlation Between Anthropometric Variables, 15-Foot Walk, Handgrip Strength and MNA Total Score
There was a significant positive correlation between body weight, BMI, waist circumference, hip circumference, waist-to-height ratio, waist-to-hip ratio, mid-upper arm circumference, calf circumference, triceps skinfold thickness and MNA-SF total score using the partial correlation coefficient after controlling for age and sex. There was no significant correlation between the handgrip test and MNA-SF total score using the partial correlation coefficient after controlling for age and sex, as shown in Table 5. There was a significant positive correlation between body weight, BMI, waist circumference, hip circumference, waist-to-height ratio, waist-to-hip ratio, mid-upper arm circumference, calf circumference, triceps skinfold thickness, handgrip strength and full MNA total score by partial correlation coefficient after controlling for age and sex. There was no significant correlation between the 15-foot walk and full MNA total score using the partial correlation coefficient after controlling for age and sex, as shown in Table 5.
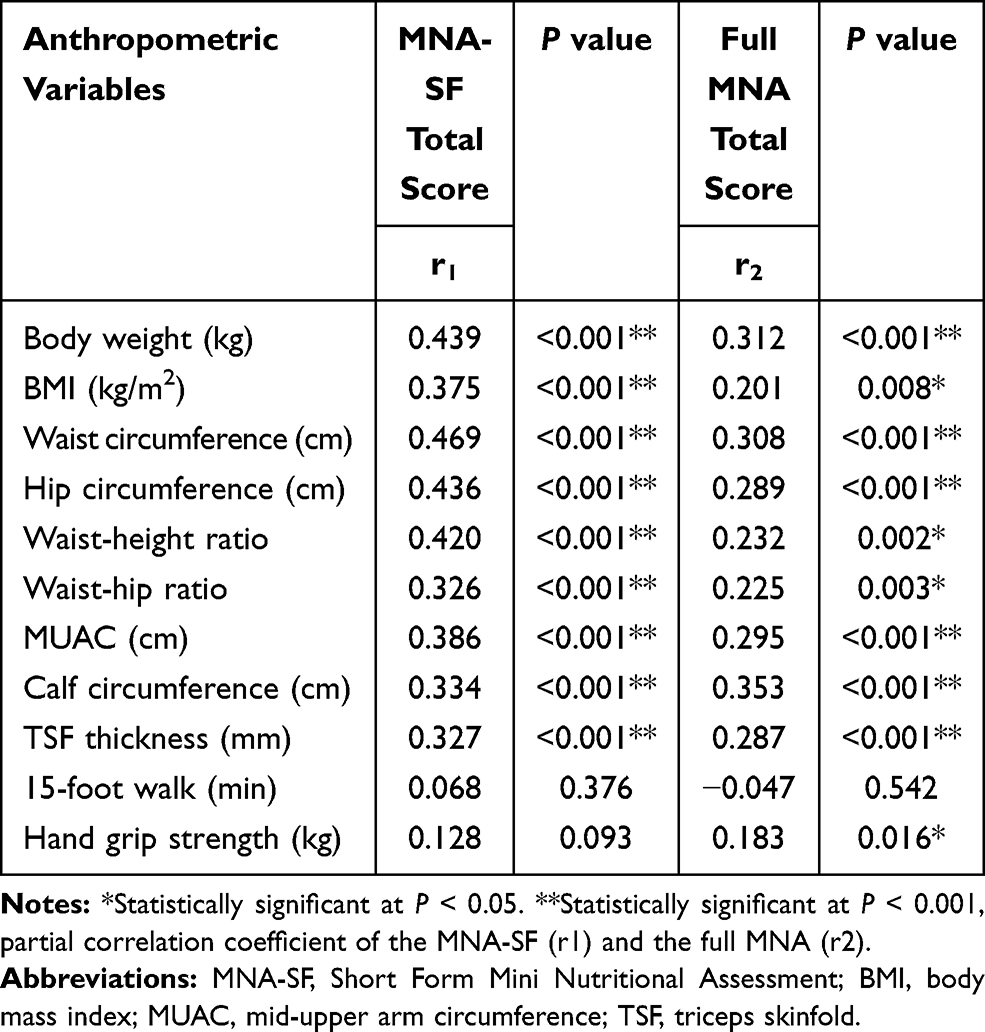 |
Table 5 Correlation Between Anthropometric Variables, 15-Foot Walk, Handgrip Strength and MNA Total Score (n=176) |
Discussion
This study demonstrated that there was a significant positive correlation between body weight, BMI, WC, HC, WHtR, WHR, MUAC, CC, TSF thickness and MNA-SF total score using the partial correlation coefficient after controlling for age and sex. There was no significant correlation between the gait speed test and handgrip test with MNA-SF total scores. The previous studies in Ethiopia showed the same outcome: body weight, BMI, MUAC and CC had a significant positive correlation with MNA-SF total score.44 This demonstrates the utility of the MNA-SF for evaluating nutritional status, as it is easy and available for use in OPD and community settings, and it correlates with many anthropometric measurements. However, the previous studies demonstrated that WC, HC, WHtR, WHR were common used in the screening risk of cardiovascular disease more than used for screen risk of malnutrition.45,46
This study demonstrated that there was a significant positive correlation between body weight, BMI, WC, HC, WHtR, WHR, MUAC, CC, TSF thickness, handgrip strength and full MNA total score using the partial correlation coefficient after controlling for age and sex. The AUC of calf circumference is 0.703 and has a sensitivity of 54.6% and specificity of 86.7% when using cut-off ≤ 30.50 cm. This study found that the gait speed test was not significantly correlated with the full MNA score. Previous studies in Ethiopia showed the same outcome: body weight, BMI, MUAC and CC had significant positive correlations with full MNA score.44,47 A correlation between MNA score and the handgrip test was only found for the full MNA. A previous study in Indonesia showed the same outcome: the handgrip test demonstrated a significant positive correlation between handgrip strength and nutritional status as determined by the full MNA.48 Aging affects muscle function and deceases muscle strength.48 Nutritional status can also affect muscle strength, and handgrip strength can thus be applied as a marker of nutritional status and predictor of disability.49
The prevalence of malnourished group was 2.27% when using the full MNA, which was a higher prevalence than that in a previous study in Taiwan (2% in total participants by using full MNA).50 The prevalence of at risk of malnutrition was 16.48% when using the full MNA, which was higher than that found in the same previous study in Taiwan (13.1% when using full MNA).50 The Taiwanese study had a similar setting among non-Caucasian elderly individuals. The prevalence of malnourished group was 2.27% when using the MNA-SF, and this finding was lower than the prevalence in Saudi Arabia 47.6% among hospitalized elderly individuals and Sri Lanka 12.5% among community-dwelling elderly.7,20 The prevalence of at risk of malnutrition was 26.70% when using the MNA-SF, which was lower than the prevalence among hospitalized elderly individuals in Saudi Arabia (29.03%) and Sri Lanka (52.4%).7,20 The previous study in Saudi Arabia had a different setting—in the hospital—and participants had existing diseases during admission. Disease can increase the risk of malnutrition, and the duration of admission can affect food intake; the present study was conducted in a community setting. Furthermore, though the study in Sri Lanka was in a community setting, the outcomes measured were different; the differing results might be due to cultural differences in food intake and population demographics. Despite these disparate results, we can apply the full MNA and the MNA-SF for use in community, primary care and hospital settings.
This study demonstrated that the MNA-SF had sensitivity of 78.79%, specificity of 81.82%, PPV of 50%, NPV of 94.35%, LR+ of 4.33, LR- of 0.26, accuracy of 81.25% and AUC 0.901 when using the full MNA as a reference standard. The MNA-SF has the highest specificity, NPV and accuracy; this test would be useful for diagnosis. The previous studies also demonstrate MNA-SF had good sensitivity, specificity and correlation with full MNA to detect community-dwelling older adults at risk of malnutrition.51,52 However, this test has an LR+ of 4.33, showing that this tool has a moderate effect on the outcome of nutrition status. This tool should be evaluated in combination with another tool, such as anthropometric measurements or serum albumin levels.53–55 A previous study in the Balçova district of the province of Izmir in Turkey showed that the correlation between the MNA-SF and full MNA was strong, significant and almost identical in the community and in nursing homes (r = 0.86–0.88; P <0.001); the study also demonstrated that the MNA-SF had similarly high sensitivity and selectivity in the community setting as the full MNA.52 A previous study in Ethiopia demonstrated that the MNA-SF had a sensitivity of 85.7% and specificity of 89% when using the Youden index as the best cutoff point to detect malnutrition.44 However, venipuncture for laboratory tests, such as serum albumin levels among elderly individuals in the community setting, is not always available, and pain can occur at the venipuncture site.56 Furthermore, the complications of venipuncture include bruising, cellulitis and hematoma at the venipuncture site.57 The MNA-SF has 6 items, and the full MNA has 18 items;6,8 the MNA-SF would be useful and available for screening nutritional status before laboratory examination. The MNA-SF and full MNA can be useful for screening risk of malnutrition when participants do not consent to venipuncture in the community setting, primary care or outpatient setting in the hospital to evaluate nutritional status among the elderly. However, the MNA-SF and full MNA cannot be used to replace laboratory results.
The full MNA collects more detailed data on food intake, protein intake, fluid intake and physical examination, such as MUAC and CC, than the MNA-SF. The full MNA is appropriate for the hospital setting when there is enough time to administer it, because it has many items. The MNA-SF is available and may be easier to use than the full MNA to assess nutritional status when time is limited, such as in community and primary care settings. Overall, both versions of the MNA can be used to assess nutritional status among the elderly population in community, primary care and hospital settings.
Study Limitation
The true height in the elderly is difficult to measure by standing position because their height has decreased in advanced age. Further study should be the focus on more outcomes in the larger population.
Conclusions
This study demonstrates that the MNA-SF and full MNA correlated with many anthropometric measurements. The MNA-SF has high specificity, NPV and accuracy of more than 80% when compared with the full MNA. The MNA-SF can be used to assess nutritional status among elderly individuals when there are time limitations. The MNA-SF and full MNA can be applied to assess nutritional status among elderly individuals in community, primary care and hospital settings.
Ethical Approval
The study was reviewed and approved by the Ethics Committee on Human Rights Related to Research Involving Human Subjects, Walailak University, prior to the recruitment of participants (WUEC-20-112-01).
Acknowledgments
The authors would like to acknowledge all volunteers in this research. The authors also thank the Thai Health Promotion Foundation and the Director of Walailak University Hospital for their support throughout the course of this study. Special thanks are also given to Pakpanang Municipality for assistance and Ms. Saymai Thongsuk, the head of public health volunteers, for coordination with the Pakpanang community.
Funding
This study was part of a project funded by Thai Health Promotion Foundation, grant number 62-00-1502. The APC was partially supported by Walailak University and Thai Health Promotion Foundation.
Disclosure
The authors reported no conflicts of interest for this work and declare no potential conflicts of interest with respect to the research, authorship, and/or publication of this article.
References
1. Amarya S, Singh K, Sabharwal M. Changes during aging and their association with malnutrition. J Clin Gerontol Geriatr. 2015;6(3):78–84. doi:10.1016/j.jcgg.2015.05.003
2. Hickson M. Malnutrition and ageing. Postgrad Med J. 2006;82(963):2–8. doi:10.1136/pgmj.2005.037564
3. Chumlea WC, Baumgartner RN, Garry PJ, Rhyne RL, Nicholson C, Wayne S. Fat distribution and blood lipids in a sample of healthy elderly people. Int J Obes Relat Metab Disord. 1992;16(2):125–133.
4. Evans C. Malnutrition in the elderly: a multifactorial failure to thrive. Perm J. 2005;9:38–41. doi:10.7812/TPP/05-056
5. Guigoz Y. The Mini Nutritional Assessment (MNA) review of the literature--what does it tell us? J Nutr Health Aging. 2006;10(6):
6. Kaiser MJ, Bauer JM, Ramsch C, et al. Validation of the Mini Nutritional Assessment short-form (MNA-SF): a practical tool for identification of nutritional status. J Nutr Health Aging. 2009;13(9):782–788. doi:10.1007/s12603-009-0214-7
7. Alzahrani SH, Alamri SH. Prevalence of malnutrition and associated factors among hospitalized elderly patients in King Abdulaziz University Hospital, Jeddah, Saudi Arabia. BMC Geriatr. 2017;17(1):136. doi:10.1186/s12877-017-0527-z
8. Vellas B, Villars H, Abellan G, et al. Overview of the MNA – its history and challenges. J Nutr Health Aging. 2005;10:
9. Guigoz Y, Lauque S, Vellas BJ. Identifying the elderly at risk for malnutrition. The mini nutritional assessment. Clin Geriatr Med. 2002;18(4):737–757. doi:10.1016/s0749-0690(02)00059-9
10. Rubenstein LZ, Harker JO, Salvà A, Guigoz Y, Vellas B. Screening for undernutrition in geriatric practice: developing the short-form mini-nutritional assessment (MNA-SF). J Gerontol a Biol Sci Med Sci. 2001;56(6):M366–M372. doi:10.1093/gerona/56.6.m366
11. Sieber C. Nutritional screening tools - how does the MNA® compare? Proceedings of the session held in Chicago May 2–3, 2006 (15 years of mini nutritional assessment). J Nutr Health Aging. 2006;10:
12. Leandro-Merhi VA, De Aquino JL. Anthropometric parameters of nutritional assessment as predictive factors of the Mini Nutritional Assessment (MNA) of hospitalized elderly patients. J Nutr Health Aging. 2011;15(3):181–186. doi:10.1007/s12603-010-0116-8
13. Inouye SK, Studenski S, Tinetti ME, Kuchel GA. Geriatric syndromes: clinical, research, and policy implications of a core geriatric concept. J Am Geriatr Soc. 2007;55(5):780–791. doi:10.1111/j.1532-5415.2007.01156.x
14. Cheung JTK, Yu R, Wu Z, Wong SYS, Woo J. Geriatric syndromes, multimorbidity, and disability overlap and increase healthcare use among older Chinese. BMC Geriatr. 2018;18(1):147. doi:10.1186/s12877-018-0840-1
15. Gavriilidou NN, Pihlsgård M, Elmståhl S. Anthropometric reference data for elderly Swedes and its disease-related pattern. Eur J Clin Nutr. 2015;69(9):1066–1075. doi:10.1038/ejcn.2015.73
16. Perissinotto E, Pisent C, Sergi G, Grigoletto F. Anthropometric measurements in the elderly: age and gender differences. Br J Nutr. 2002;87:177–186. doi:10.1079/BJN2001487
17. Closs VE, Ziegelmann PK, Flores JHF, Gomes I, Schwanke CHA. Anthropometric measures and frailty prediction in the elderly: an easy-to-use tool. Curr Gerontol Geriatr Res. 2017;2017:8703503. doi:10.1155/2017/8703503
18. Sánchez-García S, García-Peña C, Duque-López MX, Juárez-Cedillo T, Cortés-Núñez AR, Reyes-Beaman S. Anthropometric measures and nutritional status in a healthy elderly population. BMC Public Health. 2007;7(1):2. doi:10.1186/1471-2458-7-2
19. Churak P, Praditsorn P, Meenongwah J, Wimonpeerapattana W. Factors associated with nutritional status of elderly in Ubon Ratchathani, Thailand. Asia Pac J Sci Technol. 2019;24. doi:10.14456/apst.2019.5
20. Damayanthi HDWT, Moy FM, Abdullah KL, Dharmaratne SD. Prevalence of malnutrition and associated factors among community-dwelling older persons in Sri Lanka: a cross-sectional study. BMC Geriatr. 2018;18(1):199. doi:10.1186/s12877-018-0892-2
21. Ornell F, Moura HF, Scherer JN, Pechansky F, Kessler FHP, von Diemen L. The COVID-19 pandemic and its impact on substance use: implications for prevention and treatment. Psychiatry Res. 2020;289:113096. doi:10.1016/j.psychres.2020.113096
22. Muntner P, Shimbo D, Carey RM, et al. Measurement of blood pressure in humans: a scientific statement from the American Heart Association. Hypertension. 2019;73(5):e35–e66. doi:10.1161/HYP.0000000000000087
23. Ogedegbe G, Pickering T. Principles and techniques of blood pressure measurement. Cardiol Clin. 2010;28(4):571–586. doi:10.1016/j.ccl.2010.07.006
24. Misra A, Dhurandhar NV. Current formula for calculating body mass index is applicable to Asian populations. Nutr Diabetes. 2019;9(1):3. doi:10.1038/s41387-018-0070-9
25. Jitnarin N, Kosulwat V, Rojroongwasinkul N, Boonpraderm A, Haddock CK, Poston WS. Prevalence of overweight and obesity in Thai population: results of the National Thai Food Consumption Survey. Eat Weight Disord. 2011;16(4):e242–9. doi:10.1007/bf03327467
26. Subhaluksuksakorn P, Sinjariyanon W, Pimsaran R. Gender difference in underweight, overweight and obesity among first-year students of Suranaree University of Technology in 2015. J Med Assoc Thai. 2016;99(Suppl 7):S24–S29.
27. Bosy-Westphal A, Booke CA, Blöcker T, et al. Measurement site for waist circumference affects its accuracy as an index of visceral and abdominal subcutaneous fat in a Caucasian population. J Nutr. 2010;140(5):954–961. doi:10.3945/jn.109.118737
28. Ma W-Y, Yang C-Y, Shih S-R, et al. Measurement of waist circumference: midabdominal or iliac crest? Diabetes Care. 2013;36(6):
29. Rezende AC, Souza LG, Jardim TV, et al. Is waist-to-height ratio the best predictive indicator of hypertension incidence? A cohort study. BMC Public Health. 2018;18(1):281. doi:10.1186/s12889-018-5177-3
30. Ashwell M, Gunn P, Gibson S. Waist-to-height ratio is a better screening tool than waist circumference and BMI for adult cardiometabolic risk factors: systematic review and meta-analysis. Obes Rev. 2012;13(3):275–286. doi:10.1111/j.1467-789X.2011.00952.x
31. Jaeschke L, Steinbrecher A, Pischon T, Vinciguerra M. Measurement of waist and hip circumference with a body surface scanner: feasibility, validity, reliability, and correlations with markers of the metabolic syndrome. PLoS One. 2015;10(3):e0119430. doi:10.1371/journal.pone.0119430
32. Das A, Saimala G, Reddy N, et al. Mid-upper arm circumference as a substitute of the body mass index for assessment of nutritional status among adult and adolescent females: learning from an impoverished Indian state. Public Health. 2020;179:68–75. doi:10.1016/j.puhe.2019.09.010
33. Weng C-H, Tien C-P, Li C-I, et al. Mid-upper arm circumference, calf circumference and mortality in Chinese long-term care facility residents: a prospective cohort study. BMJ Open. 2018;8(5):e020485. doi:10.1136/bmjopen-2017-020485
34. Zuchinali P, Souza GC, Alves FD, et al. Triceps skinfold as a prognostic predictor in outpatient heart failure. Arq Bras Cardiol. 2013;101(5):434–441. doi:10.5935/abc.20130185
35. Ramírez-Vélez R, López-Cifuentes MF, Correa-Bautista JE, et al. Triceps and subscapular skinfold thickness percentiles and cut-offs for overweight and obesity in a population-based sample of schoolchildren and adolescents in Bogota, Colombia. Nutrients. 2016;8(10):595. doi:10.3390/nu8100595
36. Chen X, Mao G, Leng SX. Frailty syndrome: an overview. Clin Interv Aging. 2014;9:433–441. doi:10.2147/cia.S45300
37. Ferre X, Villalba-Mora E, Caballero-Mora M-A, et al. Gait speed measurement for elderly patients with risk of frailty. Mob Inf Syst. 2017;2017:1310345. doi:10.1155/2017/1310345
38. Xue Q-L. The frailty syndrome: definition and natural history. Clin Geriatr Med. 2011;27(1):1–15. doi:10.1016/j.cger.2010.08.009
39. Massy-Westropp NM, Gill TK, Taylor AW, Bohannon RW, Hill CL. Hand grip strength: age and gender stratified normative data in a population-based study. BMC Res Notes. 2011;4(1):127. doi:10.1186/1756-0500-4-127
40. Roberts HC, Denison HJ, Martin HJ, et al. A review of the measurement of grip strength in clinical and epidemiological studies: towards a standardised approach. Age Ageing. 2011;40(4):423–429. doi:10.1093/ageing/afr051
41. Vermeulen J, Neyens JC, Spreeuwenberg MD, van Rossum E, Hewson DJ, de Witte LP. Measuring grip strength in older adults: comparing the grip-ball with the Jamar dynamometer. J Geriatr Phys Ther. 2015;38(3):148–153. doi:10.1519/jpt.0000000000000034
42. Mini Nutritional Assessment. Nestlé Nutrition Institute; 2009. Available from: https://www.mna-elderly.com/forms/mini/mna_mini_english.pdf.
43. Mandrekar JN. Receiver operating characteristic curve in diagnostic test assessment. J Thorac Oncol. 2010;5(9):1315–1316. doi:10.1097/JTO.0b013e3181ec173d
44. Woldekidan MA, Haile D, Shikur B, Gebreyesus S. Validity of mini nutritional assessment tool among an elderly population in Yeka sub-city, Addis Ababa, Ethiopia. South Afr J Clin Nutr. 2020;1–7. doi:10.1080/16070658.2020.1741903
45. Alshamiri MQ, Mohd A, Habbab F, et al. Waist-to-Height Ratio (WHtR) in predicting coronary artery disease compared to body mass index and waist circumference in a single center from Saudi Arabia. Cardiol Res Pract. 2020;2020:4250793. doi:10.1155/2020/4250793
46. Bener A, Yousafzai MT, Darwish S, Al-Hamaq AOAA, Nasralla EA, Abdul-Ghani M. Obesity index that better predict metabolic syndrome: body mass index, waist circumference, waist hip ratio, or waist height ratio. J Obes. 2013;2013:269038. doi:10.1155/2013/269038
47. Hailemariam H, Singh P, Fekadu T. Evaluation of mini nutrition assessment (MNA) tool among community dwelling elderly in urban community of Hawassa city, Southern Ethiopia. BMC Nutr. 2016;2(1):11. doi:10.1186/s40795-016-0050-1
48. Akbar F, Setiati S. Correlation between hand grip strength and nutritional status in elderly patients. J Phys Conf Ser. 2018;1073:042032. doi:10.1088/1742-6596/1073/4/042032
49. Norman K, Stobäus N, Gonzalez MC, Schulzke JD, Pirlich M. Hand grip strength: outcome predictor and marker of nutritional status. Clin Nutr. 2011;30(2):135–142. doi:10.1016/j.clnu.2010.09.010
50. Tsai AC, Ho CS, Chang MC. Assessing the prevalence of malnutrition with the Mini Nutritional Assessment (MNA) in a nationally representative sample of elderly Taiwanese. J Nutr Health Aging. 2008;12(4):239–243. doi:10.1007/BF02982628
51. Isautier JMJ, Bosnić M, Yeung SSY, et al. Validity of nutritional screening tools for community-dwelling older adults: a systematic review and meta-analysis. J Am Med Dir Assoc. 2019;20(10):
52. Simsek H, Sahin S, Ucku R, et al. The diagnostic accuracy of the revised mini nutritional assessment short form for older people living in the community and in nursing homes. J Nutr Health Aging. 2014;18(8):725–729. doi:10.1007/s12603-014-0460-1
53. Keller U. Nutritional laboratory markers in malnutrition. J Clin Med. 2019;8(6):775. doi:10.3390/jcm8060775
54. Bhattacharya A, Pal B, Mukherjee S, Roy SK. Assessment of nutritional status using anthropometric variables by multivariate analysis. BMC Public Health. 2019;19(1):1045. doi:10.1186/s12889-019-7372-2
55. Sedighi I. Interpretation of diagnostic tests: likelihood ratio vs. predictive value. Iran J Pediatr. 2013;23(6):717.
56. Klosinski DD. Collecting specimens from the elderly patient. Lab Med. 1997;28(8):518–522. doi:10.1093/labmed/28.8.518
57. Galena HJ. Complications occurring from diagnostic venipuncture. J Fam Pract. 1992;34(5):582–584.
 © 2021 The Author(s). This work is published and licensed by Dove Medical Press Limited. The
full terms of this license are available at https://www.dovepress.com/terms
and incorporate the Creative Commons Attribution
- Non Commercial (unported, 3.0) License.
By accessing the work you hereby accept the Terms. Non-commercial uses of the work are permitted
without any further permission from Dove Medical Press Limited, provided the work is properly
attributed. For permission for commercial use of this work, please see paragraphs 4.2 and 5 of our Terms.
© 2021 The Author(s). This work is published and licensed by Dove Medical Press Limited. The
full terms of this license are available at https://www.dovepress.com/terms
and incorporate the Creative Commons Attribution
- Non Commercial (unported, 3.0) License.
By accessing the work you hereby accept the Terms. Non-commercial uses of the work are permitted
without any further permission from Dove Medical Press Limited, provided the work is properly
attributed. For permission for commercial use of this work, please see paragraphs 4.2 and 5 of our Terms.