Back to Journals » International Journal of General Medicine » Volume 18
Correlation Between Macular Microstructural Changes with Disease Staging and Visual Acuity in Diabetic Retinopathy
Authors Zhang W ![]() , Zhang F, Yang Y, Cao J, Zhu Z
, Zhang F, Yang Y, Cao J, Zhu Z
Received 11 January 2025
Accepted for publication 24 April 2025
Published 20 May 2025 Volume 2025:18 Pages 2619—2628
DOI https://doi.org/10.2147/IJGM.S516938
Checked for plagiarism Yes
Review by Single anonymous peer review
Peer reviewer comments 2
Editor who approved publication: Dr Vinay Kumar
Wenhua Zhang, Feng Zhang, Yezhen Yang, Jiamin Cao, Ziyi Zhu
Department of Ophthalmology, The Third Xiangya Hospital, Central South University, Changsha, Hunan, 410013, People’s Republic of China
Correspondence: Ziyi Zhu, Department of Ophthalmology, The Third Xiangya Hospital, Central South University, Changsha, Hunan, 410013, People’s Republic of China, Email [email protected]
Purpose: To investigate the changes in macular microvascular structure at different stages of diabetic retinopathy (DR) and the correlation between macular ischemia and visual acuity.
Patients and Methods: A prospective cross-sectional study was conducted. A total of 173 patients with DR were enrolled and divided into three groups according to DR stage. The control group consisted of 29 gender and age matched healthy individuals. Macular perfusion indexes were measured by optical coherence tomography angiography (OCTA) and compared.
Results: The p-values of central foveal thickness (CFT), focal avascular zone (FAZ) area, and vessel density were less than 0.05 in DR patients and healthy individuals. As the severity of DR increased, there was a corresponding decline in visual acuity, the logMAR best corrected visual acuity (BCVA) was 0.40± 0.30 in mild-moderate NPDR, then worsened to 0.48 ± 0.30 (p=0.059) in severe NPDR and further to 0.60 ± 0.34 (p=0.043) in PDR. Superficial capillary plexus (SCP) vessel density correlated negatively with logMAR BCVA (p< 0.001, R=− 0.267), whereas the severity of DR correlated positively with logMAR BCVA (p< 0.001, R=0.199). And increased DR stage was associated with significant reductions in foveal density at 300 μm (FD-300 μm; p=0.004) and deep capillary plexus (DCP) vessel density (p=0.009).
Conclusion: Macular perfusion status decreases as DR progresses. Early changes of macular microvascular structure in different capillary plexus may indicate progression of DR severity and affect visual acuity.
Keywords: diabetic retinopathy, macular perfusion status, visual acuity, OCT angiography
Introduction
Diabetic retinopathy (DR), the leading cause of acquired visual loss in the working age population in developed countries, can be classified as non-proliferative (NPDR) and proliferative (PDR) diabetic retinopathy.1 More than 103.12 million people worldwide were affected by DR in 2020, and the numbers are projected to increase to 160.50 million by 2045.2
Retinal ischemia is an early indicator of more severe DR, with changes in macular perfusion status being an important predictor of progression from NPDR to PDR. Greater progression of DR has been associated with greater severity of macular perfusion status in patients.3,4
Diabetic microangiopathy can lead to retinal ischemia and elevated retinal microvascular permeability, resulting in fluorescein leakage.5 This leakage can cover retinal capillaries, making it difficult to accurately evaluate retinal perfusion status.5 Optical coherence tomography angiography (OCTA) has been shown effective in monitoring disease progression and response to treatment.6,7 OCTA is a noninvasive, repeatable, and easily performed method of evaluation, as well as being subtler than fundus fluorescein angiography (FFA) in displaying macular microstructural capillaries.8–11 The present study therefore used OCTA to quantify macular microstructural changes.
To date, quantitative metrics evaluating macular perfusion status in diabetic individuals have lacked consensus and a normative database. The ability of macular microstructural changes to predict DR progression and visual acuity has therefore remained undetermined. The present study therefore investigated macular perfusion status at different stages of DR and the correlation between macular ischemia and visual acuity.
Materials and Methods
This prospective cross-sectional study enrolled patients who presented at our institution with a loss of vision called by diabetes between September 2018 and December 2023, as well as gender- and age-matched healthy individuals. The inclusion criteria of DR patients: 1) aged >18 years, had type 1 or type 2 diabetes; 2) and had definite retinal thickening due to DR as the main cause of visual loss. The exclusion criteria: any of the following, 1) patients were excluded if they had visual loss caused by any other retinal disease; 2) refractive error (myopia > 6D or hyperopia > 3D); 3) severe ocular media opacity; 4) other systemic diseases that required hospitalization.12 The study followed the tenets of the Declaration of Helsinki; all DR patients and control subjects provided written informed consent before participation; and all procedures were performed in accordance with the ethical standards of the Third Xiangya Hospital of Central South University committee (ID: kuai 23693).
All patients underwent fluorescein angiography (FA) and OCTA. All healthy controls only underwent OCTA. Poor quality OCTA images were excluded before grouping, as were images with Q-scores <7, opacity of refractive media, and images showing the presence of significant residual motion artifacts. Patients were also excluded if images showed that the anatomical features of the macular area were severely disrupted (eg, severe cystoid macular edema), leading to segmentation errors. The included patients were divided into three groups according to disease stage: those with mild-moderate NPDR, severe NPDR and PDR. And the stage of DR was determined based on the International Clinical Diabetic Retinopathy Severity scale.13
The classification is as follows: mild NPDR: microaneurysms only; moderate NPDR: more than mild NPDR but less than severe NPDR; severe NPDR: more than 20 intraretinal hemorrhages in each of 4 quadrants; and/or venous beading more than 2 quadrants; and/or IRMA more than 1 quadrantand; PDR: neovascularization and/or vitreous/preretinal hemorrhage.
Data Measurements
Best corrected visual acuity (BCVA) was assessed using a tumbling E chart at an initial testing distance of 5 m, with the results reported as logMAR units.14 FA images (55°) were obtained using Spectralis HRA + OCT (Heidelberg Engineering, Germany). OCT and OCTA images (6*6mm) were obtained using AngioVue OCT system version 2018.0.0.14 (RTVue XR Avanti, Optovue Inc., Fremont, CA, USA), with a split-spectrum amplitude decorrelation angiography (SSADA) algorithm used to detect blood flow and provide rapid imaging of detailed microvasculature at distinct depths.15 The AngioVue system provided an automated software algorithm to generate the boundaries of the superficial capillary plexus (SCP) (from the inner limiting membrane [ILM] to 10 μm above the inner plexiform layer [IPL]) and deep capillary plexus (DCP) (from 10 μm above the IPL to 10 μm below the outer plexiform layer [OPL]). The boundaries of the foveal avascular zone (FAZ) area were from the ILM to 10 μm below the OPL. When necessary, segmentation boundaries could be adjusted and corrected manually.16 Following correction of the segmentation boundaries, the parameters of macular perfusion status, derived from a 6×6 mm macular scan grid, were automatically calculated by OCTA software. The central foveal thickness (CFT), defined as the average value within a circle 1 mm in diameter centered in the fovea, was also measured automatically.
Statistical Analysis
The main measurements were tested by the Kolmogorov–Smirnov test, with p<0.05 defined as statistically significant. Parameters in the control group and the three DR subgroups were generally compared using t-tests. The relationships between BCVA and macular perfusion indexes were evaluated by Pearson correlation analysis, factors influencing DR stage were determined using multi-class logistic regression analyses. All statistical analyses were performed using SPSS 25.0 software (SPSS Inc., Chicago, III, USA), with p<0.05 indicating statistical significance.
Results
This study enrolled 29 healthy people and 173 patients with DR, including 40 patients with mild-moderate NPDR, 99 with severe NPDR group, and 34 with PDR. A comparison of each of these three DR subgroups with the control group showed no significant differences in gender distribution, age and eye (Table 1). Conversely, CFT, FAZ area, and vessel density differed significantly in DR patients and healthy controls, with DR patients showing evidence of diabetic edema and ischemic changes, such as FAZ expansion and irregularities (area and perimeter), macular nonperfusion (MNP), macular perfusion index (FD-300 μm, vessel densities of the SCP and DCP), and reduced macular area. Figure 1 shows typical OCTA appearances of the macula in patients with mild-moderate NPDR, severe NPDR, and PDR and in healthy controls.
 |
Table 1 Demographic and Clinical Characteristics of Patients with Mild-Moderate NPDR, Severe NPDR, and PDR, and Health Controls |
 |
Figure 1 OCTA images in healthy controls and in patients with mild-moderate NPDR, severe NPDR, and PDR. (6*6mm). The red areas indicate the locations of FAZ area measurements. |
Increases in the severity of DR were associated with increases in logMAR BCVA, from 0.40±0.30 in patients with mild-moderate NPDR to 0.48±0.30 in patients with severe NPDR (p=0.059) and to 0.60±0.34 in patients with PDR (p=0.043), with the latter being significantly different. Increases in DR severity were associated with reductions in CFT, and the FAZ area, perimeter increased significantly, and parameters of vessel density, such as FD-300 μm and SCP-vessel density decreased significantly by stage of DR. Although DCP-vessel density was also significantly lower in patients with severe than mild-moderate NPDR, DCP-vessel density did not differ significantly in patients with PDR and severe NPDR (p=0.155) (Figure 2).
 |
Figure 2 BCVA, CFT and macular perfusion indexes in healthy controls and in patients with mild-moderate NPDR, severe NPDR, and PDR. *p < 0.05, **p < 0.001 compared with the control group. |
The correlations of DR stage and BCVA with macular perfusion indexes in all patients (Table 2). LogMAR BCVA (p=0.005) was positively correlated with the severity of the DR, whereas CFT (p=0.023), FD-300 μm (p<0.001), SCP (p<0.001) and DCP vessel density (p<0.001) were negatively correlated with the severity of DR. Patients with PDR showed lower CFT and more severe macular ischemic changes, such as FAZ area expansion, MNP appearance, and blood flow density decrement, than patients with NPDR. Figure 3 shows the changes of macular perfusion status at different plexuses during different stages of DR. Figure 4 shows Pearson correlation analysis of BCVA and macular perfusion indexes in all DR patients. SCP vessel density showed a significant negative correlation with logMAR BCVA (p<0.001, R=−0.267), whereas the course of DR was significantly positively correlated with logMAR BCVA (p<0.001, R=0.199). Additionally, BCVA was significantly worse in patients who had DR for >10 years than for <10 years (p=0.005).
 |
Table 2 Pearson Correlation Analysis of DR Staging and BCVA with Macular Perfusion Indexes |
 |
Figure 3 Typical changes of macular perfusion status at different plexus in eyes with mild-moderate NPDR, severe NPDR, and PDR. |
 |
Figure 4 Correlation of BCVA and macular perfusion indices. |
Multiple logistic regression analysis of the effect of macular perfusion indexes on DR staging showed that the FD-300 μm (p=0.004) and DCP vessel density (p=0.009) were significant factors affecting DR staging (Table 3). Both of these parameters, reflecting early changes in macular perfusion, may therefore be markers of progression of DR severity.
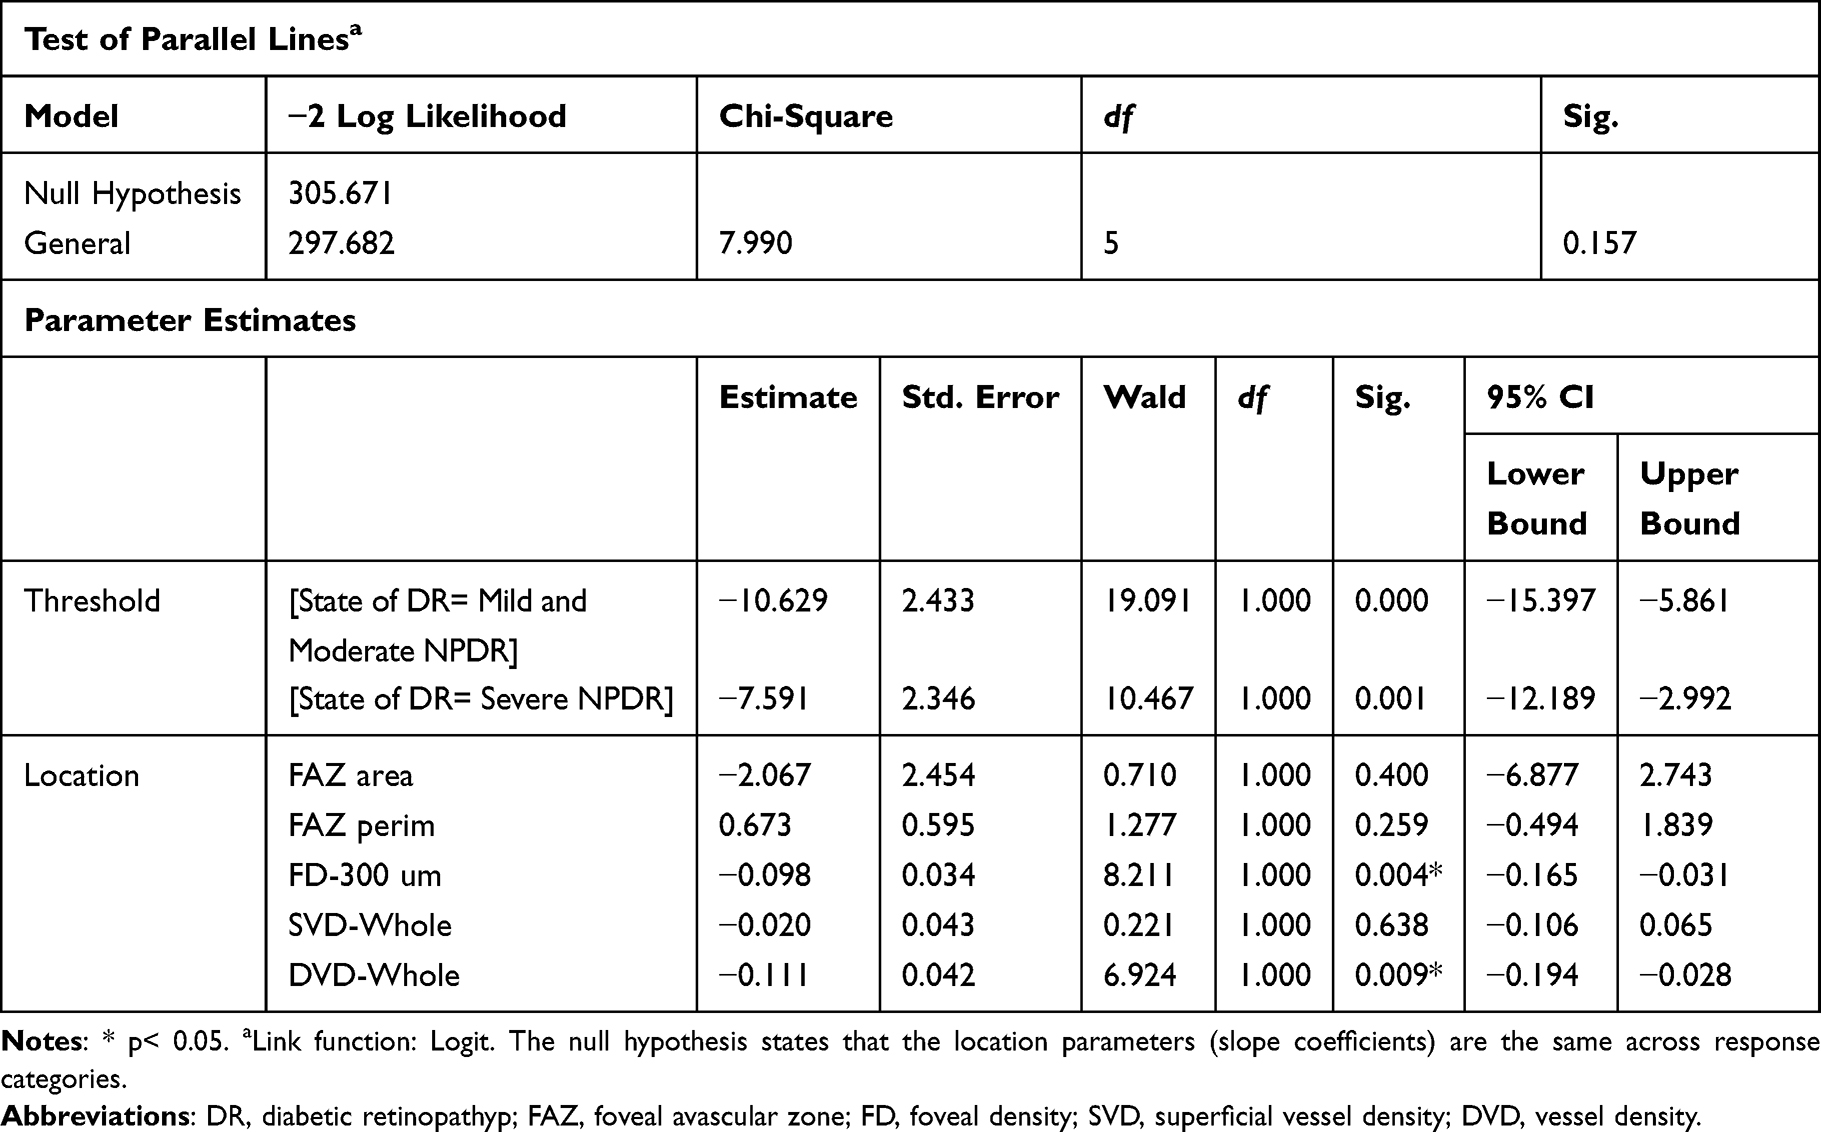 |
Table 3 Multiclass Logistic Regression Model of the Effect of Macular Perfusion Indexes on Stage of DR |
In summary, these findings showed that macular perfusion status was significantly poorer in DR patients than in healthy controls and that macular ischemia was significantly worse in patients with PDR than NPDR. Visual acuity and DR staging were closely related to vessel density in macular region. Worse SCP vessel density and longer course might indicate poorer vision acuity in DR patients. Figure 5 shows typical differences in retinal perfusion status and macular ischemia in NPDR and PDR patients, with OCTA being more sensitive and consistent than FA. PDR usually presented with more severe damage to retinal perfusion status, especially in the structure of the foveal capillary network. This damage frequently included enlargement and irregularities of the FAZ and the appearance of macular nonperfusion, leading to disturbances in macular function. Different levels of macular perfusion status may therefore represent DR severity and progression, with a greater degree of deterioration in FD-300 μm and DCP vessel density being significantly associated with the increase of severity.
 |
Figure 5 FA and OCTA determinations of retinal perfusion status and macular ischemia in patients with NPDR and PDR. Red boxes indicate that the FA images was cropped to 6×6 mm, equalling the sizes of the OCTA images. |
Discussion
The appearance of macular ischemia usually indicated worse visual acuity, and it had been confirmed decreased macular perfusion status in both the superficial and deep vascular networks, and vascular density and FAZ area appeared to correlate with visual function.17 And visual acuity was significantly correlated with FAZ area and macular vessel density at the SCP in the eyes of patients with diabetic macular edema.18 The present study found that DR was associated with ischemic changes, such as FAZ area expansion, the appearance of macular nonperfusion areas, and a reduction in blood flow density compared with healthy people. Retinal ischemia was found to be an important manifestation of DR. The development of retinal ischemia gradually reduced the compensatory function of retinal microcirculation, while accelerating the progression of retinal ischemia. Retinal ischemia and nonperfusion area formation are therefore the inevitable results of DR development.19–22
The decrease in macular perfusion status indicated the progression of retinal ischemia and an increase in disease severity, with the development of macular ischemia being closely related to the deterioration of visual acuity.18 Macular ischemia has been reported to be an independent risk factor for DR, with the Early Treatment Diabetic Retinopathy Study Research Group (ETDRS) reporting that the risk of developing PDR was much lower in NPDR patients with good macular perfusion status (18.2%) than in those with severe macular ischemia (41.3%).23,24
The present results indicated that the macular perfusion status gradually deteriorated as NPDR progressed to PDR, with significant reductions in FD-300 μm and DCP vessel density likely indicating the progression of DR severity. Reductions in retinal capillary perfusion may be due to the loss of retinal neurovascular coupling and chronic neurodegeneration in DR, impairing the ability of the retinal nerve to regulate blood vessels.25 Disease progression was accompanied by an increase in frequency of abnormally appearing retinal capillaries, manifesting as more obvious macular ischemia.26 Expansion of the FAZ area is accompanied by a decrease in visual sensitivity in DR, with visual sensitivity being negatively correlated with FAZ area and positively correlated with macular vessel density.27 Superficial vessel density has been associated with the development of macular edema, distributed in the nerve fiber and ganglion cell layers, whereas the deep retinal capillary network, located in the transition area between the retinal and choroidal vascular circulation, was easily affected by ischemic changes.6 Although changes in choroidal blood flow were not observed in the present study, choroidal thickness has been reported to be significantly lower in DR patients than in healthy people, indicating ischemic changes.28
Indicators of macular perfusion had been reported to correlate with BCVA.29,30 A deterioration in macular perfusion status resulted in the blocking of retinal capillaries, especially in the macular area, thereby reducing leakage of the macular capillaries. The present results showed that macular edema was reduced as the severity of DR progressed, whereas visual acuity was not improved, and that DCP vessel density correlated positively with visual acuity.18
Macular perfusion status in the present study was primarily evaluated by OCTA. Although FA has been regarded as a standard method of grading DR, comparisons of FA and OCTA revealed that both tests were consistent in showing the vessels in the macular area.8,9,31 OCTA, however, had several limitations. For example, fluid might induce segmentation artifacts, with projection artifacts from large superficial vessels being inevitably included in the deep capillary plexus in OCTA images, despite using the PAR algorithm to reduce decorrelation tailing and projection artifacts.31,32 Further developments of OCTA might yield vessel density measurements that more precisely represent the actual flow. Other limitations in our study mainly included the small sample size and the short study period. We needed a larger sample size and a longer observation period to determine how macular perfusion status plays a role in predicting disease progression.
Conclusion
Macular microvascular structure showed significantly greater deterioration in eyes with DR than in healthy eyes. Worse SCP vessel density and longer course might indicate poorer vision acuity, and worse FD-300 μm and DCP vessel density might be associated with the increase of severity. OCTA may enable a greater understanding of retinal vascular diseases and predict disease progression.
Data Sharing Statement
The data that support the findings of this study are available from the corresponding author, ZYZ, upon reasonable request.
Ethics Approval and Consent to Participate
The study was approved by the Ethics Committee of the Third Xiangya Hospital of Central South University (ID: kuai 23693). All research was conducted in accordance with the Declaration of Helsinki, and all patients gave informed consent before participation in this study. Subjects were provided a written informed consent in accordance with the guidelines of the Third Xiangya Hospital of Central South University.
Author Contributions
All authors made a significant contribution to the work reported, whether that is in the conception, study design, execution, acquisition of data, analysis and interpretation, or in all these areas; took part in drafting, revising or critically reviewing the article; gave final approval of the version to be published; have agreed on the journal to which the article has been submitted; and agree to be accountable for all aspects of the work.
Funding
The study was funded by The Natural Science Foundation of Hunan Province (2025JJ50588).
Disclosure
The authors declare that they have no competing interests in this work.
References
1. Kollias AN, Ulbig MW. Diabetic retinopathy: early diagnosis and effective treatment. Dtsch Ärztebl Int. 2010;107(5):75–83. doi:10.3238/arztebl.2010.0075
2. Teo ZL, Tham YC, Yu M, et al. Global prevalence of diabetic retinopathy and projection of burden through 2045. Systemat Rev Meta-Analys Ophthalmol. 2021;128(11):1580–1591.
3. Yang D, Tang Z, Ran A, et al. Assessment of parafoveal diabetic macular ischemia on optical coherence tomography angiography images to predict diabetic retinal disease progression and visual acuity deterioration. JAMA Ophthalmol. 2023;141(7):641–649. doi:10.1001/jamaophthalmol.2023.1821
4. Yalçın NG, Özdek Ş. The relationship between macular cyst formation and ischemia in diabetic macular edema. Turk J Ophthalmol. 2019;49(4):194–200. doi:10.4274/tjo.galenos.2018.19616
5. Cole ED, Novais EA, Louzada RN, Waheed NK. Contemporary retinal imaging techniques in diabetic retinopathy: a review. Clin Exp Ophthalmol. 2016;44(4):289–299. doi:10.1111/ceo.12711
6. Koulisis N, Kim AY, Chu Z, et al. Quantitative microvascular analysis of retinal venous occlusions by spectral domain optical coherence tomography angiography. PLoS One. 2017;12(4):e0176404. doi:10.1371/journal.pone.0176404
7. Samara WA, Shahlaee A, Adam MK, et al. Quantification of diabetic macular ischemia using optical coherence tomography angiography and its relationship with visual acuity. Ophthalmology. 2017;124(2):235–244. doi:10.1016/j.ophtha.2016.10.008
8. Garcia JMBB, Lima TT, Louzada RN, Rassi AT, Isaac DLC, Avila M. Diabetic macular ischemia diagnosis: comparison between optical coherence tomography angiography and fluorescein angiography. J Ophthalmol. 2016;2016:3989310. doi:10.1155/2016/3989310
9. Bradley PD, Sim DA, Keane PA, et al. The evaluation of diabetic macular ischemia using optical coherence tomography angiography. Invest Ophthalmol Vis Sci. 2016;57(2):626–631. doi:10.1167/iovs.15-18034
10. Tsai ASH, Jordan-Yu JM, Gan ATL, et al. Diabetic macular ischemia: influence of optical coherence tomography angiography parameters on changes in functional outcomes over one year. Invest Ophthalmol Vis Sci. 2021;62(1):9. doi:10.1167/iovs.62.1.9
11. Tombolini B, Borrelli E, Sacconi R, Bandello F, Querques G. Diabetic macular ischemia. Acta Diabetol. 2022;59(6):751–759. doi:10.1007/s00592-021-01844-1
12. Photocoagulation for Diabetic Macular Edema. Early treatment diabetic retinopathy study report number 1. Early treatment diabetic retinopathy study research group. Arch Ophthalmol. 1985;103(12):1796–1806. doi:10.1001/archopht.1985.01050120030015
13. Wilkinson CP, Ferris FL, Klein RE, et al. Proposed international clinical diabetic retinopathy and diabetic macular edema disease severity scales. Ophthalmology. 2003;110(9):1677–1682. doi:10.1016/S0161-6420(03)00475-5
14. Ferris FL 3rd, Kassoff A, Bresnick GH, Bailey I. New visual acuity charts for clinical research. Am J Ophthalmol. 1982;94(1):91–96. doi:10.1016/0002-9394(82)90197-0
15. Jia Y, Tan O, Tokayer J, et al. Split-spectrum amplitude-decorrelation angiography with optical coherence tomography. Opt Express. 2012;20(4):4710–4725. doi:10.1364/OE.20.004710
16. Lavia C, Bonnin S, Maule M, Erginay A, Tadayoni R, Gaudric A. Vessel density of superficial, intermediate, and deep capillary plexuses using optical coherence tomography angiography. Retina. 2019;39(2):247–258. doi:10.1097/IAE.0000000000002413
17. Samara WA, Shahlaee A, Sridhar J, Khan MA, Ho AC, Hsu J. Quantitative optical coherence tomography angiography features and visual function in eyes with branch retinal vein occlusion. Am J Ophthalmol. 2016;166:76–83. doi:10.1016/j.ajo.2016.03.033
18. AttaAllah HR, Mohamed AAM, Ali MA. Macular vessels density in diabetic retinopathy: quantitative assessment using optical coherence tomography angiography. Int Ophthalmol. 2019;39(8):1845–1859. doi:10.1007/s10792-018-1013-0
19. Brownlee M. Biochemistry and molecular cell biology of diabetic complications. Nature. 2001;414(6865):813–820. doi:10.1038/414813a
20. Wang W, Lo ACY. Diabetic retinopathy: pathophysiology and treatments. Int J Mol Sci. 2018;19(6):1816. doi:10.3390/ijms19061816
21. Liew G, Lei Z, Tan G, et al. Metabolomics of diabetic retinopathy. Curr Diab Rep. 2017;17(11):102. doi:10.1007/s11892-017-0939-3
22. Barber AJ. Diabetic retinopathy: recent advances towards understanding neurodegeneration and vision loss. Sci China Life Sci. 2015;58(6):541–549. doi:10.1007/s11427-015-4856-x
23. Focal photocoagulation treatment of diabetic macular edema. Relationship of treatment effect to fluorescein angiographic and other retinal characteristics at baseline: ETDRS report no. 19. Early treatment diabetic retinopathy study research group. Arch Ophthalmol. 1995;113(9):1144–1155. doi:10.1001/archopht.1995.01100090070025
24. Fluorescein angiographic risk factors for progression of diabetic retinopathy. ETDRS report number 13. Early treatment diabetic retinopathy study research group. Ophthalmology. 1991;98(5):834–840. doi:10.1016/S0161-6420(13)38015-4
25. Abcouwer SF, Gardner TW. Diabetic retinopathy: loss of neuroretinal adaptation to the diabetic metabolic environment. Ann NY Acad Sci. 2014;1311(1):174–190. doi:10.1111/nyas.12412
26. Neubauer AS, Kook D, Haritoglou C, et al. Bevacizumab and retinal ischemia. Ophthalmology. 2007;114(11):2096. doi:10.1016/j.ophtha.2007.05.057
27. Tsai ASH, Gan ATL, Ting DSW, et al. DIABETIC MACULAR ischemia: correlation of retinal vasculature changes by optical coherence tomography angiography and functional deficit. Retina. 2020;40(11):2184–2190. doi:10.1097/IAE.0000000000002721
28. Vujosevic S, Martini F, Cavarzeran F, Pilotto E, Midena E. Macular and peripapillary choroidal thickness in diabetic patients. Retina. 2012;32(9):1781–1790. doi:10.1097/IAE.0b013e31825db73d
29. Usman M. An overview of our current understanding of diabetic macular ischemia (DMI). Cureus. 2018;10(7):e3064. doi:10.7759/cureus.3064
30. Agemy SA, Scripsema NK, Shah CM, et al. Retinal vascular perfusion density mapping using optical coherence tomography angiography in normals and diabetic retinopathy patients. Retina. 2015;35(11):2353–2363. doi:10.1097/IAE.0000000000000862
31. Hwang TS, Zhang M, Bhavsar K, et al. Visualization of 3 distinct retinal plexuses by projection-resolved optical coherence tomography angiography in diabetic retinopathy. JAMA Ophthalmol. 2016;134(12):1411–1419. doi:10.1001/jamaophthalmol.2016.4272
32. Camino A, Zhang M, Gao SS, et al. Evaluation of artifact reduction in optical coherence tomography angiography with real-time tracking and motion correction technology. Biomed Opt Express. 2016;7(10):3905–3915. doi:10.1364/BOE.7.003905
 © 2025 The Author(s). This work is published and licensed by Dove Medical Press Limited. The
full terms of this license are available at https://www.dovepress.com/terms
and incorporate the Creative Commons Attribution
- Non Commercial (unported, 4.0) License.
By accessing the work you hereby accept the Terms. Non-commercial uses of the work are permitted
without any further permission from Dove Medical Press Limited, provided the work is properly
attributed. For permission for commercial use of this work, please see paragraphs 4.2 and 5 of our Terms.
© 2025 The Author(s). This work is published and licensed by Dove Medical Press Limited. The
full terms of this license are available at https://www.dovepress.com/terms
and incorporate the Creative Commons Attribution
- Non Commercial (unported, 4.0) License.
By accessing the work you hereby accept the Terms. Non-commercial uses of the work are permitted
without any further permission from Dove Medical Press Limited, provided the work is properly
attributed. For permission for commercial use of this work, please see paragraphs 4.2 and 5 of our Terms.
Recommended articles
Non-Linear Relationship Between Fasting C-Peptide and Retinopathy in Patients with Type 2 Diabetes Mellitus - A Retrospective Study
Ma J, Han C, Lv Y, Cai H
Diabetes, Metabolic Syndrome and Obesity 2025, 18:1035-1045
Published Date: 7 April 2025