Back to Journals » International Journal of General Medicine » Volume 16
Correlation Between Glycemic Variability and Diabetic Complications: A Narrative Review
Authors Huang L, Pan Y ![]() , Zhou K, Liu H
, Zhou K, Liu H ![]() , Zhong S
, Zhong S ![]()
Received 25 April 2023
Accepted for publication 11 July 2023
Published 21 July 2023 Volume 2023:16 Pages 3083—3094
DOI https://doi.org/10.2147/IJGM.S418520
Checked for plagiarism Yes
Review by Single anonymous peer review
Peer reviewer comments 5
Editor who approved publication: Dr Scott Fraser
Lining Huang,1 Ying Pan,1 Kaixin Zhou,2 Hongying Liu,3 Shao Zhong1
1Department of Endocrinology, Gusu School, Nanjing Medical University, The First People’s Hospital of Kunshan, Kunshan, 215300, People’s Republic of China; 2Guangzhou Laboratory, Guangzhou, 510005, People’s Republic of China; 3Hangzhou Kang Ming Information Technology Co., Ltd, Hangzhou, 310000, People’s Republic of China
Correspondence: Shao Zhong, Department of Endocrinology, Gusu School, Nanjing Medical University, The First People’s Hospital of Kunshan, Kunshan, 215300, People’s Republic of China, Tel +86 13328056828, Email [email protected] Hongying Liu, Hangzhou Kang Ming Information Technology Co., Ltd, Hangzhou, 310000, People’s Republic of China, Email [email protected]
Abstract: Diabetes mellitus is a metabolic disorder with a complex etiology in which glycemic dynamics are disturbed and the body is unable to maintain the process of glucose homeostasis through the pancreas. Persistent symptoms of high blood glucose or low blood glucose may lead to diabetic complications, such as neuropathy, nephropathy, retinopathy, and cardiovascular diseases. Glycemic variability which can represent the presence of excessive glycemic excursions is an indicator for evaluating glucose homoeostasis. Limiting glycemic variability has gradually become an emerging therapeutic target in improve diabetes metabolism and prevent associated complications. This article reviews the progress of research on the various quantifiable parameters of glycemic variability and their relationships with vascular lesions and mechanisms.
Keywords: diabetes mellitus, glycemic variability, glycemic variability parameters, vascular lesions of diabetes mellitus
Introduction
Diabetes is a common lifelong chronic disease whose prevalence continues to increase worldwide. The chronic high blood glucose levels caused by the disease have a negative impact on the blood vessels, leading to the development of several diabetes-related vascular diseases, such as diabetic microvascular complications and diabetic macrovascular complications.1 Research has shown that people with diabetes are 2–4 times more likely to develop cardiovascular and cerebrovascular disease than those without diabetes. Pre-diabetes also increases the risk of developing macrovascular disease.2 Patients with type 2 diabetes mellitus (T2DM) and heart failure have a significantly increased risk of death.3 In addition, hyperglycemia can also damage the small blood vessels of the kidney, leading to the development of diabetic nephropathy (DN).4 The onset and progression of these complications in people with diabetes continually reduces their quality of life and even threatens their lives.
Chronic low-grade inflammation is common in patients with diabetes and is considered one of the major factors contributing to diabetes-related complications. Recent studies have shown that a novel adipokine, neuregulin-4 (Nrg-4), can regulate glucose and lipid metabolism, reduce chronic inflammation and predict the risk of microvascular complications in patients with early-stage T2DM.5 Serum levels of Nrg-4 are negatively correlated with glycated hemoglobin A1c (HbA1c), fasting plasma glucose (FPG) and microalbuminuria. The inflammatory marker C-reactive protein (CRP) is also considered an independent risk factor for DN.6 The monocyte/lymphocyte ratio (MLR), a novel inflammation index, is significantly positively correlated with microalbuminuria7 and has some predictive power for diabetic retinopathy (DR).8 In addition, glycemic fluctuations, also known as glycemic variability, are important factors in the development of diabetes-related complications. Previous studies have shown that dynamic fluctuations in blood glucose between high and low levels can activate oxidative stress pathways, exacerbate endothelial cell dysfunction and chronic inflammation, promote platelet activation, alter gene expression, and consequently lead to vascular damage, increasing the risk of diabetes-related complications.9–11 In recent years, the assessment of blood glycemic variability has been increasingly enriched. More and more research studies have shown that parameters of blood glycemic variability calculated from values such as glycated HbA1c and FPG are associated with complications in patients with diabetes. In assessing the risk of related complications in patients with diabetes, it has been found that the higher the index of blood glycemic variability, the higher the risk of complications. At the same time, studies have also shown that controlling blood glycemic variability within a certain range can reduce the occurrence and development of complications in patients with diabetes.
With the widespread use of blood glucose monitoring systems and electronic health records, clinicians and patients with diabetes have gained a better understanding of blood glycemic variability over the course of a day or over longer periods of time. Blood glycemic variability indices can be calculated using different blood glucose monitoring methods. Both long-term and short-term blood glycemic variability indices correlate with the onset and development of diabetes-related complications. However, different blood glycemic variability indices have different clinical significance for different diabetes-related complications. Domestic and foreign researchers are continuously exploring and identifying more quantitative indices representing blood glycemic variability and their correlation with diabetes-related complications. They have confirmed that various quantitative indices evaluating long-term and short-term blood glycemic variability are to some extent correlated with the risk of all-cause mortality, cardiovascular and cerebrovascular diseases, and microvascular complications in patients with diabetes. To overview the current state of research, we searched PubMed using the terms diabetes, glycemic variability, glucose fluctuation, hyperglycemia, and vascular complications. This review summarizes various quantitative parameters of short-term and long-term blood glycemic variability and their correlation with the occurrence and development of macrovascular and microvascular complications in patients with diabetes. The aim is to improve the implementation of glycemic control in clinical practice and to predict, prevent, delay and reduce the occurrence and development of related complications in patients with diabetes.
Glycemic Variability
Definition of Glycemic Variability
Glycemic variability (GV), also known as blood glucose fluctuations, refers to the dynamic changes in blood glucose levels between low and high levels in the body, which can provide more information about blood glucose changes. It includes short-term blood glycemic variability, such as within-day and between-day variability, as well as long-term blood glycemic variability over weeks, months, or years.12 Most studies use FPG, glycated hemoglobin A1c (HbA1c), and other parameters to represent glycemic variability.
Methods for Monitoring Glycemic Variability
Monitoring parameters mainly include amplitude, which reflects the degree of blood glycaemic variability, and frequency, which reflects the variability of blood glucose over time.13 Those measurements can be done using sensors of continuous glucose monitoring (CGM) and self-monitoring of blood glucose (SMBG). Studies have shown a good correlation between SMBG and CGM blood glucose levels.14
Parameters of Glycemic Variability
Parameters of the Short-Term Glycemic Variability
Mean of Daily Differences (MDD): The best parameters for assessing intra-day glycemic variability, reflecting the repeatability of daily glucose fluctuations.15 It is calculated by taking the absolute difference between corresponding measurements over 2 consecutive days and calculating the average.13
Average Glucose Profile (AGP): Reflects whether there is daily synchrony in blood glucose patterns within a given time period, usually expressed as the IQR of the AGP.13,16,17
Coefficient of variation (CV): (standard deviation/mean) × 100%, is a parameter independent of the mean13 and reflects only the magnitude of glucose variation.
Standard deviation (SD): The arithmetic square root of the variance, which represents the distribution of blood glucose readings around the mean or variability. SD is strongly influenced by average blood glucose.
Mean amplitude of glycemic excursions (MAGE): The average value obtained by taking the first valid direction of fluctuation to calculate the magnitude of the blood glucose fluctuation after removing all fluctuations that do not exceed a certain threshold (usually 1 SD).
Time in Range (TIR): The percentage of time spent in the target glucose range (70–180 mg/dL or 3.9–10.0 mmol/L) within 24 hours.18
Time above range (TAR): The time that glucose is above the target range (181–250 mg/dL or 10.1–13.9 mmol/L).18
Time below range (TBR): The time that glucose is below the target range (<70 mg/dL or 3.8 mmol/L) and (<54 mg/dL or 2.0 mmol/L).
Incremental glucose peak (IGP): Calculated by subtracting the FPG from the absolute glucose peak (AGP).19
Glycemic variability percentage (GVP): GVP = (L/L0-1) × 100%, where L and L0 are the lengths of the true glycemic variability trajectory and the no glycemic variability trajectory, respectively, within a given time period.
Parameters of Long-Term Glycemic Variability
HbA1c, FPG and postprandial plasma glucose (PPG) are mostly used in long-term glucose fluctuation clinics with multiple long-term follow-ups, and the variability is expressed as CV, SD, VIM, etc.
Visit-to-visit variability (VVV): During long-term follow-up, FPG and HbA1c are measured at certain intervals and standardized to obtain the blood glycemic variability of multiple time periods, namely FPG-VVV and HbA1c-VVV.20 SD, CV, VIM, and ARV can all be used as indices of VVV.
Variation Independent of Mean (VIM): Logarithmic curve fit. VIM = SD/meanβ, where β is the regression coefficient based on the ln of the SD over the ln of the mean.21
Average Real Variability (ARV): Refers to the average difference between consecutive values; ARV can roughly estimate the variation of each episode, rather than simply calculating the dispersion of the data.13
HbA1c variability: Reflects long-term blood glucose fluctuations; expressed using CV, SD, VIM, and other parameters to measure its variability.
HbA1c variability score (HVS): Reflects long-term blood glucose fluctuations, and HVS refers to the percentage of HbA1c measurements with a change of at least 0.5% from the previous measurement.13
FPG and PPG variability: Reflects long-term fasting and postmeal glucose fluctuations; expressed using CV, SD, VIM, ARV, and other parameters to measure their variability.13 (Table 1)
 |
Table 1 Evaluation Parameters for Short-Term and Long-Term Blood Glucose Fluctuations |
Glycemic Variability in Diabetes Mellitus and Its Association with Some Complications
Mechanisms Research
Oxidative Stress
Oxidative stress refers to the imbalance between cellular pro-oxidants and antioxidants.23 High glycemic variability can exacerbate oxidative stress and accelerate cell apoptosis and damage.24 High blood glucose, glycemic variability, and hypoglycemia are all associated with the production of reactive oxygen species (ROS). Hyperglycemia promotes the production of advanced glycation end products (AGEs) by inducing excessive ROS and oxidative stress (OS), activating protein kinase C (PKC), and promoting overactivity of the hexosamine and polyol pathways, leading to the development of insulin resistance, impaired insulin secretion, and endothelial dysfunction. Research suggests that compared with chronic hyperglycemia, GV is associated with increased production of ROS leading to vascular damage, possibly through the same mechanisms as hyperglycemia, but may also have adverse effects associated with hypoglycemia.23,25 Hypoglycemia may also play an important role in promoting diabetic vascular complications through OS, inflammation, thrombotic events, and endothelial dysfunction.23
Activation of Inflammatory Response
Diabetes mellitus is a chronic low-grade inflammatory disease. Activation of the inflammatory pathway is critical for the onset and development of complications in patients with diabetes.25 On one hand, hyperglycemia can activate the immune response within the islets, promoting the synthesis and release of inflammatory factors such as IL-1β, TNF-α, IL-6 and VCAM-1 into the blood, creating a local microenvironment with them. Within this microenvironment, immune cells are activated, initiating an inflammatory response that worsens insulin resistance and further impairs islet function.24,26 On the other hand, blood glucose fluctuations promote the production of inflammatory factors such as IL-6 and TNF-α, exacerbating the occurrence and development of microangiopathy in patients with diabetes.27 At the same time, inflammatory factors associated with blood glucose fluctuations become more active. They not only damage pancreatic β-cells, inducing apoptosis and impairing β-cell function and insulin secretion, but also exacerbate blood glucose fluctuations, creating a vicious cycle.28
Endothelial Cell Damage
Endothelial cell damage is a key indicator of diabetic vascular complications. Fluctuations in blood glucose levels stimulate the production of cytokines, adhesion molecules, and apoptotic genes, leading to endothelial damage in both larger vessels and microvessels, ultimately compromising vasodilator function.29,30 Fluctuating hyperglycemia also increases susceptibility to oxidative stress, which further exacerbates endothelial cell damage and results in impaired vasoconstriction.24
Activation of Coagulation Mechanism
Hypercoagulation is one of the major pathophysiological mechanisms of diabetic vascular complications. Platelet aggregation and activation are closely related to the magnitude of glycemic variability. Increased levels of coagulation factors and thrombin promote thrombus formation and atherosclerosis, increasing the likelihood of acute cardiovascular events.24 Wang et al found that the amplitude of blood glucose fluctuations in T2DM patients was related to the degree of platelet aggregation and activation, and the level of MAGE was significantly positively correlated with the expression levels of peripheral blood PAG and platelet membrane protein CD62p.31
Other Related Mechanisms
Studies have shown that glycemic fluctuations in patients with diabetes have a bidirectional effect on neovascularization. Acute glycemic fluctuations promote vascular formation while inhibiting the production of vascular endothelial growth factor (VEGF). In addition, excessive glycemic fluctuations have been shown to cause more significant renal fibrosis in diabetic nephropathy. Excessive glycemic variability may also cause progressive deterioration of pancreatic β-cell function, thereby exacerbating the onset and development of diabetes and its complications.25 Both short-term and long-term glycemic fluctuations may promote the occurrence of diabetic vascular complications through mechanisms such as oxidative stress, endothelial cell injury, activation of inflammatory responses, and activation of coagulation. Abnormal long-term glycemic fluctuations may increase the risk of hypoglycemia, which stimulates the activation of inflammatory mediators and platelets. Therefore, there may be some differences in the pathophysiological mechanisms between long-term and short-term glycemic fluctuations and diabetic vascular complications. Thus, there may be some correlation between long-term and short-term glycemic fluctuations.
Clinical Research
Impact of the Short-Term Glycemic Variability on the Risks of Macrovascular and Microvascular Complications in Diabetes
Gerbaud et al proposed that during the initial hospitalization period, SD-assessed GV (critical value >2.70 mmol/L) was an independent predictor of macrovascular complications such as acute myocardial infarction, acute heart failure, and cardiogenic death in patients with diabetes and acute coronary syndrome.32 During hospitalization, GV as assessed by MAGE is an independent predictor of poor prognosis in patients with cerebrovascular disease and acute coronary syndrome.33 In addition, MAGE correlates with the severity of coronary artery disease (CAD) in acute myocardial infarction patients with poor diabetes control. Early assessment of GV may help to identify high-risk patients and may serve as a therapeutic target for primary and secondary prevention.34 Daily GV is associated with coronary artery spasm in patients with glycemic disorders.35 During the oral glucose tolerance test (OGTT), IGP is independently correlated with aortic stiffness and poor carotid artery remodeling, but not with carotid intima-media thickness, stiffness, microvascular function, etc.19 Liang et al pointed out that controlling GV can improve insulin resistance, reduce carotid intima-media thickness, and reduce the risk of CVD.36 In addition, TIR during hospitalization was negatively related with increased risk of all-cause and cardiovascular death.37
A 7-point glucose curve study using the Diabetes Control and Complications Trial (DCCT) dataset confirmed a negative association between TIR and the risk ratio for developing retinopathy or microalbuminuria. A 10% decrease in TIR was associated with a 64% increase in the risk of progression to retinopathy and a 40% increase in the risk of microalbuminuria.38 Picconi et al found that short-term glycemic variability assessed by CV, SD, and MAGE was associated with early retinal neurodegeneration in patients with type 1 diabetes.39 TIR was independently associated with DR at different stages, such as mild-DR, moderate-DR, and vision loss-DR, while the severity of DR was negatively correlated with TIR quartile (r = −0.147; P <0.001).40 In addition, TIR was significantly associated not only with microalbuminuria and DR, but also with CAN. TIR was negatively correlated with all stages of CAN, and was lower in patients with more severe CAN.41 The correlation between TIR and microalbuminuria, DR, and CAN persisted after calibration for parameters of glycemic variability (eg, SD, MAGE, and CV) and baseline factors (eg age, sex, and duration of diabetes). This suggests that the association between TIR and microvascular complications is not influenced by other GV parameters.40–42
Impact of the Long-Term Glycemic Variability on the Risks of Macrovascular and Microvascular Complications in Diabetes
A randomized study in patients with T2DM showed that FPG parameters (FPG-CV, FPG-ARV) were significantly associated with the incidence of cardiovascular disease (CVD). This association remained evident after adjustment for mean fasting plasma glucose and multiple baseline risk factors. However, there was no significant association between HbA1c variability index and CVD.43 Another randomized controlled trial showed that FPG-VVV was related to both macrovascular and microvascular complications (P=0.005 and P<0.001, respectively).20,44 Compared with FPG-CV, HbA1c-CV showed a weaker association and poorer consistency. Lee et al showed that long-term FPG-VIM had a positive dose-response relationship with the risk of stroke, myocardial infarction, and all-cause mortality in patients with diabetes and was independent of glucose-lowering medications, mean fasting glucose, and metabolic risk factors.45 FPG-SD, FPG-CV, and FPG-ARV have similar predictive validity. FPG-CV was identified as a risk factor for ischemic stroke in a Taiwanese population of patients with diabetes.46 A study conducted in a German population showed that HbA1c-CV was a risk factor for stroke, myocardial infarction, and severe hypoglycemia in patients who had just started insulin hypoglycemic therapy.47 Similar results were found in Chinese patients with diabetes, with long-term FPG-CV increasing the risk of CVD and all-cause mortality.48 In addition, studies have found that increases in HbA1c-CV and FPG-CV are both associated with accelerated progression of coronary artery plaques in patients with T2DM.49 Cardiovascular autonomic neuropathy (CAN) is also common in people with diabetes but is one of the most overlooked macrovascular complications. HbA1c-CV and HbA1c-SD independently influence the severity of CAN and are positively correlated with patient scores on the composite autonomic scoring scale.50
HbA1c-CV and HbA1c-SD are both connected with the occurrence of heart failure with preserved ejection fraction (HFpEF) in patients with T2DM.51 HbA1c variability may serve as a predictor of HFpEF progression.52 Other studies have suggested that FPG-VVV is a novel risk factor for long-term adverse changes in left heart structure and systolic function in patients with T2DM.53 Yang et al found that FPG variability is an independent predictor of poor left ventricular remodeling after ST-segment elevation myocardial infarction in patients with T2DM.52 Li et al reported that patients with HVS > 60% had a significantly increased risk of all-cause mortality and adverse cardiovascular events.54
Glycemic variability is a better parameter than average HbA1c for assessing the development or worsening of complications such as diabetic nephropathy and peripheral neuropathy in patients with T2DM during long-term follow-up.55 Several studies have shown that patients with T2DM have an increased risk of developing diabetic polyneuropathy (DPN), painful diabetic peripheral neuropathy (PDPN) and peripheral artery disease (PAD), which are significantly associated with FPG-CV.56 FPG-CV is also associated with a higher risk of painful diabetic peripheral neuropathy (PDPN) in patients with T2DM.57 In addition, some studies have identified FPG-CV as an effective predictor of diabetic polyneuropathy (DPN) in T2DM patients.58 Risk factors for progression of DN and DR differ, with HbA1c-SD significantly correlating with DN progression and mean HbA1c significantly associated with DR progression.59 HbA1c control can also reduce the risk of patients developing stage 3–4 chronic kidney disease.60 Ceriello et al found that high variability in HbA1c-SD increases the risk of DN.61 Several studies have shown that FPG variability is associated with an increased risk of moderate to severe DN.62 HbA1c-CV is also closely associated with DPN and is considered a predictive parameter for patients with diabetes with DPN.63,64 Lai et al showed that high HbA1c variability is closely associated with the severity of DPN.65 Lee et al demonstrated that high HbA1c-CV is an independent risk factor for renal function decline66 and is also independently associated with the severity of cardiovascular autonomic neuropathy.50 Li et al found that patients with an HbA1c-CV greater than 60% have a significantly increased risk of diabetic retinopathy, peripheral neuropathy, diabetic foot ulcers, and chronic kidney disease.54 In addition, some studies have suggested that HbA1c-CV is a better predictor of microvascular complications than HbA1c-SD and HVS.67 However, there is also evidence that FPG-SD, FPG-CV, HbA1c-SD, and HbA1c-CV are risk predictors for all microvascular and macrovascular complications at 24 months of follow-up, and their predictability is better than that of mean HbA1c.55 Conversely, mean HbA1c was better at predicting the risk of DR and the progression of complications such as peripheral neuropathy in patients with poor glycemic control. Overall, the 24-month glycemic variability parameter was a more favorable predictor than the 12-month glycemic variability parameter.
Discussion
Both long-term and short-term parameters of glycemic variability are associated with a variety of different vascular complications of diabetes, in addition to neurological disorders, cognitive function, even the risk of hypoglycemia, prolonged hospital stay, and postoperative infection.25 However, the correlation between different parameters of long-term or short-term glycemic variability parameters and diabetes-related complications varies. With regard to long-term FPG, FPG-CV, FPG-VIM and other quantitative parameters have certain differences in the correlation with the same long-term complication in patients with diabetes. The same GV quantitative parameters have different predictive effects on the risk of different complications. The same is true for short-term glycemic variability parameters, as shown in Table 2. Besides, both long-term and short-term glucose fluctuations may lead to related complications through oxidative stress, endothelial cell damage, activation of the inflammatory response, activation of coagulation, and other mechanisms. However, long-term glucose fluctuations may increase the risk of hypoglycemia, which stimulates the activation of inflammatory mediators and platelets. This suggests that the pathophysiological mechanisms of long-term and short-term glucose fluctuations leading to diabetes-related complications may be different.22
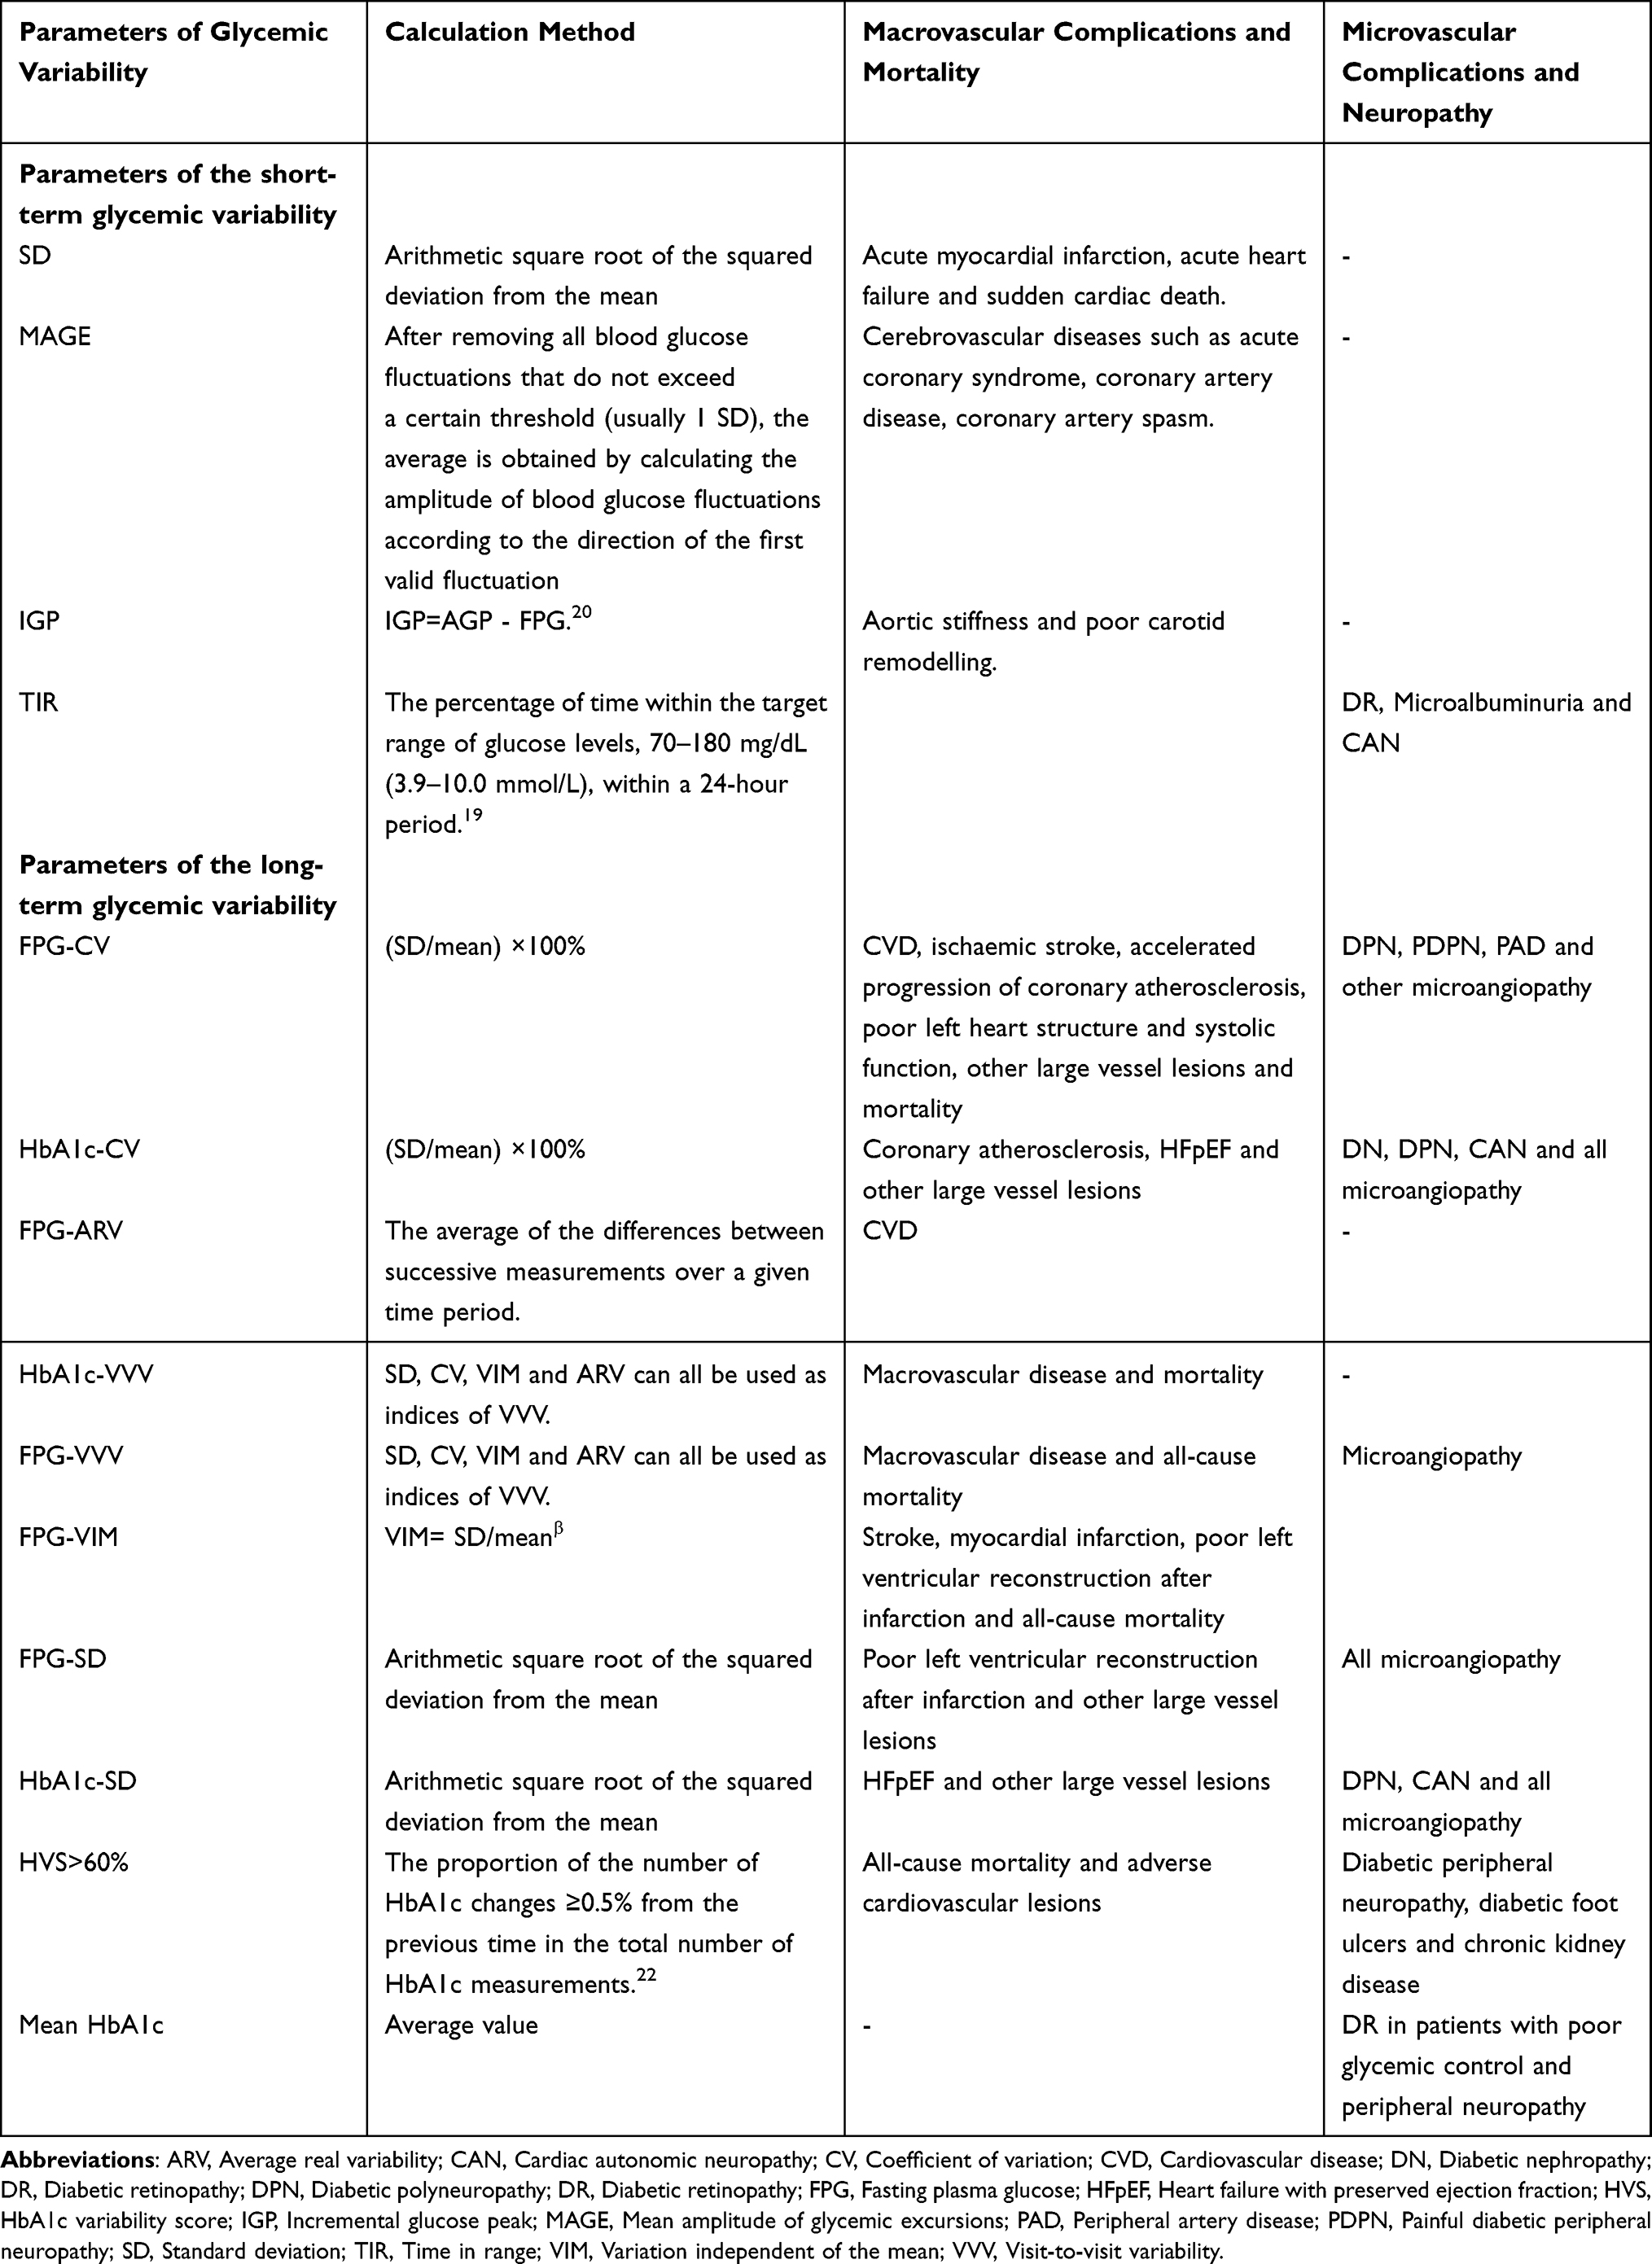 |
Table 2 Correlations Between Glycemic Variability Parameters and Diabetic Complications |
There may also be some correlation between different quantitative parameters that quantify long-term glucose variability or short-term glucose variability. Nevertheless, few studies have been conducted to explore whether there is a certain correlation between long-term glycemic variability and short-term glycemic variability. Previous studies have investigated the relationship between blood glucose concentration at different times and HbA1c levels. The results showed that premeal glucose was more strongly correlated with HbA1c than postmeal glucose.68 However, Ehehalt et al suggested that postprandial glucose had a higher correlation with HbA1c in patients with better glycemic control, while the correlation between FPG and HbA1c gradually increased with the deterioration of diabetic glycemic control.69 In other words, there may be some correlation between long-term glycemic variability parameters in patients with poor glycemic control. Some studies have confirmed that TIR is negatively correlated with HbA1c and glycated albumin in patients with impaired glucose tolerance, T1DM and T2DM.70 Researchers observed the correlation between HbA1c and several glycemic variability parameters derived from CGMs in T2DM patients and found that HbA1c was correlated with TIR (r= −0.75), mean blood glucose (r=0.8), TAR (r= 0.75), and TBR (r= −0.39).71 There was a negative correlation between TIR and Glucose Management Indicator (GMI) (estimates of mean HbA1c).72 Similar results were observed in elderly male patients with T2DM, and patients with lower TIR had greater long-term glycemic variability.73 In addition to long-term glycemic variability parameters such as HVS, a retrospective study showed that calibrated HbA1c SD was positively correlated with TBR (r=0.501, P=0.009), and mean glucose was positively correlated with TAR (r=0.525, P=0.006) and MODD (r=0.570, P=0.002) in patients with T2DM.74 Some researchers have also found that TIR is associated with mean HbA1c and Hba1C-VVV, while MODD is associated with Hba1C-VVV.75 Consistently, TIR was significantly associated with GMI (r=−0.822, P<0.001) and HbA1c (r=−0.563, P<0.001) in T1DM patients, and TIR had a highly inverse linear relationship with GMI (R2=0.676, P<0.001), while GMI was positively correlated with SD, MAGE, and MODD, but not with CV.76 These results highlight a certain correlation between the quantitative parameters of long-term and short-term glycemic variability in patients with diabetes. The correlation between SMBG glycemic variability parameters and MAGE in CGM is another topic that has attracted much attention from scientists. Studies found that the standard deviation of blood glucose level (SDBG) calculated from the seven-point SMBG data, the postprandial glucose excursion (PPGE), the largest amplitude of glycemic excursions (LAGE), CV, MAGE and other glycemic variability parameters were closely related to MAGE obtained by CGM, especially SDBG.77 Therefore, there is also some correlation between short-term glycemic variability parameters. However, most studies have examined the correlation between HbA1c glycemic variability and short-term glycemic variability parameters during long-term follow-up, and few studies have investigated the correlation between FPG glycemic variability from long-term monitoring and various short-term glycemic variability parameters.
Therefore, we can further explore the correlation between long-term and short-term glycemic variability parameters in patients with diabetes in the future. For example, we can investigate whether there is a correlation between long-term and short-term fasting glycemic variability. What statistical methods can we use to do this research? Can we use Pearson’s correlation coefficient to study the correlation between long-term and short-term blood glucose fluctuations? Or are there other research methods that can be used to study their correlation and the specific nature of their correlation? How effective is this correlation in predicting the risk of complications in patients with diabetes? Is the predictive power of this correlation for the risk of complications in patients with diabetes different if the risk of complications is predicted independently from long-term or short-term glycemic variability? Does this correlation improve the predictive power of glycemic variability on the risk of complications in patients with diabetes? Can we also use a subset of the glucose variability data available to patients with diabetes to predict their risk of relevant complications? After exploring these questions, specific statistical methods may be used to calculate certain glycemic variability indicators in clinical practice to predict and prevent some complications in patients with diabetes. This will help patients with diabetes who do not have access to both long-term and short-term blood glucose monitoring data, and avoid the time-consuming calculation of additional glycemic variability indicators with similar predictive power, and reduce the number of blood samples taken from patients. This will not only improve the efficiency of the management of complication risk, but will also improve patient compliance, thereby benefiting the patients.
Conclusion and Future Prospects
In conclusion, both long-term and short-term glycemic variability parameters may contribute to the development and progression of complications in patients with T2DM by influencing oxidative stress, endothelial cell damage, activation of inflammatory responses, and coagulation activation. In addition, there is some correlation between long-term and short-term glycemic variability parameters, although the pathophysiological mechanisms by which they influence the development of the disease may be different. In future research, it is essential to further investigate the correlation between long-term and short-term glycemic variability parameters, in order to lay a solid foundation for the development of improved strategies for blood glucose monitoring and management.
Funding
This work was supported by Suzhou Science and Technology Project (No: SLT2021006).
Disclosure
The authors declare no conflicts of interest related to this work/review article.
References
1. Papatheodorou K, Papanas N, Banach M, et al. Complications of Diabetes 2016. J Diabetes Res. 2016;2016:6989453. doi:10.1155/2016/6989453
2. Chinese Cardiovascular Disease Prevention Guidelines (2017) Writing group, Editorial Board of Chinese Journal of Cardiovascular Diseases. Chinese Guidelines for Prevention of cardiovascular diseases (2017). Chin J Cardiovasc Dis. 2018;46(1):10–25.
3. Cavender MA, Steg PG, Smith SC, et al. Impact of diabetes mellitus on hospitalization for heart failure, cardiovascular events, and death. Circulation. 2015;132(10):923–931. doi:10.1161/CIRCULATIONAHA.114.014796
4. Caramori ML, Mauer M. Diabetes and nephropathy. Curr Opin Nephrol Hypertens. 2003;12(3):273–282. doi:10.1097/00041552-200305000-00008
5. Kocak MZ, Aktas G, Atak BM, et al. Is Neuregulin-4 a predictive marker of microvascular complications in type 2 diabetes mellitus? Eur J Clin Invest. 2020;50(3):e13206. doi:10.1111/eci.13206
6. Bilgin S, Kurtkulagi O, Tel BMA, et al. Does C-reactive protein to serum Albumin Ratio correlate with diabetic nephropathy in patients with type 2 Diabetes MELLITUS? The Care Time study. Prim Care Diabetes. 2021;15(6):1071–1074. doi:10.1016/j.pcd.2021.08.015
7. Kocak MZ, Aktas G, Duman TT, et al. Monocyte lymphocyte ratio as a predictor of diabetic kidney injury in type 2 diabetes mellitus; the MADKID study. J Diabetes and Metab Disord. 2020;19(2):997–1002. doi:10.1007/s40200-020-00595-0
8. Yue S, Zhang J, Wu J, et al. Use of the monocyte-to-lymphocyte ratio to predict diabetic retinopathy. Int J Environ Res Public Health. 2015;12(8):10009–10019. doi:10.3390/ijerph120810009
9. Škrah J, Šoupal J, Škrah J, et al. Glucose variability, HbA1c and microvascular complications. Rev Endocr Metab Disord. 2016;17(1):103–110. doi:10.1007/s11154-016-9347-2
10. Yapanis M, James S, Craig ME, et al. Complications of diabetes and metrics of glycemic management derived from continuous glucose monitoring. J Clin Endocrinol Metab. 2022;107(6):e2221–e2236. doi:10.1210/clinem/dgac034
11. Ceriello A, Novials A, Ortega E, et al. Vitamin C further improves the protective effect of GLP-1 on the ischemia-reperfusion-like effect induced by hyperglycemia post-hypoglycemia in type 1 diabetes. Cardiovasc Diabetol. 2013;12(1):97. doi:10.1186/1475-2840-12-97
12. Wang ZF, Zhu MX, Wang ZP. Research progress on the relationship between blood glucose fluctuation and vascular complications in type 2 diabetes mellitus. Adv Cardiol. 2018;39(6):1064–1068.
13. Ni JY, Ma XJ, Zhou J. Research progress of abnormal blood glucose fluctuation and diabetes complications. China Diabetes. 2022;14(4):388–392.
14. Liu ZG, Yao B, Lin BS, et al. Study on the correlation between blood glucose fluctuation index and average blood glucose fluctuation amplitude in self-blood glucose monitoring. Chin J Diabetes. 2021;13(5):476–481.
15. Molnar GD, Taylor WF, Ho MM. Day-to-day variation of continuously monitored glycaemia: a further measure of diabetic instability. Diabetologia. 1972;8(5):342–348. doi:10.1007/BF01218495
16. Bailey T, Bode BW, Christiansen MP, et al. The performance and usability of a factory-calibrated flash glucose monitoring system. Diabetes Technol Ther. 2015;17(11):787–794. doi:10.1089/dia.2014.0378
17. Hoss U, Budiman ES. Factory-calibrated continuous glucose sensors: the science behind the technology. Diabetes Technol Ther. 2017;19(S2):S44–S50. doi:10.1089/dia.2017.0025
18. Sun B, Luo Z, Zhou J. Comprehensive elaboration of glycemic variability in diabetic macrovascular and microvascular complications. Cardiovasc Diabetol. 2021;20(1):9. doi:10.1186/s12933-020-01200-7
19. Foreman YD, Brouwers MCGJ, Berendschot TTJM, et al. The oral glucose tolerance test-derived incremental glucose peak is associated with greater arterial stiffness and maladaptive arterial remodeling: the Maastricht Study. Cardiovasc Diabetol. 2019;18(1):152. doi:10.1186/s12933-019-0950-x
20. Hirakawa Y, Arima H, Zoungas S, et al. Impact of visit-to-visit glycemic variability on the risks of macrovascular and microvascular events and all-cause mortality in type 2 diabetes: the ADVANCE trial. Diabetes Care. 2014;37(8):2359–2365. doi:10.2337/dc14-0199
21. Kim JA, Lee JS, Chung HS. Impact of visit-to-visit fasting plasma glucose variability on the development of type 2 diabetes: a nationwide population-based cohort study. Diabetes Care. 2018;41(12):2610–2616. doi:10.2337/dc18-0802
22. J-Y N, X-J M, Zhou J. Research progress of abnormal blood glucose fluctuation and diabetic complications. Chin J Diabetes. 2022;14(4):388–392.
23. Papachristoforou E, Lambadiari V, Maratou E, et al. Association of glycemic indices (Hyperglycemia, Glucose Variability, and Hypoglycemia) with oxidative stress and diabetic complications. J Diabetes Res. 2020;2020:7489795. doi:10.1155/2020/7489795
24. Sheng MY. Study on the Correlation Between Blood Glucose Fluctuation and the Degree of Vascular Lesions in Type 2 Diabetes Patients with Normal HbAlc. Soochow University; 2020.
25. Klimontov VV, Saik OV, Korbut AI. Glucose variability: how does it work? Int J Mol Sci. 2021;22(15):7783. doi:10.3390/ijms22157783
26. Kahn SE, Cooper ME, Del Prato S. Pathophysiology and treatment of type 2 diabetes: perspectives on the past, present, and future. Lancet. 2014;383(9922):1068–1083. doi:10.1016/S0140-6736(13)62154-6
27. Su HW, Kang S, Long YW, et al. Relationship between diabetic nephropathy and blood glucose fluctuation and inflammatory factors. Chi J Geriatric Heart Brain Vessel Dis. 2015;17(3):273–276.
28. Quan W, Jo E-K, Lee M-S. Role of pancreatic β-cell death and inflammation in diabetes. Diabetes Obes Metab. 2013;15(s3):141–151. doi:10.1111/dom.12153
29. Palazzo P, Maggio P, Altavilla R, et al. Cerebral hemodynamics and systemic endothelial function are already impaired in well-controlled type 2 diabetic patients, with short-term disease. PLoS One. 2013;8(12):e83287. doi:10.1371/journal.pone.0083287
30. Ceriello A, Quagliaro L, Piconi L, et al. Effect of postprandial hypertriglyceridemia and hyperglycemia on circulating adhesion molecules and oxidative stress generation and the possible role of simvastatin treatment. Diabetes. 2004;53(3):701–710. doi:10.2337/diabetes.53.3.701
31. Wang JS, Huang Y, Chen KJ, et al. Relationship between blood glucose fluctuation and vascular endothelial injury, platelet activation and PKCβ1 expression in patients with type 2 diabetes mellitus. Chin J Integr Med. 2016;36(10):1184–1190.
32. Gerbaud E, Darier R, Montaudon M, et al. Glycemic variability is a powerful independent predictive factor of midterm major adverse cardiac events in patients with diabetes with acute coronary syndrome. Diabetes Care. 2019;42(4):674–681. doi:10.2337/dc18-2047
33. Takahashi H, Iwahashi N, Kirigaya J, et al. Glycemic variability determined with a continuous glucose monitoring system can predict prognosis after acute coronary syndrome. Cardiovasc Diabetol. 2018;17(1):116. doi:10.1186/s12933-018-0761-5
34. Benalia M, Zeller M, Mouhat B, et al. Glycaemic variability is associated with severity of coronary artery disease in patients with poorly controlled type 2 diabetes and acute myocardial infarction. Diabetes Metab. 2019;45(5):446–452. doi:10.1016/j.diabet.2019.01.012
35. Ito T, Ichihashi T, Fujita H, et al. The impact of intraday glucose variability on coronary artery spasm in patients with dysglycemia. Heart Vessels. 2019;34(8):1250–1257. doi:10.1007/s00380-019-01353-w
36. Liang S, Yin H, Wei C, et al. Glucose variability for cardiovascular risk factors in type 2 diabetes: a meta-analysis. J Diabetes Metab Disord. 2017;16(1):45. doi:10.1186/s40200-017-0323-5
37. Lu J, Wang C, Shen Y, et al. Time in range in relation to all-cause and cardiovascular mortality in patients with type 2 diabetes: a prospective cohort study. Diabetes Care. 2021;44(2):549–555. doi:10.2337/dc20-1862
38. Beck RW, Bergenstal RM, Riddlesworth TD, et al. Validation of time in range as an outcome measure for diabetes clinical trials. Diabetes Care. 2019;42(3):400–405. doi:10.2337/dc18-1444
39. Picconi F, Parravano M, Ylli D, et al. Retinal neurodegeneration in patients with type 1 diabetes mellitus: the role of glycemic variability. Acta Diabetol. 2017;54(5):489–497. doi:10.1007/s00592-017-0971-4
40. Lu J, Ma X, Zhou J, et al. Association of time in range, as assessed by continuous glucose monitoring, with diabetic retinopathy in type 2 diabetes. Diabetes Care. 2018;41(11):2370–2376. doi:10.2337/dc18-1131
41. Guo Q, Zang P, Xu S, et al. Time in range, as a novel metric of glycemic control, is reversely associated with presence of diabetic cardiovascular autonomic neuropathy independent of HbA1c in Chinese type 2 diabetes. J Diabetes Res. 2020;2020:5817074. doi:10.1155/2020/5817074
42. Yoo JH, Chol MS, Ahn J, et al. Association between continuous glucose monitoring-derived time in range, other core metrics, and albuminuria in type 2 diabetes. Diabetes Technol Ther. 2020;22(10):768–776. doi:10.1089/dia.2019.0499
43. Zhou JJ, Schwenke DC, Bahn G, et al. Glycemic variation and cardiovascular risk in the veterans affairs diabetes trial. Diabetes Care. 2018;41(10):2187–2194. doi:10.2337/dc18-0548
44. Slieker RC, van der Heijden AAWH, Nijpels G, et al. Visit-to-visit variability of glycemia and vascular complications: the Hoorn Diabetes Care System cohort. Cardiovasc Diabetol. 2019;18(1):170. doi:10.1186/s12933-019-0975-1
45. Lee DY, Han K, Park S, et al. Glucose variability and the risks of stroke, myocardial infarction, and all-cause mortality in individuals with diabetes: retrospective cohort study. Cardiovasc Diabetol. 2020;19(1):144. doi:10.1186/s12933-020-01134-0
46. Lin CC, Yang CP, Li CI, et al. Visit-to-visit variability of fasting plasma glucose as predictor of ischemic stroke: competing risk analysis in a national cohort of Taiwan Diabetes Study. BMC Med. 2014;12(1):165. doi:10.1186/s12916-014-0165-7
47. Bonke FC, Donnachie E, Schneider A, et al. Association of the average rate of change in HbA1c with severe adverse events: a longitudinal evaluation of audit data from the Bavarian Disease Management Program for patients with type 2 diabetes mellitus. Diabetologia. 2016;59(2):286–293. doi:10.1007/s00125-015-3797-z
48. Wang A, Liu X, Xu J, et al. Visit‐to‐visit variability of fasting plasma glucose and the risk of cardiovascular disease and all‐cause mortality in the general population. J Am Heart Assoc. 2017;6(12):e006757. doi:10.1161/JAHA.117.006757
49. Li S, Tang X, Luo Y, et al. Impact of long-term glucose variability on coronary atherosclerosis progression in patients with type 2 diabetes: a 2.3 year follow-up study. Cardiovasc Diabetol. 2020;19(1):146. doi:10.1186/s12933-020-01126-0
50. Lai Y-R, Huang -C-C, Chiu W-C, et al. HbA1C variability is strongly associated with the severity of cardiovascular autonomic neuropathy in patients with type 2 diabetes after longer diabetes duration. Front Neurosci. 2019;13:458. doi:10.3389/fnins.2019.00458
51. Gu J, Fan YQ, Zhang JF, Wang C-Q. Association of hemoglobin A1c variability and the incidence of heart failure with preserved ejection fraction in patients with type 2 diabetes mellitus and arterial hypertension. Hellenic J Cardiol. 2018;59(2):91–97. doi:10.1016/j.hjc.2017.08.001
52. Yang CD, Shen Y, Ding FH, et al. Visit-to-visit fasting plasma glucose variability is associated with left ventricular adverse remodeling in diabetic patients with STEMI. Cardiovasc Diabetol. 2020;19(1):131. doi:10.1186/s12933-020-01112-6
53. Tang X, Zhong J, Zhang H, et al. Visit-to-visit fasting plasma glucose variability is an important risk factor for long-term changes in left cardiac structure and function in patients with type 2 diabetes. Cardiovasc Diabetol. 2019;18(1):50. doi:10.1186/s12933-019-0854-9
54. Li S, Nemeth I, Donnelly L, et al. Visit-to-visit HbA1c variability is associated with cardiovascular disease and microvascular complications in patients with newly diagnosed type 2 diabetes. Diabetes Care. 2019;43(2):426–432. doi:10.2337/dc19-0823
55. Cardoso CRL, Leite NC, Moram CBM, et al. Long-term visit-to-visit glycemic variability as predictor of micro- and macrovascular complications in patients with type 2 diabetes: the Rio de Janeiro type 2 diabetes cohort study. Cardiovasc Diabetol. 2018;17(1):33. doi:10.1186/s12933-018-0677-0
56. Yang CP, Lin CC, Li CI, et al. Fasting plasma glucose variability and HbA1c are associated with peripheral artery disease risk in type 2 diabetes. Cardiovasc Diabetol. 2020;19(1):4. doi:10.1186/s12933-019-0978-y
57. Pai YW, Lin CH, Lee IT, et al. Variability of fasting plasma glucose and the risk of painful diabetic peripheral neuropathy in patients with type 2 diabetes. Diabetes Metab. 2018;44(2):129–134. doi:10.1016/j.diabet.2018.01.015
58. Yang CP, Li CI, Liu CS, et al. Variability of fasting plasma glucose increased risks of diabetic polyneuropathy in T2DM. Neurology. 2017;88(10):944–951. doi:10.1212/WNL.0000000000003682
59. Song KH, Jeong JS, Kim MK, et al. Discordance in risk factors for the progression of diabetic retinopathy and diabetic nephropathy in patients with type 2 diabetes mellitus. J Diabetes Investig. 2019;10(3):745–752. doi:10.1111/jdi.12953
60. Lee MY, Huang JC, Chen SC, et al. Association of HbA1C variability and renal progression in patients with type 2 diabetes with chronic kidney disease stages 3–4. Int J Mol Sci. 2018;19(12):4116. doi:10.3390/ijms19124116
61. De Cosmo S, Viazzi F, Piscitelli P, et al. Blood pressure status and the incidence of diabetic kidney disease in patients with hypertension and type 2 diabetes. J Hypertens. 2016;34(10):2090–2098. doi:10.1097/HJH.0000000000001045
62. Zhou JJ, Coleman R, Holman RR, et al. Long-term glucose variability and risk of nephropathy complication in UKPDS, ACCORD and VADT trials. Diabetologia. 2020;63(11):2482–2485. doi:10.1007/s00125-020-05273-7
63. da Rosa LCGF, Zajdenverg L, Souto DL, et al. HbA1c variability and long-term glycemic control are linked to diabetic retinopathy and glomerular filtration rate in patients with type 1 diabetes and multiethnic background. J Diabetes Complications. 2019;33(9):610–615. doi:10.1016/j.jdiacomp.2019.05.022
64. Su J, Zhao L, Zhang X, et al. HbA1c variability and diabetic peripheral neuropathy in type 2 diabetic patients. Cardiovasc Diabetol. 2018;17(1):47. doi:10.1186/s12933-018-0693-0
65. Lai Y-R, Chiu W-C, Huang -C-C. HbA1C variability is strongly associated with the severity of peripheral neuropathy in patients with type 2 diabetes. Front Neurosci. 2019;13:90. doi:10.3389/fnins.2019.00090
66. Lee CL, Chen CH, Wu MJ, et al. The variability of glycated hemoglobin is associated with renal function decline in patients with type 2 diabetes. Ther Adv Chronic Dis. 2020;11:2040622319898370. doi:10.1177/2040622319898370
67. Yang CY, Su PF, Hung JY, et al. Comparative predictive ability of visit-to-visit HbA1c variability measures for microvascular disease risk in type 2 diabetes. Cardiovasc Diabetol. 2020;19(1):105. doi:10.1186/s12933-020-01082-9
68. Borg R, Kuenen JC, Carstensen B, et al. Associations between features of glucose exposure and A1C: the A1C-Derived Average Glucose (ADAG) study. Diabetes. 2010;59(7):1585–1590. doi:10.2337/db09-1774
69. Ehehalt S, Wiegand S, Korner A, et al. Low association between fasting and OGTT stimulated glucose levels with HbA1c in overweight children and adolescents. Pediatr Diabetes. 2017;18(8):734–741. doi:10.1111/pedi.12461
70. Ohigashi M, Osugi K, Kusunoki Y, et al. Association of time in range with hemoglobin A1c, glycated albumin and 1,5‐anhydro‐d‐glucitol. J Diabetes Investig. 2021;12(6):940–949. doi:10.1111/jdi.13437
71. Hirsch IB, Welsh JB, Calhoun P, et al. Associations between HbA 1c and continuous glucose monitoring-derived glycaemic variables. Diabet Med. 2019;36(12):1637–1642. doi:10.1111/dme.14065
72. Lu J, Ma X, Zhang L, et al. Glycemic variability modifies the relationship between time in range and hemoglobin A1c estimated from continuous glucose monitoring: a preliminary study. Diabetes Res Clin Pract. 2020;161:108032. doi:10.1016/j.diabres.2020.108032
73. Fang FS, Liu XY, Yan ST, et al. Relationship between time in range and long-term glucose variability in elderly male patients with type 2 diabetes. Chin Gen Pract. 2023;26(16):1979–1983.
74. Tokutsu A, Okada Y, Torimoto K, et al. Relationship between glycemic intraday variations evaluated in continuous glucose monitoring and HbA1c variability in type 2 diabetes: pilot study. Diabetol Metab Syndr. 2021;13(1):45. doi:10.1186/s13098-021-00663-2
75. Tsuchiya T, Saisho Y, Murakami R, et al. Relationship between daily and visit-to-visit glycemic variability in patients with type 2 diabetes. Endocr J. 2020;67(8):877–881. doi:10.1507/endocrj.EJ20-0012
76. Peng HM, Deng HR, Zhou YW, et al. Effect of glucose variability on the relationship between time in range and blood glucose management in patients with type 1 diabetes mellitus. Chin Med J. 2022;102(16):1190–1195.
77. Liu ZG, Yao B, Lin BS, et al. Study on the correlation between blood glucose excursion index and mean amplitude of glucose excursion in self-monitoring of blood glucose. Chin J Diabetes. 2021;13(5):476–481.
 © 2023 The Author(s). This work is published and licensed by Dove Medical Press Limited. The
full terms of this license are available at https://www.dovepress.com/terms
and incorporate the Creative Commons Attribution
- Non Commercial (unported, 3.0) License.
By accessing the work you hereby accept the Terms. Non-commercial uses of the work are permitted
without any further permission from Dove Medical Press Limited, provided the work is properly
attributed. For permission for commercial use of this work, please see paragraphs 4.2 and 5 of our Terms.
© 2023 The Author(s). This work is published and licensed by Dove Medical Press Limited. The
full terms of this license are available at https://www.dovepress.com/terms
and incorporate the Creative Commons Attribution
- Non Commercial (unported, 3.0) License.
By accessing the work you hereby accept the Terms. Non-commercial uses of the work are permitted
without any further permission from Dove Medical Press Limited, provided the work is properly
attributed. For permission for commercial use of this work, please see paragraphs 4.2 and 5 of our Terms.
Recommended articles
Correlation Between Blood Urea Nitrogen and Short- and Long-Term Glycemic Variability in Elderly Patients with Type 2 Diabetes Mellitus Who Were hospitalized:A Retrospective Study
Huang L, Wang Z, Pan Y, Zhou K, Zhong S
Diabetes, Metabolic Syndrome and Obesity 2024, 17:1973-1986
Published Date: 8 May 2024