")
Back to Journals » ClinicoEconomics and Outcomes Research » Volume 14
Correlates of Price Transparency for Healthcare Services in United States Hospitals
Authors Younessi DN , Lin JC, Greenberg PB, French DD
Received 15 June 2022
Accepted for publication 31 August 2022
Published 9 September 2022 Volume 2022:14 Pages 601—606
DOI https://doi.org/10.2147/CEOR.S378475
Checked for plagiarism Yes
Review by Single anonymous peer review
Peer reviewer comments 2
Editor who approved publication: Professor Giorgio Colombo
David N Younessi,1 John C Lin,2 Paul B Greenberg,3,4 Dustin D French5– 7
1Feinberg School of Medicine, Northwestern University, Chicago, IL, USA; 2Division of Biology and Medicine, Brown University, Providence, RI, USA; 3Division of Ophthalmology, Alpert Medical School, Brown University, Providence, RI, USA; 4Section of Ophthalmology, Providence VA Medical Center, Providence, RI, USA; 5Departments of Ophthalmology and Medical Social Sciences, Feinberg School of Medicine, Northwestern University, Chicago, IL, USA; 6Center for Health Services and Outcomes Research, Feinberg School of Medicine, Northwestern University, Chicago, IL, USA; 7Veterans Affairs Health Services Research and Development Service, Chicago, IL, USA
Correspondence: David N Younessi, Feinberg School of Medicine, Northwestern University, 303 E Chicago Ave, Suite 1-003, Chicago, IL, 60611, USA, Tel +1 312-503-0440, Email [email protected]
Purpose: The purpose of this study is to investigate demographic and hospital characteristics that predict hospital price transparency in the United States.
Methods: We identified 6214 hospitals and extracted characteristics of each using the American Hospital Association Annual Survey, as well as cash prices for a representative selection of commonly performed procedures and visits from the Turquoise Health dataset. Descriptive statistics were used to determine compliance rates and price variation, and a Poisson regression model was used to calculate incidence rate ratios (IRR) and 95% confidence intervals (CI) for predictors of price transparency.
Results: Price transparency compliance ranged from 13% to 49% of hospitals, and across-center ratios ranged from 244.8 to 4789.0. Number of hospital beds was marginally associated with price transparency for more services (IRR: 1.01 [95% CI: 1.01– 1.02]); in contrast, location in the Southern (IRR: 0.91 [95% CI: 0.87– 0.96]) or Western (IRR: 0.94 [95% CI: 0.90– 0.99]) regions of the US was associated with transparency for fewer services.
Conclusion: Smaller hospitals as well as those located in the South and West regions were less likely to be compliant with the CMS mandate for price transparency for hospital standard charges. Additionally, the poor usability of price transparency directories on hospital websites limits information access and undermines transparency efforts.
Keywords: price transparency, health policy, health economics, health equity
Introduction
Uninsured and underinsured patients regularly pay out-of-pocket prices that significantly exceed the reimbursement rates set by private insurance companies and public payers like the United States (US) Medicare and Medicaid Services (CMS).1,2 Overall healthcare costs in the US are considerably higher than in other high-income countries, including both privately- and publicly-insured patients.3 Several health economists have proposed requiring hospitals to publicly disclose prices, thus promoting competition and allowing patients to “shop” for cheaper care.4
In 2019, CMS required hospitals to publish their “standard charges” for their services in online chargemasters (comprehensive lists of prices for all hospital procedures and services).5 However, the ensuing publication of these chargemasters—with thousands of items and services often described by confusing abbreviations—spurred criticism from patients, providers, hospitals, and politicians.6 On January 1, 2021, CMS required the disclosure of gross (non-discounted) charges, cash (discounted) charges for patients paying entirely out-of-pocket without insurance, payer-specific negotiated charges, and de-identified minimum and maximum negotiated charges for at least 300 shoppable services.5 Due to continued criticism, CMS implemented new regulations on January 1, 2022 to increase the maximum penalty for noncompliance and outlaw hospital barriers to patient access.7 However, studies across several medical specialties suggest that many hospitals are not yet in compliance with the CMS mandate.1,2 Overall, there is limited information regarding the correlates of price transparency.8
The purpose of this paper is to identify demographic and hospital characteristics that predict price transparency at any given US hospital.
Methods
The Northwestern University Institutional Review Board determined that this study was not human subjects research. All data acquisition complied with relevant data protection and privacy regulations. We did not access any individual patient data for our analysis.
We identified 6214 hospitals using the American Hospital Association database.9 Hospitals associated with the US Department of Veterans Affairs and Department of Defense were excluded from our analysis due to their unique payment models. We identified several characteristics of each hospital using the American Hospital Association (AHA) Annual Survey: zip code, region, number of hospital beds, procedure volume, personnel numbers, hospital net income, and hospital ownership (private, non-profit, government).9 Hospital region was determined using US Census Bureau regional classifications.10 Urban-rural classification was determined using the Rural-Urban Commuting Area Codes (RUCA) database from the US Department of Agriculture.11
Out-of-pocket prices for a selection of commonly performed procedures and office visits (Table 1) were extracted from the Turquoise Health dataset,12 a public-use continuously updated dataset of list prices for all billable services at hospitals and health centers nationwide. Of note, no individual patient data is accessible through this dataset and there is no relationship between Turquoise Health and the AHA. The 14 billable services were selected due to their high volume of usage and representation across various medical fields and encounter levels. These figures were verified with hospital chargemasters for accuracy. Duplicate entries were removed from the database. If a discrepancy was identified, the value was corrected to match the hospital chargemaster. “Out-of-pocket” comprises both “cash price” and “self-pay” descriptors in the database.
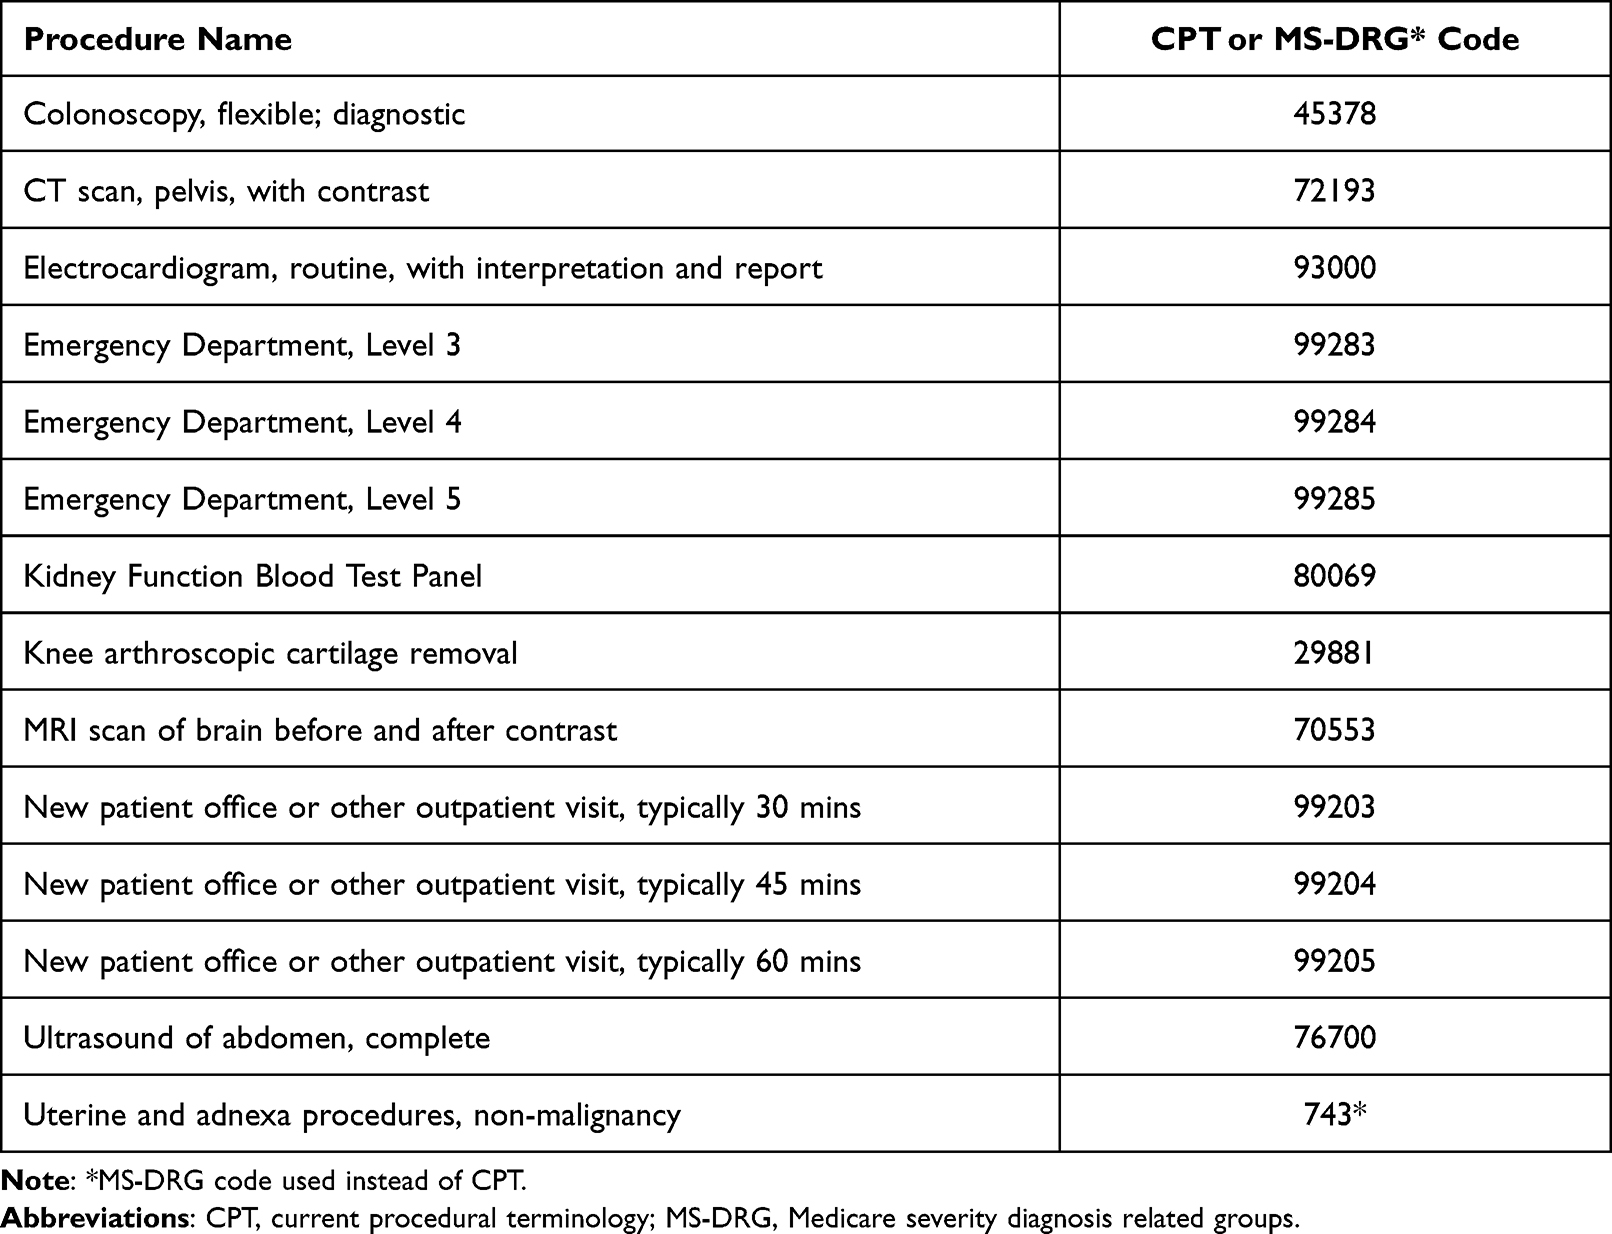 |
Table 1 Selection of Commonly Performed Procedures and Office Visits |
We conducted all statistical analyses in Stata using alpha=0.05. Descriptive statistics were used to determine compliance rates and price variation for each service. We calculated the across-center ratio as the maximum price for a service divided by the minimum price. Our primary outcome was price transparency for the 14 selected services, which served as proxies for healthcare services in the US. We used a Poisson regression model to calculate incidence rate ratios (IRR) and 95% confidence intervals (CI) for predictors of price transparency for 14 billable services.
Results
A total of 3873 hospitals (62%) reported prices for at least one of the selected healthcare services; most were acute care (2371; 61%) or critical access (877; 23%) hospitals. There were 1460 (38%) hospitals in the South, 1175 (30%) in the Midwest, 749 (19%) in the West, and 489 (13%) in the Northeast. Not all hospitals reported providing the same services.
Compliance with CMS mandates ranged from 13% of hospitals for routine electrocardiograms to 49% of hospitals for complete abdominal ultrasounds. Across-center ratios ranged from 244.8 for Level 3 Emergency Department Encounters to 4789.0 for Kidney Function Blood Test Panels, indicating considerable variation in cash prices for the same service across the country (Table 2).
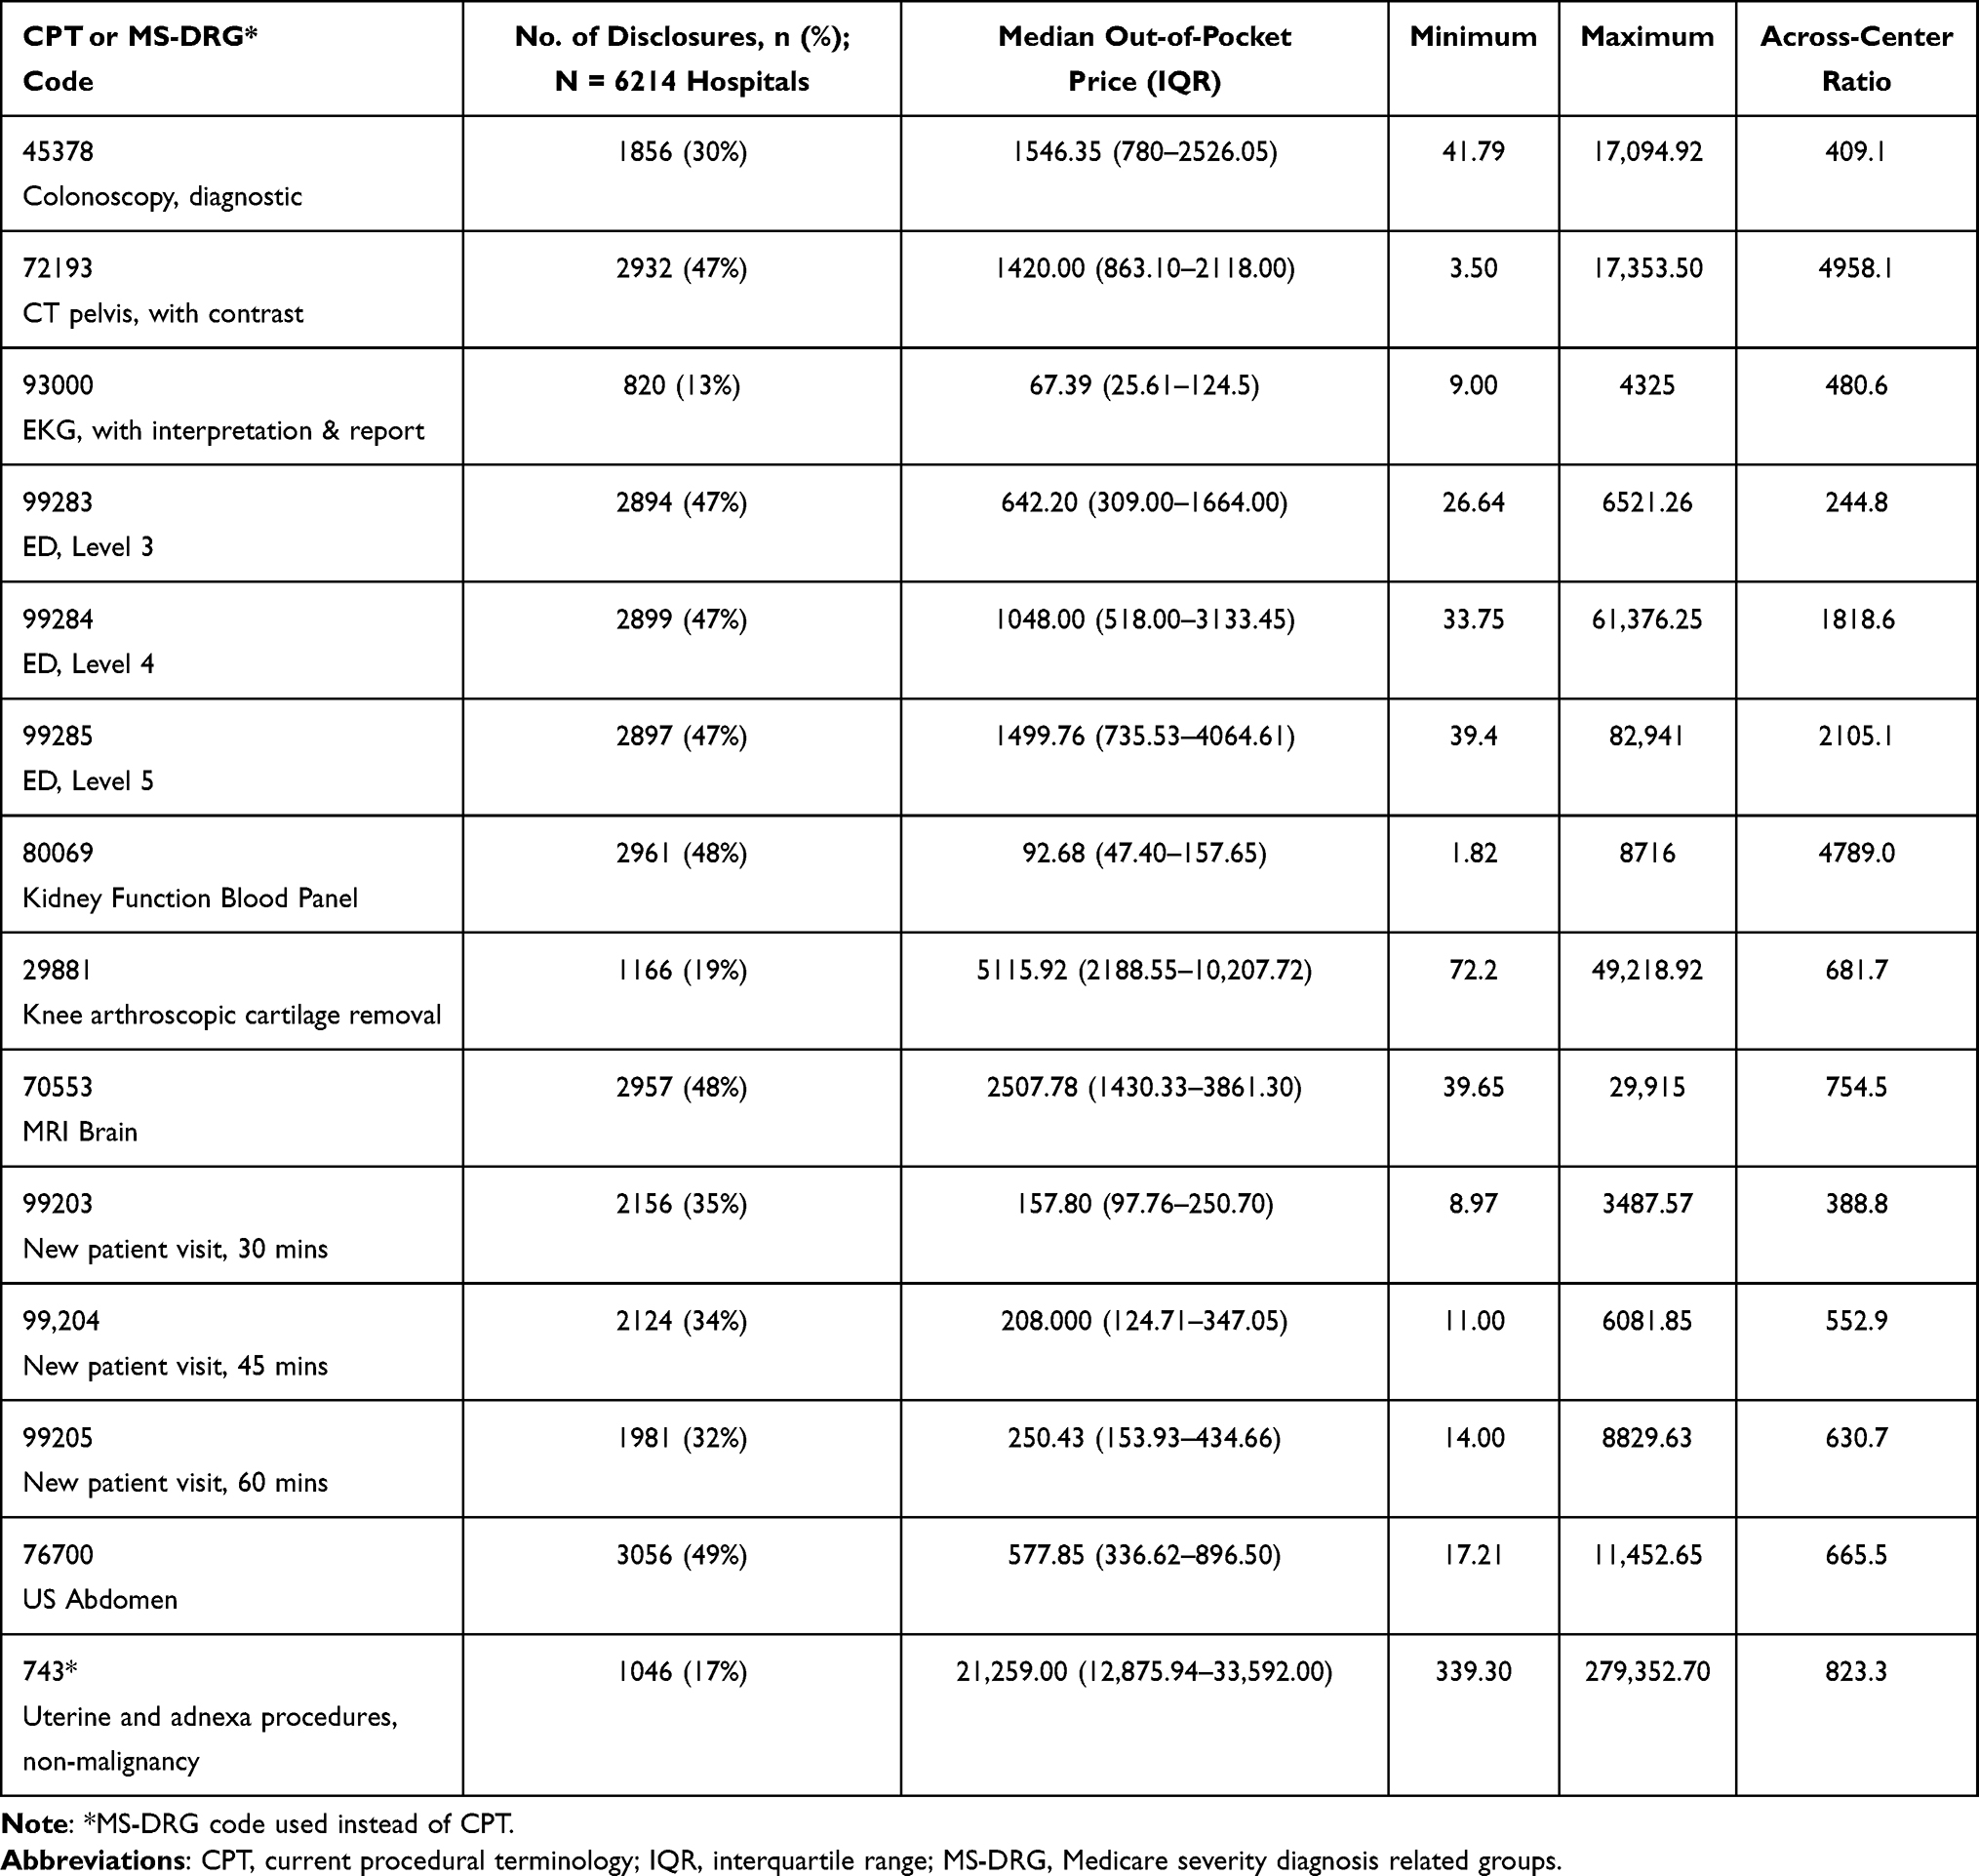 |
Table 2 Cash Prices, Transparency, and Variation for 14 Shoppable Services |
Several characteristics contributed to the prediction of price transparency for healthcare services in regression analysis (Table 3). After adjustment, number of hospital beds was marginally associated with price transparency for more services (IRR: 1.01 (95% CI: 1.01–1.02)); in contrast, location in the Southern (IRR: 0.91 (95% CI: 0.87–0.96)) or Western (IRR: 0.94 (95% CI: 0.90–0.99)) regions of the US was associated with transparency for fewer services. Number of surgical operations, full-time physicians and dentists, and net income were collinear with number of hospital beds and dropped after sensitivity analysis (Table 4).
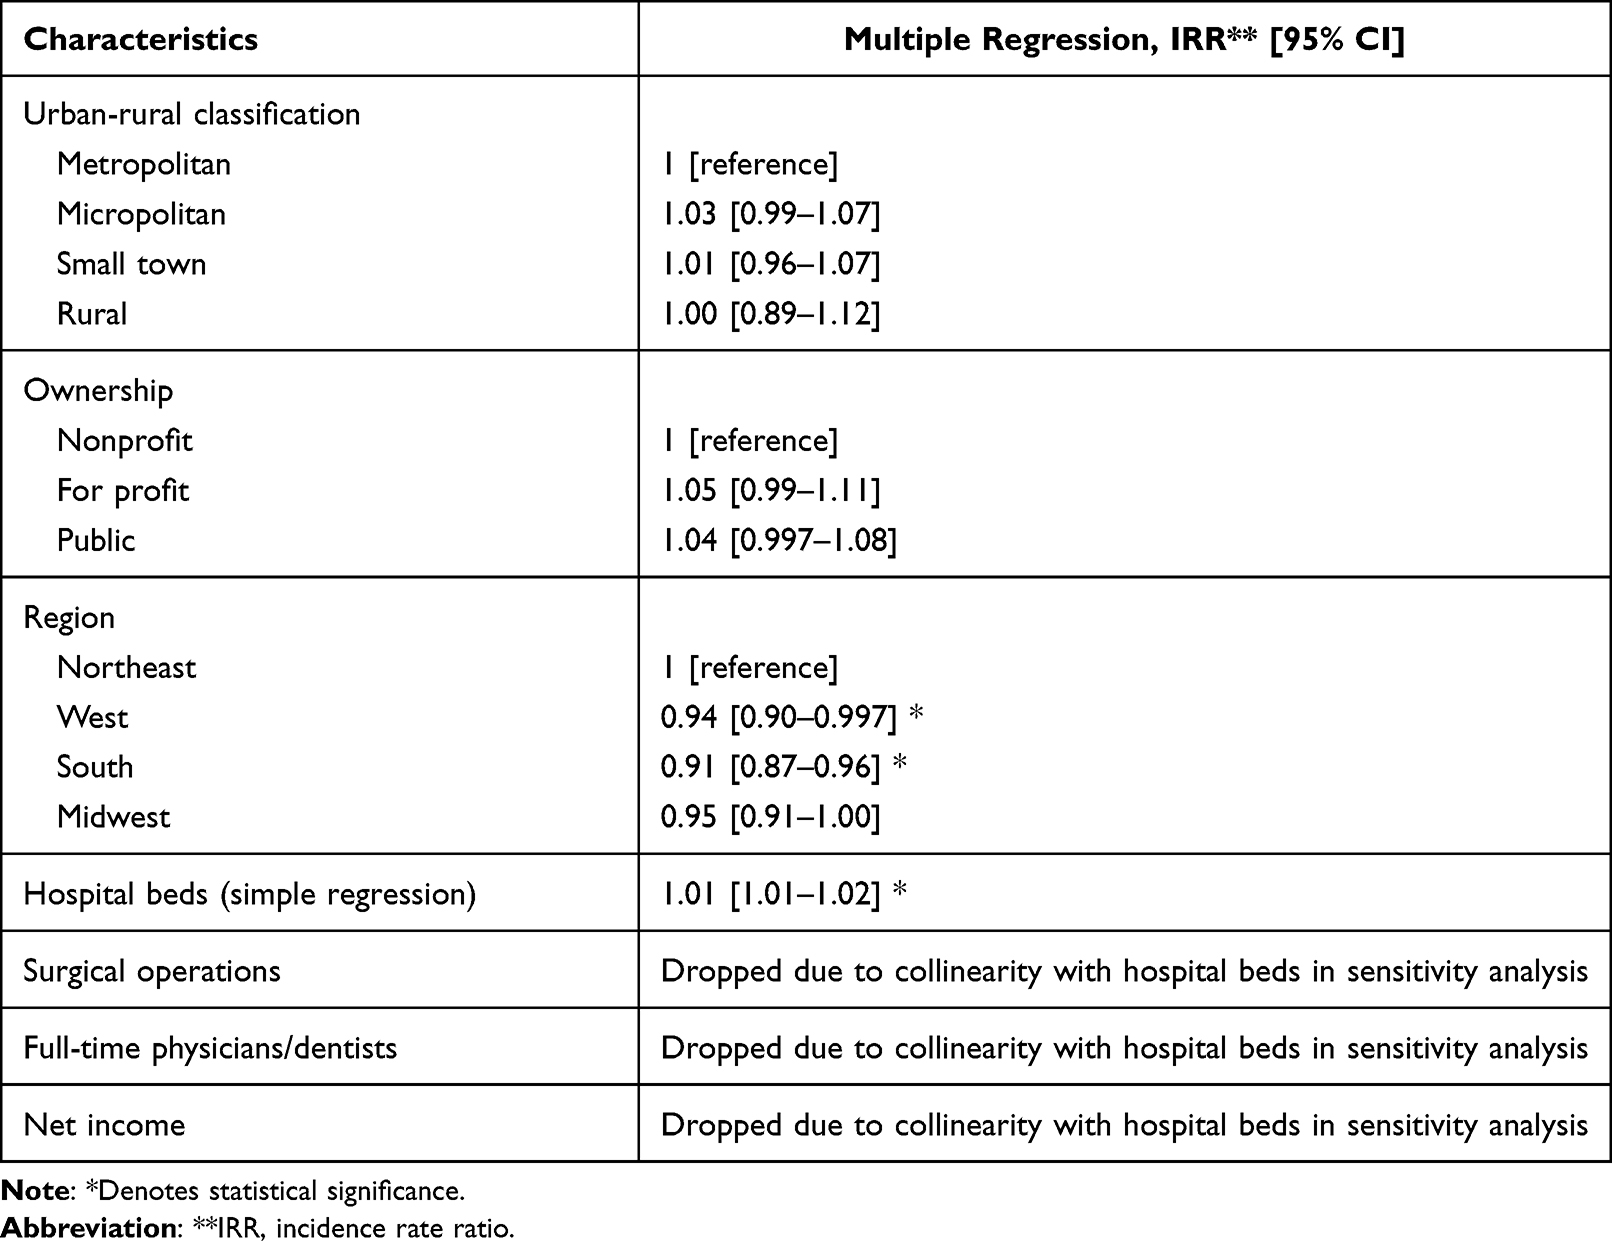 |
Table 3 Predictors of Price Transparency in Poisson Regression Analysis |
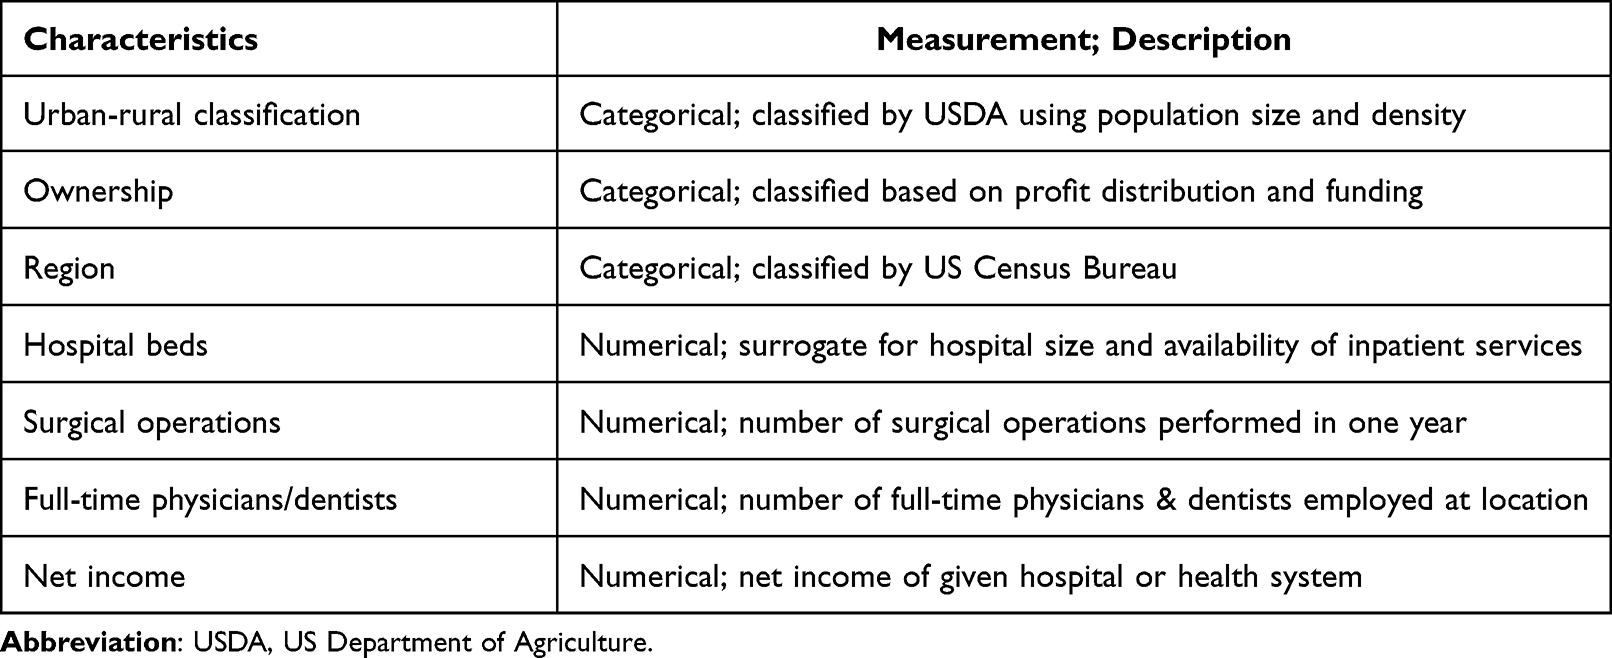 |
Table 4 Variable Descriptive Analysis |
Discussion
The findings of this study shine light on the poor state of price transparency for healthcare services throughout various specialties in hospitals across the US and elucidate pertinent relationships between hospital characteristics and price transparency. Overall, most hospitals remained noncompliant with the CMS price transparency mandate for these 14 commonly performed procedures and office visits, even after the CMS increased the maximum penalty for noncompliance on January 1, 2022.7 No billable event included in this study was associated with a compliance rate of 50% or greater, and most fell well below this rate.
Having fewer hospital beds was associated with a higher risk of noncompliance with the CMS mandate. Hospital advocates argued that smaller hospitals would face difficulties in creating price transparency programs.7 In response, the CMS developed a sliding scale of financial penalties for noncompliance ranging from $300 to $5500 based on hospital bed count, which serves as a proxy for hospital size.7 It is unclear whether the lower rate of price transparency among smaller hospitals was due to the reduced penalty for noncompliance or greater difficulty in posting prices due to limited resources and personnel. Moreover, smaller hospitals are often unable to offer comparable pricing to larger hospitals due to economies of scale,13 and thus may be less keen to advertise their prices.
There was also significant regional variation in price transparency. Hospitals in the Southern and Western regions had a lower rate of compliance relative to those in other regions. Across-center ratios of maximum to minimum prices for a given procedure demonstrated significant variability across hospitals, with an average of 1378.8 among all studied CPT codes. Decreased levels of transparency compliance in these regions may be explained by a higher average travel time to the nearest hospital in these regions compared to the reference.14 When a hospital has less competition in its area, there may be decreased incentive to disclose pricing as there is less impetus for patients to engage in price shopping.15 There may also be regional differences in profit-seeking behavior and supply-side efficiency.16
Procuring list prices from hospital chargemasters was often a tedious task, even when facilitated by the authors’ familiarity with billing terminology and hospital informatics. To find these prices, patients must be able to navigate multiple hospital websites, find the correct chargemaster listed on each site, seek the relevant data, and understand billing terminology. As this process often requires several steps on an array of complex and variable websites, many patients may give up on their search for information. Thus, the current CMS legislation’s efforts at price transparency fall short of its aim to provide patients with the necessary information to make informed care decisions.17 Future regulations should consider creating a single patient-friendly, CMS-operated website and requiring direct hospital submission of prices to CMS; this would allow CMS to more effectively track and penalize noncompliance and help patients access prices more smoothly.
This study has several limitations. Its findings may not be generalizable to other healthcare services, although the selected services are among the most common ones billed in the US. Also, pricing variation was calculated based on available pricing data and may not extrapolate to hospitals that are noncompliant with the transparency mandate. In terms of data analysis, the across-center ratio is more indicative of national price ranges than it is average inter-facility disparities. Finally, it is possible that hospitals misreport standard charges on their chargemaster. This would not only alter our conclusions, but also undermine the goal of the transparency mandate.
Conclusion
Smaller hospitals and those located in the South and West regions were less likely to be compliant with the CMS mandate for price transparency for standard hospital charges. Additionally, the poor usability of price transparency directories on hospital websites limits information access and serves to negate transparency efforts. Considering that variable financial burdens can be potent drivers of health disparities, the CMS mandate has not brought us closer to health equity from the standpoint of the patient.
Acknowledgments
The views expressed in this article are those of the authors and do not necessarily reflect the position or policy of the Department of Veterans Affairs or the United States government (French, Greenberg).
Author Contributions
All authors made a significant contribution to the work reported, whether that is in the conception, study design, execution, acquisition of data, analysis and interpretation, or in all these areas; took part in drafting, revising or critically reviewing the article; gave final approval of the version to be published; have agreed on the journal to which the article has been submitted; and agree to be accountable for all aspects of the work.
Funding
Research to Prevent Blindness, NY, NY supported design and conduct of the study; collection, and management.
Disclosure
Dr. French is supported by an unrestricted grant from Research to Prevent Blindness, NY, NY. The authors report no other conflicts of interest in this work.
References
1. Xiao R, Miller LE, Workman AD, Bartholomew RA, Xu LJ, Rathi VK. Analysis of price transparency for oncologic surgery among national cancer institute–designated cancer centers in 2020. JAMA Surg. 2021;156(6):582–585. doi:10.1001/jamasurg.2021.0590
2. Xiao R, Rathi VK, Gross CP, Ross JS, Sethi RKV. Payer-negotiated prices in the diagnosis and management of thyroid cancer in 2021. JAMA. 2021;326(2):184–185. doi:10.1001/jama.2021.8535
3. Papanicolas I, Woskie LR, Jha AK. Health care spending in the United States and other high-income countries. JAMA. 2018;319(10):1024–1039. doi:10.1001/jama.2018.1150
4. Reinhardt UE. The disruptive innovation of price transparency in health care. JAMA. 2013;310(18):1927–1928. doi:10.1001/jama.2013.281854
5. Wheeler C, Taylor R. New year, new CMS price transparency rule for hospitals. Health Affairs Blog; 2021. Avialable from: https://www.healthaffairs.org/do/10.1377/forefront.20210112.545531/.
6. Pear R. Hospitals must now post prices. But it may take a brain surgeon to decipher them. New York Times; 2019.
7. Centers for Medicare & Medicaid Services. Medicare program: hospital outpatient prospective payment and ambulatory surgical center payment systems and quality reporting programs; price transparency of hospital standard charges; radiation oncology model. Fed Regist. 2021;86(218):63458–63998.
8. Lin JC, Ghauri SY, French DD, Scott IU, Greenberg PB. Predictors of price transparency for cataract surgery and laser posterior capsulotomy at academic hospitals in the United States. R I Med J. 2022;105(2):43–45.
9. American hospital association annual survey database. American Hospital Association; 2022. Avialable from: www.ahadata.com/aha-annual-survey-database.
10. Census regions and divisions of the United States. US Census Bureau; 2020. Available from: www2.census.gov/geo/pdfs/maps-data/maps/reference/us_regdiv.pdf.
11. Rural-Urban commuting area codes. USDA Economic Research Service; 2019. Available from: www.ers.usda.gov/data-products/rural-urban-commuting-area-codes.aspx.
12. Price transparency data for researchers. Turquoise Health. Available from: https://turquoise.health/researchers.
13. Freeman M, Savva N, Scholtes S. Economies of scale and scope in hospitals: an empirical study of volume spillovers. Manage Sci. 2021;67(2):673–697. doi:10.1287/mnsc.2019.3572
14. Lam O, Broderick B, Toor S. How Far Americans live from the closest hospital differs by community type. Pew Research Center; 2018. Available from: https://www.pewresearch.org/fact-tank/2018/12/12/how-far-americans-live-from-the-closest-hospital-differs-by-community-type/.
15. Mobley LR. Estimating hospital market pricing: an equilibrium approach using spatial econometrics. Reg Sci Urban Econ. 2003;33(4):489–516. doi:10.1016/S0166-0462(02)00059-5
16. Obirieze AC, Gaskin DJ, Villegas CV, et al. Regional variations in cost of trauma care in the United States: who is paying more? J Trauma Acute Care Surg. 2012;73(2):516–522. doi:10.1097/TA.0b013e31825132a0
17. Centers for Medicare & Medicaid Services. Medicare and Medicaid programs: CY 2020 hospital outpatient PPS policy changes and payment rates and ambulatory surgical center payment system policy changes and payment rates. price transparency requirements for hospitals to make standard charges public. Fed Regist. 2019;84(229):65524–65606.
 © 2022 The Author(s). This work is published and licensed by Dove Medical Press Limited. The full terms of this license are available at https://www.dovepress.com/terms.php and incorporate the Creative Commons Attribution - Non Commercial (unported, v3.0) License.
By accessing the work you hereby accept the Terms. Non-commercial uses of the work are permitted without any further permission from Dove Medical Press Limited, provided the work is properly attributed. For permission for commercial use of this work, please see paragraphs 4.2 and 5 of our Terms.
© 2022 The Author(s). This work is published and licensed by Dove Medical Press Limited. The full terms of this license are available at https://www.dovepress.com/terms.php and incorporate the Creative Commons Attribution - Non Commercial (unported, v3.0) License.
By accessing the work you hereby accept the Terms. Non-commercial uses of the work are permitted without any further permission from Dove Medical Press Limited, provided the work is properly attributed. For permission for commercial use of this work, please see paragraphs 4.2 and 5 of our Terms.