")
Back to Journals » Cancer Management and Research » Volume 10
Coordination of FOXA2 and SIRT6 suppresses the hepatocellular carcinoma progression through ZEB2 inhibition
Authors Liu J, Yu Z, Xiao Y, Meng Q, Wang Y, Chang W
Received 1 September 2017
Accepted for publication 27 November 2017
Published 1 March 2018 Volume 2018:10 Pages 391—402
DOI https://doi.org/10.2147/CMAR.S150552
Checked for plagiarism Yes
Review by Single anonymous peer review
Peer reviewer comments 3
Editor who approved publication: Dr Kenan Onel
Jinghua Liu,1 Zhen Yu,2 Yuanyuan Xiao,2 Qiong Meng,2 Yeying Wang,2 Wei Chang2
1Department of Gastroenterology and Hepatology, The 4th Affiliated Hospital of Kunming Medical University, 2School of Public Health, Kunming Medical University, Kunming, China
Background: The Forkhead transcription family member FOXA2 plays a fundamental role in hepatocellular carcinoma (HCC) progression, but the precise interaction factor and molecular regulation of FOXA2 are not fully understood.
Objective: In this study, we found that FOXA2 could interact with sirtuin 6 (SIRT6) directly in vivo and in vitro. We explored that the expressions of FOXA2 and SIRT6 were significantly downregulated in human HCC and HCC cell lines.
Methods: Functionally, cell counting kit-8 assay and Transwell® assay were performed; we demonstrated that the knockdown of FOXA2 and SIRT6 promoted HepG2 cells and Huh7 cells proliferation and invasion in vitro.
Results: Mechanically, using luciferase reporter assay and fast chromatin immunoprecipitation assay, we showed that FOXA2 and SIRT6 regulated the expression of ZEB2 from transcription level. ZEB2 suppression was involved in the anti-oncogenesis effect of FOXA2 and SIRT6. The negative correlation between the expressions of ZEB2 and FOXA2 or SIRT6 was observed in the tissues of HCC patients.
Conclusion: Our findings indicated that the coordination function of FOXA2 and SIRT6 played a critical role in HCC progression and may serve as potential drug candidates for HCC.
Keywords: FOXA2, SIRT6, ZEB2, proliferation, invasion
Introduction
Hepatocellular carcinoma (HCC) is a major histological subtype of primary liver cancers and a malignant tumor with high morbidity and mortality.1,2 In addition, most patients with advanced HCC still have poor prognosis; although in the past decades great efforts have been made to improve the treatment of HCC, late diagnosis and lack of effective treatment are still the main reasons for cancer-related death.3 Therefore, it is necessary to understand the precise mechanisms of HCC for the early diagnosis and identify specific biomarkers as well as novel therapeutic targets for the treatment of the disease.
Sirtuin 6 (SIRT6) is a family of (nicotinamide adenine dinucleotide)+-dependent deacylases and has been reported to negatively regulate cellular senescence.4 The expression of SIRT6 in HCC cells is lower than that in primary human hepatocytes.5 SIRT6 has been reported to regulate glucose homeostasis in the liver.6 The overexpression of SIRT6 could inhibit the phosphorylation of extracellular signal-regulated kinases 1/2 and thus attenuate the tumor-suppressive effect in HCC.7
The mammalian Forkhead transcription factor FOXA2 is a member of the forkhead transcription factor family, which is a key regulator of cell proliferation and hepatic energy metabolism.8,9 The abnormal expression of FOXA2 leads to the development of a number of cancers.10,11 More recently, the loss of FOXA2 could promote epithelial–mesenchymal transition (EMT) and could promote metastasis of pancreatic cancer through the regulation of E-cadherin.12 Exogenous reexpression of FOXA2 inhibits HCC cells invasion through suppression of matrix metalloproteinase-9 (MMP-9),13 which indicates the suppression role of FOXA2 in the metastasis of HCC. However, whether FOXA2 has other potential target genes or interaction factors in HCC still needs further investigation.
Material and methods
Cell culture and reagents
Human HCC cell lines HepG2 and Huh7 were purchased from American Type Culture Collection (Manassas, VA, USA). The immortalized normal liver epithelial cells L02 were purchased from Cell Bank of Chinese Academy of Sciences (Shanghai, China). The above cells were cultured in DMEM containing 10% fetal bovine serum (FBS; Gibco, Grand Island, NY, USA) with 100 U/mL penicillin and 0.1 mg/mL streptomycin (Invitrogen, Frederick, MD, USA) at 37°C in a humidified chamber with 5% CO2.
Cell transfection
The HCC cells were seeded into plates and infected with the relative lentiviral particles in DMEM containing 8 μg/mL polybrene (Invitrogen); 24 hours after incubation, the medium containing lentivirus was changed to DMEM, to allow the cell growth to 100% density. Puromycin (Sigma-Aldrich Co., St Louis, MO, USA) at 2 μg/mL was added to each well to select transfection cells.
Ethics statement and tissues samples
We recruited 50 cases of HCC tissues in this study, and 20 cases of adjacent nontumor liver tissues were used as control. Tissues used were obtained from patients with written informed consent. The study protocols were approved by the Second People’s Hospital of Yunnan. HCC tissues and surrounding nontumor hepatic tissues were obtained from patients who had undergone curative resection for primary HCC from 2010 to 2013. The tissues were partly snap-frozen in liquid nitrogen and stored at −80°C immediately after hepatectomy.
RNA isolation and reverse transcription-quantitative polymerase chain reaction (RT-qPCR)
Total RNA was extracted using TRIzol reagent (Invitrogen). cDNA was prepared from total RNA using an iScript cDNA Synthesis Kit (Bio-Rad Laboratories, Stanford, CA, USA). RT-qPCR was done on the LightCyclerH according to the manufacture’s recommendation (Roche Diagnostics, Penzberg, Germany). SYBR Green was used as a fluorescent dye to determine the amplified PCR product. The relative gene expression was calculated by using GeNorm software using GAPDH as reference genes. The primer sequences were as follows: SIRT6, sense 5-CATGGAGGAGCGAGGTCT-3 and antisense 5-GCGTCTTACACTTGGCACA-3; FOXA2, sense 5-TGGAGCAGCTACTATGCAG-3 and antisense 5-CGTGTTCATGCCGTTCATC-3; and GAPDH, sense 5-TCATTGACCTCAACTACATGGTTT-3 and antisense 5-GAAGATGGTGATGGGATTTC-3. For chromatin immunoprecipitation (ChIP) assay, the following primer sequences were used: ZEB2, sense 5'-TAAAGAATGCCCCTATGC-3' and antisense 5'-GGGACACCCTGACTAAAA-3'.
Western blotting
Cell lysates were lysed by radio immunoprecipitation assay (RIPA) lysis buffer, and total protein was extracted; 30 μg extracts were denaturated at 95°C for 5 minutes and separated on 10% sodium dodecyl sulfate-polyacrylamide gel electrophoresis (SDS-PAGE) and then transferred to polyvinylidene fluoride membranes (Millipore, Billerica, MA, USA). Nonspecific binding sites were blocked using Rotiblock (Roth, Germany) in 1× Tris-buffered saline with Tween-20 (TBST) buffer (Millipore). The membranes were incubated with primary antibodies such as FOXA2 (sc-6554; Santa Cruz Biotechnology, Inc., Santa Cruz, CA, USA), SIRT6 (sc-517196), and anti-β-actin (#8457; Cell Signaling Technology, Danvers, MA, USA) at 4°C overnight. After washed with TBST for 5 minutes, the membranes were incubated with horseradish peroxidase-conjugated secondary antibodies (Santa Cruz Biotechnology, Inc.) for 1 hour at room temperature. Immunoreactive protein was visualized by using a chemiluminescence reagent kit (NEN, Dreieich, Germany) according to the manufacturer’s instructions.
Cell proliferation assay
Cell counting kit-8 (CCK-8; Dojindo Laboratories, Kumamoto, Japan) assay was used for cell proliferation. The relative cells were seeded into 96-well plates and cultured overnight to allow for attachment. After the cells were serum-starved for 8 hours, FBS was added into medium. At 0, 12, 24, 36, and 48 hours, 10 μL CCK-8 solution was added to the cells, and the mixture was incubated for 2 hours. The optical density was analyzed at 450 nm (Tecan Ultra 384 reader; Tecan, Zürich, Switzerland). All the experiments were performed at least three times.
Cell invasion assay
The invasion of cells was performed using Transwell® chambers (Corning® 3422; Corning Inc., Corning, NY, USA). The filters were precoated with Matrigel™ from BD Biosciences (San Jose, CA, USA). Following the indicated treatment, the cells (5×10⁵ cells/200 µL) were seeded in the upper chamber with serum-free medium. The bottom chamber was filled with 1000 μL DMEM containing 10% FBS; 24 hours after invasion, nonmigrating cells were removed with a swab, and migrating cells on the bottom surface of the membranes were fixed with 4% paraformaldehyde for 30 minutes, stained with 0.1% crystal violet for 20 minutes, and counted under a microscope (Leica DM 5000 B; Leica Microsystems, Wetzlar, Germany) in five randomly selected fields; each experiment was repeated at least three times.
Coimmunoprecipitation
The cells were lysed in RIPA buffers with cOmplete™ protease inhibitors (Sigma-Aldrich Co.). The relative antibodies were added to the buffer at 4°C overnight; 50 μL protein G magnetic beads (Invitrogen) were prerinsed with 200 μL antibody binding buffer. After removal of the supernatant, the beads were collected and incubated with the antibody complex via vortexing for 30 minutes. The supernatant was removed, and the antibody–protein–beads complex was washed by using 200 μL RIPA buffer for three times. The antibody–protein–beads complex was gently resuspended with 20 μL elution buffer and subjected to SDS-PAGE followed by Western blot analysis.
Luciferase reporter assay
A luciferase reporter assay was performed to detect the direct binding of FOXA2 or SIRT6 to target genes. The 2.1-kb DNA fragment upstream of the translation start of the ZEB2 was cloned into the pMIR-REPORT™ vector (Ambion®, Austin, TX, USA) to form a wild-type luciferase reporter vector (ZEB2-WT). To verify the binding specificity, the putative binding sites (CACCT) were altered to GGACC using a site-directed mutagenesis PCR with the KAPA HiFi DNA polymerase (Peqlab Biotechnologie GmbH, Erlangen, Germany) and also inserted into pMIR-REPORT vector to generate a mutated luciferase reporter vector (ZEB2-Mut). The cells were plated into 96-well plates and transiently cotransfected with luciferase reporter vectors with relative plasmid or siRNAs using Lipofectamine® 2000; 48 hours after transfection, the relative luciferase activity was measured by using a Dual-Luciferase® Reporter Assay System (Promega Corp., Madison, WI, USA) and analyzed using a 96-well plate luminometer immediately (Berthold Detection System, Pforzheim, Germany). The luciferase activity was normalized to that of Renilla luciferase activity.
Statistical analysis
Statistical analysis was performed by using SPSS 17.0 software (IBM Corporation, Armonk, NY, USA). Data were expressed as the mean ± standard error. Student’s t-test and one-way analysis of variance were used to determine the statistical differences. P<0.05 was considered statistically significant.
Results
FOXA2 interacts with SIRT6 directly in vivo and in vitro
As known, the FOXA2 transcription factor is an essential player in HCC progression; however, the coregulation factor of FOXA2 is not completely understood. As van Gent et al14 reported, SIRT1, which was the most studied member of the sirtuin family, could interact with FOXA2 in vivo. We decided to detect whether other members (SIRT2–SIRT7) also interact with FOXA2. Coimmunoprecipitation was performed in HepG2 and Huh7 cells. Interestingly, only SIRT6 could interact with FOXA2 in vivo (Figure 1A and B). To further examine the SIRT6–FOXA2 interaction in vitro, glutathione-S-transferase (GST) pull-down assay was carried out to analyze the molecular details involved in this interaction. First, GST-fused FOXA2 construct was used and incubated with the in vitro transcribed/translated SIRT6; GST vector was used as a negative control. As shown in Figure 1C, the binding of FOXA2 with SIRT6 was observed. The above data indicated that FOXA2 interacted with SIRT6 directly in vivo and in vitro. Furthermore, we examined the in vivo interaction between FOXA2 and the other members of the SIRT family, such as SIRT1, SIRT5, and SIRT7. To our surprise, only SIRT6 could interact with FOXA2.
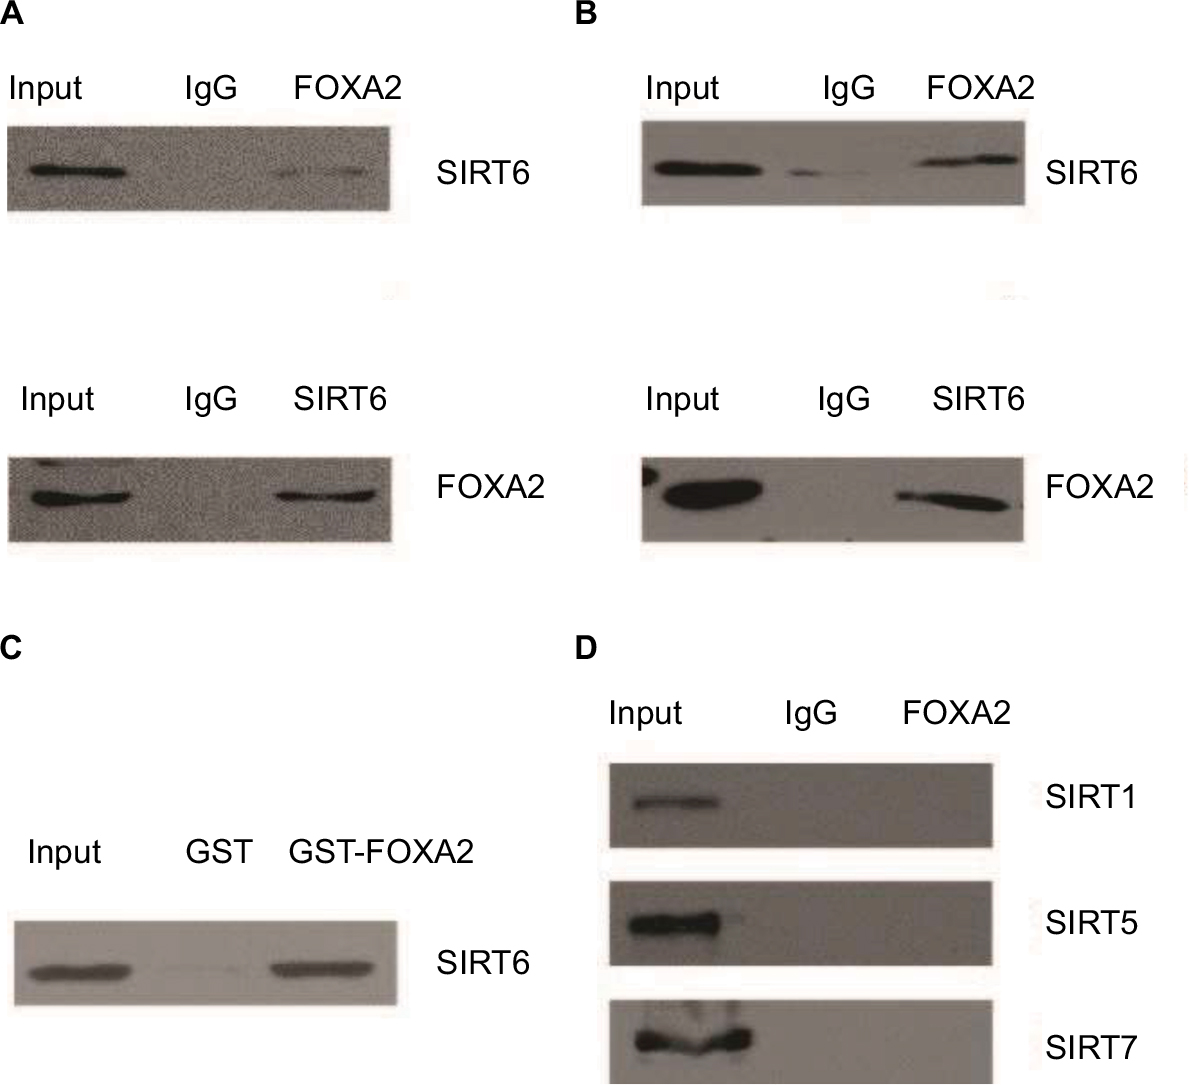 | Figure 1 FOXA2 interacts with SIRT6 directly in vivo and in vitro. Notes: (A) Total proteins from HepG2 cells were extracted, and coimmunoprecipitation experiments were performed, IP with antibodies against FOXA2 followed by IB with antibodies against SIRT6 or IP with SIRT6 followed by IB with FOXA2. (B) The relative co-immunoprecipitation experiments were performed in Huh7 cells. (C) GST pull-down assays were performed with the GST-fused FOXA2 protein and in vitro transcribed/translated SIRT6. (D) Total proteins from HepG2 cells were extracted, and coimmunoprecipitation experiments were performed, IP with antibodies against FOXA2 followed by IB with antibodies against SIRT1, SIRT5, or SIRT7. Abbreviations: GST, glutathione-S-transferase; IB, immunoblotting; IP, immunoprecipitation; SIRT, sirtuin. |
FOXA2 and SIRT6 are downregulated in human HCC and cell lines
In order to investigate the potential role of FOXA2 and SIRT6 in human HCC, we checked the expression profile of FOXA2 and SIRT6 in HCC tissues and cell lines. The mRNA levels of FOXA2 (Figure 2A) and SIRT6 (Figure 2B) were significantly downregulated in human HCC tissues compared with the normal adjacent tissues, which indicated that FOXA2 and SIRT6 might have a role in the HCC progression. Furthermore, we compared the levels of FOXA2 and SIRT6 in immortalized normal liver epithelial cells L02 and five HCC cell lines (HepG2, Huh7, Hep3B, SK-HEP-1, and PLC/PRF5) by RT-qPCR. The results indicated that the mRNA levels of FOXA2 and SIRT6 were lower in HCC cells than in the normal hepatocytes cells (Figure 2C and D). In summary, FOXA2 and SIRT6 were downregulated in human HCC tissues and cell lines.
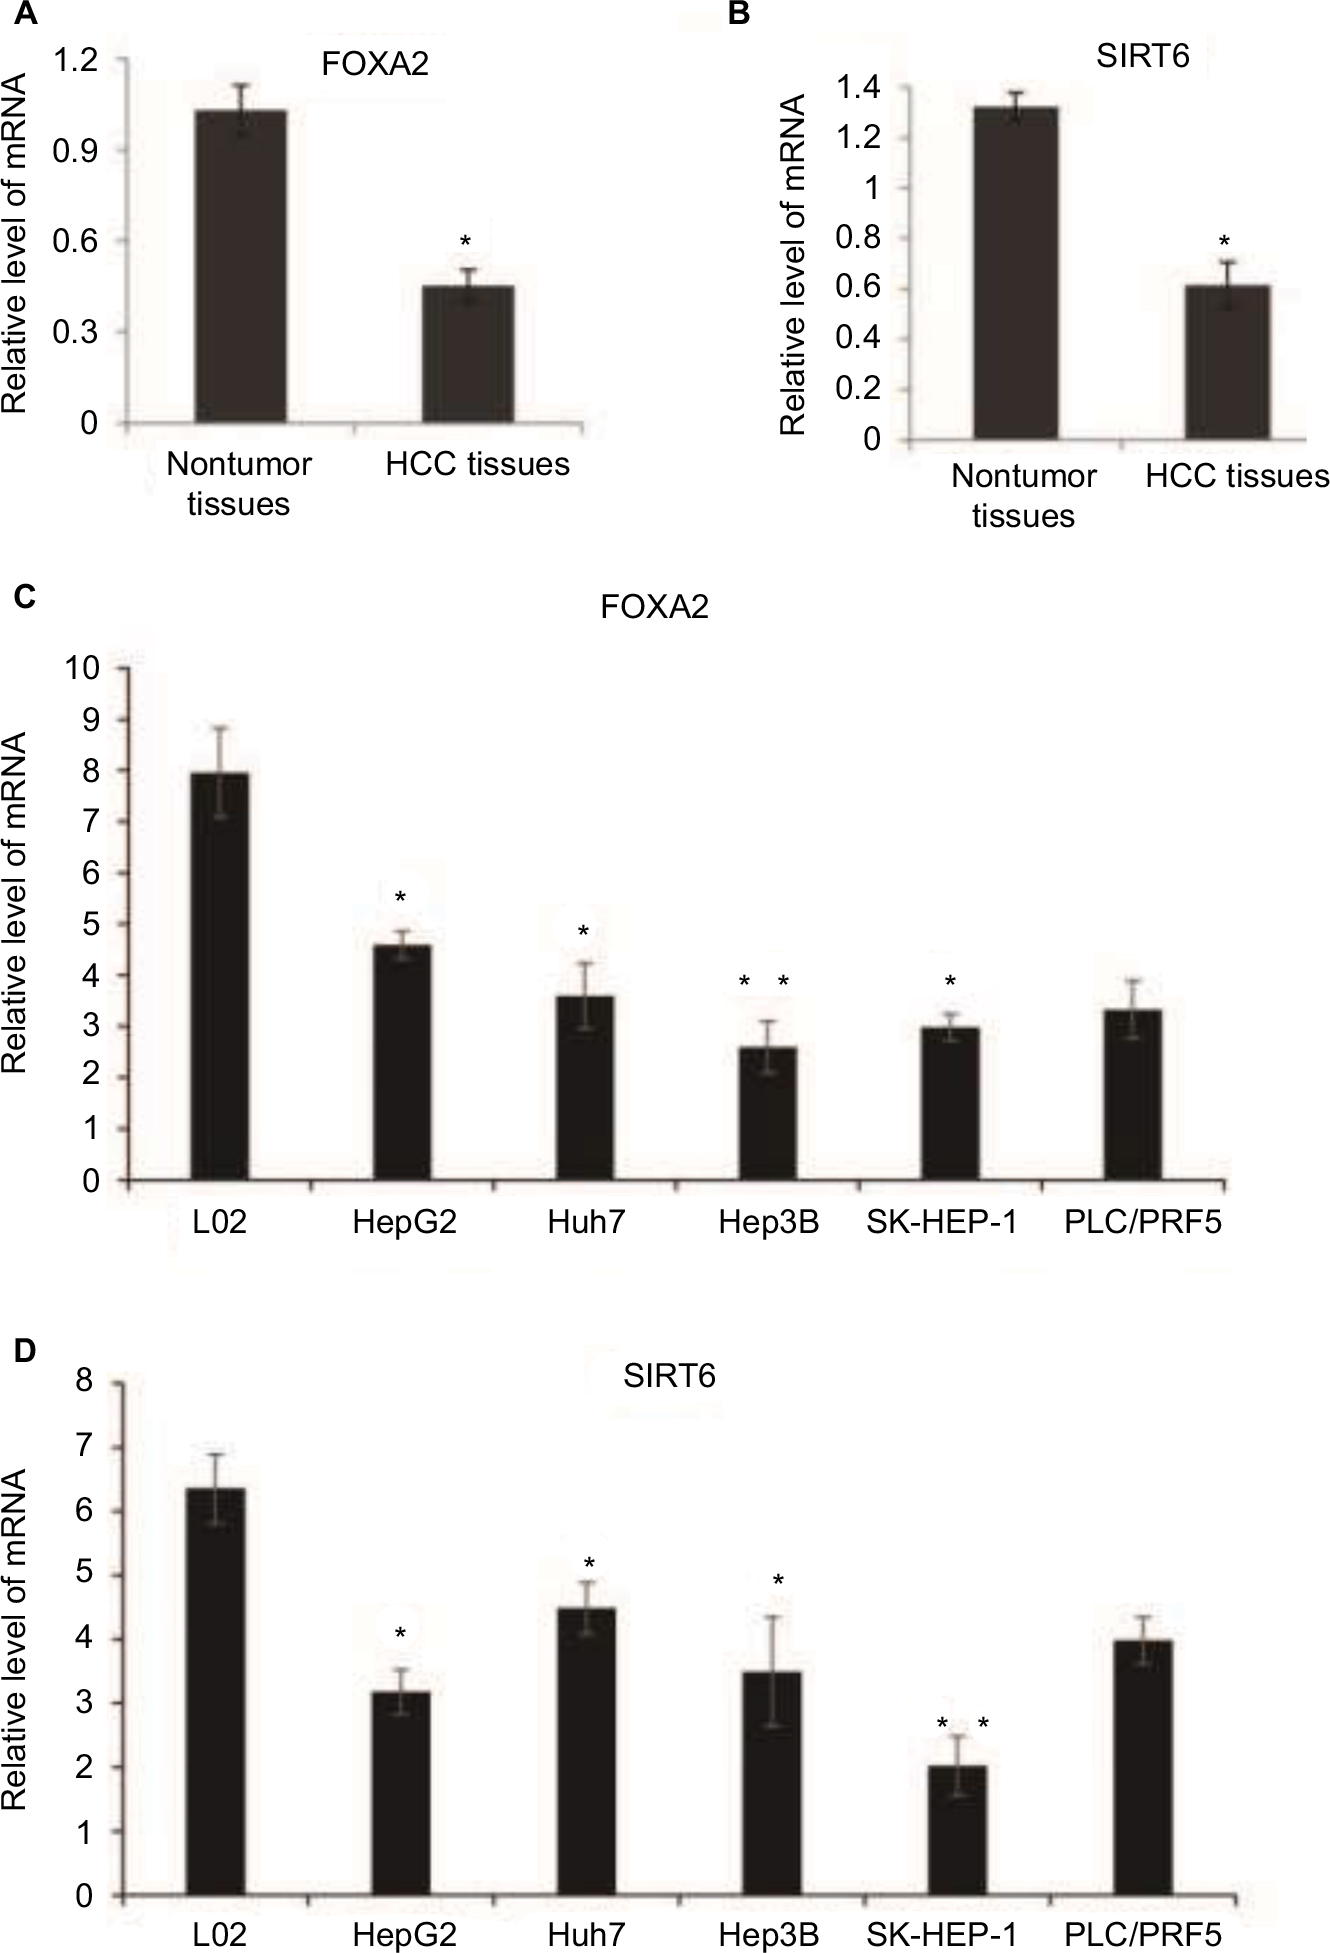 | Figure 2 FOXA2 and SIRT6 are downregulated in human HCC and cell lines. Notes: (A) Total RNA was extracted from HCC tissues and adjacent noncancer tissues and subjected to RT-qPCR; the expression of FOXA2 was measured; n=20 in non-HCC group, and n=50 in HCC group. (B) mRNA level of SIRT6 was analyzed in the relative HCC tissues and adjacent noncancer tissues. (C) mRNA level of FOXA2 was analyzed in immortalized normal liver epithelial cells L02 and five HCC cell lines (HepG2, Huh7, Hep3B, SK-HEP-1, and PLC/PRF5). (D) mRNA level of SIRT6 was analyzed in the relative cell lines. All data were represented of three independent experiments. *P<0.05, **P<0.01. Abbreviations: HCC, hepatocellular carcinoma; RT-qPCR, reverse transcription-quantitative polymerase chain reaction; SIRT, sirtuin. |
FOXA2 and SIRT6 inhibit HCC cell proliferation in vitro
In order to understand the function of FOXA2 and SIRT6 in HCC, first, HepG2 or Huh7 cells were cultured to 70%–80% of confluence and were transfected with FOXA2 siRNA or SIRT6 siRNA or cotransfected with FOXA2 siRNA and SIRT6 siRNA. Transfection efficiency was measured by RT-qPCR and Western blotting; as shown in Figure 3A and B, nearly 80% knockdown efficiency of FOXA2 was achieved by FOXA2 siRNA. The gene expression of SIRT6 was nearly 85% downregulated by si-SIRT6. Furthermore, using CCK-8 assay, we showed that FOXA2 or SIRT6 knockdown promoted HCC cell proliferation; the knockdown of FOXA2 and SIRT6 could remarkably enhance HepG2 (Figure 3C) or Huh7 cells’ (Figure 3D) proliferation ability.
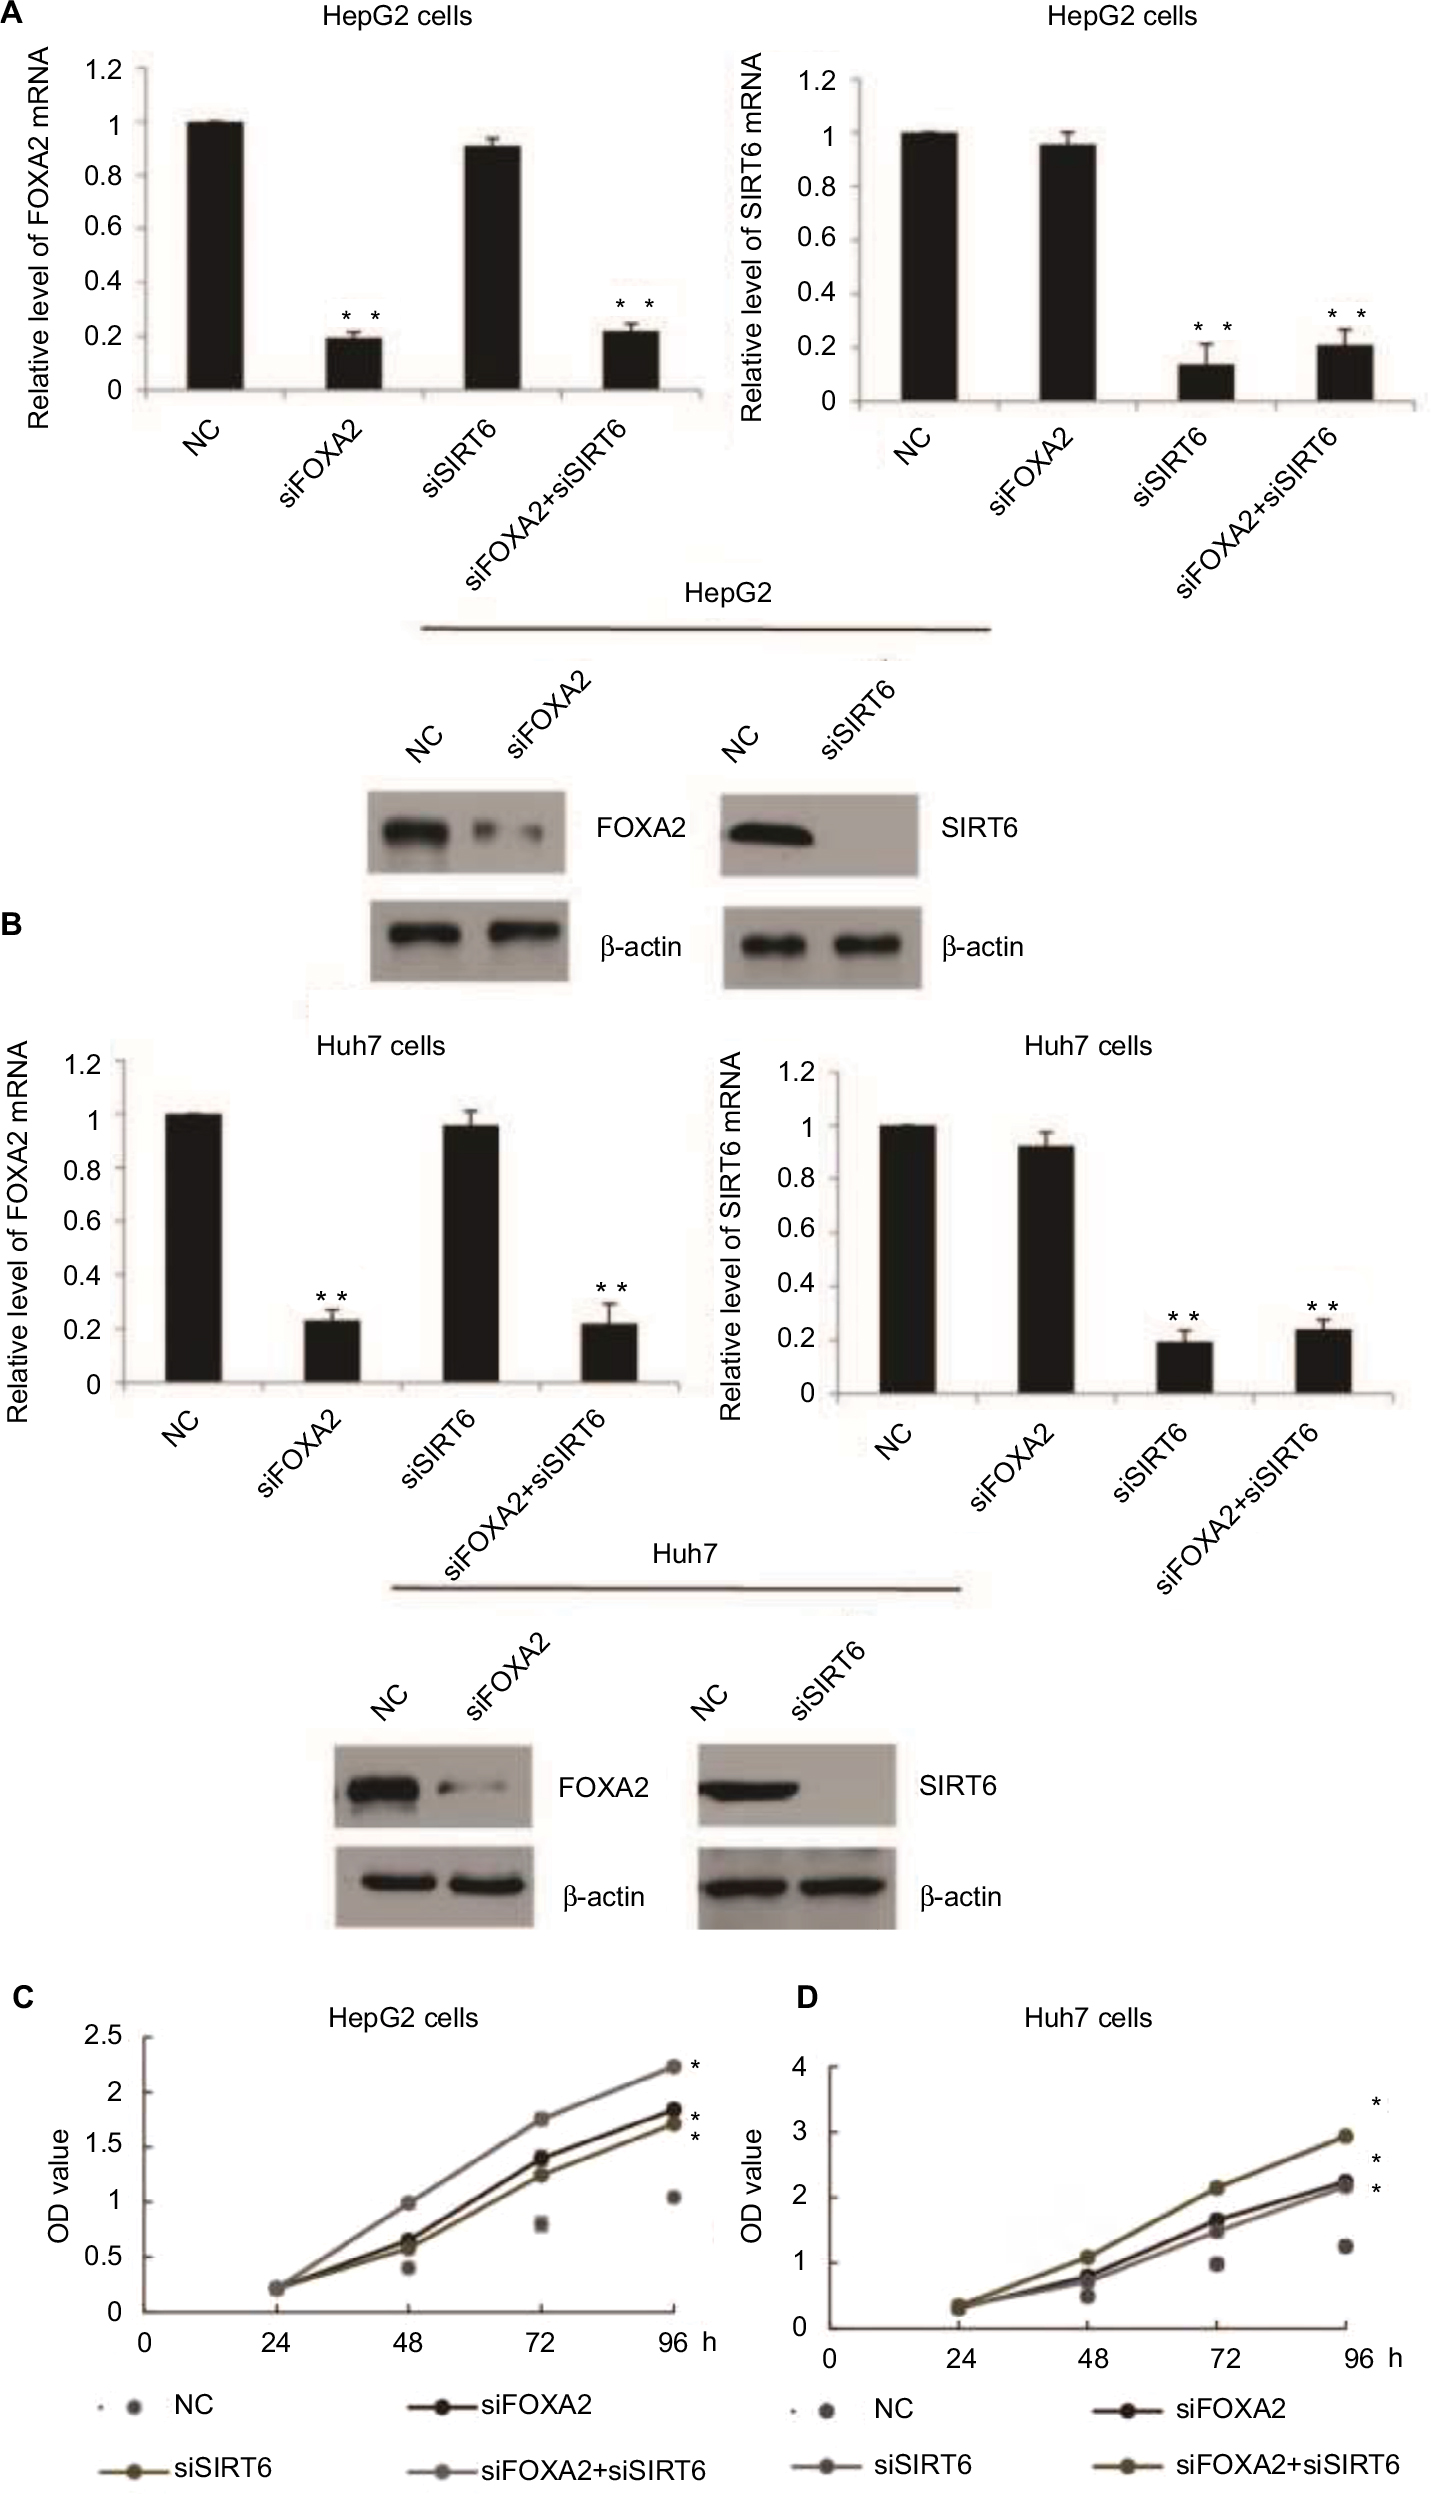 | Figure 3 FOXA2 and SIRT6 inhibit HCC cells proliferation in vitro. Notes: (A) FOXA2 or SIRT6 gene expression was measured after functional knockdown of FOXA2 or SIRT6 in HepG2 cells transfected with FOXA2 siRNA or SIRT6 siRNA or cotransfected with FOXA2 siRNA and SIRT6 siRNA. The scramble siRNAs were used as negative controls; RT-qPCR and Western blotting were performed, in three independent experiments. (B) The relative experiments were carried out in Huh7 cells. n=3 independent experiments; *P<0.05, **P<0.01. (C) CCK-8 assay was performed in HepG2 cells transfected with FOXA2 siRNA or SIRT6 siRNA or cotransfected with FOXA2 siRNA and SIRT6 siRNA. (D) The relative CCK-8 assay was performed in Huh7 cells. *P<0.05. Abbreviations: CCK-8, cell counting kit-8; HCC, hepatocellular carcinoma; RT-qPCR, reverse transcription-quantitative polymerase chain reaction; SIRT, sirtuin; OD, optical density; NC, negative control. |
FOXA2 and SIRT6 suppress HCC cell invasion in vitro
We also evaluated the effect of FOXA2 or/and SIRT6 knockdown on HCC cells’ invasion ability. The knockdown of FOXA2 or/and SIRT6 in HepG2 cells caused increased invasion ability compared with that of the control cells; the relative photos were shown in Figure 4A, and the relative statistical analyses were shown in Figure 4B. Similarly, the knockdown of FOXA2 or/and SIRT6 in Huh7 cells, which have weak metastatic capabilities, also resulted in increased invasion potential (Figure 4C).
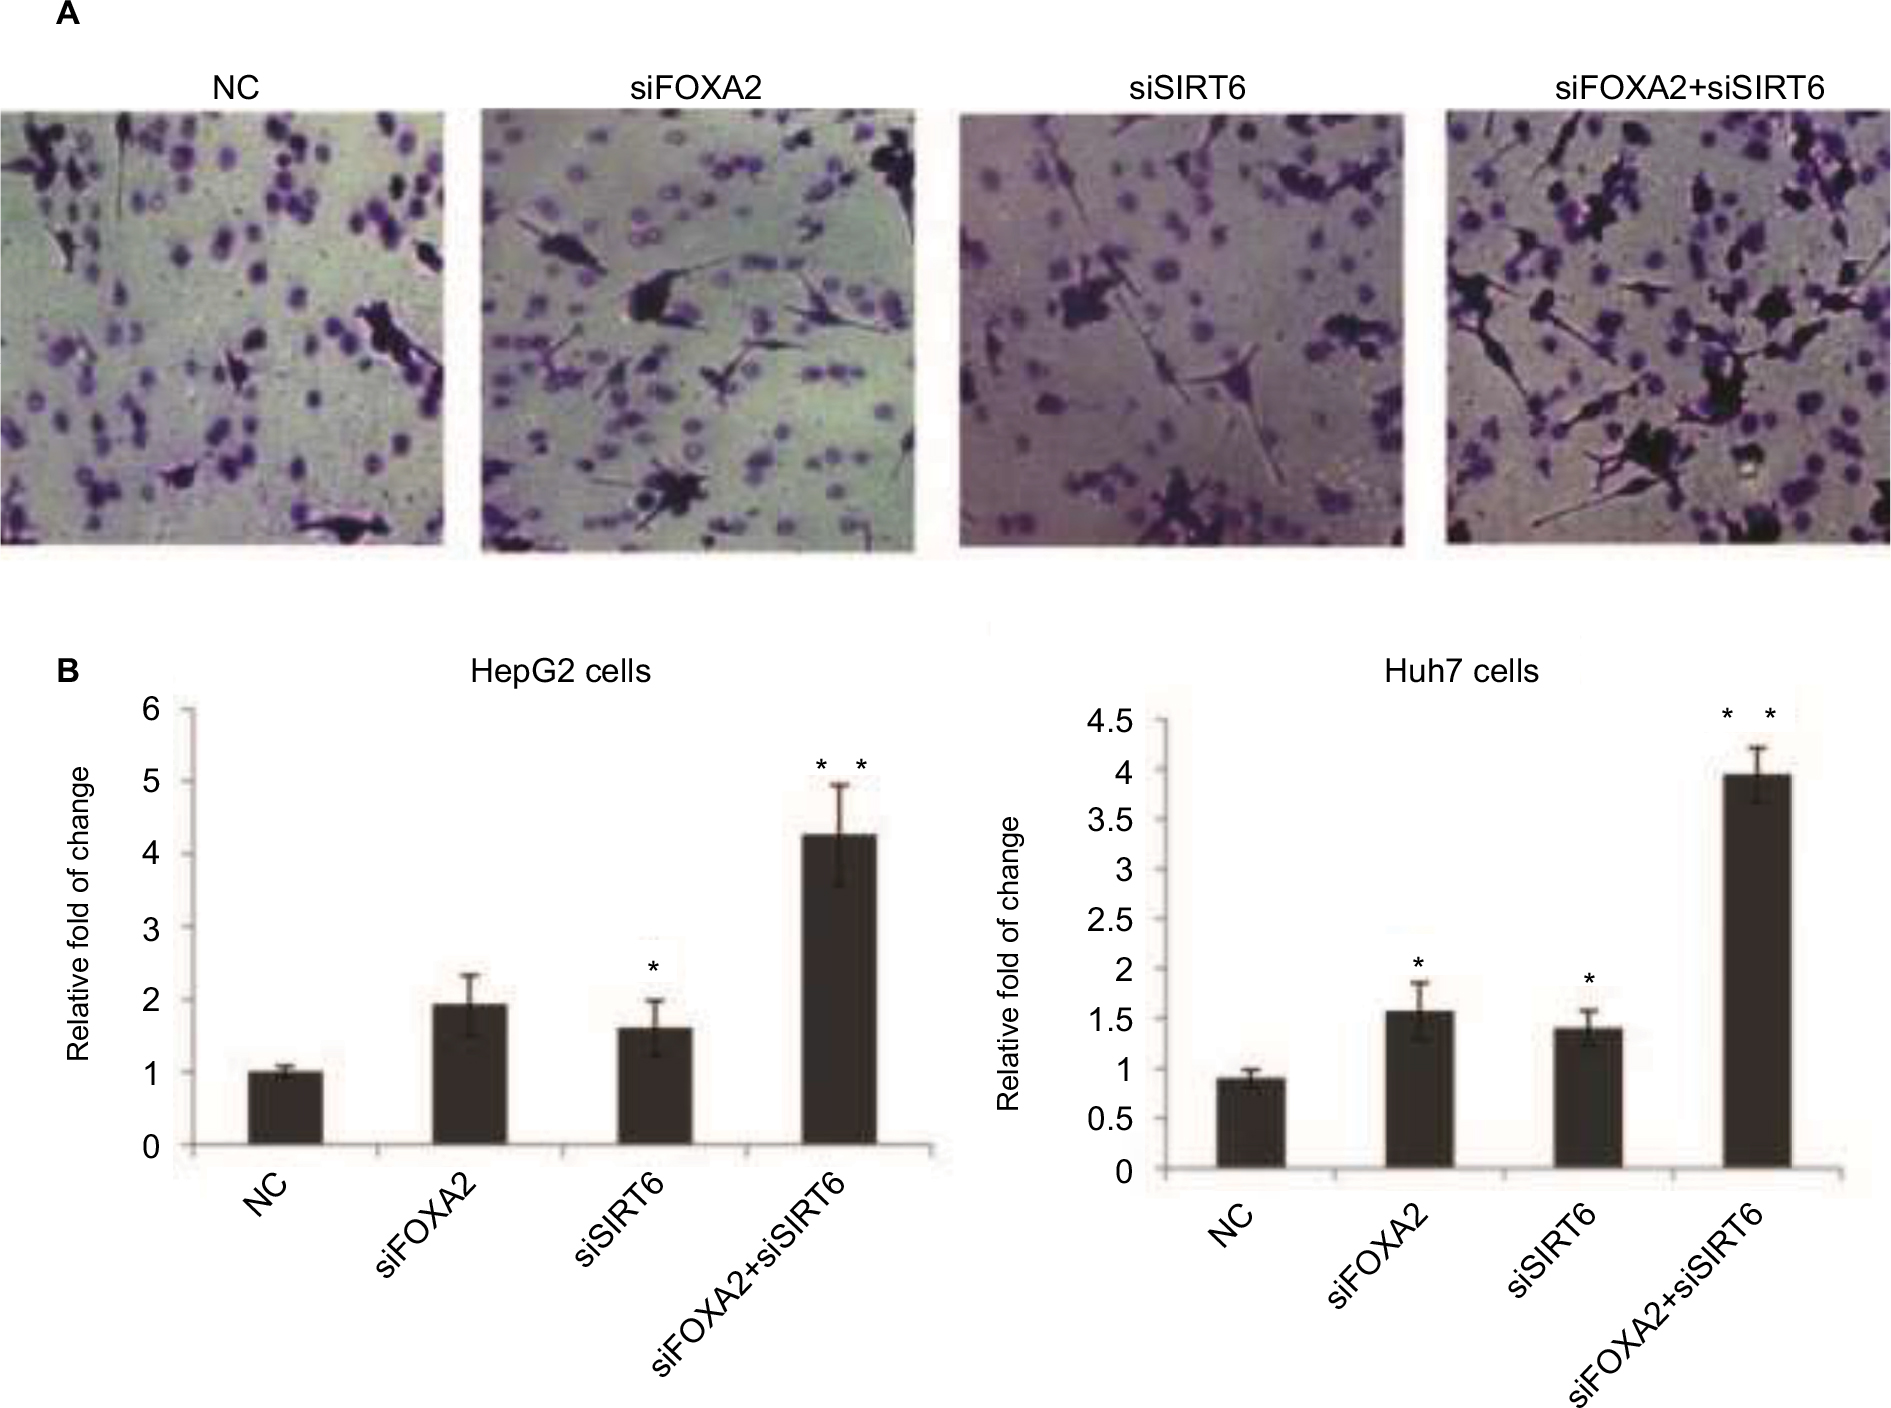 | Figure 4 FOXA2 and SIRT6 suppress HCC cells invasion in vitro. Notes: (A) The effects of FOXA2 or/and SIRT6 knockdown on invasion ability of HepG2 cells in vitro were examined by Transwell assay, and representative images are shown. (B) The statistical analysis was shown, and the data were represented as mean ± SD. *P<0.05, **P<0.01. (C) The above Transwell assay was performed in Huh7 cells, and the statistical analysis is shown. Abbreviations: HCC, hepatocellular carcinoma; SIRT, sirtuin; NC, negative control. |
FOXA2 and SIRT6 repress the expression of ZEB2 transcriptionally
Snail, Slug, ZEB1, ZEB2, and Twist1 are key regulators in the tumor metastasis program. We examined the expression of these transcription factors to further investigate whether the inhibition of these factors was involved in the inhibition of HCC progression by FOXA2 and SIRT6. Since ZEB2 is known to be an initial factor for tumor metastasis, we examined the levels of ZEB2 in HCC cells with FOXA2 or/and SIRT6 knockdown. Interestingly, the expression of ZEB2 was significantly increased in HepG2 cells compared with the expression of control groups measured from mRNA and protein levels (Figure 5A). Similar results were also observed from Huh cells (Figure 5B). To explore the potential mechanisms of FOXA2- and SIRT6-mediated regulation on ZEB2, the effect of FOXA2 and SIRT6 on ZEB2 transcription was then examined with reporter assay using pGL3 plasmids containing putative ZEB2-binding sites. As shown in Figure 5C, knockdown of FOXA2 or/and SIRT6 induced the luciferase activity of pGL3-ZEB2, whereas no effect of FOXA2 or/and SIRT6 was found in the pGL3-ZEB2 mutant plasmid (Figure 5D). ChIP assay further confirmed the direct binding of FOXA2 and SIRT6 on the promoter of ZEB2 (Figure 5E). We further confirmed that the overexpression of FOXA2 and SIRT6 inhibits the activity of the ZEB2-specific promoter in a synergistic manner, as the knockdown of SIRT6 could abolish the inhibition effect of FOXA2 overexpression on ZEB2 promoter (Figure 5F). As MMP9 worked as a downstream target for ZEB2, we also detected the effect of FOXA2 and SIRT6 on the expression of MMP9. To our expectation, knockdown of FOXA2 or/and SIRT6 could remarkably induce the mRNA levels of MMP9 (Figure 5G).
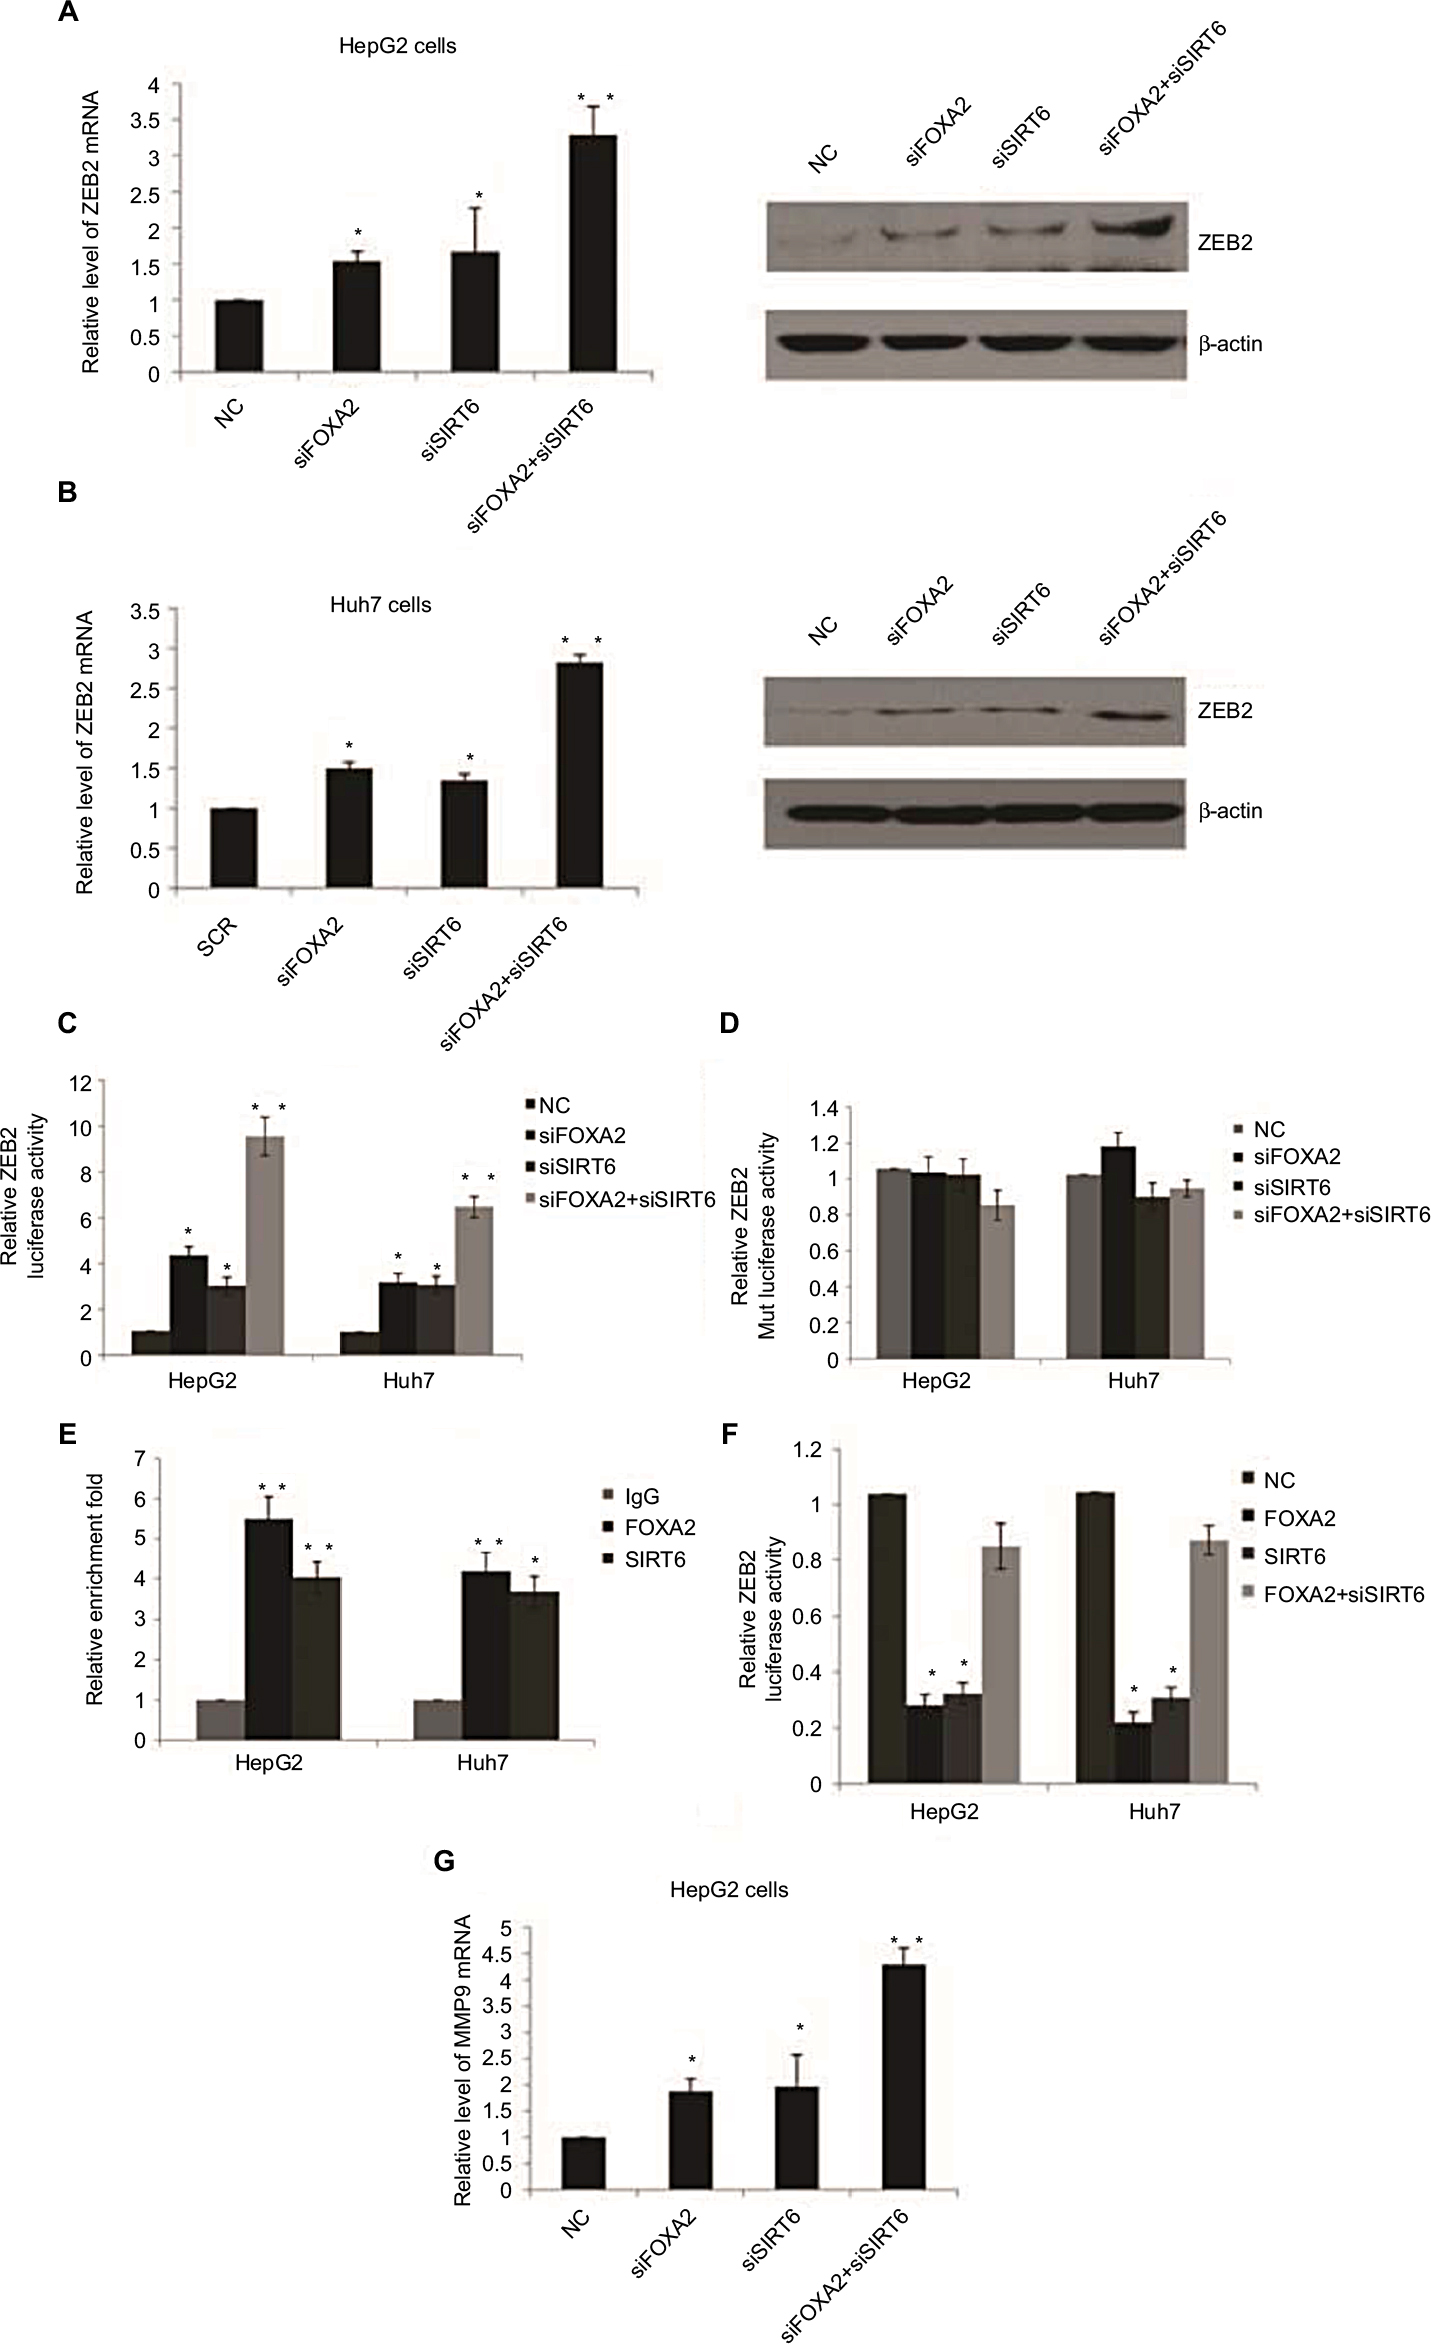 | Figure 5 FOXA2 and SIRT6 repress the expression of ZEB2 transcriptionally. Notes: (A) RT-qPCR and Western blot analysis of ZEB2 expression in HepG2 cells infected with FOXA2 siRNA or SIRT6 siRNA or cotransfected with FOXA2 siRNA and SIRT6 siRNA. (B) The relative experiments were carried out in Huh7 cells. n=3 independent experiments; *P<0.05, **P<0.01. (C) The transcriptional activity of the reporter pGL3-ZEB2 plasmids was assessed in HepG2 or Huh7 cells transfected with FOXA2 siRNA or SIRT6 siRNA or cotransfected with FOXA2 siRNA and SIRT6 siRNA. The data were represented as the mean ± SD. Renilla luciferase activity was normalized to that of firefly luciferase. (D) The transcriptional activity of the reporter pGL3-ZEB2 mutant plasmids was assessed. (E) qChIP assay was performed in HepG2 or Huh7 cells to confirm the binding of FOXA2 and SIRT6 on the promoter of ZEB2. n=3 independent experiments; *P<0.05, **P<0.01. (F) The transcriptional activity of the reporter pGL3-ZEB2 plasmids was assessed in HepG2 or Huh7 cells transfected with FOXA2 plasmids or SIRT6 plasmids or cotransfected with FOXA2 plasmids and SIRT6 siRNA. (G) RT-qPCR was used to analyze MMP9 expression in HepG2 cells infected with FOXA2 siRNA or SIRT6 siRNA or cotransfected with FOXA2 siRNA and SIRT6 siRNA. Abbreviations: HCC, hepatocellular carcinoma; qChIP, fast chromatin immunoprecipitation; RT-qPCR, reverse transcription-quantitative polymerase chain reaction; SIRT, sirtuin; NC, negative control. |
ZEB2 suppression is involved in the anti-oncogenesis effect of FOXA2 and SIRT6
To determine the role of ZEB2 in the anti-metastasis effect of FOXA2 and SIRT6, we first transfected HepG2 or Huh 7 cells with ZEB2 siRNA; the knockdown efficiency was measured from mRNA and protein levels; as shown in Figure 6A, 88% knockdown efficiency was achieved. Further, FOXA2 siRNA, ZEB2 siRNA, or both constructs were transfected into HepG2 or Huh7 cells (Figure 6B); the CCK-8 assay showed that the promoting effect of FOXA2 knockdown on the proliferation of HepG2 cells was partially reversed by ZEB2 silencing. Consistently, the promoting effect of SIRT6 knockdown was also reduced by knockdown of ZEB2 (Figure 6C). Transwell assay revealed that the invasion capacity of HepG2 or Huh7 cells transfected with both constructs (siFOXA2 and siZEB2) was significantly reduced as compared with siFOXA2 transfection groups (Figure 6D). Similarly, cotransfection of siSIRT6 and siZEB2 also showed the reduced invasion ability (Figure 6E).
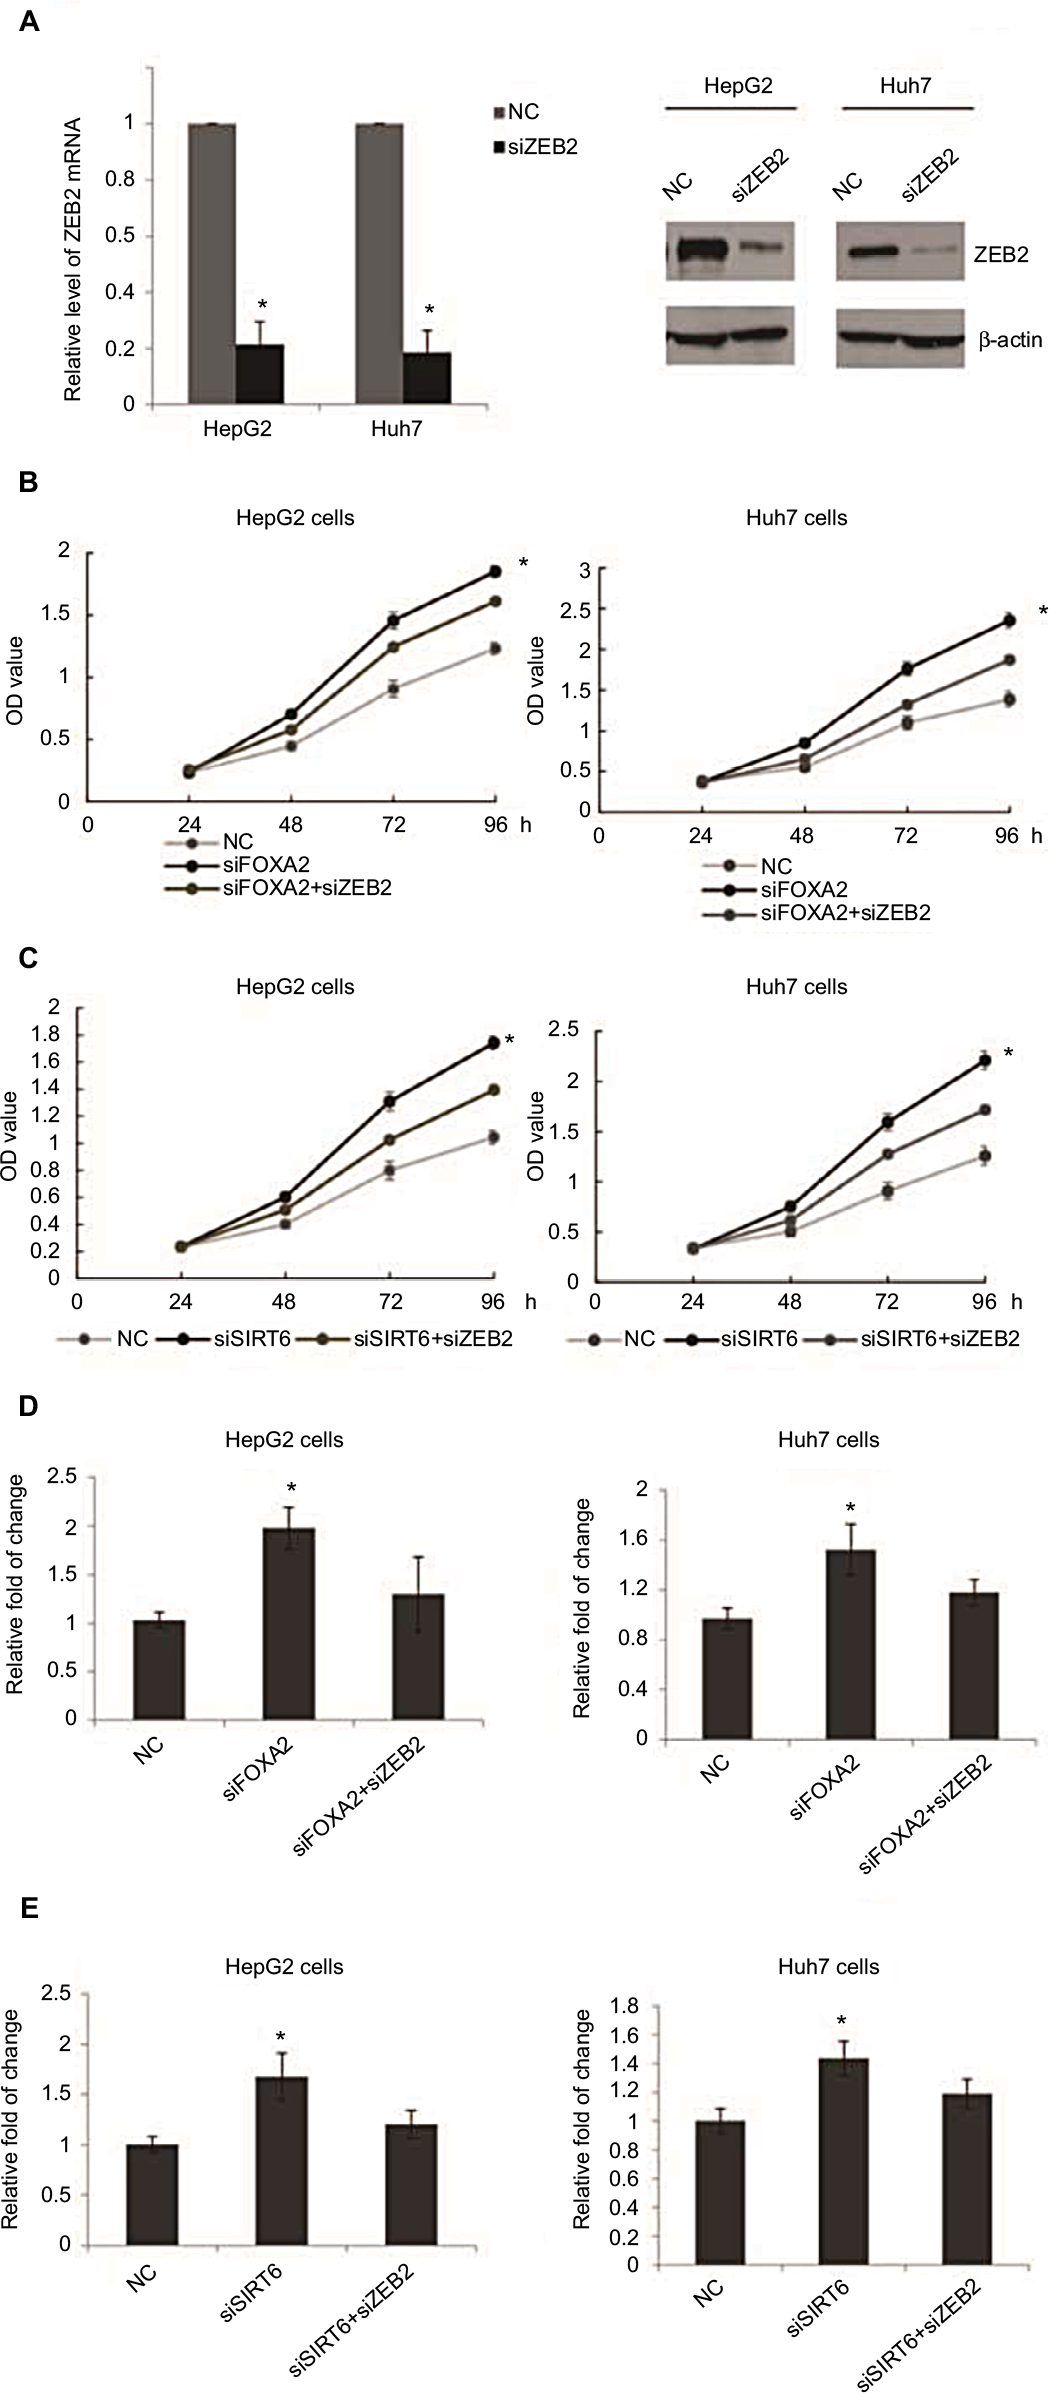 | Figure 6 ZEB2 suppression involved in the anti-oncogenesis effect of FOXA2 and SIRT6. Notes: (A) RT-qPCR and Western blot analysis of ZEB2 expression in HepG2 cells or Huh7 infected with ZEB2 siRNA, of three independent experiments; *P<0.05, **P<0.01. (B) CCK-8 assay was assessed in HepG2 or Huh7 cells transfected with FOXA2 siRNA or cotransfected with FOXA2 siRNA and ZEB2 siRNA. The scramble siRNAs were used as negative controls. (C) CCK-8 assay was assessed in HepG2 or Huh7 cells transfected with SIRT6 siRNA or cotransfected with SIRT6 siRNA and ZEB2 siRNA. The scramble siRNAs were used as negative controls, of three independent experiments; *P<0.05, **P<0.01. (D) Transwell assay was assessed in HepG2 or Huh7 cells transfected with FOXA2 siRNA or cotransfected with FOXA2 siRNA and ZEB2 siRNA. The scramble siRNAs were used as negative controls. (E) Transwell assay was assessed in HepG2 or Huh7 cells transfected with SIRT6 siRNA or cotransfected with SIRT6 siRNA and ZEB2 siRNA. The scramble siRNAs were used as negative controls, of three independent experiments; *P<0.05. Abbreviations: CCK-8, cell counting kit-8; RT-qPCR, reverse transcription-quantitative polymerase chain reaction; SIRT, sirtuin; OD, optical density; NC, negative control. |
Negative correlation between the expression of ZEB2 and FOXA2 or SIRT6
To clarify the underlying role of ZEB2 in HCC progression, we examined the expression of ZEB2 in the HCC specimens by RT-qPCR. As shown in Figure 7A, the expression of ZEB2 was increased compared with the relative paired noncancerous adjacent tissues. Moreover, the mRNA level of ZEB2 was significantly higher in HCC cells than that in the normal liver epithelial cells L02 (Figure 7B). This further indicated the negative correlation by the expression of ZEB2 and FOXA2 or SIRT6. The analysis of 50 HCC specimens by RT-qPCR revealed a negative relationship between the expression of FOXA2 and ZEB2 (Figure 7C); also the negative relationship was observed between the expression of SIRT6 and ZEB2 (Figure 7D).
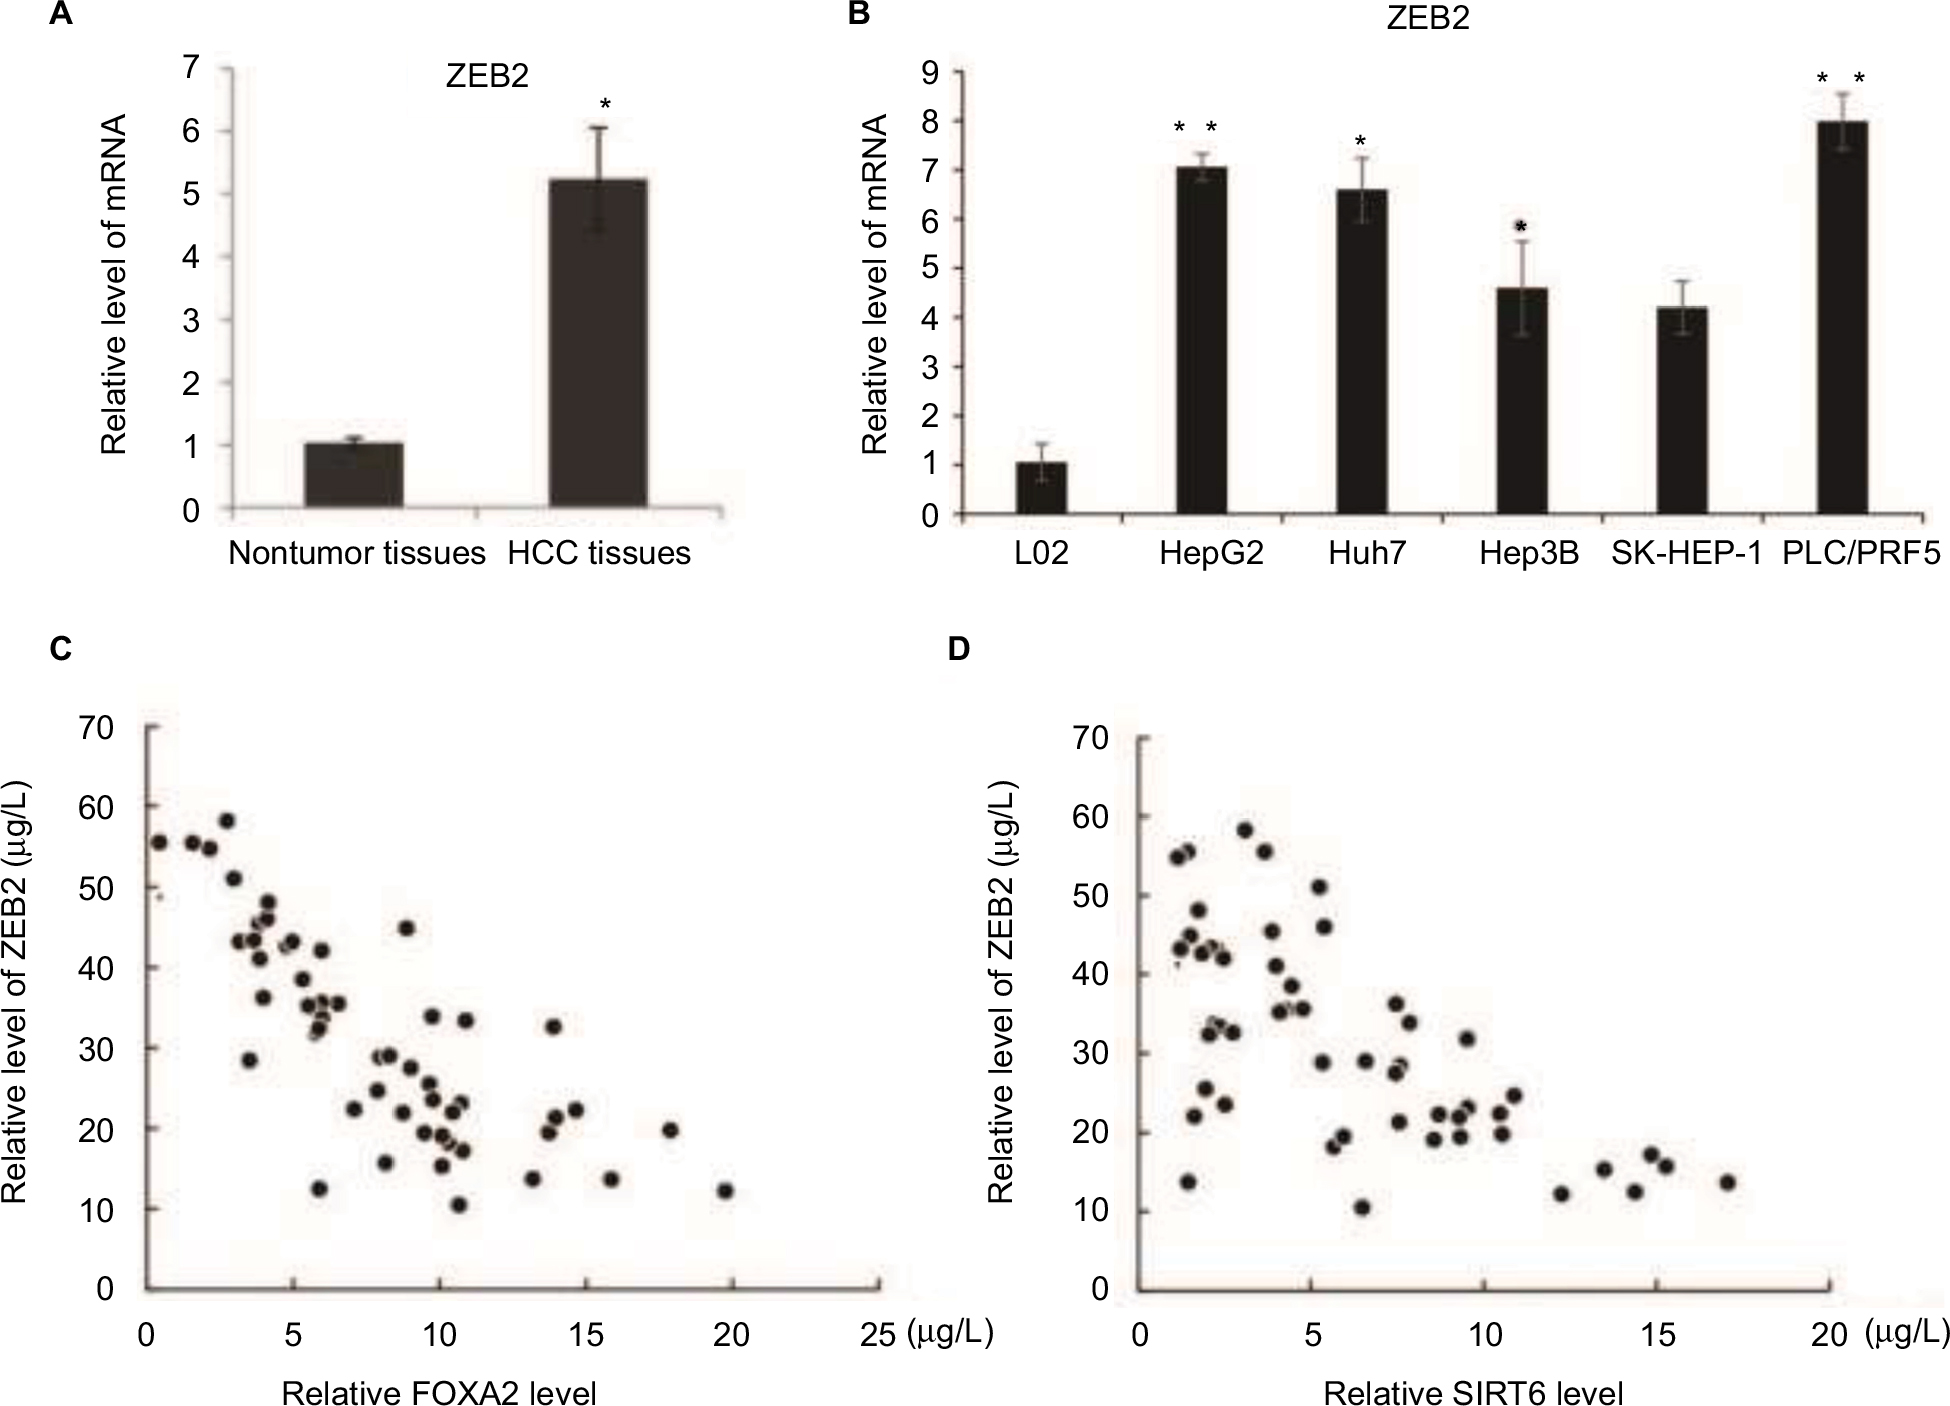 | Figure 7 The negative correlation between the expression of ZEB2 and FOXA2 or SIRT6. Notes: (A) mRNA level of ZEB2 was analyzed in the relative HCC tissues and adjacent noncancer tissues. (B) mRNA level of ZEB2 was analyzed in immortalized normal liver epithelial cells L02 and five HCC cell lines (HepG2, Huh7, Hep3B, SK-HEP-1, and PLC/PRF5). The data were represented as mean ± SD. *P<0.05, **P<0.01. (C) The correlation between the expression of FOXA2 and ZEB2 was measured in the HCC tissues. (D) The correlation between the expression of SIRT6 and ZEB2 was measured in the HCC tissues. Abbreviations: CCK-8, cell counting kit-8; HCC, hepatocellular carcinoma; SIRT, sirtuin. |
Discussion
The effects of SIRT6 are complicated and contradictory in different tumor types. As reported, in pancreatic cancer,15 non-small-cell lung cancer,16 and breast cancer,17 SIRT6 may work as a tumorigenic gene. While in head and neck squamous cell carcinoma, SIRT6 is downregulated in cancerous tissues compared with noncancerous tissues.18 In ovarian cancer, SIRT6 is downregulated and acts as a tumor suppressor.19
In our study, we reported that SIRT6 interacted with FOXA2 to inhibit the expression of ZEB2 and worked as a tumor suppressor in HCC cells. As Zhang and Qin7 and Sebastian et al20 reported, the expression of SIRT6 was downregulated in HCC tissues, and knockdown of SIRT6 could promote HepG2 cell growth; these findings are consistent with our study findings.
Because of early metastasis and invasion, the 5-year postsurgery survival rate of HCC is still very low.21 The molecular mechanisms underlying the HCC remain to be explored. The aberrant activation of EMT is an important step for tumor cell invasion and metastasis.22,23 ZEB2 has been identified as a transcriptional factor that is important for the process of EMT.24,25 In HCC cells, ZEB2 expression is induced and thus upregulated the MMP gene family during HCC progression.26 However, the regulation of ZEB2 is still unknown. In our study, we explored the inhibition of ZEB2 by FOXA2 and SIRT6, and the downregulation of ZEB2 was associated with the reduction of tumor cell proliferation and invasion in HCC cells. It is better to perform some in vivo experiments in the future to make the study more compellent.
Conclusion
The present study demonstrated that ZEB2 might function as a novel therapeutic target for HCC. In our study, we revealed the mechanism that FOXA2 and SIRT6 inhibited the expression of ZEB2 in a coordinated manner, and cotransfection of FOXA2 and SIRT6 resulted in a drastic change in the expression of ZEB2 than the transfection of FOXA2 or SIRT6 separately. Although FOXA2 is generally considered as a transcriptional activator, more and more groups have proved that FOXA2 also works as a transcriptional repressor depending on the target genes.13,27 In our study, based on the ChIP assay and luciferase reporter assay, we found that FOXA2 could directly transcriptionally repress ZEB2. Since SIRT6 usually functions as a histone H3K9Ac deacetylase to repress the transcriptional activities of target genes,28 we made the hypothesis that SIRT6 might repress the expression of ZEB2 by removing H3K9Ac. The evidences were as follows: by the knockdown of either SIRT6 or FOXA2, the level of H3K9Ac was significantly increased. Furthermore, although SIRT6 also works as a nonhistone deacetylase, we did not detect any acetylation site on FOXA2 (data not shown). When FOXA2 was depleted, the recruitment of both FOXA2 and SIRT6, as the target promoters, was dramatically reduced. Based on the above experiments, we make the conclusion that as a transcriptional repressor factor, FOXA2 serves as a recruiter of SIRT6 to the ZEB2 promoter in order to change the acetylation status of H3K9Ac.
Disclosure
The authors report no conflicts of interest in this work.
References
Lamarca A, Mendiola M, Barriuso J. Hepatocellular carcinoma: exploring the impact of ethnicity on molecular biology. Crit Rev Oncol Hematol. 2016;105:65–72. | ||
El-Serag HB, Rudolph KL. Hepatocellular carcinoma: epidemiology and molecular carcinogenesis. Gastroenterology. 2007;132(7):2557–2576. | ||
Yin CQ, Yuan CH, Qu Z, Guan Q, Chen H, Wang FB. Liquid biopsy of hepatocellular carcinoma: circulating tumor-derived biomarkers. Dis Markers. 2016;2016:1427849. | ||
Minagawa S, Araya J, Numata T, et al. Accelerated epithelial cell senescence in IPF and the inhibitory role of SIRT6 in TGF-beta-induced senescence of human bronchial epithelial cells. Am J Physiol Lung Cell Mol Physiol. 2011;300(3):L391–L401. | ||
Marquardt JU, Fischer K, Baus K, et al. Sirtuin-6-dependent genetic and epigenetic alterations are associated with poor clinical outcome in hepatocellular carcinoma patients. Hepatology. 2013;58(3):1054–1064. | ||
Zhong L, D’Urso A, Toiber D, et al. The histone deacetylase Sirt6 regulates glucose homeostasis via Hif1alpha. Cell. 2010;140(2):280–293. | ||
Zhang ZG, Qin CY. Sirt6 suppresses hepatocellular carcinoma cell growth via inhibiting the extracellular signal regulated kinase signaling pathway. Mol Med Rep. 2014;9(3):882–888. | ||
Friedman JR, Kaestner KH. The Foxa family of transcription factors in development and metabolism. Cell Mol Life Sci. 2006;63(19–20):2317–2328. | ||
Zhang L, Rubins NE, Ahima RS, Greenbaum LE, Kaestner KH. Foxa2 integrates the transcriptional response of the hepatocyte to fasting. Cell Metab. 2005;2(2):141–148. | ||
Li CM, Gocheva V, Oudin MJ, et al. Foxa2 and Cdx2 cooperate with Nkx2-1 to inhibit lung adenocarcinoma metastasis. Genes Dev. 2015;29(17):1850–1862. | ||
Vorvis C, Hatziapostolou M, Mahurkar-Joshi S, et al. Transcriptomic and CRISPR/Cas9 technologies reveal FOXA2 as a tumor suppressor gene in pancreatic cancer. Am J Physiol Gastrointest Liver Physiol. 2016;310(11):G1124–G1137. | ||
Song Y, Washington MK, Crawford HC. Loss of FOXA1/2 is essential for the epithelial-to-mesenchymal transition in pancreatic cancer. Cancer Res. 2010;70(5):2115–2125. | ||
Wang J, Zhu CP, Hu PF, et al. FOXA2 suppresses the metastasis of hepatocellular carcinoma partially through matrix metalloproteinase-9 inhibition. Carcinogenesis. 2014;35(11):2576–2583. | ||
van Gent R, Di Sanza C, van den Broek NJ, et al. SIRT1 mediates FOXA2 breakdown by deacetylation in a nutrient-dependent manner. PLoS One. 2014;9(5):e98438. | ||
Bauer I, Grozio A, Lasiglie D, et al. The NAD+-dependent histone deacetylase SIRT6 promotes cytokine production and migration in pancreatic cancer cells by regulating Ca2+ responses. J Biol Chem. 2012;287(49):40924–40937. | ||
Bai L, Lin G, Sun L, et al. Upregulation of SIRT6 predicts poor prognosis and promotes metastasis of non-small cell lung cancer via the ERK1/2/MMP9 pathway. Oncotarget. 2016;7(26):40377–40386. | ||
Khongkow M, Olmos Y, Gong C, et al. SIRT6 modulates paclitaxel and epirubicin resistance and survival in breast cancer. Carcinogenesis. 2013;34(7):1476–1486. | ||
Lai CC, Lin PM, Lin SF, et al. Altered expression of SIRT gene family in head and neck squamous cell carcinoma. Tumour Biol. 2013;34(3):1847–1854. | ||
Zhang G, Liu Z, Qin S, Li K. Decreased expression of SIRT6 promotes tumor cell growth correlates closely with poor prognosis of ovarian cancer. Eur J Gynaecol Oncol. 2015;36(6):629–632. | ||
Sebastian C, Zwaans BM, Silberman DM, et al. The histone deacetylase SIRT6 is a tumor suppressor that controls cancer metabolism. Cell. 2012;151(6):1185–1199. | ||
Jiang YF, Yang ZH, Hu JQ. Recurrence or metastasis of HCC:predictors, early detection and experimental antiangiogenic therapy. World J Gastroenterol. 2000;6(1):61–65. | ||
Micalizzi DS, Ford HL. Epithelial-mesenchymal transition in development and cancer. Future Oncol. 2009;5(8):1129–1143. | ||
Micalizzi DS, Farabaugh SM, Ford HL. Epithelial-mesenchymal transition in cancer: parallels between normal development and tumor progression. J Mammary Gland Biol Neoplasia. 2010;15(2):117–134. | ||
Si W, Huang W, Zheng Y, et al. Dysfunction of the reciprocal feedback loop between GATA3- and ZEB2-nucleated repression programs contributes to breast cancer metastasis. Cancer Cell. 2015;27(6):822–836. | ||
Lan T, Chang L, Wu L, Yuan Y. Downregulation of ZEB2-AS1 decreased tumor growth and metastasis in hepatocellular carcinoma. Mol Med Rep. 2016;14(5):4606–4612. | ||
Miyoshi A, Kitajima Y, Sumi K, et al. Snail and SIP1 increase cancer invasion by upregulating MMP family in hepatocellular carcinoma cells. Br J Cancer. 2004;90(6):1265–1273. | ||
Zhang Z, Yang C, Gao W, et al. FOXA2 attenuates the epithelial to mesenchymal transition by regulating the transcription of E-cadherin and ZEB2 in human breast cancer. Cancer Lett. 2015;361(2):240–250. | ||
Jia G, Su L, Singhal S, Liu X. Emerging roles of SIRT6 on telomere maintenance, DNA repair, metabolism and mammalian aging. Mol Cell Biochem. 2012;364(1–2):345–350. |
 © 2018 The Author(s). This work is published and licensed by Dove Medical Press Limited. The full terms of this license are available at https://www.dovepress.com/terms.php and incorporate the Creative Commons Attribution - Non Commercial (unported, v3.0) License.
By accessing the work you hereby accept the Terms. Non-commercial uses of the work are permitted without any further permission from Dove Medical Press Limited, provided the work is properly attributed. For permission for commercial use of this work, please see paragraphs 4.2 and 5 of our Terms.
© 2018 The Author(s). This work is published and licensed by Dove Medical Press Limited. The full terms of this license are available at https://www.dovepress.com/terms.php and incorporate the Creative Commons Attribution - Non Commercial (unported, v3.0) License.
By accessing the work you hereby accept the Terms. Non-commercial uses of the work are permitted without any further permission from Dove Medical Press Limited, provided the work is properly attributed. For permission for commercial use of this work, please see paragraphs 4.2 and 5 of our Terms.