Back to Journals » Clinical Epidemiology » Volume 18
Controlled Attenuation Parameter and Gallstone Disease Risk: A Retrospective Cohort Study with Mediation Analysis and Longitudinal Trajectory Modeling, Emphasizing Gender-Specific Effects
Authors Bai X, Li X, Wang Q ![]() , Yuan Q
, Yuan Q ![]() , Lu J, Gao M, Luo J, Yu W, Li H, Jiang G, He M, Jiang Y, Wang X, Chen Z, Yang H, Zhang C, Zhou D, Zhang L, Wang X
, Lu J, Gao M, Luo J, Yu W, Li H, Jiang G, He M, Jiang Y, Wang X, Chen Z, Yang H, Zhang C, Zhou D, Zhang L, Wang X ![]()
Received 30 November 2025
Accepted for publication 18 March 2026
Published 1 April 2026 Volume 2026:18 585529
DOI https://doi.org/10.2147/CLEP.S585529
Checked for plagiarism Yes
Review by Single anonymous peer review
Peer reviewer comments 2
Editor who approved publication: Dr Laura Horsfall
Xuan Bai,1,2 Xiaofang Li,3 Qiaoling Wang,4 Qing Yuan,4 Jiong Lu,5 Min Gao,5 Jing Luo,1,2 Wenqian Yu,1,2 Hongyu Li,1,2 Guoheng Jiang,1,2 Menglin He,1,2 Yi Jiang,1,2 Xin Wang,1,2 Zijie Chen,1,2 Hong Yang,1,2 Cuihua Zhang,1,2 Dingzi Zhou,6 Ling Zhang,3 Xin Wang1
1Department of Epidemiology and Biostatistics, West China School of Public Health and West China Fourth Hospital, Sichuan University, Chengdu, People’s Republic of China; 2Health Promotion and Food Nutrition & Safety Key Laboratory of Sichuan Province, Chengdu, People’s Republic of China; 3Department of Health Management Center, Ya’an People’s Hospital, Ya’an, People’s Republic of China; 4Department of Hepatological Surgery, Ya’an People’s Hospital, Ya’an, People’s Republic of China; 5Division of Biliary Tract Surgery, Department of General Surgery, West China Hospital, Sichuan University, Chengdu, People’s Republic of China; 6Department of Pulmonary and Critical Care Medicine, the Occupational Disease Centre of the West China School of Public Health and West China Fourth Hospital, Sichuan University, Chengdu, People’s Republic of China
Correspondence: Ling Zhang, Department of Health Management Center, Ya’an People’s Hospital, Ya’an, People’s Republic of China, Email [email protected] Xin Wang, Department of Epidemiology and Biostatistics, West China School of Public Health and West China Fourth Hospital, Sichuan University, Chengdu, People’s Republic of China, Email [email protected]
Background: The association between the controlled attenuation parameter (CAP)-a noninvasive marker for hepatic steatosis-and gallstone disease (GSD) remains poorly understood. This study aimed to investigate the impact of CAP levels and their longitudinal trajectories on GSD risk and explore potential mediating pathways.
Methods: A dynamic cohort of 6,308 adults without baseline GSD underwent serial health examinations in Ya’an, China, from January 2020 to April 2025. The statistical methods included multivariate Cox regression analysis, restricted cubic spline (RCS) analysis, and mediation analysis. For sensitivity analyses, we performed gender-stratified analysis, trial sequential analysis (TSA), cumulative risk curve plotting, and re-analysis after excluding individuals with baseline diseases. Among 412 participants with ≥ 3 CAP measurements, group-based trajectory modelling (GBTM) identified CAP patterns and related them to GSD incidence.
Results: Each 1-SD increase in CAP was associated with a 40% higher GSD risk, with a stronger association in women (HR = 1.96, P = 0.02) than in men (HR = 1.36, P = 0.04). RCS revealed a strictly linear dose-response relationship between CAP and GSD risk (Pnon-linear = 0.43). Compared with the reference group (CAP ≤ 238 dB/m), moderate (259– 292 dB/m) and severe (> 292 dB/m) steatosis were associated with significantly higher GSD risk (HR = 2.56, P < 0.01; HR = 2.47, P = 0.01, respectively), whereas mild steatosis (238– 259 dB/m) showed no significant association (P = 0.11). GBTM identified “persistently low” (61.41%) and “persistently high” (38.59%) CAP trajectories, with the latter group having a 3.85-fold higher GSD risk (P = 0.04). Mediation analysis identified a significant pathway from CAP to GSD via high-density lipoprotein cholesterol (HDL-C, P < 0.01, proportion of mediation = 27.49%).
Conclusion: CAP is positively and linearly associated with GSD risk, particularly in women. Persistently high CAP levels confer a significantly elevated GSD risk. HDL-C is a significant mediator.
Keywords: longitudinal association analysis, cox regression model, group-based trajectory model
Introduction
Gallstone disease (GSD) is a common digestive disorder with a global prevalence of approximately 6%, exhibiting significant geographic and gender variations.1 Research indicates that GSD is multifactorial, with risk being closely associated with a range of genetic, environmental, and behavioral factors. These include genetic susceptibility loci such as genes related to gastrointestinal motility,2 obesity,3 exposure to heavy metals,4 dietary fiber intake,5 and metabolic diseases. The central pathogenic mechanism of GSD formation involves cholesterol-supersaturated bile,6 characterized by dysregulated hepatic cholesterol hypersecretion and impaired gallbladder absorption. As a result of its widespread prevalence and complex etiology, GSD currently poses a substantial health and economic burden worldwide.
Non-alcoholic fatty liver disease (NAFLD) is associated with a higher incidence of GSD compared with the general population, with this risk positively correlated with the severity of hepatic steatosis.7 The frequent co-occurrence of GSD and hepatic steatosis reflects their shared metabolic risk factors and complex bidirectional pathophysiology.8 At the molecular level, hypoxia-inducible factor 1α (HIF-1α) serves as a master regulator of hepatic lipid metabolism, promoting bile cholesterol supersaturation and accelerating gallstone formation.9 GSD can also contribute to the development of NAFLD by interfering gallbladder function and disrupting the circulation and metabolism of bile acids.10
The controlled attenuation parameter (CAP), a non-invasive biomarker measured by transient elastography (FibroScan), has emerged as a valuable tool for assessing hepatic steatosis severity.11 CAP has been shown to perform well in diagnosing mild hepatic steatosis, and is suitable for screening high-risk populations for NAFLD.12 Previous studies have reported that the inter-observer concordance coefficient of CAP is 0.82,13 and it exhibits favorable diagnostic accuracy in diverse populations.14,15 CAP is also associated with various metabolic factors and diseases, including insulin resistance,16 thyroid hormone levels,17 alpha-1-acid glycoprotein content,18 coronary atherosclerosis19 and COPD.20
However, previous research on the association between NAFLD and GSD has primarily relied on ultrasound diagnosis21 or changes in liver enzyme levels.22 There remains a lack of longitudinal studies investigating the impact of changes in the non-invasive quantitative marker, the CAP, on the incidence of GSD. Understanding the relationship between CAP and GSD could have significant clinical implications. If a strong association is established, CAP could potentially serve as an additional screening tool for identifying individuals at high risk of GSD, especially in populations already undergoing NAFLD screening. This could lead to earlier interventions, such as dietary modifications, weight management, or medical therapies, to prevent GSD development. Therefore, this study aimed to use a dynamic cohort to analyze the impact of both CAP and its longitudinal trajectory patterns on the risk of GSD development, as well as to explore the potential mechanistic pathways through which blood lipids may mediate the relationship between CAP and GSD formation.
Materials and Methods
Study Population and Setting
This dynamic cohort study enrolled participants from Ya’an People’s Hospital, Sichuan Province, China, between January 2020 and April 2025. Eligibility criteria included: (1) aged 18–65 years; (2) no self-reported or clinically confirmed GSD at baseline (assessed via abdominal ultrasound, the first-choice for GSD diagnosis23); (3) completion of at least one CAP measurement and baseline health examination; (4) willingness to provide follow-up data. Exclusion criteria were: (1) history of liver cirrhosis, hepatitis B/C, or other chronic liver diseases (to avoid confounding effects of liver pathology on CAP); (2) prior gallbladder surgery; (3) pregnancy or lactation; (4) incomplete baseline or follow-up data.
Data Collection
Baseline data included demographic characteristics (age, gender), anthropometric measurements (height, weight, body mass index [BMI] calculated as weight/height2), and clinical biomarkers. Blood samples were collected after an 8-hour overnight fast to measure fasting blood glucose (FBG), total cholesterol (TC), triglycerides (TG), high-density lipoprotein cholesterol (HDL-C), low-density lipoprotein cholesterol (LDL-C), alanine transaminase (ALT), aspartate transaminase (AST), renal function blood urea nitrogen (BUN), creatinine (Cr), and uric acid (UA) using an automatic biochemical analyzer (Beckman Coulter AU5800, USA). Blood pressure (BP) was measured twice using a mercury sphygmomanometer (Omron HEM-7200, Japan) with participants in a seated position after 5 minutes of rest, and the average value was recorded. There was an absence of missing values in these covariates.
CAP measurements were performed by trained technicians using a FibroScan 502 Touch device (Echosens, France) with M or XL probes, selected based on skin-capsular distance (SCD): M probe for SCD ≤25 mm and XL probe for SCD >25 mm.24 A diagnosis of GSD was established by specialized ultra sonographers if the gallbladder exhibited a hyperechoic mass with a posterior acoustic shadow that was mobile with positional changes.25 CAP levels of ≤ 238 dB/m, 238–259 dB/m, 259–292 dB/m, and > 292 dB/m corresponded to hepatic steatosis grades of ≤ 11% (normal), 11%-34% (mild), 34%-67% (moderate), and ≥ 67% (severe), respectively.
The primary outcome was incident GSD, diagnosed via abdominal ultrasound during follow-up. Follow-up ended on the date of GSD diagnosis, last health examination, or April 30, 2025, whichever came first.
Statistical Analysis
Categorical variables were presented as counts (percentages). Differences between groups were compared using chi-square tests or Fisher’s exact test. Cox regression models were used to assess the association between CAP (continuous: per 1-SD increase; categorical: ≤238, 238–259, 259–292, >292 dB/m, corresponding to normal, mild, moderate, and severe hepatic steatosis) and incident GSD by fully adjusting for age, gender, BMI, BP, FBG, TC, TG, HDL-C, LDL-C, BUN, UA, Cr, ALT and AST. Restricted cubic spline (RCS) analysis with 3 knots was used to explore the dose-response relationship between CAP and GSD risk, and the log-likelihood ratio test was used to assess non-linearity. GBTM (implemented in SAS PROC TRAJ) to identify CAP trajectory groups, with the optimal number of groups determined by the lowest Bayesian Information Criterion (BIC).26 Subsequently, an analysis was conducted between trajectory groups and the incidence of GSD. Mediation analysis27 was performed using the Baron-Kenny method to explore whether blood lipids (TC, TG, HDL-C, LDL-C) mediated the CAP-GSD association. The 95% CI was calculated using the bootstrap method with 1,500 simulations and the proportion of mediation (PM) was calculated as indirect effect/total effect * 100%.
Sensitivity analyses included: (1) sex-stratified Cox regression to assess sex-specific associations; (2) TSA28 to confirm the sufficiency of sample size (alpha = 0.05, power = 0.80); (3) cumulative incidence curves, plotted using the Kaplan-Meier method and compared using the log-rank test; (4) re-analysis after excluding baseline diseases (diabetes, hypertension, dyslipidemia). Figure 1 showed the study flowchart. Data processing, descriptive statistics, and main analysis were performed using R packages (R version 4.5.1) such as “dplyr”, “rms”, “rcompanion”, and “survminer”. GBTM and RCS analysis were conducted using SAS (version 9.4).
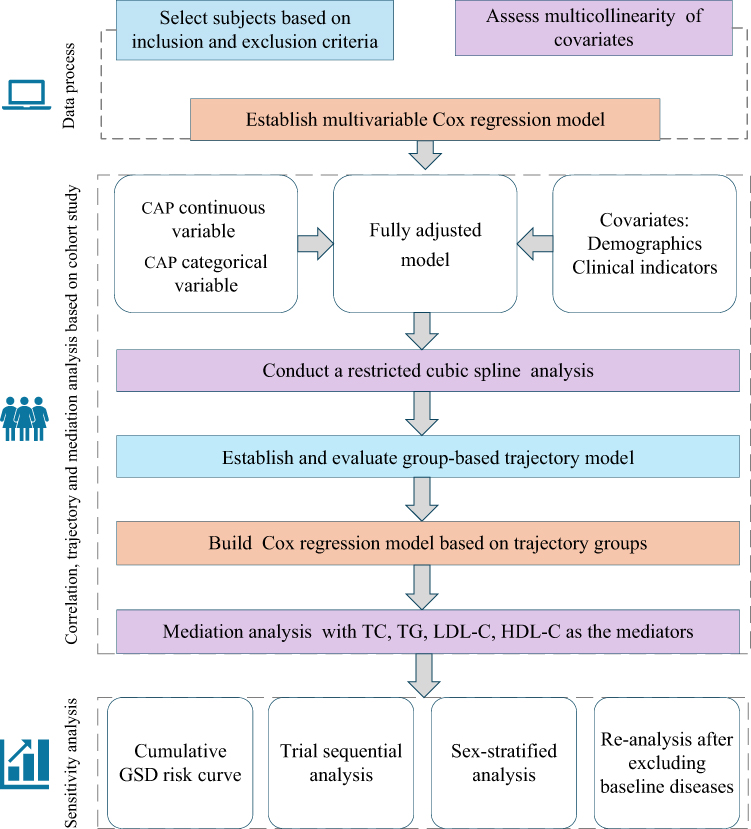 |
Figure 1 Study analysis flowchart. |
Results
Baseline Characteristics of Participants
A total of 6,308 participants (78.8% male, median age = 37.0 years) were included with a mean follow-up duration of 10 months. The median CAP value at baseline was 247.0 dB/m (IQR = 71.0 dB/m), with 56.8% (n = 3,582) of participants having CAP > 238 dB/m (indicating hepatic steatosis). Participants with higher CAP values were more likely to be older, male, and have higher BMI, FBG, TC, TG, LDL-C, BUN, Cr, ALT, and AST (all P < 0.05, Table 1).
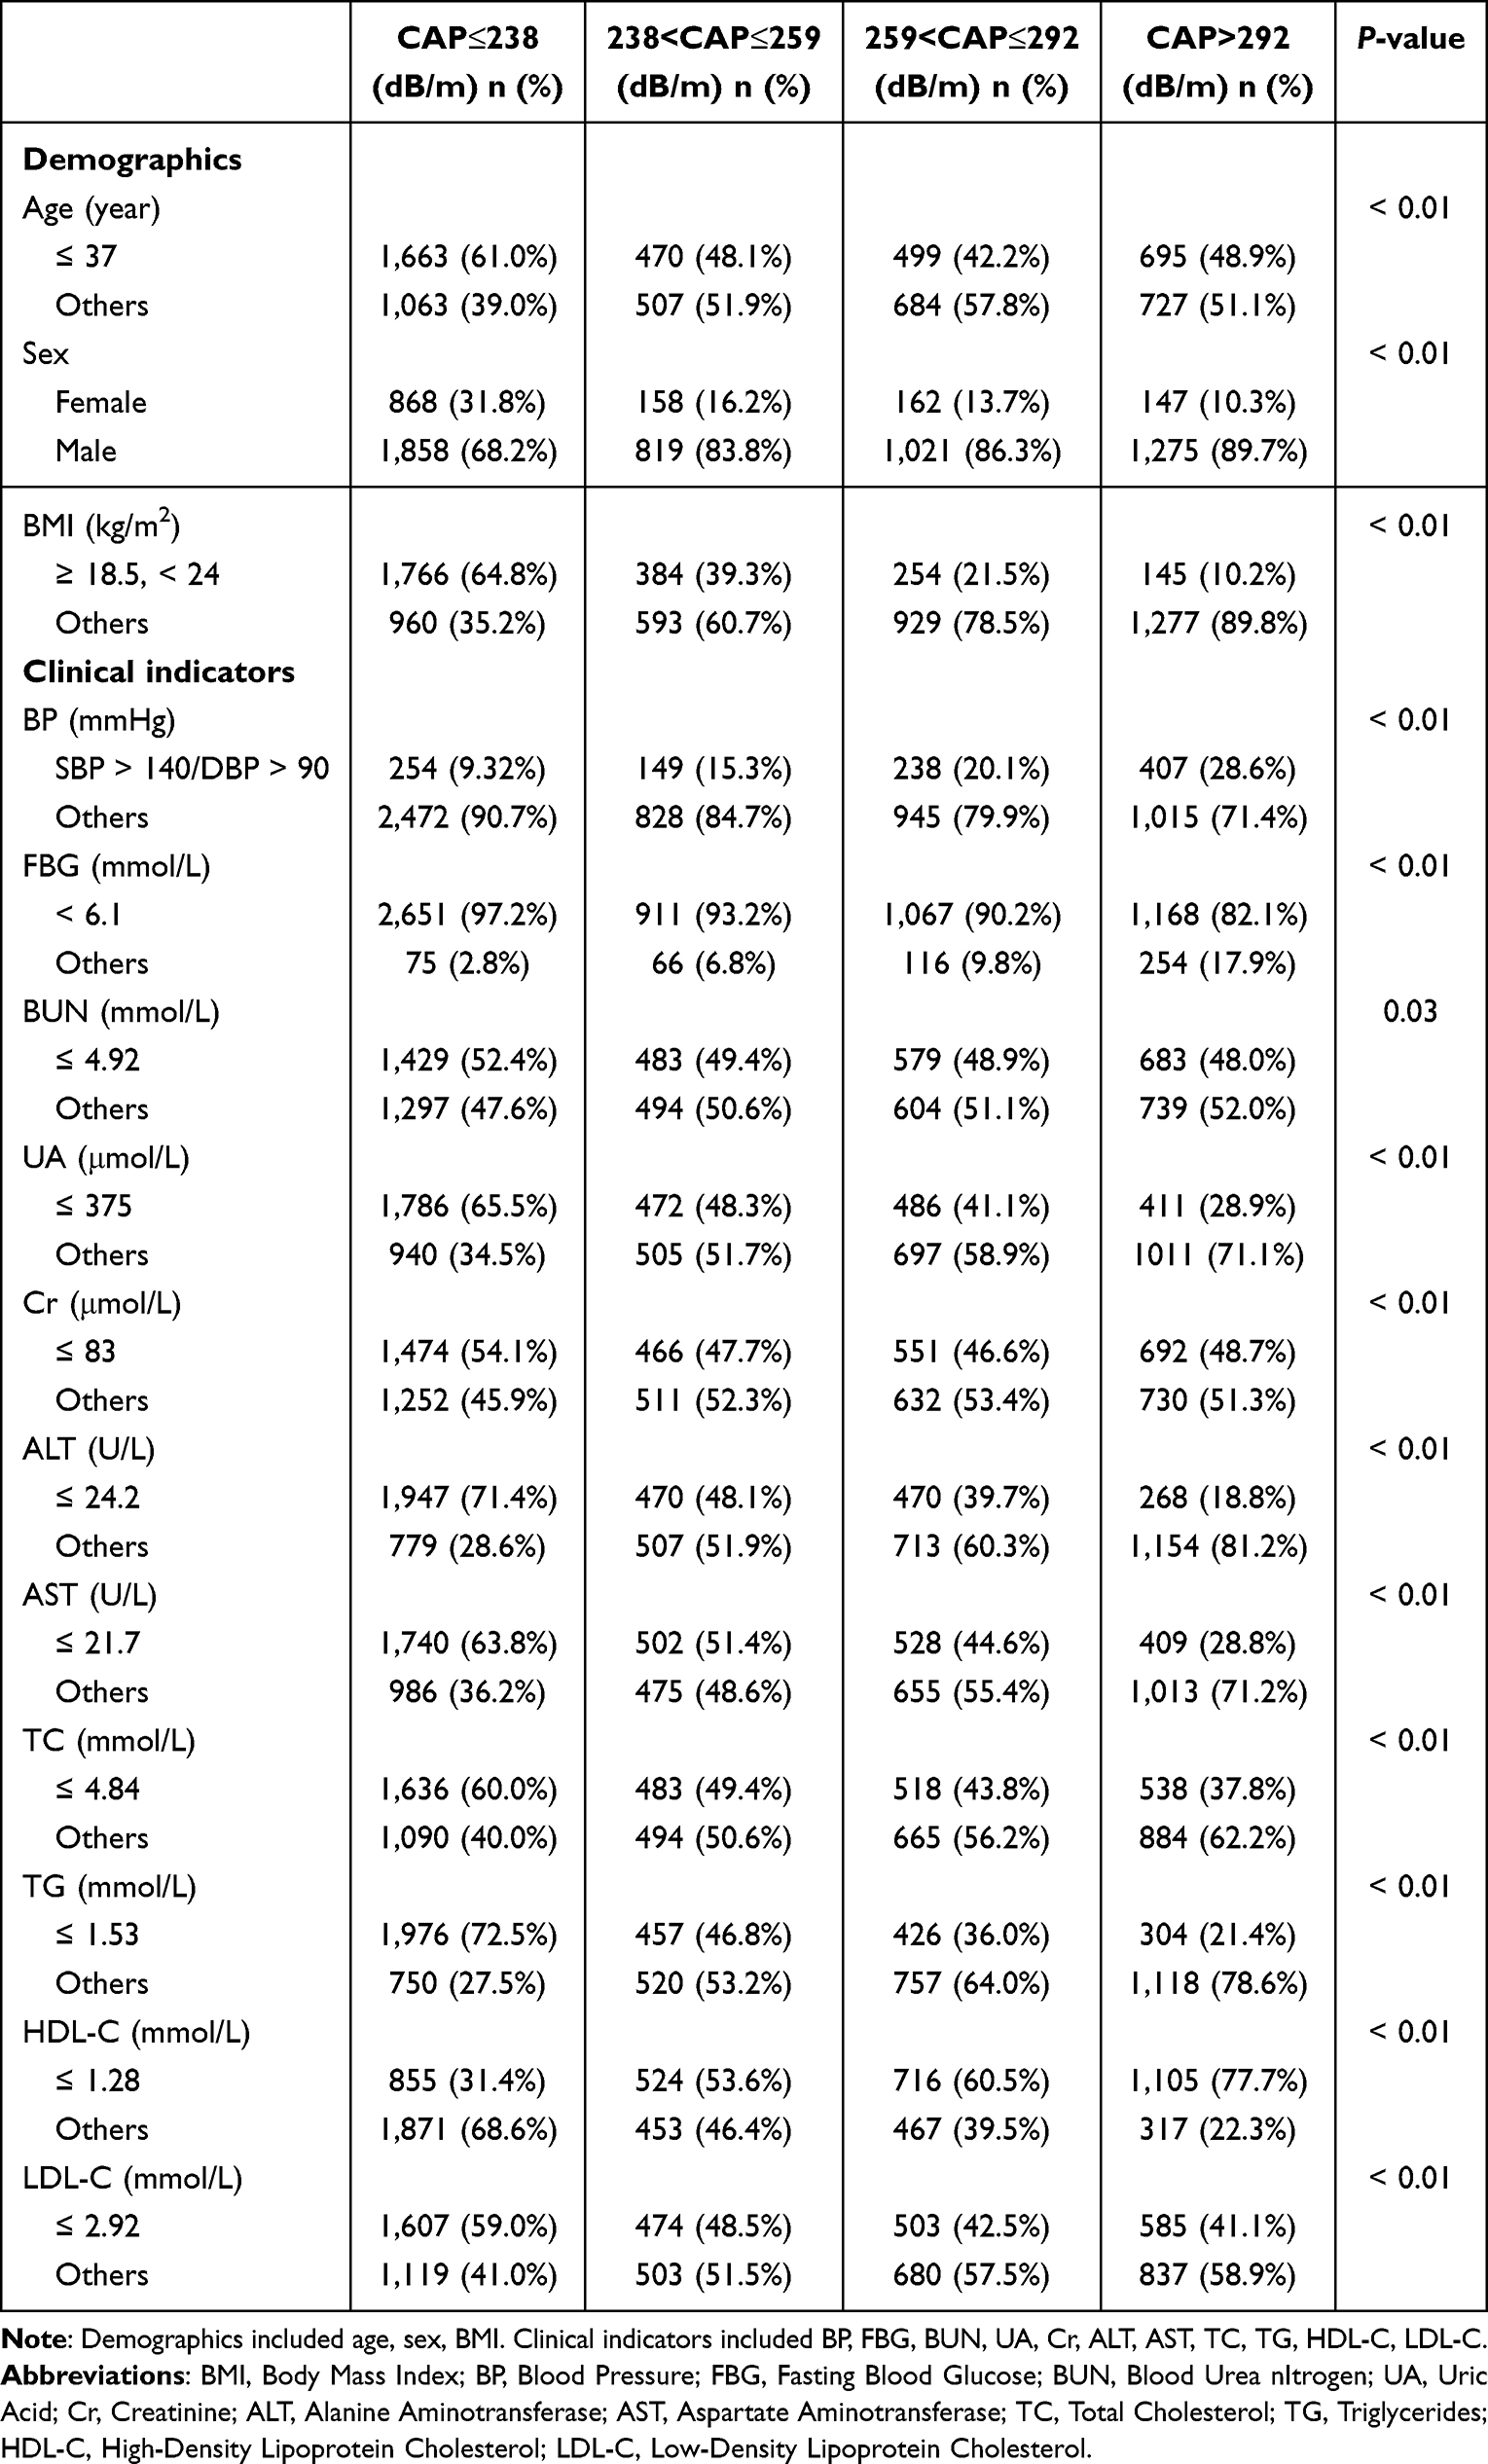 |
Table 1 Baseline Characteristics of the Study Population According to CAP Categories |
The Effect of CAP on GSD Incidence
After a mean follow-up of 10 months, the observed GSD incidence was 1.70 per 100 person-years. Supplementary Figure 1 displays the covariate autocorrelation coefficients, with only the correlation coefficient between TC and LDL-C being greater than 0.6, and all variance inflation factor (VIF) values are less than 2.
In Cox regression models (Table 2), each 1-SD increase in CAP was associated with a 40% higher risk of GSD in the fully adjusted model (adjusted HR = 1.40, 95% CI: 1.08–1.82, P < 0.01). When CAP was categorized, compared with the reference group (≤238 dB/m), moderate (259–292 dB/m) and severe (>292 dB/m) steatosis were associated with significantly higher GSD risk (adjusted HR = 2.56, 95% CI: 1.33–4.96, P < 0.01; adjusted HR = 2.47, 95% CI: 1.23–4.94, P = 0.01, respectively), while mild steatosis (238–259 dB/m) showed no significant association (adjusted HR = 1.80, 95% CI: 0.88–3.66, P = 0.11). The range of C-index value was ranged from 0.65 to 0.75.
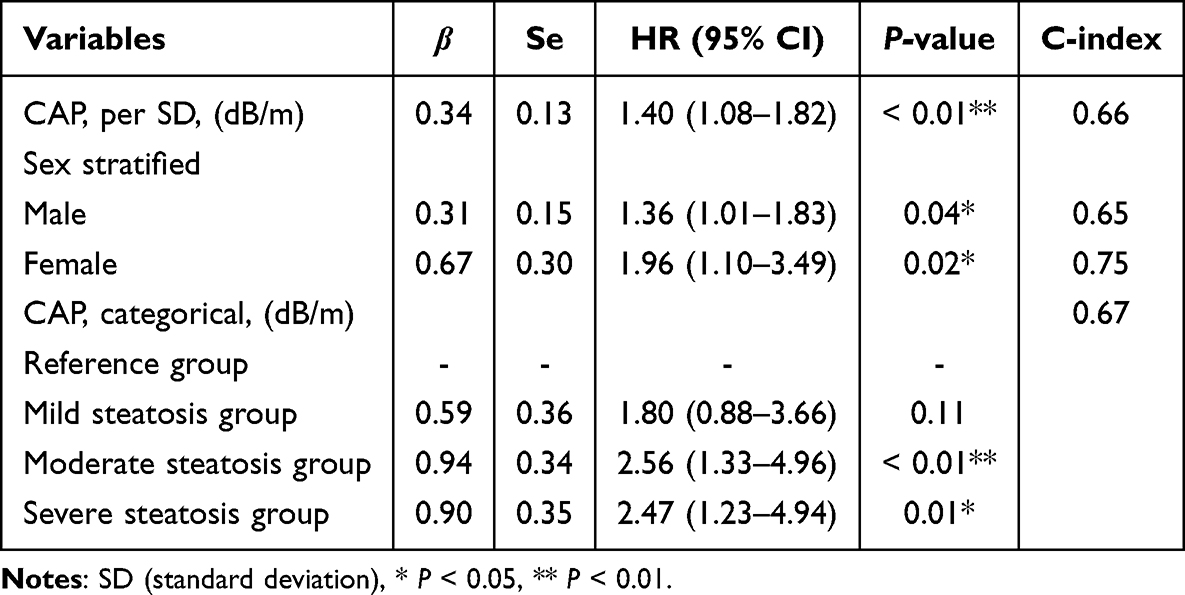 |
Table 2 Multivariable Cox Regression Analysis for the Association Between CAP and the Risk of GSD |
RCS analysis (Figure 2) revealed a strictly linear dose-response relationship between CAP and GSD risk (P for non-linearity = 0.43), with no threshold effect observed. The risk of GSD increased steadily as CAP values rose.
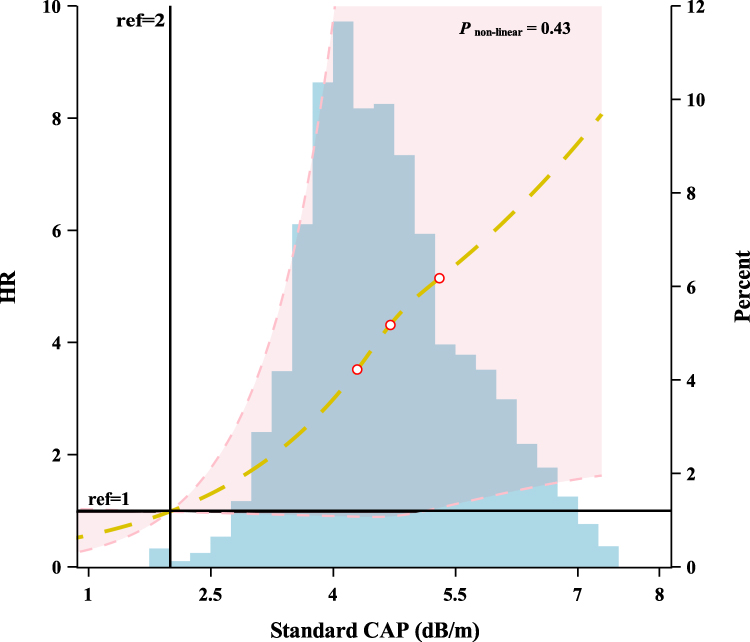 |
Figure 2 Exploring the non-linear association between the continuous variable CAP and the risk of GSD. |
CAP Trajectory Patterns and GSD Risk
Among 412 participants with ≥3 CAP measurements, GBTM identified two distinct trajectory groups (Figure 3A): Group 1 (“persistently low CAP”, 61.41%, n = 253) with a median CAP of 240 dB/m (IQR = 52 dB/m) and Group 2 (“persistently high CAP”, 38.59%, n = 159) with a median CAP of 314 dB/m (IQR = 57 dB/m). The model evaluation parameters for both groups performed well, with the specific values as follows: Group 1 had an odds of correct classification (OCC) of 7.9, average posterior probability (Avepp) of 92.6, Pj of 61.4, and Πj of 61.1 and Group 2 had an OCC of 12.7, Avepp of 89.0, Pj of 38.6, and Πj of 38.9. For more model information, please refer to the Supplementary Table 1.
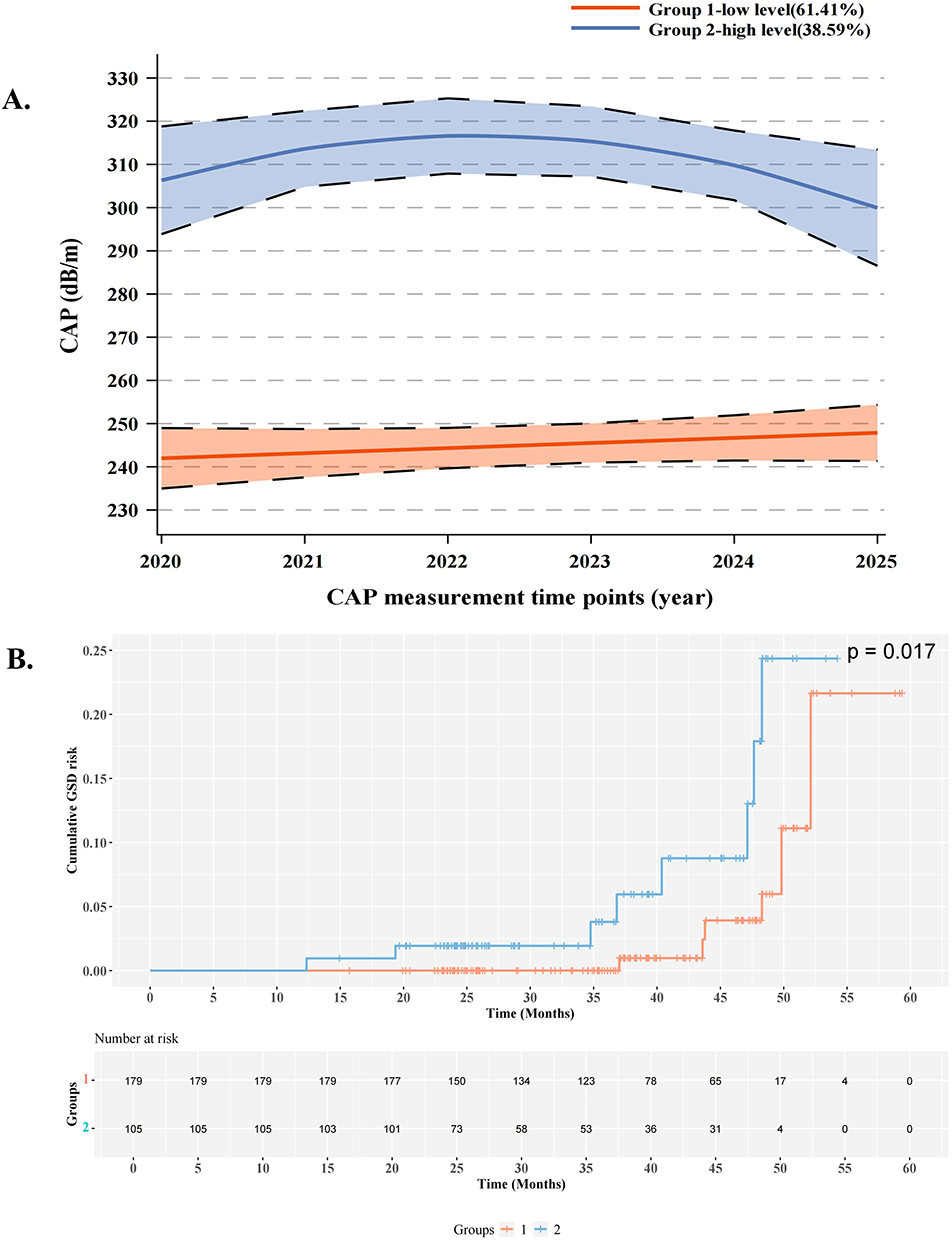 |
Figure 3 CAP trajectory groups and their association with GSD risk. (A) Participants were classified into two distinct groups: Group 1 (low-level CAP, 61.41%) and Group 2 (high-level CAP, 38.59%). (B) Cumulative incidence of GSD across CAP trajectory groups. Group 2 (high-level CAP, 38.59%) showed significantly higher risk of GSD compared to Group 1 (low-level CAP, 61.41%). |
The cumulative incidence of GSD was significantly higher in Group 2 than in Group 1 (log-rank P = 0.017, Figure 3B). In the fully adjusted Cox model, Group 2 had a 3.85-fold higher risk of GSD than Group 1 (adjusted HR = 3.85, 95% CI: 1.10–13.54, P = 0.04).
Sensitivity Analysis
In gender-stratified analyses (Table 2), the association between CAP and GSD was stronger in women (per 1-SD increase: adjusted HR = 1.96, 95% CI: 1.10–3.49, P = 0.02) than in men (per 1-SD increase: adjusted HR = 1.36, 95% CI: 1.01–1.83, P =0.04). TSA (Supplementary Figure 2) indicated that the cumulative Z-curve crossed the trial sequential monitoring boundary and exceeded the required information size (RIS) line, confirming that the sample size was sufficient to draw reliable conclusions about the CAP-GSD association (alpha = 0.05, power = 0.80). Excluding participants with baseline metabolic diseases (diabetes, hypertension, dyslipidemia) or those with follow-up duration less than 10 months did not substantially change the results (all P < 0.01), indicating the robustness of the findings (Supplementary Tables 2 and 3).
Mediation Analysis
Mediation analysis (Figure 4) showed that only HDL-C mediated the association between CAP and GSD. Specifically, the effect size of this mediating effect was 3.28*10−4, accounting for 27.49% of the total effect (P < 0.01). No significant mediating effects were observed for TC (PM = −3.64%, P > 0.05), TG (PM = 5.08%, P > 0.05), or LDL-C (PM = −1.45%, P > 0.05).
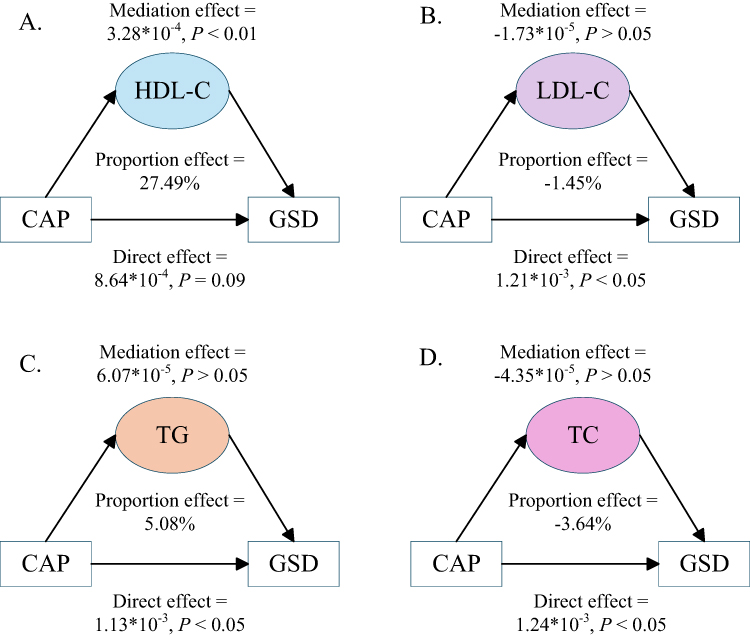 |
Figure 4 Mediation analysis of the association between CAP and GSD risk through blood lipids. (A) Mediation analysis of the association between CAP and GSD through HDL-C. The mediation effect of HDL-C was 3.28*10−4 (P < 0.01), accounting for 27.49% of the total effect. The direct effect of CAP on GSD was 8.64*10−4 (P = 0.09). (B) Mediation analysis of the association between CAP and GSD through LDL-C. The mediation effect of LDL-C was −1.73*10−5 (P > 0.05), accounting for −1.45% of the total effect. The direct effect of CAP on GSD was 1.21*10−3 (P < 0.05). (C) Mediation analysis of the association between CAP and GSD through TG. The mediation effect of TG was 6.07*10−5 (P > 0.05), accounting for 5.08% of the total effect. The direct effect of CAP on GSD was 1.13*10−3 (P < 0.05). (D) Mediation analysis of the association between CAP and GSD through TC. The mediation effect of TC was −4.35*10−5 (P > 0.05), accounting for −3.64% of the total effect. The direct effect of CAP on GSD was 1.24*10−3 (P < 0.05). |
Discussion
In the present study, we demonstrated a linear association between CAP and GSD based on a large health check-up dynamic cohort for the first time. This association was more prominent in females, consistent with gender-specific metabolic effects. Mediation analysis revealed that HDL-C mediated 27.49% of the total effect. Notably, only moderate to severe hepatic steatosis was significantly associated with an increased risk of GSD. Furthermore, GBTM identified two distinct trajectories of CAP: one persistently high and the other consistently low. Participants with a persistently high CAP had a 3.85-fold greater risk of developing GSD than those in the low group.
Large cohort studies have demonstrated that GSD is an independent risk factor for NAFLD, with cholecystectomy showing an even stronger association. This suggests that GSD may exacerbate NAFLD progression through bile acid metabolism dysregulation. However, GSD did not significantly affect all-cause mortality in NAFLD patients, indicating that their association may stem more from shared metabolic risks rather than a direct causal relationship.29 Gene related to lipid metabolism are significantly enriched in patients with NAFLD, and dysregulated lipid metabolism is considered a core pathological mechanism of the disease,30 with disturbances in cholesterol31 and phospholipid32 metabolism playing a critical role in its progression. Additionally, in NAFLD, hepatic lipid accumulation induces mitochondrial oxidative stress, generating excessive reactive oxygen species (ROS), which in turn trigger the release of pro-inflammatory cytokines such as IL-6, exacerbating inflammation and fibrosis.33 Notably, IL-6 may reciprocally increase the risk of gallstone formation, thereby establishing a pathological cycle of steatosis-inflammation-GSD progression.34
CAP, implemented in the FibroScan system, quantifies the attenuation of ultrasound beams in liver tissue35 and has demonstrated high concordance with liver steatosis grading.36 Abdominal obesity and insulin resistance, key determinants of CAP in patients with metabolic dysfunction, are also shared pathogenic factors for both GSD and NAFLD.37 Previous studies have applied CAP to predict metabolic syndrome risk in chronic kidney disease38 and to stratify metabolic abnormalities in gestational diabetes mellitus. Patients with CAP values ≥ 233.5 dB/m exhibited significantly higher pre-pregnancy BMI and insulin therapy rates compared to those with lower values,39 further underscoring the link between metabolic factors and CAP.
However, no studies have yet explored the association between CAP and GSD. Given the interplay between hepatic steatosis and GSD in lipids metabolic mechanisms, inflammatory pathways, and bile acid metabolism-and considering CAP’s established reliability as a noninvasive indicator for liver steatosis-we hypothesize that CAP values may significantly correlate with GSD risk and this association may be mediated by cascades driven by dysregulation of metabolic-related molecules such as TC, TG, HDL-C, LDL-C.
Given the large number of covariates, collinearity analysis and VIF calculation were performed to avoid interference from multicollinearity on model accuracy. Although collinearity analysis showed that the correlation coefficient between LDL-C and TC was greater than 0.6, their VIF values were both less than 2. Moreover, after excluding LDL-C or TC individually, the association strength between CAP and GSD remained essentially unchanged compared with the full model that included both variables (Supplementary Table 4). For the established CAP change trajectory model, we conducted multi-dimensional evaluations. For example, OCC greater than 5 indicates good model discrimination, Avepp exceeding 0.7 suggests good model fit, Pj represents the population distribution proportion derived from the posterior probabilities of group members, and Πj denotes the population distribution proportion based on group member probabilities. The closer these two values are, the better the model fits the data. The present study demonstrated that mild hepatic steatosis was not associated with an elevated risk of GSD, suggesting that this population should not be prioritized for GSD prevention and control, nor require clinical intervention. These findings provide a rationale for implementing threshold-based strategies in the clinical risk stratification and management of GSD. In the mediation analysis, HDL-C mediated 27.49% of the total effect, a proportion that is considered substantial in observational mediation studies. This finding suggests that lipid metabolism, particularly the reverse cholesterol transport pathway, may serve as one of the core biological bridges linking CAP to GSD. Notably, despite the significant mediating role of HDL-C, approximately 73% of the total effect remains unexplained, indicating that other important metabolic pathways are likely involved in this pathophysiological process-such as inflammation and insulin resistance. Future basic studies may be conducted to further explore the underlying mechanisms. In sensitivity analyses, sex-stratified analysis revealed a stronger association between CAP and GSD in females than in males, a finding consistent with previous studies identifying female sex as a risk factor for GSD.40 In the TSA analysis, we set the type I error probability to not exceed 5%, the power to 80%, and selected the low-bias impact. It was found that the Z-curve crossed the conventional threshold and exceeded the RIS line, indicating that our findings are robust and reliable.
This study has several strengths. First, by incorporating time factors into the analysis of CAP changes, we innovatively explored the differential impacts of different CAP change trajectory patterns on GSD incidence. Second, the cohort design, enables a higher level of causal inference. Third, we investigated the dose-response relationship between CAP and GSD, examining whether special associations such as U-shaped or J-shaped curves exist. Last, this study confirms for the first time that different degrees of CAP are differentially associated with GSD risk. Only moderate-to-severe CAP abnormalities significantly increase the risk of GSD, while mild CAP abnormalities show no statistically significant association with GSD onset. This finding provides an important theoretical basis for the precise allocation of clinical resources, allowing for targeted optimization of screening strategies for high-risk populations and avoiding excessive medical intervention in individuals with mild CAP abnormalities.
Several limitations should be acknowledged. First, the study population had an imbalanced gender distribution. Theoretically, this may reduce the accuracy of effect estimates in one gender group and limit the generalizability of gender-specific findings, as the sample structure deviates from that of the general population. To address this, we performed gender-stratified analyses, which revealed generally consistent association trends in both groups, suggesting that the core findings remain stable despite the gender imbalance. Furthermore, gender was adjusted as a key covariate in the multivariable Cox regression model to minimize its potential confounding effect. Nonetheless, future studies incorporating more balanced gender distributions are warranted to enhance the generalizability of the results across gender groups. Second, we acknowledge that, due to the limitations of the data source, the mean follow-up duration in this study was relatively short for a chronic disease like GSD. However, we conducted various sensitivity analyses to verify the robustness of the findings. In the future, when data with larger sample size and longer follow-up period can be available, we plan to reassess the association between CAP and GSD.
Conclusion
A dynamic cohort study conducted on a population undergoing physical examinations revealed that the CAP exerts a positive, linear influence on the risk of GSD. Specifically, for each SD increase in CAP, the risk of GSD rose by 40% and this association was found to be more prominent in women. When compared to the normal CAP group, the risk of GSD was 2.56 times higher in the moderate CAP group and 2.47 times higher in the severe CAP group, respectively. Notably, no significant association was observed between mildly elevated CAP and GSD. GBTM identified two distinct longitudinal trajectories of CAP. In a fully adjusted Cox regression model using trajectory groups as the independent variable, the high-level CAP group (Group 2) exhibited a 3.85-fold increased risk of GSD compared to the low-level CAP group (Group 1), with a prediction consistency of 87%. Additionally, the cumulative risk curves for the two groups showed a statistically significant difference. Further mediation analysis indicated that HDL-C mediated 27.49% of CAP effect on GSD.
Abbreviations
CAP, Controlled attenuation parameter; GSD, gallstone disease; TSA, trial-sequential analysis; GBTM, group-based trajectory model; NAFLD, non-alcoholic fatty liver disease; BMI, body mass index; FBG, fasting blood glucose; BP, blood pressure; TC, total cholesterol; TG, triglycerides; HDL-C, high-density lipoprotein cholesterol; LDL-C, low-density lipoprotein cholesterol; ALT, alanine transaminase; AST, aspartate transaminase; BUN, blood urea nitrogen; Cr, creatinine; UA, uric acid; SD, standard deviation; IQR, interquartile range; RCS, restricted cubic spline; BIC, Bayesian information criterion; VIF, variance inflation factor; OCC, odds of correct classification; Avepp, average posterior probability; RIS, required information size; HIF-1α, hypoxia-inducible factor 1α; IL-6, Interleukin-6; ROS, reactive oxygen species; COPD, chronic obstructive pulmonary disease; SCD, skin-capsular distance.
Data Sharing Statement
The datasets used and analyzed during the current study are available from the corresponding author on reasonable request.
Funding
This research was supported by the Natural Science Foundation of Sichuan Province Project (2026NSFSC0589, 2023NSFSC1927); the National Natural Science Foundation of China (81903398); the research start- up fund for the introduction of talents of Sichuan University (YJ2021112); Medical Youth Innovation Research Project of Sichuan Province (Q21016); “From 0 to 1” Innovation Project, Sichuan University (2023SCUH0026); Sichuan Provincial Science and Technology Department 2023 Central Guide Local Project (2023ZYD0097); the Sichuan Tianfu Emei Plan for Young Talents (No.Emei-1841); the Sichuan Health Commission’s Popularization and Application Project (No.2025-2401); Research Project on High- Quality Development of Clinical Nutrition Work (2025-3-Y-15); and Medical Research Project of Chengdu City 2025129.
Disclosure
The authors report no conflicts of interest in this work.
References
1. Wang X, Yu W, Jiang G, et al. Global epidemiology of gallstones in the 21st century: a systematic review and meta-analysis. Clin Gastroenterol Hepatol. 2024;22(8):1586–12. doi:10.1016/j.cgh.2024.01.051
2. Fairfield CJ, Drake TM, Pius R, et al. Genome-wide analysis identifies gallstone-susceptibility loci including genes regulating gastrointestinal motility. Hepatology. 2022;75(5):1081–1094. doi:10.1002/hep.32199
3. Man S, Gao Y, Lv J, et al. Metabolically healthy obesity was significantly associated with increased risk of gallstones. Eur J Endocrinol. 2022;186(2):275–283. doi:10.1530/EJE-21-0802
4. Zhang Q, Li Y, Hu H, et al. Serum arsenic augments gallstone risk in Henan rural cohort with multiple metal exposure. Sci Total Environ. 2024;952:175991. doi:10.1016/j.scitotenv.2024.175991
5. Zuo D, Sang M, Sun X, Chen G, Ji K. Inverse association between dietary fiber intake and gallstone disease in U.S. adults: a cross-sectional study from the NHANES database. Front Nutr. 2025;12:1624173. doi:10.3389/fnut.2025.1624173
6. Hu H, Shao W, Liu Q, et al. Gut microbiota promotes cholesterol gallstone formation by modulating bile acid composition and biliary cholesterol secretion. Nat Commun. 2022;13(1):252. doi:10.1038/s41467-021-27758-8
7. Jiang GH, Li S, Li HY, et al. Bidirectional associations among gallstone disease, non-alcoholic fatty liver disease, kidney stone disease. World J Gastroenterol. 2024;30(46):4914–4928. doi:10.3748/wjg.v30.i46.4914
8. Sheibani A, Reihani H, Shoja A, Gharibvand MM, Hanafi MG. Gallstones increase the risk of nonalcoholic fatty liver: a case-control study. Health Sci Rep. 2024;7(11):e70068. doi:10.1002/hsr2.70068
9. Luo M, Li T, Sang H. The role of hypoxia-inducible factor 1α in hepatic lipid metabolism. J Mol Med. 2023;101(5):487–500. doi:10.1007/s00109-023-02308-5
10. Zhang C, Dai W, Yang S, Wu S, Kong J. Resistance to cholesterol gallstone disease: hepatic cholesterol metabolism. J Clin Endocrinol Metab. 2024;109(4):912–923. doi:10.1210/clinem/dgad528
11. Myers RP, Pollett A, Kirsch R, et al. Controlled attenuation parameter (CAP): a noninvasive method for the detection of hepatic steatosis based on transient elastography. Liver Int. 2012;32(6):902–910. doi:10.1111/j.1478-3231.2012.02781.x
12. Cao YT, Xiang LL, Qi F, Zhang YJ, Chen Y, Zhou XQ. Accuracy of controlled attenuation parameter (CAP) and liver stiffness measurement (LSM) for assessing steatosis and fibrosis in non-alcoholic fatty liver disease: a systematic review and meta-analysis. EClinicalMedicine. 2022;51:101547. doi:10.1016/j.eclinm.2022.101547
13. Ferraioli G, Tinelli C, Lissandrin R, et al. Interobserver reproducibility of the controlled attenuation parameter (CAP) for quantifying liver steatosis. Hepatol Int. 2014;8(4):576–581. doi:10.1007/s12072-014-9573-1
14. Huijbers A, Korzilius JW, Gillis VELM, van der Graaf M, Wanten GJA. The diagnostic value of controlled attenuation parameter (CAP) and magnetic resonance imaging derived proton density fat fraction (MRI-PDFF) for the evaluation of intestinal failure-associated liver steatosis among adult chronic intestinal failure patients. Clin Nutr ESPEN. 2025;69:634–643. doi:10.1016/j.clnesp.2025.08.016
15. Eilenberg M, Munda P, Stift J, et al. Accuracy of non-invasive liver stiffness measurement and steatosis quantification in patients with severe and morbid obesity. Hepatobiliary Surg Nutr. 2021;10(5):610–622. doi:10.21037/hbsn-20-787
16. Li Z, Liu R, Gao X, et al. The correlation between hepatic controlled attenuation parameter (CAP) value and insulin resistance (IR) was stronger than that between body mass index, visceral fat area and IR. Diabetol Metab Syndr. 2024;16(1):153. doi:10.1186/s13098-024-01399-5
17. Li S, Wu X, Yu J, et al. Correlation between thyroid hormone and controlled attenuation parameters: a cross-sectional population-based study. Diabetes Metab Syndr Obes. 2024;17:4777–4787. doi:10.2147/DMSO.S490347
18. Fu Y, Zhang S, Zeng X, Qin H. Association between alpha-1-acid glycoprotein and non-alcoholic fatty liver disease and liver fibrosis in adult women. Metabolites. 2025;15(4):280. doi:10.3390/metabo15040280
19. Sardjan J, Lesmana CRA, Rusdi L, et al. Correlation between controlled attenuation parameter values with SYNTAX score in patients with significant coronary artery disease. Sci Rep. 2024;14(1):15382. doi:10.1038/s41598-024-63792-4
20. Zheng D, Liu X, Zeng W, Zhou W, Zhou C. Association of hepatic steatosis and liver fibrosis with chronic obstructive pulmonary disease among adults. Sci Rep. 2024;14(1):10822. doi:10.1038/s41598-024-61696-x
21. Soomro U, Abbas G, Aslam M, et al. Frequency of gallstones in patients with non-alcoholic fatty liver disease. Cureus. 2025;17(6):e85508. doi:10.7759/cureus.85508
22. Li R, Wang B, Chen X, Cai A, Cao D, Zhou J. Cross-sectional association between gallstone disease and nonalcoholic fatty liver disease: exploring the mediating roles of hematological and biochemical markers. Medicine. 2026;105(8):e47759. doi:10.1097/MD.0000000000047759
23. Fujita N, Yasuda I, Endo I, et al. Evidence-based clinical practice guidelines for cholelithiasis 2021. J Gastroenterol. 2023;58(9):801–833. doi:10.1007/s00535-023-02014-6
24. Oeda S, Tanaka K, Oshima A, Matsumoto Y, Sueoka E, Takahashi H. Diagnostic accuracy of fibroscan and factors affecting measurements. Diagnostics. 2020;10(11):940. doi:10.3390/diagnostics10110940
25. Ali A, Perveen S, Khan I, Ahmed T, Nawaz A, Rab A. Symptomatic gallstones in young patients under the age of 30 years. Cureus. 2021;13(11):e19894. doi:10.7759/cureus.19894
26. Nagin DS, Jones BL, Elmer J. Recent advances in group-based trajectory modeling for clinical research. Annu Rev Clin Psychol. 2024;20(1):285–305. doi:10.1146/annurev-clinpsy-081122-012416
27. Tönnies T, Schlesinger S, Lang A, Kuss O. Mediation analysis in medical research. Dtsch Arztebl Int. 2023;120(41):681–687. doi:10.3238/arztebl.m2023.0175
28. Payne T, Moran B, Loadsman J, Marschner I, McCulloch T, Sanders RD. Importance of sequential methods in meta-analysis: implications for postoperative mortality, delirium, and stroke management. Br J Anaesth. 2023;130(4):395–401. doi:10.1016/j.bja.2023.01.011
29. Konyn P, Alshuwaykh O, Dennis BB, Cholankeril G, Ahmed A, Kim D. Gallstone disease and its association with nonalcoholic fatty liver disease, all-cause and cause-specific mortality. Clin Gastroenterol Hepatol. 2023;21(4):940–948.e2. doi:10.1016/j.cgh.2022.04.043
30. Smith KR, Wang W, Miller MR, et al. GPAT1 deficiency in mice modulates NASH progression in a model-dependent manner. Cell Mol Gastroenterol Hepatol. 2024;17(2):279–291. doi:10.1016/j.jcmgh.2023.10.002
31. Li H, Yu XH, Ou X, Ouyang XP, Tang CK. Hepatic cholesterol transport and its role in non-alcoholic fatty liver disease and atherosclerosis. Prog Lipid Res. 2021;83:101109. doi:10.1016/j.plipres.2021.101109
32. Shao C, Ye J, Dong Z, et al. Phospholipid metabolism-related genotypes of PLA2R1 and CERS4 contribute to nonobese MASLD. Hepatol Commun. 2024;8(6):e0388. doi:10.1097/HC9.0000000000000388
33. Allameh A, Niayesh-Mehr R, Aliarab A, Sebastiani G, Pantopoulos K. Oxidative stress in liver pathophysiology and disease. Antioxidants. 2023;12(9):1653. doi:10.3390/antiox12091653
34. Liu Z, Kemp TJ, Gao YT, et al. Association of circulating inflammation proteins and gallstone disease. J Gastroenterol Hepatol. 2018;33(11):1920–1924. doi:10.1111/jgh.14265
35. Ferraioli G, Soares Monteiro LB. Ultrasound-based techniques for the diagnosis of liver steatosis. World J Gastroenterol. 2019;25(40):6053–6062. doi:10.3748/wjg.v25.i40.6053
36. de Lédinghen V, Vergniol J, Foucher J, Merrouche W, le Bail B. Non-invasive diagnosis of liver steatosis using controlled attenuation parameter (CAP) and transient elastography. Liver Int. 2012;32(6):911–918. doi:10.1111/j.1478-3231.2012.02820.x
37. Bianco C, Pelusi S, Margarita S, et al. Predictors of controlled attenuation parameter in metabolic dysfunction. United Euro Gastroenterol J. 2024;12(3):364–373. doi:10.1002/ueg2.12513
38. Yoon CY, Lee M, Kim SU, et al. Fatty liver associated with metabolic derangement in patients with chronic kidney disease: a controlled attenuation parameter study. Kidney Res Clin Pract. 2017;36(1):48–57. doi:10.23876/j.krcp.2017.36.1.48
39. Chai TY, Deng D, Byth K, George J, Pasupathy D, Cheung NW. The prevalence of metabolic dysfunction-associated fatty liver disease and its association on adverse pregnancy outcomes in women with gestational diabetes mellitus. Diabetes Res Clin Pract. 2022;191:110038. doi:10.1016/j.diabres.2022.110038
40. Patel H, Jepsen J. Gallstone disease: common questions and answers. Am Fam Physician. 2024;109(6):518–524.
 © 2026 The Author(s). This work is published and licensed by Dove Medical Press Limited. The
full terms of this license are available at https://www.dovepress.com/terms
and incorporate the Creative Commons Attribution
- Non Commercial (unported, 4.0) License.
By accessing the work you hereby accept the Terms. Non-commercial uses of the work are permitted
without any further permission from Dove Medical Press Limited, provided the work is properly
attributed. For permission for commercial use of this work, please see paragraphs 4.2 and 5 of our Terms.
© 2026 The Author(s). This work is published and licensed by Dove Medical Press Limited. The
full terms of this license are available at https://www.dovepress.com/terms
and incorporate the Creative Commons Attribution
- Non Commercial (unported, 4.0) License.
By accessing the work you hereby accept the Terms. Non-commercial uses of the work are permitted
without any further permission from Dove Medical Press Limited, provided the work is properly
attributed. For permission for commercial use of this work, please see paragraphs 4.2 and 5 of our Terms.