Back to Journals » Cancer Management and Research » Volume 14
Contrast-Enhanced CT-Based Radiomics for the Differentiation of Nodular Goiter from Papillary Thyroid Carcinoma in Thyroid Nodules
Authors Li Z ![]() , Zhang H
, Zhang H ![]() , Chen W
, Chen W ![]() , Li H
, Li H ![]()
Received 27 December 2021
Accepted for publication 1 March 2022
Published 14 March 2022 Volume 2022:14 Pages 1131—1140
DOI https://doi.org/10.2147/CMAR.S353877
Checked for plagiarism Yes
Review by Single anonymous peer review
Peer reviewer comments 2
Editor who approved publication: Dr Sanjeev K. Srivastava
Zhenyu Li, Haiming Zhang, Wenying Chen, Hengguo Li
Medical Imaging Center, The First Affiliated Hospital of Jinan University, Guangzhou, 510630, People’s Republic of China
Correspondence: Hengguo Li, Email [email protected]
Background: Papillary thyroid carcinoma (PTC) and nodular goiter (NG) represent the most commonly malignant and benign diseases of thyroid nodules and are often confused in diagnosis. CT examination has a certain diagnostic value for the diagnosis of suspected malignant thyroid nodules. The application of machine learning to radiomics features provides a new diagnostic approach, which has been widely used in ultrasound examination of the thyroid, but there are few literatures on CT examination.
Purpose: To explore the efficacy of a diagnostic model aided by machine learning for preoperative differentiation of nodular goiter and papillary thyroid carcinoma thyroid nodules on the basis of 3D arterial-phase contrast-enhanced computed tomography (CECT) features.
Materials and Methods: We collected the data of 193 NG and 214 PTC thyroid nodules from 407 patients in CT examinations. Together with the pathologist findings and radiology diagnosis, we built a radiomics model using the 1218 features extracted from the arterial phase of CECT images. By comparing the diagnostic performance of the radiomics model with that of the clinical diagnosis, we assessed the performance of the radiomics model.
Results: The radiomics model was developed based on multivariable logistic regression with the optimal 12 radiomics features after feature dimension reduction. The radiomics model performed well on the classification accuracy of the PTC and NG thyroid nodules in the training group and validation group.
Conclusion: The radiomics model based on the 3D arterial phase of CECT features performed better than the group of experienced radiologists in differentiating NG and PTC thyroid nodules.
Keywords: radiomics, computed tomography, CT, nodular goiter, papillary thyroid carcinoma, differential diagnosis
Background
Thyroid nodules are defined as discrete lesions within the thyroid gland that are radiologically distinct from the surrounding thyroid parenchyma.1 With the development of technology, the detection rate of asymptomatic thyroid nodules has significantly increased in radiological evaluations over the past three decades.2 Thyroid nodules are frequent clinical diagnoses, and approximately 90% of them are benign, with nodular goiters (NGs) being the most common cases. Only a small number of asymptomatic thyroid nodules are malignant. Among the malignant thyroid nodules, papillary thyroid carcinoma (PTC) is the most common subtype with the best overall prognosis.
In the past 40 years, the incidence rate of thyroid cancer has surged in the United States, largely driven by the increased cases of papillary thyroid cancer.3 This phenomenon has caused extensive concerns. Current data on the biology of thyroid nodules show that benign thyroid nodules will not transform into malignant nodules and that a nodule can be either benign or malignant.4
The treatment of benign thyroid nodules mainly includes reassuring patients and follow-up observations, while malignant nodules should be resectioned.5 Patients could receive incorrect treatment due to misdiagnosis, causing pain and suffering for the patients both physically and psychologically, as well as a heavier economic burden. When a thyroid nodule is detected, with any method, the priority is to decide whether it is benign or malignant if it is to be reported.6
Ultrasound (US) examination is currently the first option for diagnosing thyroid diseases such as thyroid nodules, and there are seven widely used risk grading systems. However, the distribution of the same group of thyroid nodules varies under certain risk levels of different ultrasound risk stratification systems.7,8 The new guidelines strongly recommend the use of contrast-enhanced computed tomography (CECT) as an adjunct to US for patients with the clinically suspected advanced disease before surgery to improve the accuracy of preoperative diagnosis.1 It points out that the intravenous contrast of cervical CT can generally be removed within 4 to 6 weeks and will not have an apparent negative impact on subsequent RAI testing or treatment.1 Fine needle aspiration biopsy (FNAB), as an invasive examination, is the gold standard for the diagnosis of thyroid malignant tumors. A subset of cases are still considered uncertain and require further confirmation of diagnostic surgeries.9,10 In addition, it is too burdensome to biopsy all patients with thyroid nodules.
It is a common problem for radiologists to distinguish between benign and malignant thyroid nodules in their clinical work. PTC and NG represent the most commonly malignant and benign diseases of thyroid nodules with many common imaging characteristics, and they are often confused in diagnosis. As radiologists need to read a large number of medical images in clinical work, they are prone to missed diagnosis and misdiagnosis under such work burden. In addition, diagnostic quality is influenced by radiologist-specific factors, such as radiologists’ subspecialty training and work experience.11 Therefore, we need more stable and less subjective diagnostic methods to identify malignant thyroid nodules to reduce the need for diagnostic surgery. To resolve this problem, we built a diagnostic model based on 3D arterial phase contrast-enhanced computed tomography features to differentiate PTC from NG thyroid nodules.
Radiomics is a new field in medical imaging research and can be better applied to the study of heterogeneous intratumoral changes. As a noninvasive method, it extracts high-dimensional sets of medical images invisible to the naked eye and then quantifies them. These characteristics of radiomics are considered quantitative markers to build models and have shown great potential for application to the diagnosis, treatment, and prognosis of diseases.12 There is a good prospect of applying CT radiomics analysis to lesion characteristics, pretreatment, tumor evaluation, and curative effect evaluation of various tumor types.13 The radiomics features based on three-dimensional images are calculated and extracted from all levels of lesions in CT images, which has been explored in previous studies.14,15 3D CT radiomics features have better stability and can better reflect the comprehensive information of lesions than single-layer cross-sectional images. The performance of radiomics models can be greatly influenced by different feature selection and classification approaches.
In this study, we compared the performances of different machine learning classifiers to find the best classifier and established a radiomics model based on the 3D arterial phase of CECT features, to distinguish NG and PTC thyroid nodules before surgery.
Materials and Methods
Patients and Nodules
This study was approved by the ethics committee of the First Affiliated Hospital of Jinan University, and the requirement for informed consent was waived because this was a retrospective and observational study. The study was conducted in accordance with the Declaration of Helsinki and we confirmed that the data was anonymized and maintained with confidentiality.
Thyroid nodules from patients with pathologically confirmed PTC or NG from November 2013 to March 2019 in our institution were selected for inclusion in this study, and in each case, a nodule was selected for further analysis. The inclusion criteria were as follows: (1) the maximum diameter of the target nodule should be less than 3 cm; (2) the patient has no history of thyroid surgery; (3) the target nodule pathologically confirmed in preoperative CECT examination can be found; (4) complete and standard CECT images should be available; and (5) the target nodule should be either NG or PTC confirmed in pathology reports. The exclusion criteria were as follows: (1) the target nodule could not be clearly distinguished; (2) there were artifacts in the images (often coming from the collarbone); and (3) the enhanced CT images were not in the arterial phase. All samples were randomly divided into a training group and a validation group (at a ratio of 7:3). It should be pointed out that most patients with nodular goiter need no surgery. In our study, nodular goiter thyroid nodules were surgically treated because they were clinically considered malignant or potentially malignant before the operation. In addition, most patients with nodular goiter generally did not undergo CECT after ultrasound diagnosis, and it was more difficult to give an accurate diagnosis to those who needed further CECT scans. Therefore, from this perspective, these nodules were more difficult to diagnose than a clinically typical nodular goiter. This difficulty was why the ratio of nodular goiter to thyroid papillary carcinoma and their incidence rate in the population differed in the cases we included.
CECT Image Acquisition
All CT images were acquired digitally from the picture archiving and communication system (PACS) database. Image scanning was progressed within two different multidetector computed tomography (MDCT) systems (Toshiba Aquilion ONE, 16 and 320 row). The acquisition parameters were as follows: 300 mAs, 120 kV, collimating width = 0.5 mm; slice thickness =3 mm, pitch =0.8; matrix = 512×512 mm, field of view (FOV) = 280×280 mm. After an intravenous injection of the mixture of 1.5 mL/kg iodine, contrast injection of 300–370 mg/mL, Bracco Sine Pharma and 20 mL saline at a speed of 2~3 mL/s with a contrast medium syringe (Dual shot alpha, Nemoto kyorindo CO. Ltd), the CECT examination was delayed for 25 to 30 seconds. Patients were scanned in the supine position from the oropharynx to the superior edge of the clavicle. All patients signed an informed consent form before examination, and an iodine allergy test was performed on each patient before examination.
Nodule Segmentation, Feature Extraction, and Preprocessing
Original anonymized CT images in Digital Imaging and Communications in Medicine (DICOM) image format were exported for nodule segmentation, feature extraction, and preprocessing. We used ITK-SNAP software16 (www.itksnap.org) for manual segmentation. The contours of the nodules were manually delineated by two trained radiologists as regions of interest (ROIs) from the whole layers of selected nodules in CECT images. The ROI’s standards were set by both radiologists. Subsequently, ROIs from 407 thyroid nodules (including 193 NGs and 214 PTCs) were determined. The clinical characteristics and diagnostic information of patients with thyroid nodules in our database are shown in Table 1. The radiomics model extracted 1218 features from each nodule on 3D-CECT images by the PyRadiomics toolkit.17 The features are concerned with shape and intensity, gray level co-occurrence matrix (GLCM), gray level dependence matrix (GLDM), gray-level run length matrix (GLRLM), gray level size zone matrix (GLSZM), wavelet, Laplacian of Gaussian (LoG), neighborhood gray tone difference matrix (NGTDM), wavelet, Laplacian of Gaussian (LoG), and neighborhood gray tone difference matrix (NGTDM). To ensure the repeatability of the results, z score normalization and resampling were performed during data collection and image screening. Intragroup and intergroup correlation coefficients (ICCs) were used to evaluate the repeatability of interobserver and interobserver ROI descriptions. Twenty-one nodules were randomly selected and independently segmented by two radiologists to evaluate the reproducibility between observers. To assess the repeatability within the observers, the reader repeated the same manual operation two weeks later. An ICC greater than 0.75 is considered an indication of good consistency of repeatability. The workflow of our study is shown in Figure 1.
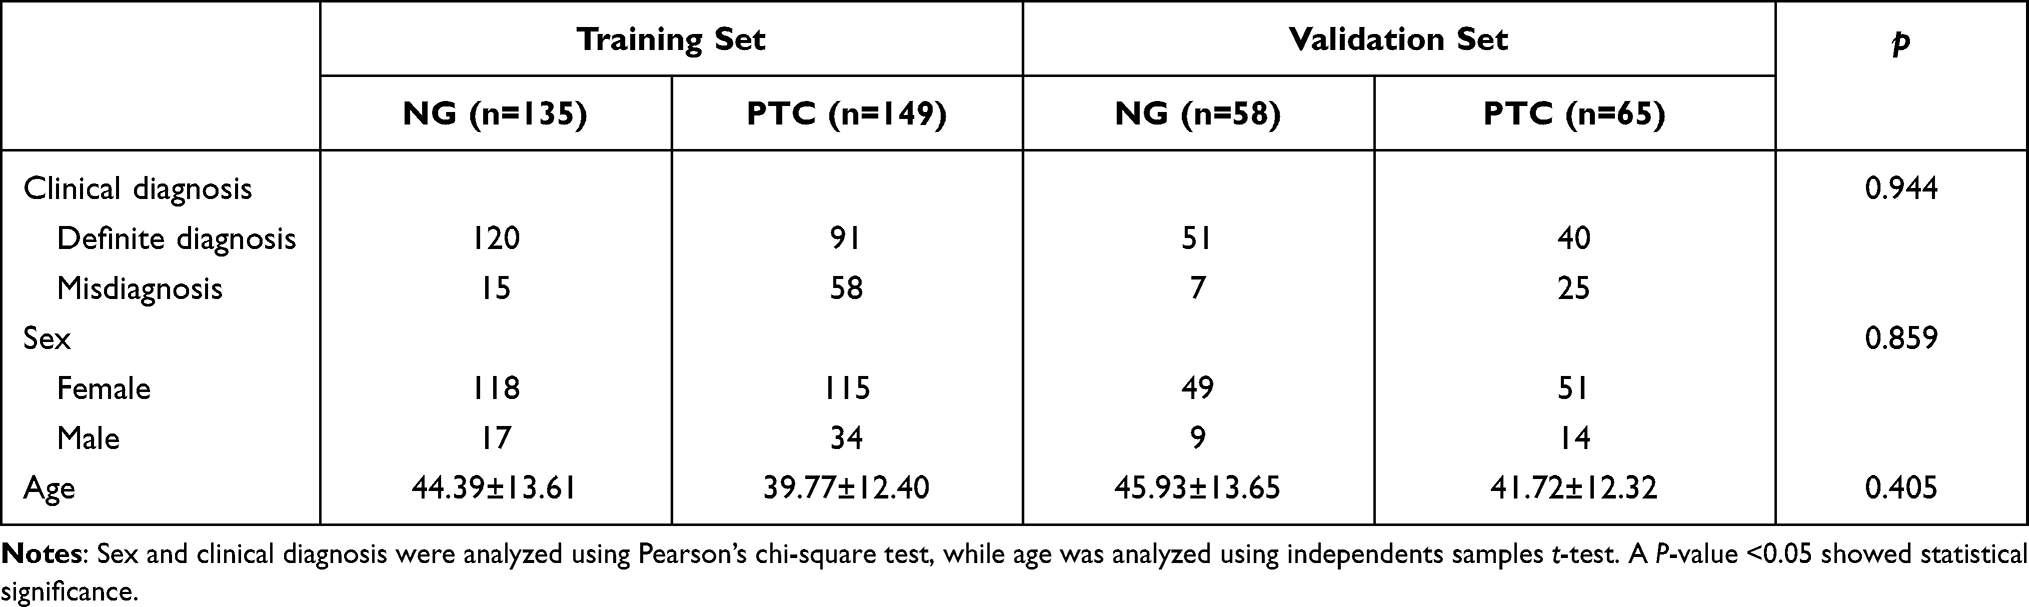 |
Table 1 Conventional Clinical Diagnosis and Histology of Patients in the Training and Validation Sets |
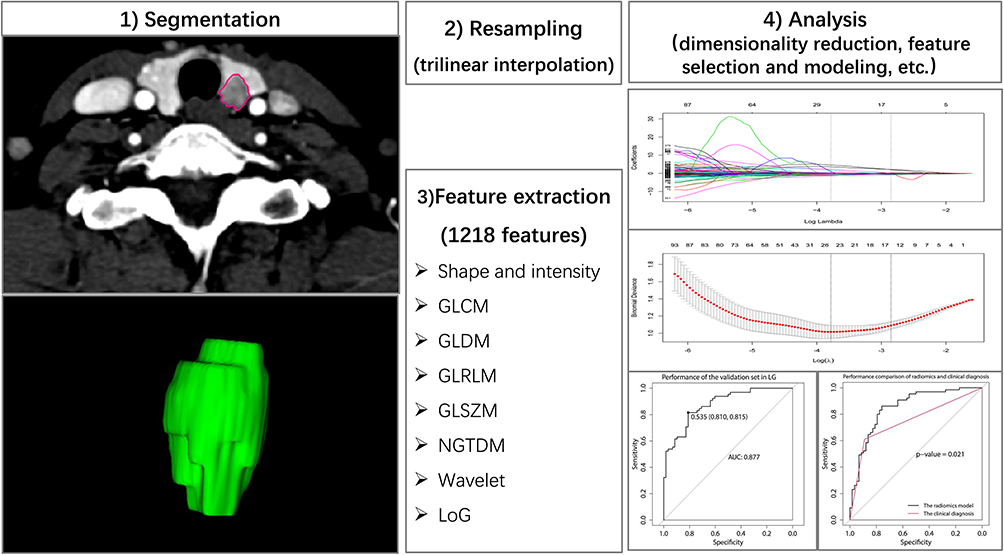 |
Figure 1 Framework of this study. |
Dimensionality Reduction and Feature Selection
We took three steps to select the features in the training group to reduce the deviation of radiomics features caused in the process of building the model. First, t tests or Mann–Whitney U-tests on independent samples were used to select the potentially important features of the training group from all features. Features selected from the above tests further proceeded in the second step, during which the least absolute shrinkage and selection operator (LASSO) was used for dimensionality reduction, and feature selection, variable selection, and regularization were used to improve the interpretability and prediction accuracy of the radiomics model.18,19 The 1-standard error of the minimum criterion (1-SE criterion, simpler model) was used to adjust the regularization parameter (λ), and 10 cross-validations were used for feature selection. Finally, the Spearman correlation coefficient was used to measure the features selected by LASSO to avoid the potential influence of outliers.
Selection of Machine Learning Methods
The following four most commonly used classifiers were analyzed: multivariable logistic regression (MLR), random forest (RF), support vector machines (SVM), and decision tree (DT). We chose these methods mainly because of their popularity and good performance in previous studies.20–24 The classifiers were trained with the method of 10 cross-validations in the training group, and the performance of the classification was evaluated by using the validation group. We finally chose multivariable logistic regression as the optimal classifier according to its better performance in the validation group. Thus, the training group and the validation group were processed with multivariable logistic regression. It should be pointed out that none of the participants had any affiliation with the tested machine learning methods.
Modeling and Comparison with Clinical Diagnosis
The optimal radiomics features were selected after dimensionality reduction, and the radiomics model was built based on the classifier of multivariate logistic regression. Calibration and assessment of the model were conducted through the Hosmer–Lemeshow test (multivariable logistic regression). The distinguishment between the performance of the radiomics model and that of clinical diagnosis was based on the performance of the validation group by comparing the AUCs of the two. Clinically, radiologists determine whether the thyroid nodule is malignant, mainly according to the morphology of the lesions, enhancement pattern of lesions, calcification, thyroid marginal involvement, and other characteristics. Clinical diagnoses of these thyroid nodules in the study were performed by experienced radiologists who were authorized to determine the final result of CT reports in our hospital. For radiologists, it is more practical to compare the performance of radiomics models with that of clinical diagnosis than with other clinical models.
Statistical Analysis
R software (version 3.6.0, https://www.r-project.org) and SPSS software (version 19, SPSS, Inc.) were used for statistical analysis. The mean values were compared through independent t tests with age as a continuous variable. When sex served as the categorical variable, the analysis was checked by the chi-square test. The comparison between two independent samples and the chi-square test were measured with SPSS software. The “glmnet” package was used to carry out Lasso regression. The “ggplot2” package was used to draw the correlation coefficient matrix. SVM model was created by using the “e1071”package. ROC curves were created through the “pROC” package. The ROC curves and the area under the curve (AUC) were used to evaluate the predictive performance of individual features and models, and the DeLong test was used to compare the performances between the models. All statistical tests were two-sided, and tests with p values less than 0.05 were considered statistically significant.
Results
Clinical Characteristics and Conventional CT Features of the Patients
In total, 407 eligible patients with thyroid nodules were retrospectively analyzed, including 193 NGs (167 females, 26 males, average age: 44.85 ±13.61 years) and 214 PTCs (166 females, 48 males, average age: 40.35 ±12.38 years). A total of 284 thyroid nodules (135 NGs, 149 PTCs) were assigned to the training group, and 123 nodules were assigned to the validation group (58 NGs, 65 PTCs) at a ratio of 7:3. There were no significant differences in terms of age (p=0.405), sex (p=0.859), or clinical diagnosis (p=0.944) between the training group and the validation group (Table 1).
Feature Extraction and Selection
For interobserver consistency, there were 437 radiomics features with ICC<0.75. Among the 471 unsatisfactory consistency features, 151 features excluded from the intraobserver protocol also participated in the interobserver protocol. After assessing the intraobserver and interobserver consistency, 747 (61.3%) radiomics features with ICC≥0.75 representing features with good stability were kept for further analysis, among which 14 features showed a Gaussian distribution with homoscedasticity. The results of Mann–Whitney U-tests showed that there were significant differences among the 508 features of the remaining 733 features. Therefore, 522 features were used for LASSO regression. Finally, 12 features were selected from 522 features by LASSO, with the value of the lambda. 1-SE criterion of 0.0578 was found through 10 cross-validations (Figure 2). The 12 optimal features selected by dimensionality reduction are shown in Table 2.
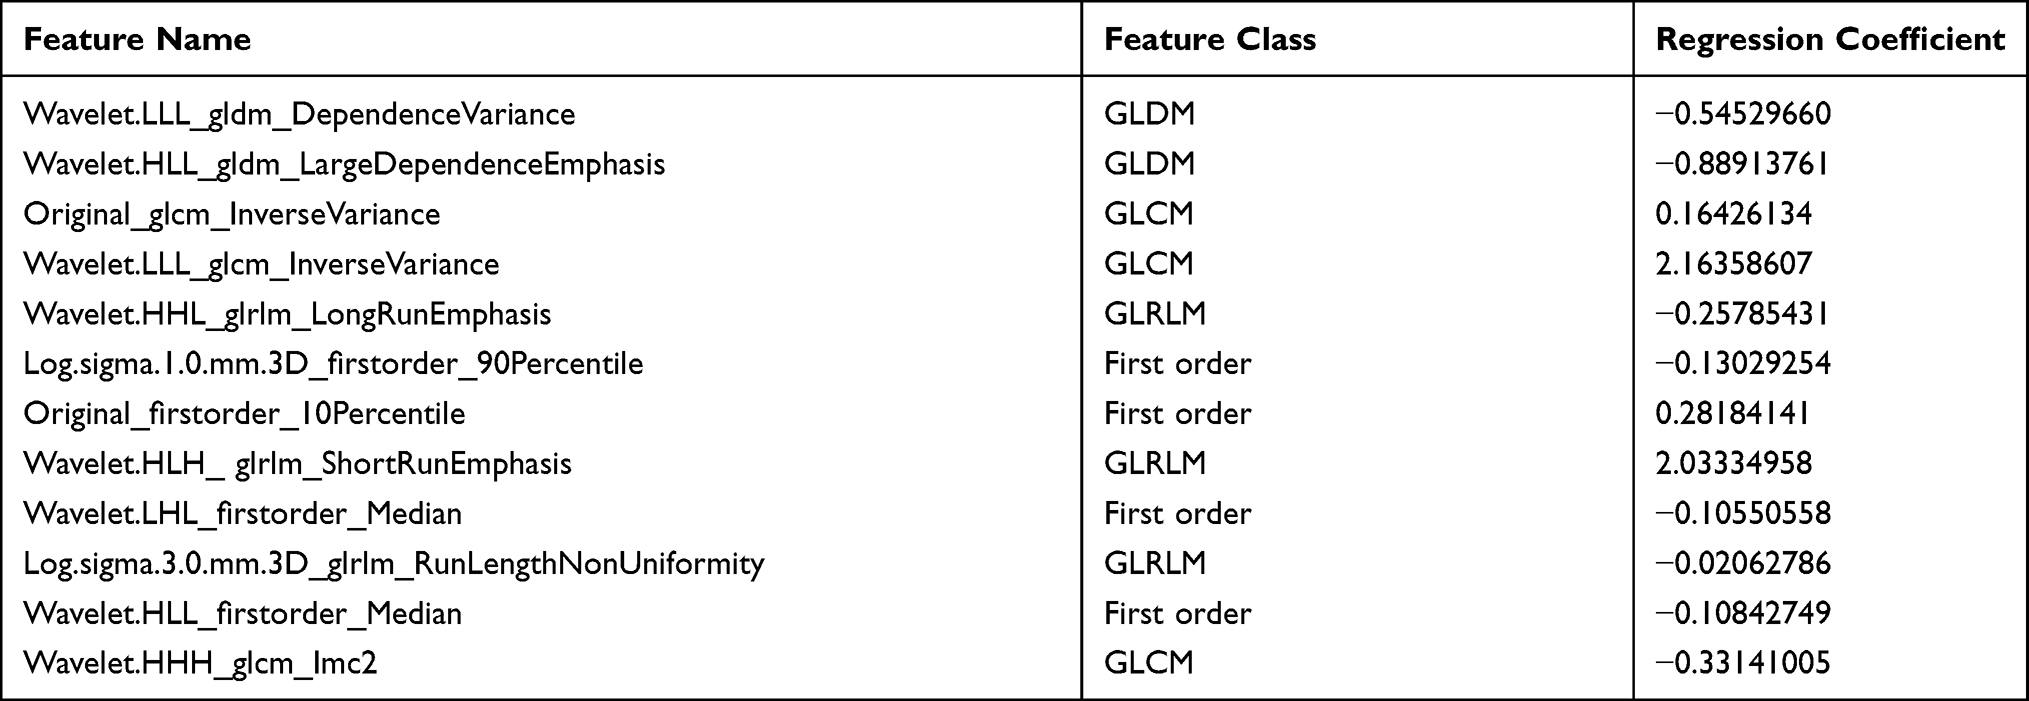 |
Table 2 The Optimal Features and Associated Feature Class |
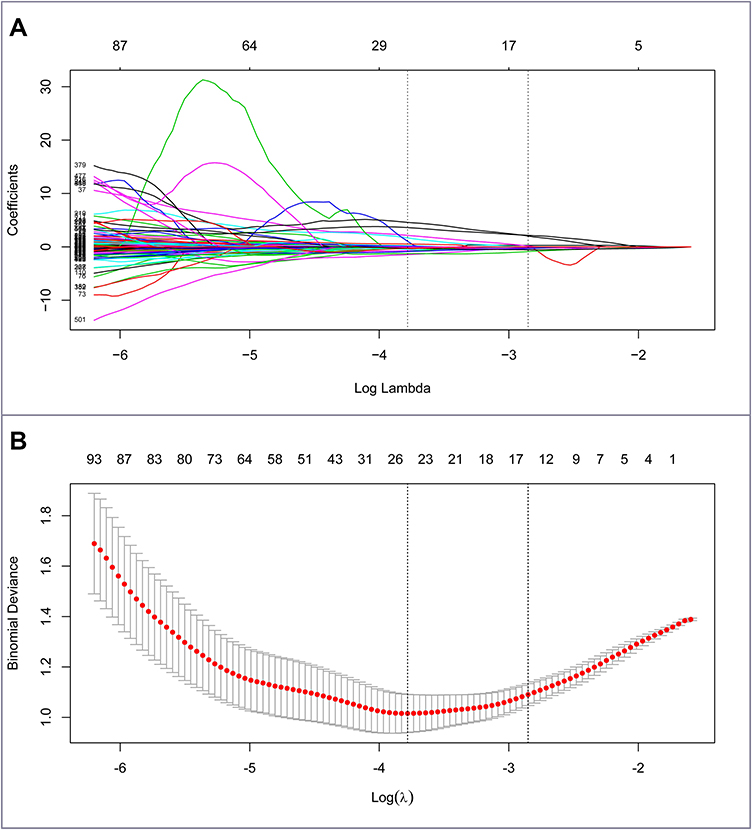 |
Figure 2 Feature selection using the LASSO regression. Notes: (A) Selection by the LASSO regression utilized 10-fold cross-validation. (B) LASSO coefficient profiles of the 522 radiomics features. Dotted vertical lines on the right mark the optimal value applying the minimum criteria with the 1-SE criteria and 12 features with non-zero coefficients were selected. |
Performance of Feature Classifiers and the Radiomics Model
By comparing the performances of the four machine learning classifiers (Figure 3), we found that the radiomics model based on multivariate logistic regression performed well in the validation group, with an AUC value of 0.877 (95% CI: 0.818~0.9353), a classification accuracy of 80.49%, a positive predictive value of 81.54%, and a negative predictive value of 79.31% (Table 3). Therefore, we chose multivariate logistic regression as the feature classifier to build the radiomics model. Finally, the optimal radiomics model using multivariable logistic regression as a classifier was built on 12 features and performed very well in predicting thyroid nodules.
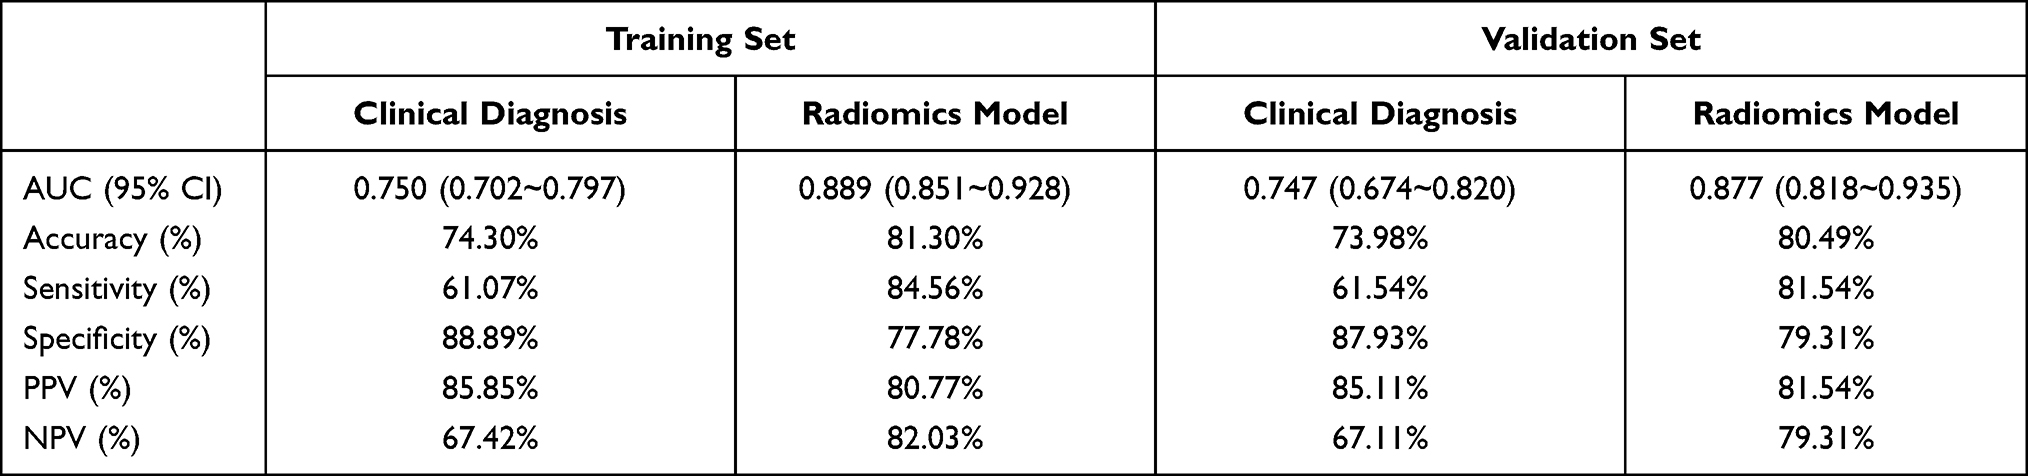 |
Table 3 The Performance of the Clinical Diagnosis and Radiomics Models in the Training and Validation Sets |
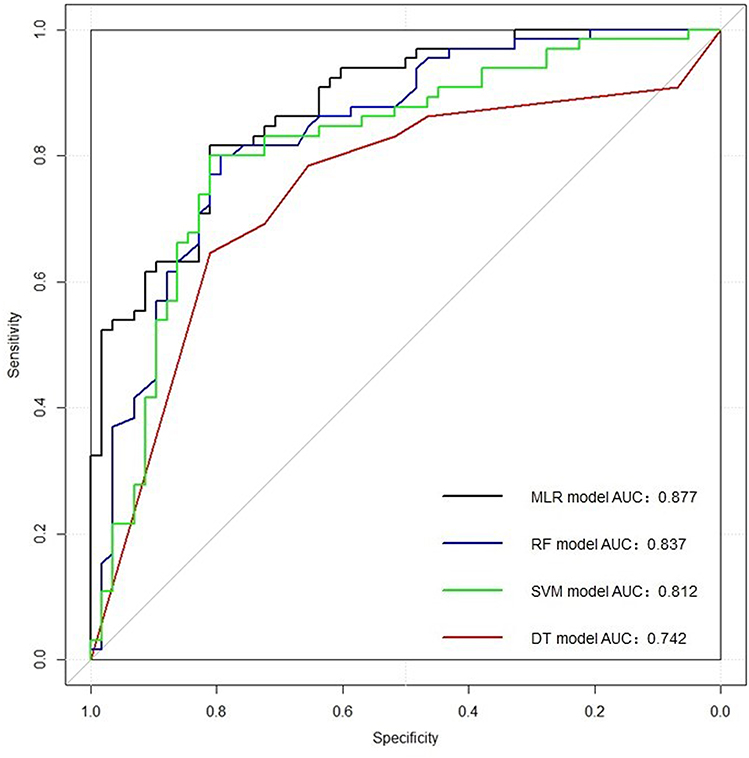 |
Figure 3 Performance comparison of four feature classifiers in the validation set by using the DeLong test. |
Comparison Between the Performances of the Radiomics Model and Clinical Diagnosis
The radiomics model’s performance was better in comparison with that of clinical diagnosis, as its AUC value was 0.889 (95% CI was 0.851–0.928), the classification accuracy was 81.30% in the training group; its AUC value was 0.877 (95% CI was 0.818–0.935), and the classification accuracy was 80.49% in the validation group (Table 3). The performance of the radiomics model was slightly better than that of experienced radiologists, according to the AUC (p<0.05, Figure 4).
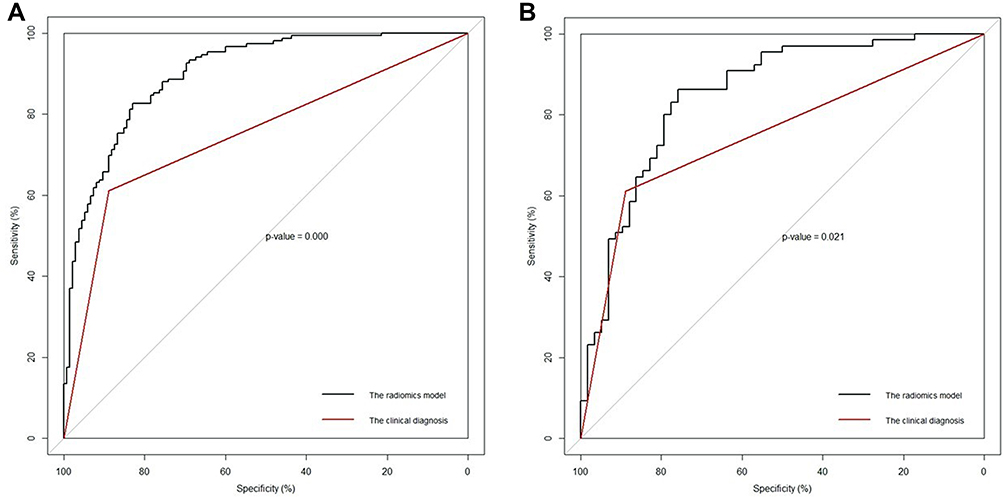 |
Figure 4 Comparing the ROC curves of radiomics model and clinical diagnosis in the training set (A) and the validation set (B). |
Discussion
Thyroid nodules are frequent clinical diagnoses, and most of them are benign, with nodular goiter being the most common cause. Among malignant thyroid tumors, papillary thyroid carcinoma (PTC) is the most common subtype and carries the best prognosis after timely treatment. They have many imaging features in common. In clinical work, the differential diagnosis between the two is an important and difficult task.
In our study, we built a radiomics model based on 3D arterial phase CECT to differentiate NG and PTC among thyroid nodules, which provided a noninvasive and quantitative method for preoperative diagnosis. The model can extract information that is invisible to the naked eye.
In daily clinical work, radiologists judge whether a thyroid nodule is malignant mainly based on its subjective features, such as shape, density, enhancement patterns, and surrounding performance of the thyroid lesions. The diagnostic efficacy mainly depends on the experience of radiologists. Misdiagnosis is inevitable when the radiologist is under a heavy work burden or in bad shape. Effective quantitative methods for predicting malignant thyroid nodules are still inadequate. The application of machine learning to radiomics features has become a hotspot of study,12,25 and the features learned from thyroid CT images are different from the traditional features used by radiologists, which provides a new diagnostic approach. The radiomics model based on machine learning has shown good consistency in interpreting NG and PTC thyroid nodules, which verifies its diagnostic repeatability. When integrated into the CT system, it can help radiologists diagnose thyroid nodules. Radiologists using the model will further improve the model after making the pathological diagnosis and labeling the nodules. The diagnostic ability of these radiologists will also be improved during the process. Diagnostic models based on machine learning will never be tired in work, while radiologists will because CT image analysis is labor intensive.
We explored four commonly used machine learning classification methods. The performance of the models in the validation group was not as good as that in the training group, similar to the results in previous research reports.26 Because AUC and ACC existed in both the training and validation groups, the feature classifier based on multivariate logistic regression had a better performance in distinguishing NG and PTC than that of DT, SVM, and RF, so we chose the feature classifier based on multivariate logistic regression to build the radiomics model. The more complex the model is, the larger the number of samples that can be handled. A small number of training samples cannot give full play to the advantages of the complex model. In our study, we adopted the simplest model that can fit the sample size. Finally, the radiomics model performed well in both the training group and the validation group. The classification accuracy rates were 81.3% and 80.49%, respectively. Compared with a group of experienced radiologists, the radiomics model had relatively higher efficiency and accuracy in distinguishing NG and PTC thyroid nodules. The CT images we used were produced by two different CT devices, which helped increase the data diversity of training algorithms to reduce the impact of different CT devices.
The machine learning model based on feature extraction has been used to distinguish benign and malignant thyroid nodules in ultrasonic images.21,27 Studies have shown that the model has high accuracy in the diagnosis of thyroid nodules. However, most of the ROIs used in previous studies were limited to one single slice of 2-dimensional images that were greatly influenced by the ultrasound doctor in charge of image collection, and the performance of the model was often related to the images collected by ultrasound doctors. In contrast, the images collected by CT equipment were omnidirectional volume data almost immune to the collector. The latter was more repeatable and feasible. Liu et al28 found that 3D radiomics analysis of the whole tumor volume was better applied to the histological grading of cervical cancers than that of 2D central section tumors. The repeatability provided by 3D features was better than that provided by 2D features. Therefore, we chose to use 3D CECT images in our study, including each layer of information of the thyroid nodules, thus providing more comprehensive image information.
There are still some limitations in our study. The first is that we did not use any data from other hospitals, nor did we analyze other subtypes of thyroid cancer. The performance of the model can be well improved if more data from other hospitals are included. Second, radiologists analyzed not only thyroid nodules but also clinical information of the overall condition of the thyroid and lymph nodes in their daily work to support their diagnosis. Although the clinical information is of equal importance, it was not included in our study. Third, clinical diagnosis was used as a controlling factor, requiring radiologists to analyze images daily for a limited time. As a result, the specificity of this group of experienced radiologists is expected to increase when they are allowed to review the images without a time limit. Fourth, CT and 3D-CT radiomics are currently less applicable in routine clinical practice for risk stratification of thyroid nodules.
During this study, we found that the accuracy of the diagnoses of thyroid nodules was affected by the thyroid background. When thyroid density generally decreases due to thyroid inflammation, it becomes more difficult to correctly diagnose of malignant thyroid nodules. This inaccuracy is why we chose arterial phase CECT images for analysis. Due to the low incidence rate of other thyroid cancer subtypes, there are too few available samples to use in the study. Therefore, future multicenter research should improve generalizability. Our model requires the operator to identify suspected malignant nodules, and it cannot automatically identify thyroid nodules. Therefore, we believe that a reliable and robust automatic delineation method should be further developed to address this issue.
As other clinical indices and CT plain scan information were not included in the radiomics model of our study, manual diagnosis of thyroid nodules could not be fully replaced, but it did improve the ability of radiologists in their diagnoses of thyroid cancer, especially when they were under the heavy clinical workload.
At present, our study is still in the stage of preliminary exploration. We intend to associate the CT image features of thyroid nodules learned through the model with the thyroid nodule features used by radiologists to explain thyroid cancer. There are huge differences in the diagnostic performances of radiologists, especially for those in areas where medical resources are unbalanced. Therefore, we hope that the improved model can help them in their work.
In conclusion, we carried out research to explore the best machine learning method to distinguish NG and PTC before surgery in this study. The radiomics model we built performed better than the group of experienced radiologists in predicting PTC and NG thyroid nodules. The performance of the model in extracting radiomics features from 3D-CECT images shows that the method has a high potential for further application.
Disclosure
The authors report no conflicts of interest for this work.
References
1. Haugen BR. 2015 American Thyroid Association Management Guidelines for adult patients with thyroid nodules and differentiated thyroid cancer: what is new and what has changed? Cancer. 2017;123:372–381. doi:10.1002/cncr.30360
2. Hoang JK, Langer JE, Middleton WD, et al. Managing incidental thyroid nodules detected on imaging: white paper of the ACR incidental thyroid findings committee. J Am Coll Radiol. 2015;12:143–150. doi:10.1016/j.jacr.2014.09.038
3. Lim H, Devesa SS, Sosa JA, et al. Trends in thyroid cancer incidence and mortality in the United States, 1974–2013. JAMA. 2017;317:1338–1348. doi:10.1001/jama.2017.2719
4. Cappola AR, Mandel SJ. Improving the long-term management of benign thyroid nodules. JAMA. 2015;313:903–904. doi:10.1001/jama.2015.0836
5. Fisher SB, Perrier ND. The incidental thyroid nodule. CA Cancer J Clin. 2018;68:97–105. doi:10.3322/caac.21447
6. Jameson JL. Minimizing unnecessary surgery for thyroid nodules. N Engl J Med. 2012;367:765–767. doi:10.1056/NEJMe1205893
7. Castellana M, Virili C, Paone G, et al. Ultrasound systems for risk stratification of thyroid nodules prompt inappropriate biopsy in autonomously functioning thyroid nodules. Clin Endocrinol (Oxf). 2020;93:67–75. doi:10.1111/cen.14204
8. Castellana M, Piccardo A, Virili C, et al. Can ultrasound systems for risk stratification of thyroid nodules identify follicular carcinoma? Cancer Cytopathol. 2020;128:250–259. doi:10.1002/cncy.22235
9. Boelaert K, McCabe CJ. Thyroid cancer: finding the malignant thyroid nodule in the haystack. Nat Rev Endocrinol. 2011;7:563–564. doi:10.1038/nrendo.2011.152
10. Mulita F, Iliopoulos F, Tsilivigkos C, et al. Cancer rate of Bethesda category II thyroid nodules. Med Glas (Zenica). 2022;19(1). doi:10.17392/1413-21
11. Grady AT, Sosa JA, Tanpitukpongse TP, et al. Radiology reports for incidental thyroid nodules on CT and MRI: high variability across subspecialties. Am J Neuroradiol. 2015;36:397–402. doi:10.3174/ajnr.A4089
12. Lambin P, Leijenaar RTH, Deist TM, et al. Radiomics: the bridge between medical imaging and personalized medicine. Nat Rev Clin Oncol. 2017;14:749–762. doi:10.1038/nrclinonc.2017.141
13. Lubner MG, Smith AD, Sandrasegaran K, et al. CT texture analysis: definitions, applications, biologic correlates, and challenges. Radiographics. 2017;37:1483–1503. doi:10.1148/rg.2017170056
14. Cha KH, Hadjiiski L, Chan HP, et al. Bladder cancer treatment response assessment in CT using radiomics with deep-learning. Sci Rep. 2017;7:1–12. doi:10.1038/s41598-017-09315-w
15. Yin P, Mao N, Zhao C, et al. Comparison of radiomics machine-learning classifiers and feature selection for differentiation of sacral chordoma and sacral giant cell tumour based on 3D computed tomography features. Eur Radiol. 2019;29:1841–1847. doi:10.1007/s00330-018-5730-6
16. Yushkevich PA, Piven J, Hazlett HC, et al. User-guided 3D active contour segmentation of anatomical structures: significantly improved efficiency and reliability. Neuroimage. 2006;31:1116–1128. doi:10.1016/j.neuroimage.2006.01.015
17. van Griethuysen JJM, Fedorov A, Parmar C, et al. Computational radiomics system to decode the radiographic phenotype. Cancer Res. 2017;77:e104–e107. doi:10.1158/0008-5472.CAN-17-0339
18. Daghir-Wojtkowiak E, Wiczling P, Bocian S, et al. Least absolute shrinkage and selection operator and dimensionality reduction techniques in quantitative structure retention relationship modeling of retention in hydrophilic interaction liquid chromatography. J Chromatogr A. 2015;1403:54–62. doi:10.1016/j.chroma.2015.05.025
19. Huang YQ, Liang CH, He L, et al. Development and validation of a radiomics nomogram for preoperative prediction of lymph node metastasis in colorectal cancer. J Clin Oncol. 2016;34:2157–2164. doi:10.1200/JCO.2015.65.9128
20. Chen T, Ning Z, Xu L, et al. Radiomics nomogram for predicting the malignant potential of gastrointestinal stromal tumours preoperatively. Eur Radiol. 2019;29:1074–1082. doi:10.1007/s00330-018-5629-2
21. Zhang B, Tian J, Pei S, et al. Machine learning-assisted system for thyroid nodule diagnosis. Thyroid. 2019;29:858–867. doi:10.1089/thy.2018.0380
22. Parmar C, Grossmann P, Bussink J, et al. Machine learning methods for quantitative radiomic biomarkers. Sci Rep. 2015;5:1–11. doi:10.1038/srep13087
23. Pena E, Ojiaku M, Inacio JR, et al. Can CT and MR shape and textural features differentiate benign versus malignant pleural lesions? Acad Radiol. 2017;24:1277–1287. doi:10.1016/j.acra.2017.03.006
24. Chen Y, Chen TW, Wu CQ, et al. Radiomics model of contrast-enhanced computed tomography for predicting the recurrence of acute pancreatitis. Eur Radiol. 2019;29:4408–4417. doi:10.1007/s00330-018-5824-1
25. Parmar C, Grossmann P, Rietveld D, et al. Radiomic machine-learning classifiers for prognostic biomarkers of head and neck cancer. Front Oncol. 2015;5:272. doi:10.3389/fonc.2015.00272
26. Li X, Zhang S, Zhang Q, et al. Diagnosis of thyroid cancer using deep convolutional neural network models applied to sonographic images: a retrospective, multicohort, diagnostic study. Lancet Oncol. 2019;20:193–201. doi:10.1016/S1470-2045(18)30762-9
27. Liang J, Huang X, Hu H, et al. Predicting malignancy in thyroid nodules: radiomics score versus 2017 American College of Radiology Thyroid Imaging, Reporting and Data System. Thyroid. 2018;28:1024–1033. doi:10.1089/thy.2017.0525
28. Liu Y, Zhang Y, Cheng R, et al. Radiomics analysis of apparent diffusion coefficient in cervical cancer: a preliminary study on histological grade evaluation. J Magn Reson Imaging. 2019;49:280–290. doi:10.1002/jmri.26192
 © 2022 The Author(s). This work is published and licensed by Dove Medical Press Limited. The
full terms of this license are available at https://www.dovepress.com/terms
and incorporate the Creative Commons Attribution
- Non Commercial (unported, 3.0) License.
By accessing the work you hereby accept the Terms. Non-commercial uses of the work are permitted
without any further permission from Dove Medical Press Limited, provided the work is properly
attributed. For permission for commercial use of this work, please see paragraphs 4.2 and 5 of our Terms.
© 2022 The Author(s). This work is published and licensed by Dove Medical Press Limited. The
full terms of this license are available at https://www.dovepress.com/terms
and incorporate the Creative Commons Attribution
- Non Commercial (unported, 3.0) License.
By accessing the work you hereby accept the Terms. Non-commercial uses of the work are permitted
without any further permission from Dove Medical Press Limited, provided the work is properly
attributed. For permission for commercial use of this work, please see paragraphs 4.2 and 5 of our Terms.