Back to Journals » Journal of Inflammation Research » Volume 16
Construction of the Interaction Network of Hub Genes in the Progression of Barrett’s Esophagus to Esophageal Adenocarcinoma
Authors Li K ![]() , Duan P, He H, Du R, Wang Q, Gong P
, Duan P, He H, Du R, Wang Q, Gong P ![]() , Bian H
, Bian H
Received 20 January 2023
Accepted for publication 5 April 2023
Published 12 April 2023 Volume 2023:16 Pages 1533—1551
DOI https://doi.org/10.2147/JIR.S403928
Checked for plagiarism Yes
Review by Single anonymous peer review
Peer reviewer comments 3
Editor who approved publication: Professor Ning Quan
Kai Li,1,2,* Peipei Duan,1,2,* Haifa He,3,* Ruijuan Du,1,2 Qian Wang,1,2 Pengju Gong,4 Hua Bian1
1Zhang Zhongjing College of Chinese Medicine, Nanyang Institute of Technology, Nanyang, Henan, People’s Republic of China; 2Henan Key Laboratory of Zhang Zhongjing Formulae and Herbs for Immunoregulation, Nanyang Institute of Technology, Nanyang, Henan, People’s Republic of China; 3Department of Pathology, Nanyang Central Hospital, Nanyang, Henan, People’s Republic of China; 4The University of Texas MD Anderson Cancer Center UThealth Graduate School of Biomedical Sciences, Houston, TX, USA
*These authors contributed equally to this work
Correspondence: Hua Bian; Kai Li, Zhang Zhongjing College of Chinese Medicine, Nanyang Institute of Technology, No. 80 Changjiang Road, Wancheng District, Nanyang, Henan, People’s Republic of China, Email [email protected]; [email protected]
Introduction: Esophageal adenocarcinoma (EAC) is one of the histologic types of esophageal cancer with a poor prognosis. The majority of EAC originate from Barrett’s esophagus (BE). There are few studies focusing on the dynamic progression of BE to EAC.
Methods: R software was used to analyze differentially expressed genes (DEGs) based on RNA-seq data of 94 normal esophageal squamous epithelial (NE) tissues, 113 BE tissues and 147 EAC tissues. The overlapping genes of DEGs between BE and EAC were analyzed by Venn diagram tool. The hub genes were selected by Cytoscape software based on the protein-protein interaction network of the overlapping genes using STRING database. The functional analysis of hub genes was performed by R software and the protein expression was identified by immunohistochemistry.
Results: In the present study, we found a large degree of genetic similarity between BE and EAC, and further identified seven hub genes (including COL1A1, TGFBI, MMP1, COL4A1, NID2, MMP12, CXCL1) which were all progressively upregulated in the progression of NE-BE-EAC. We have preliminarily uncovered the probable molecular mechanisms of these hub genes in disease development and constructed the ceRNA regulatory network of hub genes. More importantly, we explored the possibility of hub genes as biomarkers in the disease progression of NE-BE-EAC. For example, TGFBI can be used as biomarkers to predict the prognosis of EAC patients. COL1A1, NID2 and COL4A1 can be used as biomarkers to predict the response to immune checkpoint blockade (ICB) therapy. We also constructed a disease progression risk model for NE-BE-EAC based on CXCL1, MMP1 and TGFBI. Finally, the results of drug sensitivity analysis based on hub genes showed that drugs such as PI3K inhibitor TGX221, bleomycin, PKC inhibitor Midostaurin, Bcr-Abl inhibitor Dasatinib, HSP90 inhibitor 17-AAG, and Docetaxel may be potential candidates to inhibit the progression of BE to EAC.
Conclusion: This study is based on a large number of clinical samples with high credibility, which is useful for revealing the probable carcinogenic mechanism of BE to EAC and developing new clinical treatment strategies.
Keywords: Barrett’s esophagus, esophageal adenocarcinoma, hub genes, carcinogenic mechanism, biomarker
Graphical Abstract:

Introduction
Esophageal cancer includes esophageal squamous cell carcinoma (ESCC) and esophageal adenocarcinoma (EAC), of which primary EAC accounts for only 5%-10%. However, the prognosis of EAC is poor, 5-year survival rate of which is less than 20%, and the incidence rate is increasing year by year.1 EAC is more prevalent in the United States, Australia, and Western European countries. Studies have shown that 2% to 7% of adults in Western countries have Barrett’s esophagus (BE), a major risk factors for EAC, resulting in a more than seven-fold increase in the number of patients with EAC in the United States over the past few decades.2
Studies have confirmed that BE is a precancerous lesion of EAC, and majority of EAC is derived from BE.3 Epidemiological studies have found that the risk of cancerous changes in BE is 25 to 30 times higher than that of normal people.4 BE is thought to evolve into EACs through a series of genetic and epigenetic alterations that accumulate in metaplastic cells, giving them an advantage in progressive growth, ultimately leading to malignancy.5 Most EAC patients are unaware of the medical history of BE, or do not have timely intervention for BE, resulting in advanced tumor progression when the patients are diagnosed with EAC. Therefore, finding biomarkers for early diagnosis of EAC and high-risk BE patients has important preventive significance and clinical value. Currently, endoscopy-based tissue biopsy is the primary means of assessing whether BE will progress to EAC.6 However, numerous reports suggest that patients with BE may develop incurable esophageal cancer despite adherence to a regular endoscopic surveillance program, seriously challenging the efficacy of surveillance endoscopy for cancer prevention.7–9 The researchers are exploring other approaches that may improve risk prediction, such as the p53 protein and flow cytometric DNA content analysis, both associated with malignant transformation of BE.10–12 In addition, some researchers have proposed risk prediction models incorporating clinical information, histological or molecular features.13,14 However, none of these risk prediction models have sufficient evidence to be justified in clinical practice.
Epithelial metaplasia in BE is widely considered to be a consequence of gastroesophageal reflux disease (GERD).15 BE forms when GERD damages the squamous epithelium of the esophagus, exposing the basal layer of pluripotent stem cells to the refluxed gastric juice and thus stimulating abnormal differentiation. The study found that GERD may induce the expression of CDX gene through BMP4 and epidermal growth factor receptor, causing esophageal squamous cells to express markers of columnar cells, and finally mediate the development of Barrett’s metaplasia.16–18 Esophageal cells exposed to acid develop DNA double-strand breaks, which may contribute to tumorigenesis.17 Acid and bile can also resist apoptosis by activating the NF-κB pathway and regulate the expression of inflammation and proliferation-related genes.19 In Barrett-associated esophageal adenocarcinoma, bile acid activated tuberous sclerosis complex 1/rapamycin pathway.20 Currently, there are few studies focusing on the malignant transformation of BE, and its molecular mechanism is largely unknown.
In this study, we screened the RNA-seq data of 94 NE tissues, 113 BE tissues, and 147 EAC tissues in the GEO database. Then, the hub genes in the development of normal esophageal squamous epithelium (NE)-BE-EAC were explored through bioinformatics combined with immunohistochemistry. Furthermore, we also analyzed the probable mechanisms of these hub genes and their potential as biomarkers for EAC prognosis, risk appraisal of disease progression and clinical treatment. Our study is based on a large number of clinical samples and have high reliability, which is helpful for revealing the probable molecular mechanism of malignant transformation of BE and formulating clinical treatment strategies.
Materials and Methods
Data Collection and Experiment Grouping
In the GEO database, we screened 7 datasets containing RNA-seq data from 94 cases of NE tissues, 113 cases of BE tissues and 147 cases of EAC tissues. In detail, the GSE13083 dataset contains 7 cases of NE tissues and 7 cases of BE tissues; the GSE26886 dataset contains 19 cases of NE tissues, 20 cases of BE tissues and 21 cases of EAC tissues; the GSE42363 dataset contains 14 cases of EAC tissues; GSE13898 dataset contains 28 cases of NE tissues, 15 cases of BE tissues and 75 cases of EAC tissues; GSE39491 dataset contains 40 cases of NE tissues and 40 cases of BE tissues; GSE37201 dataset contains 22 cases of EAC tissues; GSE37200 dataset contains 31 cases of BE tissues and 15 cases of EAC tissues.
Data Preprocessing and Analysis of Differentially Expressed Genes (DEGs)
The seven datasets in this study are all from the GEO database. For the datasets that have not been normalized, log2 processing is performed uniformly. If the dataset data is not standardized, the normalize.quantiles function in the R software preprocessCore package is used to perform data normalization. According to the annotation information of the corresponding platform, statistics convert the probe ID to gene symbol, remove the probes of multiple genes, and calculate the average value of the genes corresponding to multiple probes. The removeBatchEffect function in the R software limma package was used to remove batch effects. Differentially expressed mRNA was investigated using the limma package of R software. “P < 0.05 and log2(fold change) > 0.58 or log2(fold change) < −0.58” was defined as the threshold for the screening of DEGs. Expression heatmaps are displayed by the R package pheatmap. To better understand the probable mechanism of DEGs, the ClusterProfiler package in R software was used to perform GO analysis and KEGG analysis of DEGs.
Screening of Hub Genes
The overlapping DEGs between NE and BE, NE and EAC, BE and EAC were analyzed based on the Venny online tool, and then the protein-protein interaction network of these overlapping DEGs was constructed using the STRING website. The original data of the protein interaction network was imported into the Cytoscape software, and the cytohubba plug-in was used to screen the top 7 as hub genes according to degree. Then, based on the 7 datasets of the GEO database, we utilized boxplot to visualize the expression levels of hub genes in NE tissue, BE tissue and EAC tissue. A p-value less than 0.05 was considered statistically significant.
Correlation of Hub Genes with Immune Cell Infiltration, Immunotherapy Response, Immune Checkpoint Genes, Tumor Mutational Burden (TMB)
The RNA-seq data (level 3) and corresponding clinical information of EAC were obtained from the TCGA database (https://portal.gdc.com). We used the R software package immunedeconv, including four algorithms TIMER, MCP-counter, EPIC and quanTIseq, to analyze the correlation between hub genes and different immune cell infiltration, and the analysis results were displayed by the R software package pheatmap. Spearman correlation analysis was used to describe correlations between quantitative variables without a normal distribution. A p-value less than 0.05 was considered statistically significant.
The TIDE algorithm uses a set of gene expression signatures to assess two distinct tumor immune escape mechanisms, including tumor-infiltrating cytotoxic T lymphocyte (CTL) dysfunction and CTL rejection by immunosuppressive factors.21 High TIDE score, poor response to immune checkpoint blockade (ICB), and short survival after receiving ICB. Therefore, immunotherapy responses of different groups with high or low expression of hub genes can be predicted using the TIDE algorithm. The results are displayed by the R packages ggplot2 and ggpubr. A p-value less than 0.05 was considered statistically significant.
Based on the 7 datasets in the GEO database, we extracted the expression values of immune checkpoint genes CD274, CTLA4, HAVCR2, LAG3, PDCD1, PDCD1LG2, TIGIT and SIGLEC15, and then used the R software package ggstatsplot to analyze the relationship between hub genes and immune checkpoint genes. A p-value less than 0.05 was considered statistically significant.
Based on EAC RNA-seq data (level 3) in the TCGA dataset (https://portal.gdc.com), we used Spearman to analyze the correlation between hub genes and TMB. The results are presented by the R package ggstatsplot. A p-value less than 0.05 was considered statistically significant.
Construction of Hub Genes ceRNA Network
Using the ENCORI database (https://starbase.sysu.edu.cn/index.php), we predicted miRNAs that could target both hub genes and their ceRNA molecules. Then, the list of candidate hub genes, lncRNAs and miRNAs was imported into Cytoscape software to construct a ceRNA network of hub genes.
Correlation of Hub Genes and EAC Prognosis
The online tool Kaplan-Meier Plotter (http://kmplot.com/analysis/index.php?p=serviceandcancer=pancancer_rnaseq) was used to analyze the correlation between hub genes and overall survival (OS) and recurrence-free survival (RFS) of EAC patients. The EAC samples were divided into two groups based on the expression of hub genes by the best cut-off value automatically and were analyzed using Kaplan-Meier method and Log rank-P test (P<0.05 as significant).
Correlation Between Hub Genes and Signaling Pathways
The RNA-seq data (level 3) and corresponding clinical information of EAC were obtained from the TCGA database (https://portal.gdc.com). The key genes contained in the corresponding pathways were collected and analyzed by the R software GSVA package. The parameter method=“ssgsea” was selected, and finally the correlation between genes and pathway scores was analyzed by Spearman correlation. p<0.05 was considered statistically significant.
Construction of Predictive Model for Cancer Diagnosis
Firstly, the cancer diagnosis performance of 7 hub genes expression was evaluated by using receiver operating characteristic (ROC) curves, and the overall diagnostic accuracy of the test was assessed by the area under the ROC curve (AUC). Then the logistic regression test was used to identify the genes that were significantly associated with cancer diagnosis based on the 7 hub genes. According to the output results of the 7 genes predictive model, the final logistic regression model for cancer diagnostic was constructed by TGFBI, MMP1 and CXCL1 showing the most significant P values and the exponentiated values of the coefficients, and the ROC curve was utilized to judge discrimination of the 3 genes predictive model. All analyses were performed using SPSS.
Drug Sensitivity Analysis
Using the “drug sensitivity analysis” module on GSCALite database (http://bioinfo.life.hust.edu.cn/web/GSCALite/), we analyzed the correlation between hub genes and 265 small molecules from Genomics of Drug Sensitivity in Cancer (GDSC). The correlation of hub genes expression with the small molecule/drug sensitivity (IC50) was performed by Spearman correlation analysis. The negative correlation means that the gene high expression is sensitive to the drug, vise verse. p<0.05 was considered statistically significant.
Immunohistochemistry of NE Tissue, BE Tissue and EAC Tissue
We verified the protein expression levels of hub genes in NE (n=20), BE (n=20) and EAC (n=20) tissues by immunohistochemistry. These tissues came from Nanyang Central Hospital and were diagnosed by the pathology department. The experimental steps of immunohistochemistry refer to our previous article.22 To compare the protein expression levels of hub genes among NE, BE and EAC tissues, the intensity of immunohistochemistry staining was then quantitatively scored. The criteria for quantitative scoring refer to our previous article.23
Results
Exploration of the DEGs Between NE Tissue and BE Tissue, NE Tissue and EAC Tissue, BE Tissue and EAC Tissue, and their Functional Enrichment Analysis
Based on the GEO database (http://www.ncbi.nih.gov/geo), we analyzed RNA-seq data of 94 NE tissues, 113 BE tissues, and 147 EAC tissues. There were 1173 upregulated genes and 1051 downregulated genes in BE tissues relative to NE tissues (Figure 1A, Table S1). The functions of these genes in the development of BE have not yet been revealed. Therefore, we performed KEGG and GO analyses on these DEGs, to preliminarily reveal their probable mechanisms in the occurrence and development of BE. The results of functional enrichment analysis showed that these DEGs may be related to immune response, gastric acid secretion, protein digestion and absorption, adhesion junctions, tight junctions and TGF-β signaling pathway, mTOR signaling pathway, MAPK signaling pathways, etc. (Figure 1B, Table S2). Relative to the NE tissues, there were 970 upregulated genes and 944 downregulated genes in the EAC tissues (Figure 1C, Table S3). Similarly, we performed functional enrichment analysis on these DEGs, and the results showed that their functions were similar to the DEGs in BE, such as immune response, gastric acid secretion, adhesion junctions, tight junctions, TGF-β signaling pathway, MAPK signaling pathway, etc. (Figure 1D, Table S4). By comparing RNA-seq data of BE tissue and EAC tissue, we found 94 upregulated genes and 296 downregulated genes in EAC relative to BE (Figure 1E, Table S5). Then, we performed functional enrichment analysis of these DEGs. The results show that these DEGs are closely related to inflammatory processes such as immune response, TLR signaling pathway, TNF signaling pathway, and NF-κB signaling pathway (Figure 1F, Table S6).
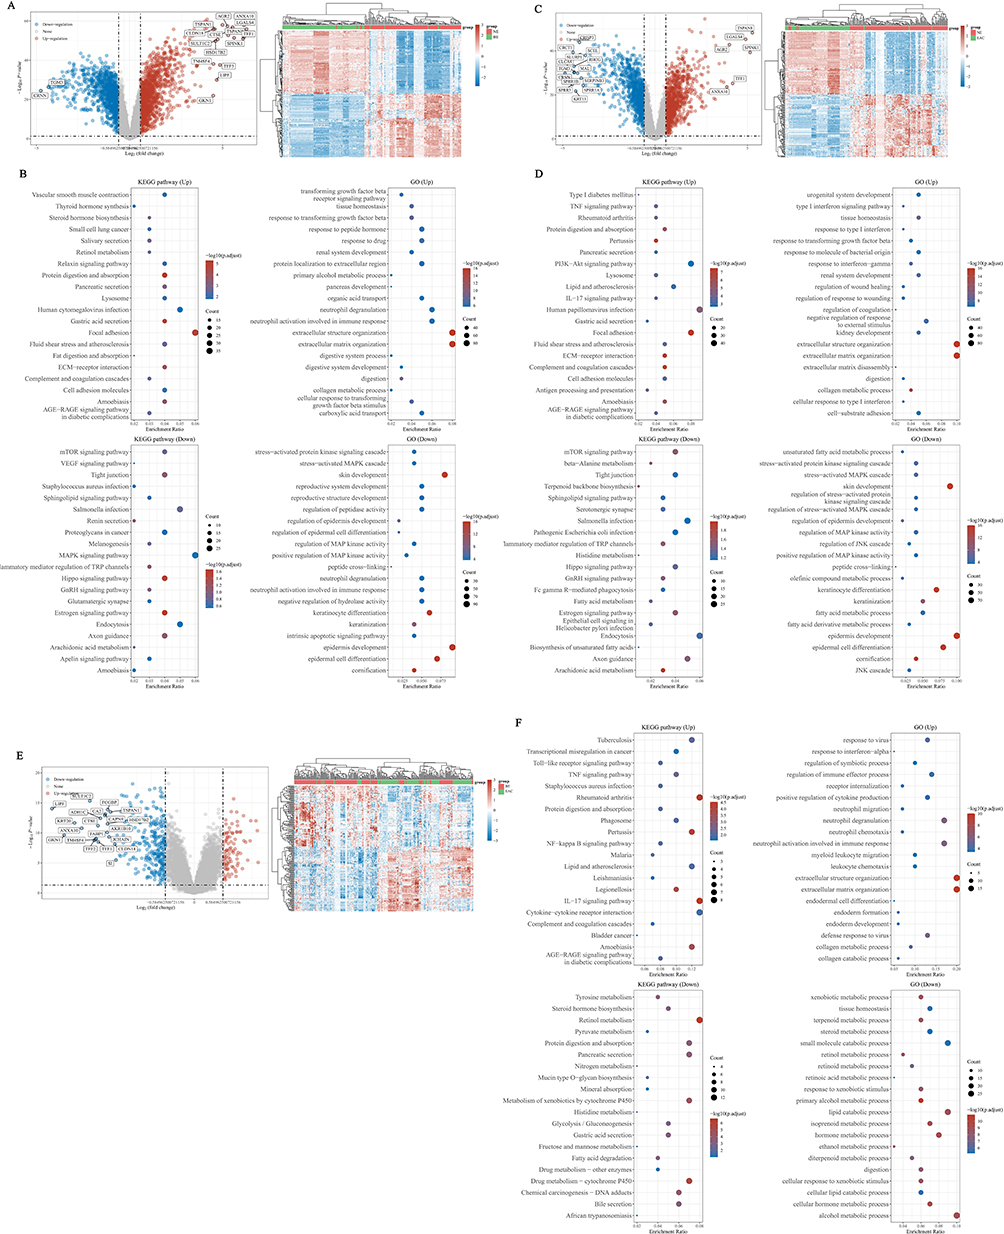 |
Figure 1 Analysis of DEGs during the development of NE-BE-EAC. (A) The limma package of R software was used to identify DEGs between NE and BE based on RNA-seq data of 94 NE tissues and 113 BE tissues from the GEO database. (B) The ClusterProfiler package in R software was used to perform GO analysis and KEGG analysis of up- and down-regulated DEGs. Similarly, DEGs between NE and EAC were analyzed based on RNA-seq data of 94 NE tissues and 147 EAC tissues in the GEO database (C), And the GO and KEGG analysis were performed using ClusterProfiler package in R software (D). Based on the RNA-seq data of 113 BE tissues and 147 EAC tissues in the GEO database, the DEGs between BE and EAC were analyzed (E), and the GO and KEGG analysis were performed using ClusterProfiler package in R software (F). |
7 Hub Genes Were Identified During the Transition from BE to EAC
To explore oncogenes and tumor suppressor genes that may play a role in the development of NE-BE-EAC, we firstly identified the overlapping DEGs between BE (1173 upregulated genes and 1051 downregulated genes) and EAC (970 upregulated genes and 944 downregulated genes) by Wayne analysis. The results showed that the DEGs in BE and EAC had great similarity, sharing 813 overlapping upregulated genes and 841 overlapping downregulated genes (Figure 2A and B, Table S7). This result further proves the close connection between BE and EAC. In this study, we aim to explore the genes whose expression levels were progressively upregulated or downregulated during the development of NE-BE-EAC. Therefore, we proceeded to compare the above overlapping DEGs with those in EAC (relative to BE) by Wayne analysis. Through analysis, we identified 12 upregulated genes (COL1A1, IFI30, AEBP1, AGT, CXCL1, NID2, COL4A1, UBD, SERPINA3, TGFBI, MMP1, MMP12) and 7 downregulated genes (MAL, DSC2, S100A14, MALL, DHRS9, FGFBP1, ALDH3A1), whose expression levels were progressively upregulated or downregulated during the development of NE-BE-EAC (Figure 2C–E). To further identify the hub genes involved in the conversion of BE to EAC, we constructed the protein-protein interaction network of these 19 genes base on the STRING database (Figure 2F). Then based on this network, we finally screened 7 hub genes using Cytoscape software, including COL1A1, TGFBI, MMP1, COL4A1, NID2, MMP12, CXCL1 (Figure 2G). Finally, we further verified the expression levels of these genes in 94 NE tissues, 113 BE tissues and 147 EAC tissues, and the results showed that relative to NE tissues, COL1A1, IFI30, AEBP1, AGT, CXCL1, NID2, COL4A1, UBD, SERPINA3, TGFBI, MMP1, MMP12 were progressively upregulated in BE and EAC, while MAL, DSC2, S100A14, MALL, DHRS9, FGFBP1, ALDH3A1 were progressively downregulated (Figure 3A–G, Figure S1A–L). These results suggest that COL1A1, TGFBI, MMP1, COL4A1, NID2, MMP12, CXCL1 may act as key oncogenes in the development of NE-BE-EAC.
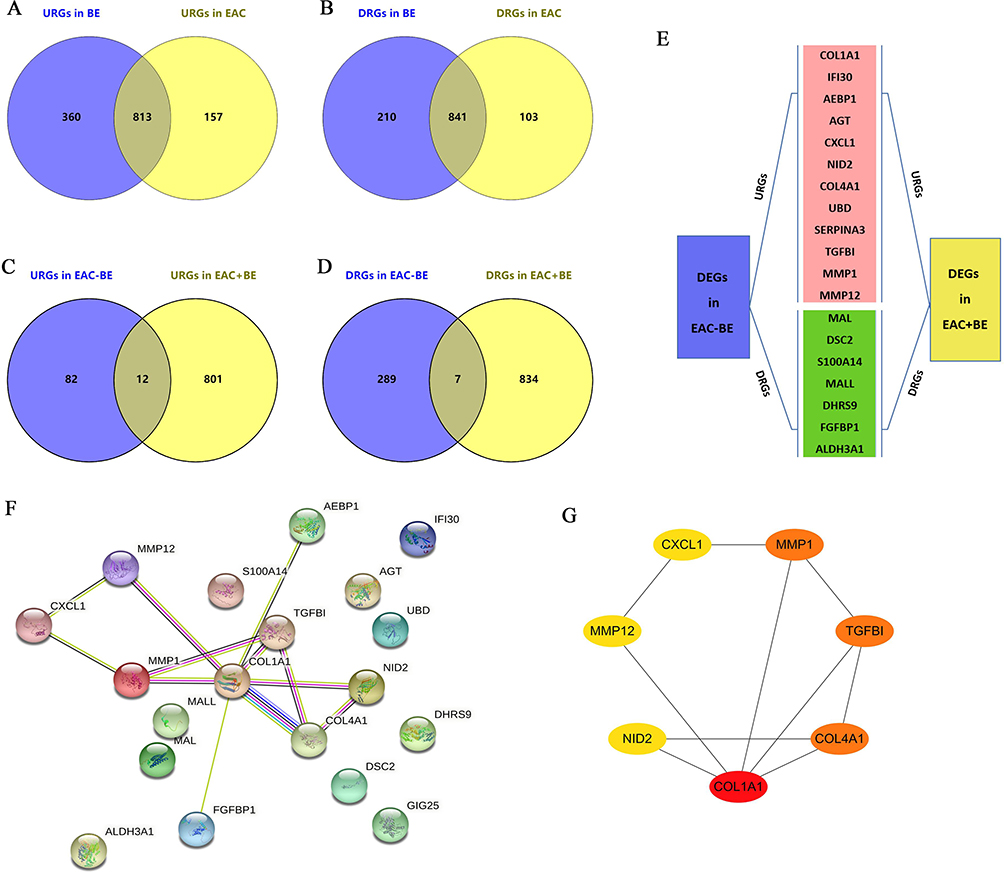 |
Figure 2 Exploration of hub genes during the development of NE-BE-EAC. (A and B) Relative to NE, up- and down-regulated DEGs overlapping in BE and EAC were identified by Wayne analysis. (C and D) Compared to BE, the upregulated and downregulated genes in EAC are labeled as “URGs in EAC-BE” and “DRGs in EAC-BE”, respectively. Relative to NE, overlapping up- and down-regulated genes in BE and EAC were labeled as “URGs in EAC+BE” and “DRGs in EAC+BE”, respectively. Overlapping genes between “URGs in EAC-BE” and “URGs in EAC+BE”, “DRGs in EAC-BE” and “DRGs in EAC+BE” were identified by Wayne analysis. (E) These overlapping DEGs include 12 upregulated genes and 7 downregulated genes. (F) Analysis of protein interactions between these 19 DEGs using the STRING database. (G) Finally, 7 hub genes were screened based on protein interactions using the cytohubba plugin in Cytoscape software. The linkages between the proteins indicate the predicted interactions. |
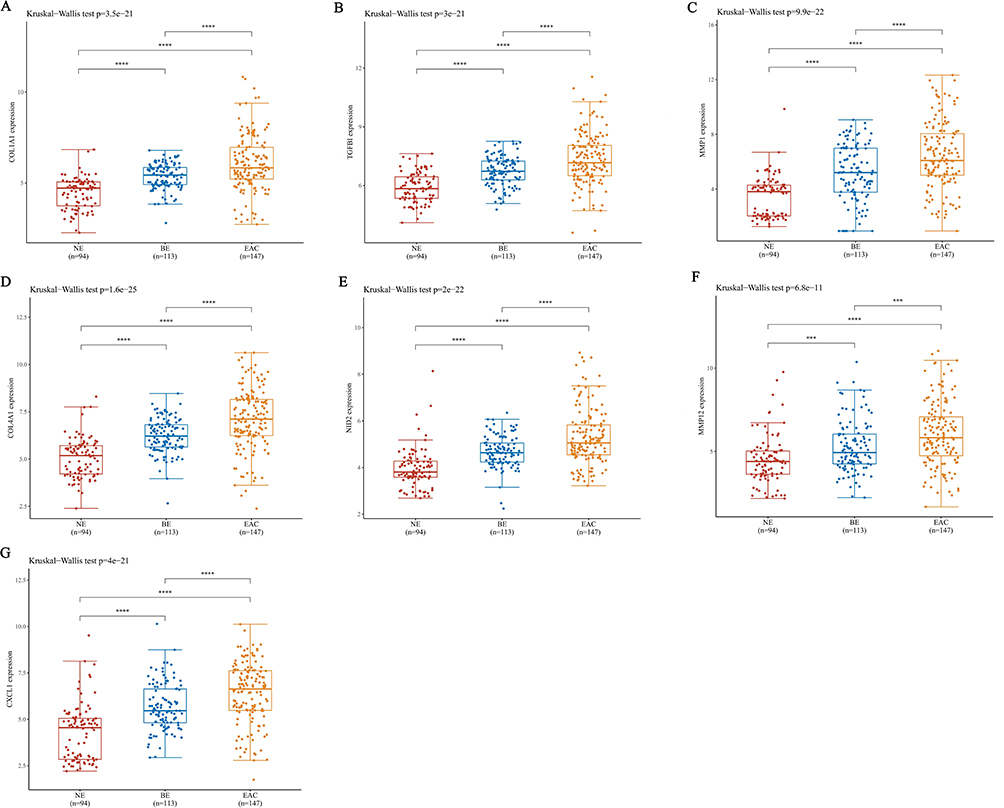 |
Figure 3 Analysis of mRNA expression levels of hub genes in NE, BE and EAC. Based on the RNA-seq data in the GEO database, the mRNA expression levels of COL1A1 (A), TGFBI (B), MMP1 (C), COL4A1 (D), NID2 (E), MMP12 (F), CXCL1 (G) in 94 NE tissues, 113 BE tissues and 147 EAC tissues were analyzed. ***(P < 0.001) or ****(P < 0.0001) represents statistical significance. |
The Protein Expression Levels of Hub Genes are Progressively Upregulated in the Development of NE-BE-EAC
Based on RNA-seq data, we have determined the mRNA expression levels of hub genes in NE, BE and EAC tissues. Furthermore, NE, BE and EAC tissues were collected to verify the protein expression levels of hub genes by immunohistochemistry. According to the quantitative scores of immunohistochemistry, we confirmed that the expression levels of COL1A1, TGFBI, MMP1, COL4A1, NID2, MMP12, CXCL1 in BE tissues were significantly higher than that in NE tissues, but lower than that in EAC tissues, which was consistent with RNA-seq analysis (Figure 4). These results further suggested that these hub genes may play important roles in the development of NE-BE-EAC.
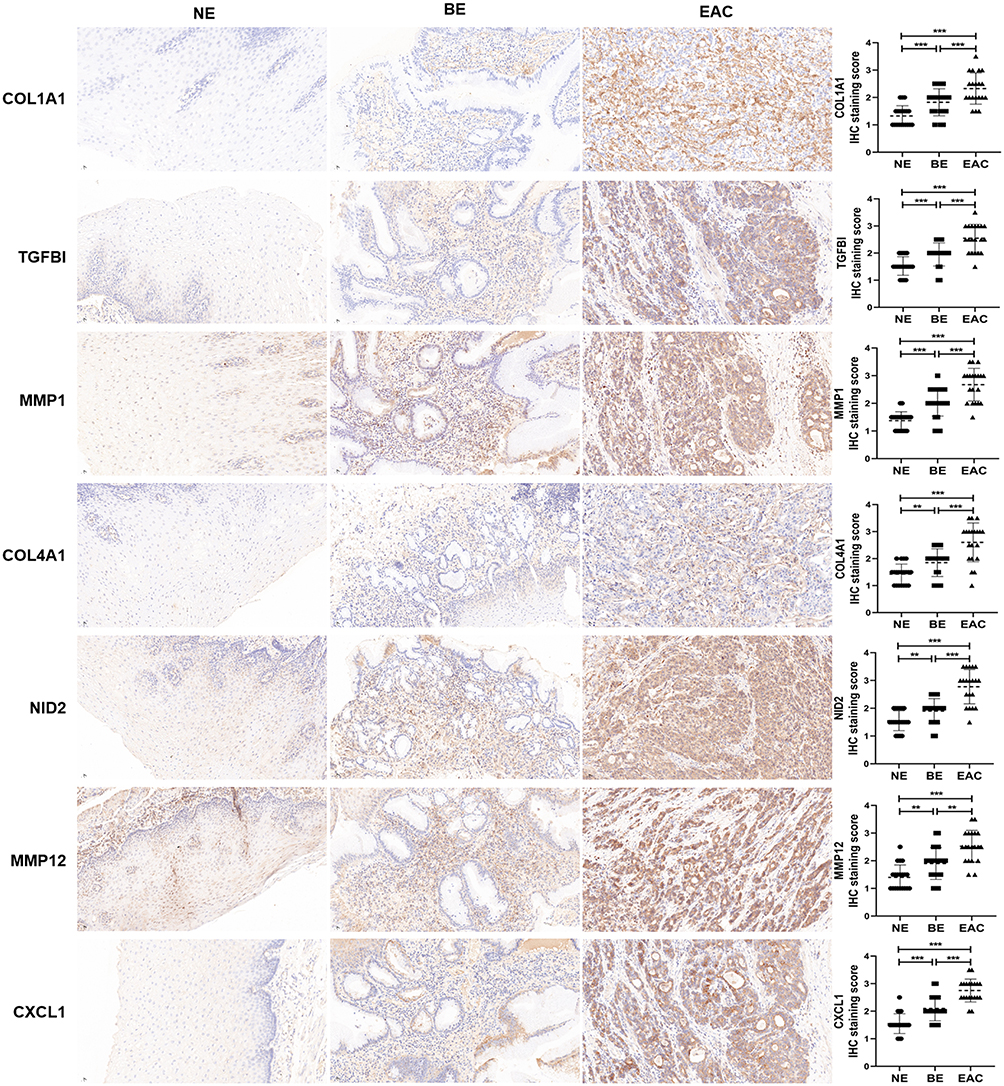 |
Figure 4 The protein expression levels of hub genes in NE, BE and EAC. The protein expression level of COL1A1, TGFBI, MMP1, COL4A1, NID2, MMP12, CXCL1 was detected and quantified by immunohistochemistry in NE (n=20), BE (n=20) and EAC (n=20) tissues. **(P < 0.01) or ***(P < 0.001) represents statistical significance. |
The Hub Genes Were Closely Associated with Immune Cell Infiltration and Tumor Immunotherapy
We used TIMER, MCP-counter, EPIC and quanTIseq to analyze the correlation between hub genes and immune cell infiltration (Figure 5A–D). The results of the four algorithms are mostly consistent, such as 7 oncogenic hub genes were positively correlated with the infiltration of B cells, endothelial cells, macrophages, monocytes, NK cells, neutrophils, Treg cells and other inflammatory cells. In some individual cases, the results of the four algorithms are inconsistent. For example, the EPIC algorithm shows that most of the oncogenic hub genes are negatively correlated with the infiltration of CD8+ T cells, while the results of other three algorithms are opposite or not statistically significant. In this study, we also analyzed the correlation between hub genes and immune checkpoint molecules (CD274, CTLA4, HAVCR2, LAG3, PDCD1, PDCD1LG2, TIGIT, SIGLEC15) (Figure 6A–G). The results showed that these hub genes, especially NID2, were positively correlated with the expression of immune checkpoint molecules. The Tumor Immune Dysfunction and Exclusion (TIDE) score can be used to predict patient response to ICB therapy.21 A high TIDE score predicts poor ICB efficacy and short survival after ICB treatment. In this study, we found that the expression levels of COL1A1 and NID2 were positively correlated with the TIDE score, suggesting that these three hub genes can be used as biomarkers for predicting response to ICB therapy (Figure S2A–G). In addition to the TIDE score, tumor mutational burden (TMB) is also one of the important markers for predicting the response to ICB therapy.24 Higher TMB indicates that patients may be more sensitive to ICB treatment. The results showed that COL4A1 was negatively correlated with TMB score (Figure S3A–G). Therefore, COL1A1, NID2 and COL4A1 may also serve as biomarkers for predicting the response to ICB therapy.
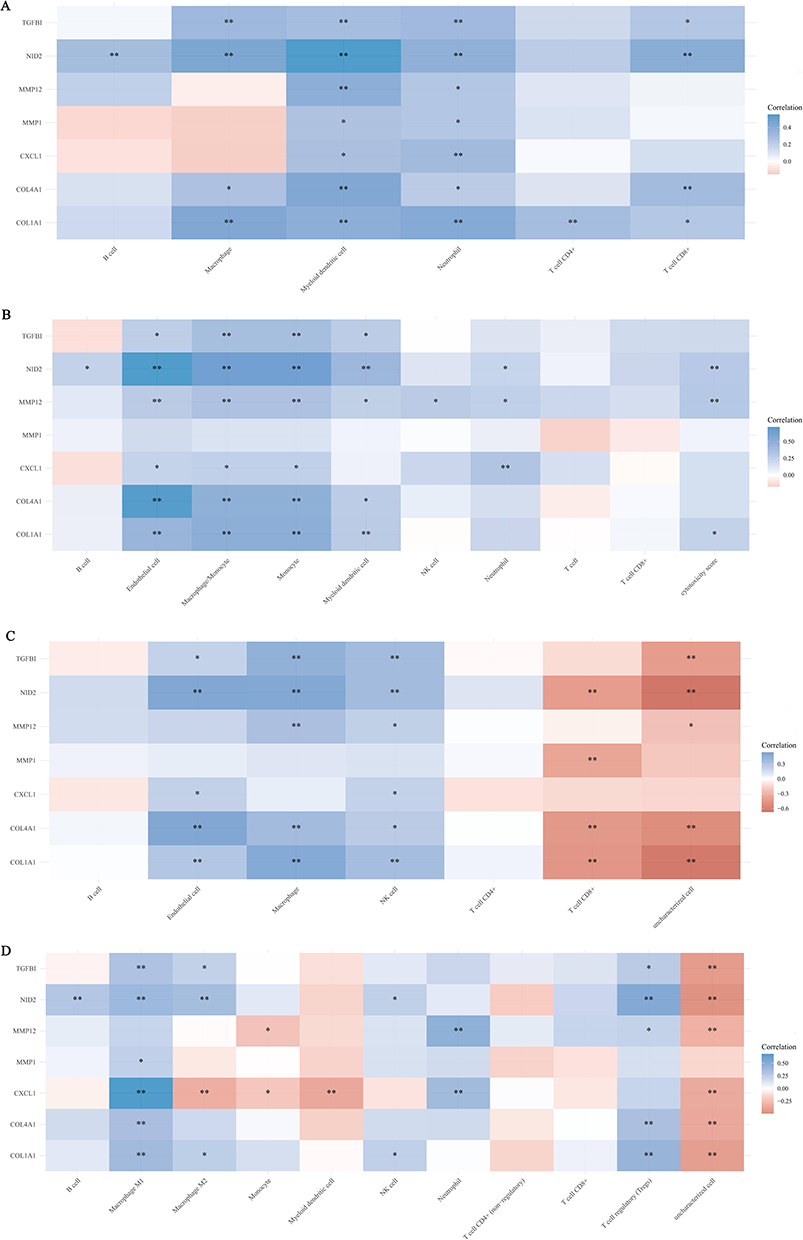 |
Figure 5 Correlation analysis of hub genes with immune cell infiltration. Based on the RNA-seq data of EAC in TCGA database, we used the R package immunedeconv, including four latest algorithms TIMER (A), MCP-counter (B), EPIC (C) and quanTIseq (D), to analyze the correlation between hub genes and different immune cell infiltrations, and the analysis results were presented by the R package pheatmap. Spearman correlation analysis was used to characterize the correlation between hub genes and different types of immune cells. *(P < 0.05) or **(P < 0.01) represents statistical significance. |
 |
Figure 6 Correlation analysis of hub genes with immune checkpoint molecules. Based on the RNA-seq data of NE, BE and EAC in the GEO database, we extracted the expression values of immune checkpoint genes CD274, CTLA4, HAVCR2, LAG3, PDCD1, PDCD1LG2, TIGIT and SIGLEC15, and then analyzed the correlation between COL1A1 (A), TGFBI (B), MMP1 (C), COL4A1 (D), NID2 (E), MMP12 (F), CXCL1 (G) and immune checkpoint genes using the R package ggstatsplot. *(P < 0.05), **(P < 0.01) or ***(P < 0.001) represents statistical significance. |
Construction of the Downstream Regulatory Network of Hub Genes
The molecular mechanisms of these hub genes in the development of EAC are largely unknown. In this study, we divided the EAC tissues in the TCGA database into two groups based on the mean expression level of hub gene, then screened out the DEGs between these two groups, and performed functional enrichment analysis (Figure 7A–G, Table S8–14). The analysis showed that there is a great degree of similarity in the functions of these hub genes in EAC, for example, they are all associated with intercellular junctions, cytoskeleton regulation, migration of inflammatory cells, epithelial cell proliferation, lymphocyte activation, vascular smooth muscle contraction, etc. The probable molecular mechanisms are mainly related to PI3K/Akt signaling pathway, JAK/STAT signaling pathway, NF-κB signaling pathway, TGF-β signaling pathway, TNF signaling pathway, Wnt signaling pathway, TLR signaling pathway, etc. These mechanisms have been shown to be closely related to the development of inflammation and tumorigenesis. In order to further reveal the probable mechanism of hub genes in the development of EAC, based on the RNA-seq data of EAC in the TCGA database, we analyzed the correlation of hub genes with tumor inflammation signature (TIS), cellular response to hypoxia, tumor proliferation signature, EMT markers, ECM-related genes, angiogenesis, apoptosis, DNA repair, G2M checkpoint, inflammatory response, PI3K/AKT/mTOR pathway, P53 pathway, MYC targets, TGF-β, IL-10 anti-inflammatory signaling pathway, genes upregulated by reactive oxygen species (ROS), DNA replication, collagen formation, degradation of ECM, ferroptosis. The TIS score was positively correlated with the sensitivity of ICB therapy. The analysis showed that the expression level of COL1A1 was positively correlated with the TIS score. In addition, COL1A1 was positively correlated with EMT, ECM-related genes, angiogenesis, apoptosis, inflammatory response, TGF-β signaling pathway, IL-10 anti-inflammatory signaling pathway, collagen formation, ECM degradation, and ferroptosis (Figure S4). TGFBI was positively correlated with EMT, ECM-related genes, angiogenesis, apoptosis, inflammatory response, PI3K/AKT/mTOR pathway, TGF-β signaling pathway, IL-10 anti-inflammatory signaling pathway, collagen formation, ECM degradation, and ferritin degradation (Figure S5). MMP1 was positively correlated with EMT, angiogenesis, inflammatory response, IL-10 anti-inflammatory signaling pathway, collagen formation, and ECM degradation (Figure S6). COL4A1 was positively correlated with TIS score, EMT, ECM-related genes, angiogenesis, apoptosis, inflammatory response, TGF-β signaling pathway, IL-10 anti-inflammatory signaling pathway, ROS pathway, collagen formation, ECM degradation, and ferroptosis (Figure S7). NID2 was positively correlated with TIS score, EMT, ECM-related genes, angiogenesis, apoptosis, inflammatory response, PI3K/AKT/mTOR pathway, TGF-β signaling pathway, IL-10 anti-inflammatory signaling pathway, ROS pathway, collagen formation, ECM degradation, and ferroptosis (Figure S8). MMP12 was positively correlated with TIS score, hypoxic response, angiogenesis, apoptosis, inflammatory response, IL-10 anti-inflammatory signaling pathway, degradation of ECM, and ferritin deposition (Figure S9). CXCL1 was positively correlated with angiogenesis, apoptosis, inflammatory response, IL-10 anti-inflammatory signaling pathway, ROS pathway, and ferroptosis (Figure S10). By constructing downstream regulatory network hub genes, we further validated that COL1A1, TGFBI, MMP1, COL4A1, NID2, MMP12, CXCL1 may play important oncogenic roles during NE-BE-EAC development.
 |
Figure 7 Construction of a downstream regulatory network for hub genes in EAC. Based on the RNA-seq data of EAC in TCGA database, EAC was divided into high and low expression groups by the mean of COL1A1 (A), TGFBI (B), MMP1 (C), COL4A1 (D), NID2 (E), MMP12 (F), CXCL1 (G) expression levels, and then screened for DEGs between these two groups. The ClusterProfiler package in R software was used to perform GO analysis and KEGG analysis of up- and down-regulated DEGs. |
Construction of Upstream Regulatory Network of Hub Genes Based on ceRNA Mechanism
In the present study, we have confirmed that the mRNA expression levels of hub genes are progressively up- or down-regulated during the development of NE-BE-EAC. However, the molecular mechanisms regulating the expression of these hub genes are not known. In this study, based on the ENCORI database, we constructed the upstream regulatory network of hub genes (Figure 8A–F). For example, in the ceRNA regulatory network of COL1A1, miR-128-3p is able to target both COL1A1 and multiple lncRNAs (OLMALINC, MEG8, NEAT1, AC118758.3), then these lncRNAs may be the ceRNAs of COL1A1. Similarly, we found that KRT18P13 may be a ceRNA for TGFBI. ATP2B1 and SP2-AS1 may be ceRNAs of MMP1. AC009487.2, AC067904.2, MSC-AS1 and AC022306.2 may be the ceRNAs of COL4A1. NEAT1, SNHG8, MALAT1 and other genes may be ceRNAs of NID2. MTND6P4, NEAT1, TUBAP2 and other genes may be ceRNAs of CXCL1.
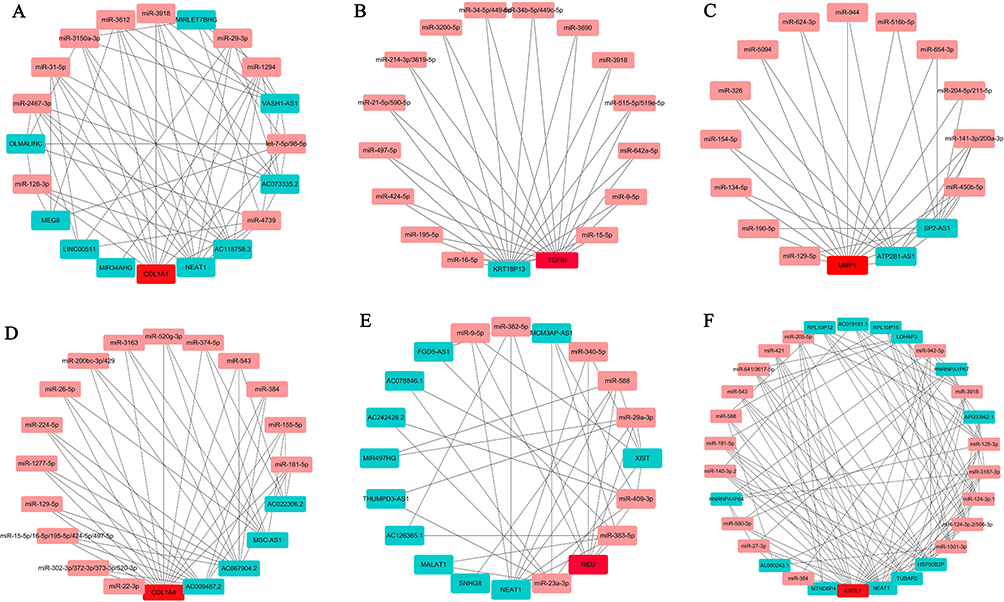 |
Figure 8 Construction of the upstream regulatory network of hub genes. Base on the ENCORI database, we predicted miRNAs that simultaneously target COL1A1 (A), TGFBI (B), MMP1 (C), COL4A1 (D), NID2 (E), CXCL1 (F) and their ceRNA molecules. Then, the list of these candidate hub genes, lncRNAs and miRNAs were imported into Cytoscape software to construct the ceRNA network of hub genes. The red color represents hub genes, the pink color represents miRNAs, and the fruit green color represents lncRNAs. The connecting lines between different genes represent the predicted interactions. |
The Expression of TGFBI Was Negatively Correlated with the OS of EAC
In the present study, our analysis revealed that hub genes are progressively up- or down-regulated during the development of NE-BE-EAC and may be involved in the development of the disease through multiple mechanisms. However, the correlation between these hub genes and the prognosis of EAC is unclear. We analyzed the correlation of hub genes with OS and RFS of EAC using Kaplan Meier plotter (Figure 9A–N). The analysis showed that the expression level of TGFBI was negatively correlated with the OS of EAC patients. In addition, although the correlation between COL1A1, COL4A1, NID2, MMP12 and overall survival of EAC patients was not statistically significant, there was a trend that the higher the expression levels of COL1A1, COL4A1, NID2, MMP12, the shorter the overall survival of patients. Similarly, we found a trend that the higher the expression levels of COL1A1, TGFBI, COL4A1, NID2, and MMP12, the shorter the RFS of the patients. In conclusion, our findings suggested that TGFBI could be used as biomarkers to predict the prognosis of EAC patients.
 |
Figure 9 Correlation analysis of hub genes with overall survival (OS) and relapse-free survival (RFS) of EAC patients. Based on the RNA-seq data of EAC tissues in the TCGA database, the online tool Kaplan-Meier Plotter was used to analyze the correlation between hub genes and OS (A–G) and RFS (H–N) of EAC patients. |
3 Genes Model Was Constructed to Predict the Risk of Disease Development in NE-BE-EAC
The development of NE-BE-EAC is a long process.25 Although, BE is a precancerous lesion of EAC, not all BE will progress to EAC. Then, finding biomarkers that can predict whether BE will become cancerous or not has a very important diagnostic value. Firstly, we analyzed the predictive power of the single hub gene based on Area Under the Curve (AUC). In general, the closer the AUC is to 1, the better the predictive power of the model. According to the ROC curves analysis, all 7 hub genes had a comparatively good diagnostic value, with all of the genes acting as risk factors for the diagnosis of cancer (Figure 10A). Furthermore, we performed logistic regression with all 7 hub genes and the results showed that only TGFBI, MMP1 and CXCL1 could be significantly associated with cancer diagnosis and risk in this model based on the selection of P values (P < 0.1), and the top exponentiated values of the coefficients, although this 7 genes model exhibited excellent diagnostic performance (AUC=0.794) (Figure 10B, Table 1). In this case, the final 3 genes model was constructed with TGFBI, MMP1 and CXCL1 expression data, indicating a satisfactory diagnostic value (AUC=0.787) (Figure 10C, Table 2). Therefore, we believe that the 3 genes model is an optimal model to predict the risk of disease development in NE-BE-EAC.
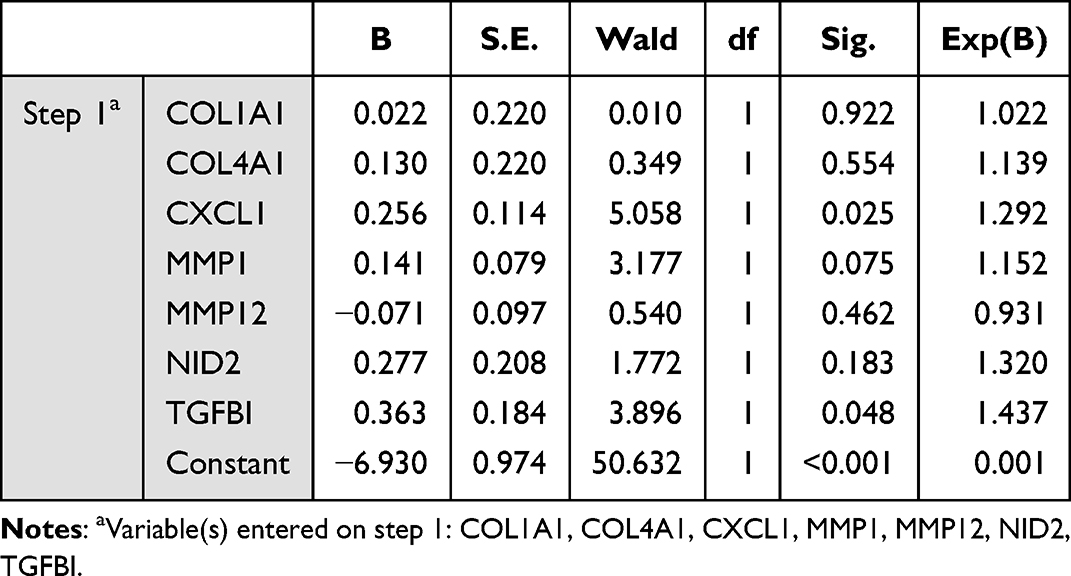 |
Table 1 Variables in the Equation Based on 7 Genes Model |
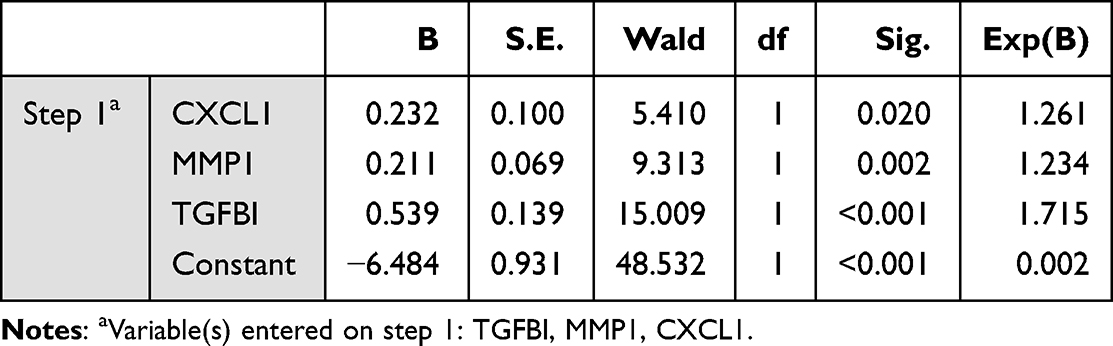 |
Table 2 Variables in the Equation Based on 3 Genes Model |
 |
Figure 10 Construction of disease risk prediction model for NE-BE-EAC based on hub genes. Based on RNA-seq data from 94 NE tissues, 113 BE tissues and 147 EAC tissues in the GEO database, the disease risk prediction based on single hub gene was assessed by ROC curves, and the accuracy of the model was assessed by AUC (A). Similarly, we constructed the risk prediction models of disease progression based on 7 genes (B) and 3 genes (TGFBI, MMP1 and CXCL1) (C). The AUC values are presented separately in the ROC curves. |
Potential Drugs Were Identified to Inhibit the Development of NE-BE-EAC Based on the Expression of Hub Genes
In the present study, our analysis showed that these hub genes play an important role in the development of NE-BE-EAC, which suggests that they may be promising therapeutic targets. We analyzed the correlation between IC50 drug data of 265 small molecules from Genomics of Drug Sensitivity in Cancer (GDSC) and the expression levels of hub genes, where a positive correlation indicates that a certain drug treatment leads to an upregulation of the expression levels of hub genes (Figure S11). Therefore, through drug sensitivity analysis, we can select drugs that are negatively correlated with the expression levels of hub genes, and these drugs will inhibit the expression levels of hub genes to exert anti-tumor therapeutic effects. Our analysis showed that PI3K inhibitor TGX221, bleomycin, PKC inhibitor Midostaurin, Bcr-Abl inhibitor Dasatinib, HSP90 inhibitor 17-AAG, and Docetaxel were negatively correlated with the expression levels of oncogenic hub genes, suggesting the potential of these drugs to inhibit disease progression in NE-BE-EAC.
Discussion
There is growing evidence that the progression of BE to EAC is a multistep process that includes the development of non-developmental abnormal BE to low-grade atypical hyperplasia, then to high-grade atypical hyperplasia, and ultimately to EAC.25–27 However, the molecular mechanism by which BE becomes cancerous is largely unknown. In view of the high lethality of EAC, it is of great clinical value to study the carcinogenic mechanisms of BE and search for biomarkers that predict disease progression. From the perspective of tumor prevention, timely detection and treatment of BE is an important strategy to prevent EAC.
BE is the only recognized precancerous lesion of EAC, and almost all EAC originates from BE.28 However, majority of EAC patients are unaware of their history of BE. In this study, we screened RNA-seq data of 94 NE epithelial tissues, 113 BE tissues and 147 EAC tissues in the GEO database, and analyzed the DEGs between normal and BE, normal and EAC, BE and EAC by bioinformatics methods, respectively. Surprisingly, we found that 69% of upregulated genes in BE overlapped with 84% of upregulated genes in EAC relative to NE tissue, while 80% of downregulated genes in BE overlapped with 89% of downregulated genes in EAC. Such a high overlap rate is surprising, suggesting that BE and EAC share highly similar genetic characteristics and coincidentally demonstrating the close association between BE and EAC. It is well known that activation of oncogenes and/or inactivation of oncogenes is the central mechanism leading to tumor development. In particular, during tumorigenesis, the generation of the first cancer cell is a progressive process involving a multi-stage response and accumulation of mutations, requiring the involvement of many oncogenes and tumor suppressor genes.29 Precancerous lesions are an intermediate stage in the transformation of normal cells to cancer cells, which have similar and different genetic characteristics from tumors.30,31 Moreover, they differ in their biological behavior and clinical manifestations, such as cell proliferation ability, motility, etc., which may be associated with progressive abnormal expression of oncogenes and tumor suppressor genes. In the present study, we identified progressive upregulated oncogenes and downregulated oncogenes in the disease process, which may be key factors influencing the process of NE-BE-EAC.
Dysregulation of immune function is one of the important factors that promote tumor development.32 Tumor cells evade recognition and attack by the immune system through various mechanisms, among which immunosuppression induced by immune checkpoint molecules such as PD-L1 and CTLA is one of the main mechanisms leading to tumor immune escape.33,34 Under normal conditions, immune checkpoint molecules can maintain immune tolerance by regulating the strength of autoimmune response. However, during tumor development, activation of immune checkpoint PD-L1 can suppress immune function and help tumor cells evade the defense and attack of immune system. In the present study, we found that oncogenic hub genes positively correlated with the expression levels of PD-L1, CTLA and other immune checkpoint molecules, suggesting that oncogenic hub genes may inhibit the surveillance function of the immune system by regulating the expression of immune checkpoint molecules during the transformation of BE to EAC, which ultimately promotes the formation and rapid proliferation of EAC cells. In addition, we found that the expression levels of oncogenic hub genes positively correlated with the infiltration of inflammatory cells such as B cells, endothelial cells, macrophages, monocytes, NK cells, neutrophils, and Treg cells in the EAC tumor microenvironment. Under normal circumstances, B cells, NK cells and other immune cells are involved in the clearance of tumor cells by the immune system, but this requires a sufficient number of immune cells that are functioning properly.35,36 Upregulated immune checkpoint molecules inhibit the activation of immune cells, so oncogenic hub genes may lead to inactivation of immune cells such as B cells, NK cells, and ultimately promote the proliferation of EAC cells.
Most people with EAC are unaware of whether they have BE or not. In addition, not all BE progresses to cancer, so many people may miss the best time to treat BE because they ignore it. These discouraging results are mainly due to the lack of biomarkers to predict whether BE is cancerous or not. In the present study, we evaluated the potential of hub genes as biomarkers for EAC prognosis, diagnosis and treatment. First, our results suggest that TGFBI can be used as biomarkers to predict the prognosis of EAC patients. In addition, although the correlation of other hub genes with OS and RFS of EAC was not statistically significant, there was some degree of correlation, which may be due to the insufficient sample size of EAC in the TCGA database. It is essential to increase the sample size to recalculate the correlation between hub genes and EAC prognosis. Next, we constructed a risk model for predicting disease progression of NE-BE-EAC, which is one of the core results of this study. By comparing multiple risk models, we finally determined that a 3 genes model based on CXCL1, MMP1 and TGFBI was optimal. According to this model, we can predict the possibility of BE to be cancerous by detecting the expression levels of CXCL1 and TGFBI in tissues. Specifically, when CXCL1, MMP1 and TGFBI are progressively upregulated, it suggests a high risk of disease progression. For the exploration of hub genes as biomarkers for clinical treatment, we found that COL1A1, NID2 and COL4A1 were significantly correlated with TMB, TIDE scores, suggesting that these hub genes can be used as biomarkers to predict the effect of tumor immunotherapy. Finally, based on drug sensitivity analysis, we screened PI3K inhibitor TGX221, bleomycin, PKC inhibitor Midostaurin, Bcr-Abl inhibitor Dasatinib, HSP90 inhibitor 17-AAG, and Docetaxel as potential candidates for inhibiting the progression of BE to EAC.
Currently, there are few studies focusing on the dynamic process of BE conversion to EAC. In the present study, based on RNA-seq data from a large number of clinical samples and experimental validation, we identified hub genes in the disease progression of NE-BE-EAC. Through bioinformatics analysis, we preliminarily revealed the probable molecular mechanisms of these hub genes and constructed the upstream regulatory network of hub genes. More importantly, we examined the potential of hub genes as biomarkers for EAC prognosis, prediction of disease progression and tumor immunotherapy, and proposed potential chemotherapeutic agents to inhibit disease progression in NE-BE-EAC, which have potential clinical applications.
Data Sharing Statement
All the results are presented in the article and Supplementary Material. Further inquiries can be directed to the corresponding authors.
Ethics Statement
The current study has been approved by the Ethics Committee of Nanyang Institute of Technology (the ethics approval code: NYISTIRB2021-004). All the patients have finished the written informed consent. Experiments containing human participants adhered to the Declaration of Helsinki.
Acknowledgments
We acknowledge the contributions from R software, Cytoscape software, TCGA database, GEO database, STRING database, ENCORI database.
Funding
This work was supported by the National Nature Science Foundation of China (82002592, 82273058), the Natural Science Foundation of Henan (202300410019), Doctoral Research Start-up Fund Project of Nanyang Institute of Technology, Talent Program of Central China: Science and Technology Innovation Leading Talent (No. 234200510006) and the science and technology research project of Nanyang (KJGG179).
Disclosure
The authors declare no potential conflict of interest.
References
1. Lin Y, Wang HL, Fang K, Zheng Y, Wu J. International trends in esophageal cancer incidence rates by histological subtype (1990–2012) and prediction of the rates to 2030. Esophagus. 2022;19(4):560–568. doi:10.1007/s10388-022-00927-4
2. Wang S, Zheng R, Arnold M, et al. Global and national trends in the age-specific sex ratio of esophageal cancer and gastric cancer by subtype. Int J Cancer. 2022;151(9):1447–1461. doi:10.1002/ijc.34158
3. Nealis TB, Washington K, Keswani RN. Endoscopic therapy of esophageal premalignancy and early malignancy. J Natl Compr Canc Netw. 2011;9(8):890–899. doi:10.6004/jnccn.2011.0073
4. Shaheen NJ, Smith MS, Odze RD. Progression of Barrett’s esophagus, crypt dysplasia, and low-grade dysplasia diagnosed by wide-area transepithelial sampling with 3-dimensional computer-assisted analysis: a retrospective analysis. Gastrointest Endosc. 2022;95(3):410–418e1. doi:10.1016/j.gie.2021.09.014
5. Peleg N, Schmilovitz-Weiss H, Shamah S, Schwartz A, Dotan I, Sapoznikov B. Neutrophil to lymphocyte ratio and risk of neoplastic progression in patients with Barrett’s esophagus. Endoscopy. 2021;53(8):774–781. doi:10.1055/a-1292-8747
6. Steele D, Baig KKK, Peter S. Evolving screening and surveillance techniques for Barrett’s esophagus. World J Gastroenterol. 2019;25(17):2045–2057. doi:10.3748/wjg.v25.i17.2045
7. Beveridge CA, Mittal C, Muthusamy VR, et al. Identification of visible lesions during surveillance endoscopy for Barrett’s esophagus: a video-based survey study. Gastrointest Endosc. 2023;97(2):241–247 e2. doi:10.1016/j.gie.2022.08.024
8. Maione F, Chini A, Maione R, et al. Endoscopic diagnosis and management of barrett’s esophagus with low-grade dysplasia. Diagnostics. 2022;12(5):1295. doi:10.3390/diagnostics12051295
9. Amano Y, Ishimura N, Ishihara S. Is malignant potential of barrett’s esophagus predictable by endoscopy findings? Life. 2020;10(10):244. doi:10.3390/life10100244
10. Helminen O, Melkko J, Saarnio J, et al. Predictive value of p53, Ki67 and TLR5 in neoplastic progression of Barrett’s esophagus: a matched case-control study. Virchows Arch. 2022;481(3):467–476. doi:10.1007/s00428-022-03340-5
11. Januszewicz W, Pilonis ND, Sawas T, et al. The utility of P53 immunohistochemistry in the diagnosis of Barrett’s oesophagus with indefinite for dysplasia. Histopathology. 2022;80(7):1081–1090. doi:10.1111/his.14642
12. Bowman CJ, Zhang R, Balitzer D, et al. Persistent or recurrent Barrett’s neoplasia after an endoscopic therapy session is associated with DNA content abnormality and can be detected by DNA flow cytometric analysis of paraffin-embedded tissue. Mod Pathol. 2021;34(10):1889–1900. doi:10.1038/s41379-021-00832-8
13. Ireland CJ, Thrift AP, Esterman A. Risk prediction models for barrett’s esophagus discriminate well and are generalizable in an external validation study. Dig Dis Sci. 2020;65(10):2992–2999. doi:10.1007/s10620-019-06018-2
14. Faghani S, Codipilly DC, David V, et al. Development of a deep learning model for the histologic diagnosis of dysplasia in Barrett’s esophagus. Gastrointest Endosc. 2022;96(6):918–925 e3. doi:10.1016/j.gie.2022.06.013
15. van der Ende-van Loon MCM, Nieuwkerk PT, van Stiphout SHC, et al. Barrett Esophagus: quality of life and factors associated with illness perception. United Euro Gastroenterol J. 2022;10(7):721–729. doi:10.1002/ueg2.12266
16. Milano F, van Baal JW, Buttar NS, et al. Bone morphogenetic protein 4 expressed in esophagitis induces a columnar phenotype in esophageal squamous cells. Gastroenterology. 2007;132(7):2412–2421. doi:10.1053/j.gastro.2007.03.026
17. Souza RF, Krishnan K, Spechler SJ. Acid, bile, and CDX: the ABCs of making Barrett’s metaplasia. Am J Physiol Gastrointest Liver Physiol. 2008;295(2):G211–8. doi:10.1152/ajpgi.90250.2008
18. Avissar NE, Toia L, Hu Y, et al. Bile acid alone, or in combination with acid, induces CDX2 expression through activation of the epidermal growth factor receptor (EGFR). J Gastrointest Surg. 2009;13(2):212–222. doi:10.1007/s11605-008-0720-7
19. Chen L, Lu H, Peng D, et al. Activation of NOTCH signaling via DLL1 is mediated by APE1-redox-dependent NF-kappaB activation in oesophageal adenocarcinoma. Gut. 2023;72(3):421–432. doi:10.1136/gutjnl-2022-327076
20. Yen CJ, Izzo JG, Lee DF, et al. Bile acid exposure up-regulates tuberous sclerosis complex 1/mammalian target of rapamycin pathway in Barrett’s-associated esophageal adenocarcinoma. Cancer Res. 2008;68(8):2632–2640. doi:10.1158/0008-5472.CAN-07-5460
21. Jiang P, Gu S, Pan D, et al. Signatures of T cell dysfunction and exclusion predict cancer immunotherapy response. Nat Med. 2018;24(10):1550–1558. doi:10.1038/s41591-018-0136-1
22. Li K, Zhang J, Tian Y, et al. The Wnt/beta-catenin/VASP positive feedback loop drives cell proliferation and migration in breast cancer. Oncogene. 2020;39(11):2258–2274. doi:10.1038/s41388-019-1145-3
23. Li K, Wang Q, Bian H, et al. Comprehensive analysis reveals USP45 as a novel putative oncogene in pan-cancer. Front Mol Biosci. 2022;9:886904. doi:10.3389/fmolb.2022.886904
24. Louie BH, Kato S, Kim KH, et al. Pan-cancer molecular tumor board experience with biomarker-driven precision immunotherapy. NPJ Prec Oncol. 2022;6(1):67. doi:10.1038/s41698-022-00309-0
25. Eluri S, Reddy S, Ketchem CC, et al. Low prevalence of endoscopic screening for barrett’s esophagus in a screening-eligible primary care population. Am J Gastroenterol. 2022;117(11):1764–1771. doi:10.14309/ajg.0000000000001935
26. Venkitachalam S, Babu D, Ravillah D, et al. The Ephrin B2 receptor tyrosine kinase is a regulator of proto-oncogene MYC and molecular programs central to barrett’s Neoplasia. Gastroenterology. 2022;163(5):1228–1241. doi:10.1053/j.gastro.2022.07.045
27. Roumans CAM, Zellenrath PA, Steyerberg EW, et al. Sex differences in neoplastic progression in barrett’s esophagus: a multicenter prospective cohort study. Cancers. 2022;14(13):3240. doi:10.3390/cancers14133240
28. Sundaram S, Kim EN, Jones GM, et al. Deciphering the immune complexity in esophageal adenocarcinoma and pre-cancerous lesions with sequential multiplex immunohistochemistry and sparse subspace clustering approach. Front Immunol. 2022;13:874255. doi:10.3389/fimmu.2022.874255
29. Cekani E, Epistolio S, Dazio G, et al. Molecular biology and therapeutic perspectives for K-Ras mutant non-small cell lung cancers. Cancers. 2022;14(17):4103. doi:10.3390/cancers14174103
30. Vedantam S, Katona BW, Sussman DA, Kumar S. Outcomes of upper endoscopy screening in Lynch syndrome: a meta-analysis. Gastrointest Endosc. 2023;97(1):2–10 e1. doi:10.1016/j.gie.2022.08.040
31. Kim JS, Kim BG, Hwang SH. Efficacy of artificial intelligence-assisted discrimination of oral cancerous lesions from normal mucosa based on the oral mucosal image: a systematic review and meta-analysis. Cancers. 2022;14(14). doi:10.3390/cancers14143499
32. Ribeiro R, Carvalho MJ, Goncalves J, Moreira JN. Immunotherapy in triple-negative breast cancer: insights into tumor immune landscape and therapeutic opportunities. Front Mol Biosci. 2022;9:903065. doi:10.3389/fmolb.2022.903065
33. Wang L, Xu T, Yang X, et al. Immunosuppression induced by glutamine deprivation occurs via activating PD-L1 transcription in bladder cancer. Front Mol Biosci. 2021;8:687305. doi:10.3389/fmolb.2021.687305
34. Gan X, Shan Q, Li H, et al. An anti-CTLA-4 heavy chain-only antibody with enhanced T(reg) depletion shows excellent preclinical efficacy and safety profile. Proc Natl Acad Sci USA. 2022;119(32):e2200879119. doi:10.1073/pnas.2200879119
35. Takahashi K, Kurashina K, Yamaguchi H, et al. Altered intraperitoneal immune microenvironment in patients with peritoneal metastases from gastric cancer. Front Immunol. 2022;13:969468. doi:10.3389/fimmu.2022.969468
36. Sukri A, Hanafiah A, Kosai NR. The roles of immune cells in gastric cancer: anti-cancer or pro-cancer? Cancers. 2022;14(16):3922. doi:10.3390/cancers14163922
 © 2023 The Author(s). This work is published and licensed by Dove Medical Press Limited. The
full terms of this license are available at https://www.dovepress.com/terms
and incorporate the Creative Commons Attribution
- Non Commercial (unported, 3.0) License.
By accessing the work you hereby accept the Terms. Non-commercial uses of the work are permitted
without any further permission from Dove Medical Press Limited, provided the work is properly
attributed. For permission for commercial use of this work, please see paragraphs 4.2 and 5 of our Terms.
© 2023 The Author(s). This work is published and licensed by Dove Medical Press Limited. The
full terms of this license are available at https://www.dovepress.com/terms
and incorporate the Creative Commons Attribution
- Non Commercial (unported, 3.0) License.
By accessing the work you hereby accept the Terms. Non-commercial uses of the work are permitted
without any further permission from Dove Medical Press Limited, provided the work is properly
attributed. For permission for commercial use of this work, please see paragraphs 4.2 and 5 of our Terms.