Back to Journals » Cancer Management and Research » Volume 12
Construction of Nomograms for Predicting Pathological Complete Response and Tumor Shrinkage Size in Breast Cancer
Authors Yan S, Wang W, Zhu B, Pan X, Wu X, Tao W ![]()
Received 4 July 2020
Accepted for publication 28 August 2020
Published 10 September 2020 Volume 2020:12 Pages 8313—8323
DOI https://doi.org/10.2147/CMAR.S270687
Checked for plagiarism Yes
Review by Single anonymous peer review
Peer reviewer comments 2
Editor who approved publication: Dr Sanjeev K. Srivastava
Shuai Yan,1,* Wenjie Wang,2,* Bifa Zhu,3 Xixi Pan,1 Xiaoyan Wu,2 Weiyang Tao1,4
1Department of Breast Surgery, Harbin Medical University Cancer Hospital, Harbin 150081, People’s Republic of China; 2Department of Nutrition and Food Hygiene, The National Key Discipline, School of Public Health, Harbin Medical University, Harbin 150081, People’s Republic of China; 3Department of Oncology, Xianning Central Hospital, The First Affiliated Hospital of Hubei University of Science and Technology, Xianning 437000, People’s Republic of China; 4Department of Thyroid and Breast Surgery, The Fifth Affiliated Hospital of Sun Yat-Sen University, Zhuhai 519000, People’s Republic of China
*These authors contributed equally to this work
Correspondence: Weiyang Tao
Department of Breast Surgery, Harbin Medical University Cancer Hospital, No. 150, Haping Road, Nangang District, Harbin 150081, People’s Republic of China
Tel/Fax + 86 451 8629 8059
Email [email protected]
Purpose: Pathological complete response (pCR) is the goal of neoadjuvant chemotherapy (NAC) for the HER2-positive and triple-negative subtypes of breast cancer and is related to survival benefit; however, luminal breast cancer is not sensitive to NAC, and the size of tumor shrinkage is a more meaningful clinical indicator for the luminal breast cancer subtype. We wanted to use a nomogram or formula to develop and implement a series of prediction models for pCR or tumor shrinkage size.
Patients and Methods: We developed a prediction model in a primary cohort consisting of 498 patients with invasive breast cancer, and the data were gathered from July 2016 to September 2018. The endpoint was pCR and tumor shrinkage size. In the primary cohort, the HER2-positive cohort, and the triple-negative cohort, multivariate logistic regression analysis was used to screen the significant clinical features and clinicopathological features to develop nomograms. In the luminal group, multivariate linear regression analysis was used to test the risk factors that affect tumor shrinkage size. The area under the receiver operating characteristic curve (AUC) and calibration curves were adopted to evaluate and analyze the discrimination and calibration ability of nomograms. Furthermore, we also performed internal validation and independent validation in the primary cohort.
Results: ER status, KI67 status, HER2 status, number of NAC cycles, and tumor size were independent predictive factors of pCR in the primary cohort. These indicators had good discrimination and calibration in the primary and validation cohorts (AUC: 0.873, 0.820). The nomogram for HER2-positive and triple-negative breast cancer (TNBC) had an AUC of 0.820 and 0.785, respectively. Both the HER2 positive and TNBC nomogram calibration curves indicated significant agreement. Moreover, the luminal subtype prediction model was Y (tumor shrinkage size) = − 0.576 × (age at diagnosis) + 2.158 × (number of NAC cycles) + 0.233 × (pre-NAC tumor size) + 51.662.
Conclusion: Utilizing this predictive model will enable us to identify patients at high probability for pCR after NAC. Clinicians can stratify these patients and make individualized and personalized recommendations for therapy.
Keywords: breast cancer, neoadjuvant chemotherapy, pathologic complete response, nomogram
Introduction
Neoadjuvant chemotherapy (NAC) has become a standard treatment for locally advanced breast cancer. China recommended NAC for patients with a massive tumor volume, lymph node metastasis, HER2-positive breast cancer, or triple-negative breast cancer (TNBC).1 The primary clinical benefit of NAC, compared to adjuvant chemotherapy, is the down-staging of a large tumor and an increased rate of breast-conserving surgery.2,3 Besides, luminal breast cancer has been considered resistant to chemotherapy for a long time.4 NAC can observe the sensitivity of the luminal breast cancer and facilitate timely surgical treatment.
Pathological response data after NAC reflects tumor chemotherapy sensitivity.5 Some trials have suggested and further confirmed the relationship between chemotherapy response and survival.6,7 Indeed, pathologic complete response (pCR) is associated with improved overall survival and disease-free survival. Furthermore, several studies have demonstrated that morphological changes and the percentage of cancer drugs has certain connections with pCR.8,9 Trastuzumab and pertuzumab are humanized monoclonal antibodies targeting different epitopes of HER2. In HER2-positive subtypes, treatment with dual anti-HER2 blockade has significantly improved the pCR rate.10 Additionally, some studies reach the conclusion that the clinical tumor stage and clinical nodal stage were predictors of pCR in TNBC.11–13
On the other hand, previous studies of predictive factors of NAC for breast cancer suggested that the ability of a single factor to predict pCR was insufficient. In addition, we combined multiple potential efficacy-related elements to establish a nomogram, which may improve prediction accuracy. The nomogram, as a predictive model, can predict the probability of different events by intuitive graph.14
In our study, we retrospectively analyzed clinicopathological data of 498 breast cancer patients, who were all underwent NAC at the Harbin Medical University Cancer Hospital. We formulated a series of nomograms to accurately predict pCR and the size of tumor shrinkage in breast cancer patients with different molecular subtypes who underwent NAC.
Patients and Methods
Patients
In this retrospective single-center study, we examined 847 consecutive patients who underwent NAC for breast carcinoma at the Harbin Medical University Cancer Hospital between July 2016 and September 2018. Among them, 498 patients were randomly selected as the primary cohort. Meanwhile, we adopted the bootstrap resampling method to extract 120 patients from primary cohorts for internal validation. An independent validation cohort of 200 consecutive patients was screened from 847 consecutive patients using the same criteria as that used for the primary cohort. Besides, we excluded 149 people based on the exclusion and inclusion criteria.
The clinicopathological inclusion criteria for the patients were as follows: (I) patients with preoperative pathology-proven unilateral breast carcinoma; (II) all patients received NAC; and (III) patients were 18 years or older, and women. The exclusion criteria were summarized as follows: (I) distant metastasis identified on ultrasonography, CT or MRI; (II) combination with other malignant tumors; (III) no breast surgery undergone after complete NAC; (IV) history of cancer; (V) occult breast cancer; and (VI) incomplete clinicopathological data.
Evaluation of Pathologic
Two independent institutional pathologists made pathological response determinations according to the Miller-Payne grading system.15 We divided the pathological response into five levels based on the number of tumor cells between the pre-NAC fine-needle aspiration biopsy and the postoperative surgical specimen. According to the most widely used definition, pCR was recognized as no evidence of residual invasive cancer both in breast and axilla. Additionally, we reviewed immunohistochemical (IHC) results for the estrogen receptor (ER), progesterone receptor (PR), KI67, and HER2 before NAC to assess molecular subtype classification. IHC results after NAC were not taken into consideration in the study because patients who reached pCR were undetectable by IHC. An ER and PR expression level of >1% by immunohistochemical staining was considered positive. Moreover, we classified the level of KI67 expression as high or low, with a cut-off point of 14%.16 HER2 expression was determined by IHC and scored by the criteria of the American Society of Clinical Oncology (ASCO)/College of American Pathologist (CAP) guidelines.17 Tumors were further examined by fluorescence in situ hybridization (FISH) when HER2 scores were 2+. If FISH detection was unable to determine the interval, the HER2 score was considered as an uncertain one. Based on the IHC results, tumors were categorized using the St. Gallen criteria as luminal A (ER/PR+, HER2−, and low KI67), luminal B (ER+, HER2−, and either high KI67 or PR−), HER2+ (ER− or ER+ and HER2+), or triple-negative (ER−, PR− and HER2−) subtypes.18
Observation Index
Our study recorded the following data: (I) general information of the patients, such as sex, age, and menopausal status; (II) examination of findings including tumor size, clinical axillary lymph node status, and tumor shrinkage mode; and (III) pre- and post-NAC pathological data, such as the pathological response and axillary lymph node status.
Tumor shrinkage size = (pre-NAC tumor size - post-NAC tumor size)/pre-NAC tumor size. Tumor size was the longest tumor diameter measured by ultrasound or MRI. All laboratory indexes, including hemoglobin count, neutrophil count, lymphocyte count, blood glucose, and blood lipid, were estimated before NAC.
This study was reviewed and approved by the Ethics Committee of the Harbin Medical University Cancer Hospital. All patients provided informed written consent.
Construction of the Nomogram
First, univariate logistic regression analysis was performed to evaluate the association between each clinical variable and pCR. The potential risk factors were entered into the multivariate logistic regression analysis (p<0.05). Furthermore, the nomogram was constructed based on both the clinical and statistical significance of the variables.
Validation and Calibration of the Nomogram
The external validation (n=200) and internal validation (n=120) of the model were adopted to examine and evaluate the performance of the nomogram in the primary cohort. The discrimination ability of the model for predicting pCR was estimated by using the area under the receiver operating characteristic curve (AUC). Meanwhile, the calibration of the model was assessed by using the calibration curve.
Statistical Analysis
We described baseline data for patients in the pCR and non-pCR groups according to histopathologic findings and distinct clinical characteristics. Selected clinicopathologic and clinical feature parameters were presented as the mean (standard deviation) for continuous variables and number (percentage) for categorical variables and the differences between the two groups were tested using t statistics and chi-square test, respectively. In addition, for luminal subgroups, multivariate linear regression models were applied with stepwise regression to investigate which variables were significant predictors of the size of tumor shrinkage.
The logistic regression model was employed to calculate the odds ratio (OR) and 95% confidence interval (95% CI). All statistical analyses were performed in R project 3.5.3 (The R Foundation for Statistical Computing, Vienna, Austria), the R package ‘rms’ was adopted to construct the nomograms. A two-sided P < 0.05 was regarded as statistically significant.
Results
Patient Characteristics
We included 498 patients in the analysis, 68 of whom (13.7%) achieved pCR. Table 1 and Supplement Table 1summarizes demographic, treatment-related, and clinicopathologic characteristics. These tables indicate that the mean age was 49.20 ± 9.74 years in the pCR group and 48.84 ± 9.56 years in the non-pCR group (P = 0.776). The menopausal age was 50.12 ± 3.98 years in the pCR group and 51.97 ± 3.88 years in the non-pCR group (P = 0.039). In terms of tumor size before NAC, most of the patients who achieved pCR had a tumor size of 2 ~ 5 cm (73.5%) (P = 0.017). Moreover, the group with a tumor size < 2 cm after NAC had the highest pCR rate (89.7%, P < 0.001).
 |
Table 1 Baseline Patient Characteristics |
There was a significant difference in the constituent ratio of pCR among different molecular subtypes (P < 0.001). The luminal A subtype had the lowest pCR rate (1.6%), and TNBC had the highest pCR rate (61.3%). In addition, there was a higher percentage of pCR in the HER2-positive subtype (33.9%) than in the luminal B subtype (3.2%) (Figure 1A). We also found a significant correlation between the pCR rate and expression levels of KI67 (P < 0.001). The highest pCR rate in the KI67 > 50% group was 41.2%, which was significantly different from that of the KI67 ≤ 14% (8.8%) group. Moreover, 38.2% of patients in the group with KI67 between 26% and 50% achieved pCR, which was better than patients with KI67 scores between 15% and 25% (11.8%) (Figure 1B).
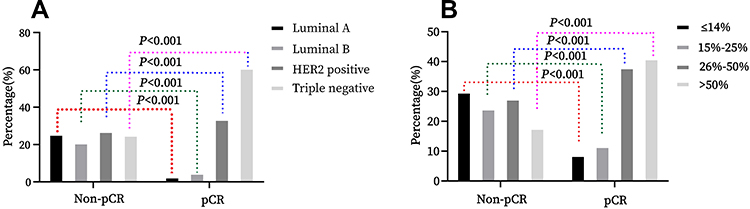 |
Figure 1 pCR and non-pCR parameters changes of molecular subtypes, and KI67. |
Correlation analysis revealed that the number of NAC cycles also had significant relation to the pCR rate (P = 0.005). The pathological complete response rate in < 4 cycles, 4–6 cycles, and ≥ 6 cycles were 8.8%, 20.6%, and 70.6%, respectively. Additionally, the incidence of pCR was different among various types of surgery (P = 0.011). The proportion of patients undergoing breast-conserving surgery was the highest in the pCR group (11.8% compared to only 4.0% in the non-pCR group).
Multivariate Analysis of pCR
In the primary cohort, multivariate logistic regression analysis demonstrated that ER, KI67, HER2, tumor size (pre-NAC) and number of NAC cycles were independent predictive factors of pCR, and ORs (95% CIs) were 0.141 (0.062, 0.321), 1.773 (1.196, 2.630), 2.427 (1.389, 4.239), 0.473 (0.243, 0.923) and 2.824 (1.387, 5.746) respectively (Table 2).
 |
Table 2 Multivariate Logistic Regression Model of Pathologic Complete Response |
We have established a nomogram which accurately predicts the probability of pCR in the whole population. Then, we investigated whether the nomogram would predict pCR in the critical demographics (HER2-positive and TNBC subgroup) more reasonably and precisely. In HER2-positive breast cancer patients, multivariate logistic regression analysis indicates that ER, KI67, tumor size (pre-NAC), and the number of NAC cycles were associated with pCR rates. It was shown that lower ER expression was associated with higher pCR rates (OR (95% CI), 0.170 (0.043, 0.667)). High KI67 expression and more NAC cycles were also associated with higher pCR rates (OR (95% CI), 2.231 (1.126, 4.418), and 2.868 (1.079, 8.390), respectively (Table 3).
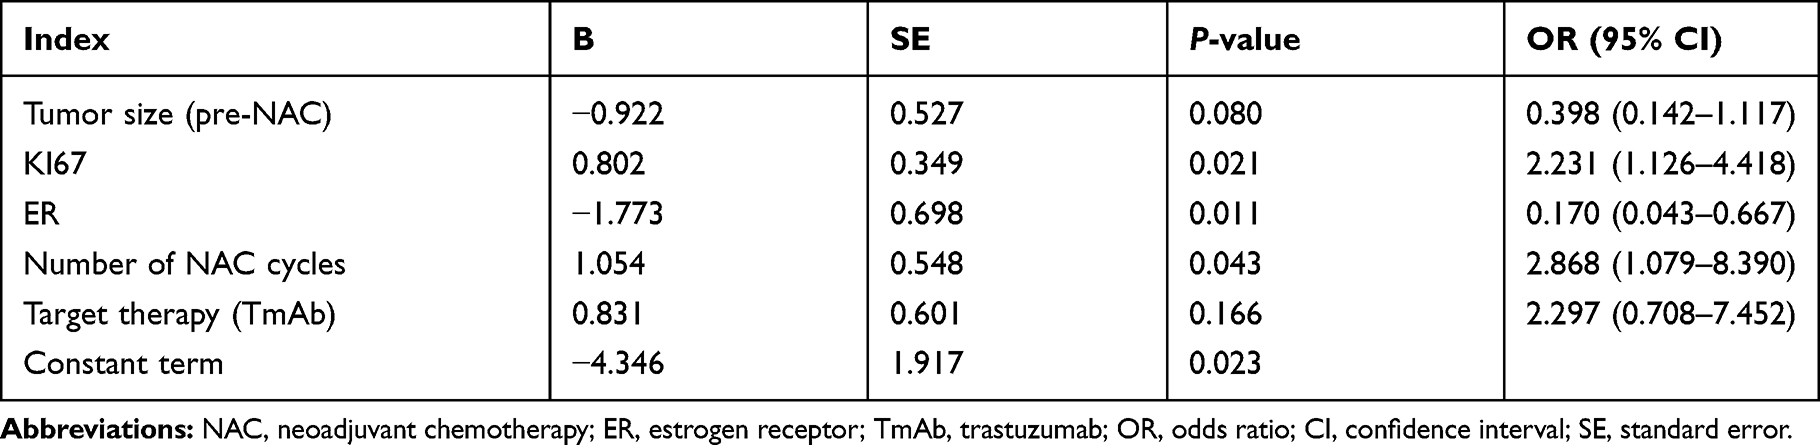 |
Table 3 Multivariate Logistic Regression Model of Pathologic Complete Response in HER2-Positive Subtype |
In the TNBC group, patients with larger tumor size were less likely to achieve pCR than those with smaller tumors after NAC (OR: 0.144; 95% CI: 0.044, 0.479). TNBC patients with a high KI67 level more easily reached pCR (OR: 1.893; 95% CI: 1.182, 3.033). In addition, menopausal status (OR: 0.439; 95% CI: 0.185, 0.986) was an independent predictive factor of pCR (Table 4).
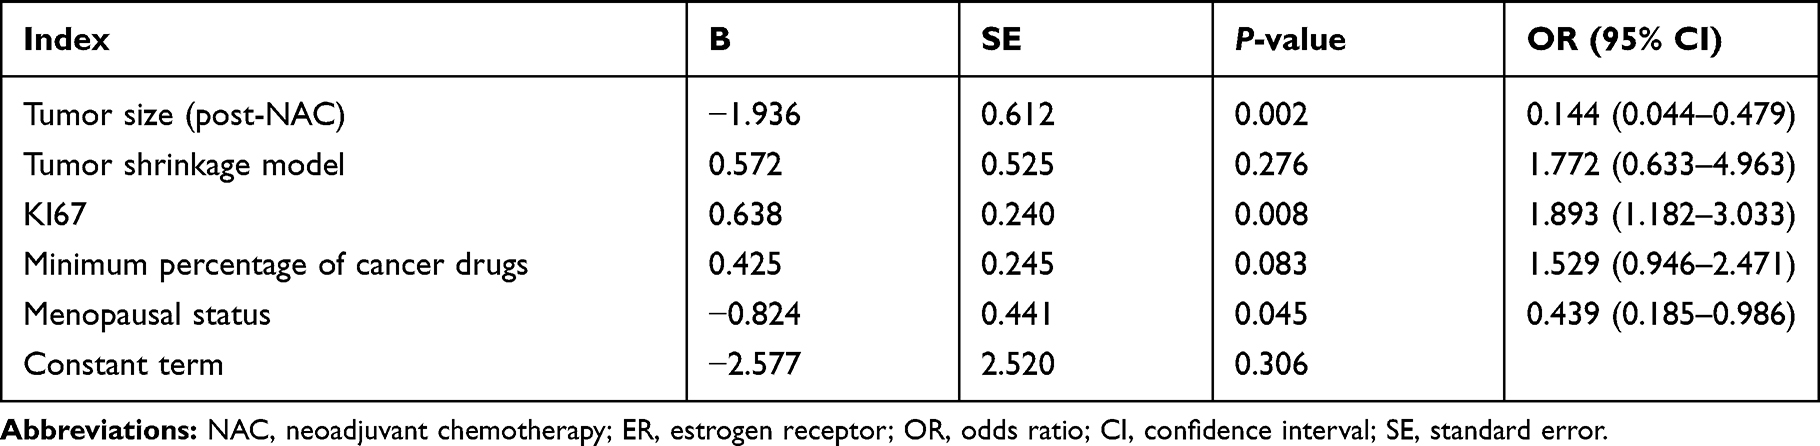 |
Table 4 Multivariate Logistic Regression Model of Pathologic Complete Response in Triple-Negative Subtype |
Construction and Validation of Nomograms
Firstly, our study used R software to construct the nomogram according to the primary cohort regression model (Figure 2A), and the prediction model had an AUC of 0.873 (Figure 3A). The calibration curve of the nomogram revealed that the nomogram predictions are consistent with the actual pCR rate, indicating that the prediction accuracy of the nomogram of the prediction model is high (Figure 4A). Similarly, good discriminative was observed in the internal validation cohort (AUC = 0.813) and an independent validation cohort (AUC = 0.820) (data not shown).
 |
Figure 2 Nomogram to predict the probability of pathologic complete response in the primary cohort, HER2 positive group, and triple-negative group. |
 |
Figure 3 The ROC curve of the primary cohort, HER2 positive group, and triple-negative group. |
 |
Figure 4 Calibration curve of observed and predicted probabilities in the primary cohort, HER2 positive, and triple-negative groups. |
Secondly, a HER2-positive model selection was conducted with ER, KI67, tumor size (pre-NAC), number of NAC cycles, and target therapy situations (Figure 2B). Several variables had no significance in the multivariate analysis; however, they were contained in the nomogram according to the clinical application. The area under the ROC, receiver operating characteristic, was 0.820 (Figure 3B). The calibration curve depicts predicted and observed probabilities of pCR in Figure 4B.
Finally, the creation and development of a TNBC nomogram is completed based on pathological risk factors and clinical factors, including tumor size, KI67, menopausal status, tumor shrinkage model, and minimum percentage of cancer drugs to predict the pCR rate of NAC (Figure 2C). On the other hand, there are still several variables that are not statistically significant in the multivariate analysis but have clinical significance. Figure 3C shows the ROC curve of the nomogram with an AUC of 0.785. Furthermore, the calibration curve indicates excellent calibration capability (Figure 4C).
In the nomogram, each variable is assigned a point ranging from 0 to 100. The predicted probability of pCR is accessible in two steps: (I) draw a vertical line for each variable (KI67, ER, pre-NAC tumor size, HER2, NAC cycles) to the axis termed ‘Points’ at the top of the figure. The points assigned for the value of each variable can be read where the vertical line crosses the “Points” axis. (II) Add the five-point scores determined at step 1 and find the sum score on the axis termed “Total Points.” Determine the predicted value of pCR by drawing a vertical line from the sum score on the “Total Points” axis down to the axis termed “Predicted Value.” The estimated probability of achieving pCR is readable where the vertical line crosses with the “Predicted Value” axis.
Prediction of Tumor Shrinkage Size in the Luminal Subgroup
Multivariate linear regression was adopted to screen factors of risks and treating tumor shrinkage size and the various clinical features as dependent variables and independent variables respectively. The stepwise regression results demonstrated that age at diagnosis, number of NAC cycles, and pre-NAC tumor size were independent factors of risks for tumor shrinkage size in the luminal subgroup (Table 5). Meanwhile, this model indicated that age at diagnosis was inversely associated with tumor shrinkage size (P=0.001), while pre-NAC tumor size and the number of NAC cycles were positively related to tumor shrinkage size (P = 0.021 and 0.038 respectively). The prediction model were Y(tumor shrinkage size) = −0.576× (age at diagnosis) +2.158 × (number of NAC cycles) + 0.233 × (pre-NAC tumor size) + 51.662. Besides, we randomly selected 90 samples in the luminal subgroup for internal verification. As is shown in Table 5, all the above variables were statistically significant.
 |
Table 5 Multivariate Linear Regression Model of Tumor Shrinkage Size in Luminal Subtype |
Discussion
A diagnostic nomogram has completed development and validation for individualized preoperative prediction of pCR in breast cancer patients with NAC. The nomogram incorporates five items: ER status, KI67 status, HER2 status, pre-NAC tumor size, and NAC cycle number. In addition, incorporating the clinicopathological signature and clinical risk factors into an easy-to-use nomogram facilitates individualized preoperative prediction of pCR.
In our study, on the basis of univariate and multivariate logistic analyses, ER status and tumor size were screened as the independent prognostic predictors, consistent with previous reports on the prediction model for NCA response.19 Hormone-receptor-positive breast cancers exhibit a better prognosis than HER2-positive breast cancer or TNBC. Conversely, HER2-positive breast cancer and TNBC have a better therapeutic response to chemotherapy. Nevertheless, only a few studies have assessed the oncologic results of NAC in locally advanced hormone receptor-negative breast cancer.20,21 These results indicate that cases with pCR (83.8%) were nearly two times as high as non-pCR cases (40.2%) in the ER-negative group (P < 0.001). Park et al revealed that ER-negative status should be considered a prognostic factor of tailored NAC according to the status of molecular subtypes in breast cancer, which is also consistent with the result.22 Furthermore, patients were again subjected to a fine needle aspiration biopsy and pathological evaluation when the tumor shrank to a certain extent and no longer continued to shrink with NAC. Moreover, surgical treatment can be considered for luminal subtype breast cancer with no tumor cells or tumor cells deficient in proliferation activity.
In a previous study, tumor size and node status were not important and significant factors influencing the NAC regimen.23 Nevertheless, node status and tumor size are important and crucial indicators of pCR and survival outcome in patients with ER-positive breast cancer, HER2-positive breast cancer, and TNBC.24–26 In consequence, we included the tumor size and node status in the analysis. The tumor size between the pCR and non-pCR groups were significantly different. Our results suggest that a higher pCR was easier to obtain in the 2–5 cm group. Besides, when we evaluated pre- and post-NAC tumor size to predict pCR in TNBC patients, logistic regression analysis identified post-NAC tumor size as an optimal predictor. In fact, higher chemosensitivity in TNBC might explain this phenomenon. In consequence, we included the indicator of pre-NAC tumor size in the TNBC nomogram. What is more, we can adopt the TNBC nomogram in post-NAC that gives more opportunity to evaluate the tumor. However, there was no statistical significance in node status between pCR and non-pCR groups in the study (axillary lymph node: P = 0.288; supraclavicular lymph node: P = 0.615; subclavian lymph node: P = 0.561).
In addition, we included NAC cycles and KI67 to improve the predictive accuracy of the nomogram, whereas previous models have ignored the predictive value of them for estimation pCR.19 We also observed that NAC with more than six cycles increases pCR rates by more than 40% (P = 0.005). A previous study has also demonstrated a positive correlation between the number of NAC cycles and pCR rates.27 In addition, some studies indicate that KI67 predicts pCR in breast cancer, while our analysis also supports these findings in these cohorts.12 Moreover, morphological assessment reflects the early response of the tumor to NAC and can guide subsequent NAC to have better patient outcomes.28 Morphological changes in cancer during NAC estimated by ultrasonography or MRI constitute a good predictor of pCR.29 Some studies also illustrate that menopausal status and minimum percentage of cancer drugs have certain relations to the therapeutic effect.30–32 We put these factors together in TNBC nomogram to improve the model’s ability. Note that target therapy, tumor size, etc. did not show sufficient predictive strength based on multivariate association with pCR in the HER2-positive and triple-negative subgroup. Nevertheless, the rejection of essential predictors may be a result of nuances in the dataset or confounding by other predictors; therefore, the non-significant statistical association with pCR does not definitively imply that these factors are unimportant. Furthermore, existing studies have shown that targeted therapy, tumor size, etc. could serve as an essential marker for pCR in patients with NAC.23,33 In consequence, these indicators could be recognized as candidate factors during the process of model development.
Previous studies suggested that the neutrophil to lymphocyte ratio (NLR) as a predictor of pCR and DFS in breast cancer,13,34 while our analysis failed to support this finding in this cohort (Supplement Table 1). The difference in sample size and population may lead to this phenomenon. Moreover, we observed that lower body weight and lower BMI were associated with improved pCR, which shared similarities to the results of a previous survey (Supplement Table 1).35 Since the above factors were not the observation indicators we focus on, these indicators do not include prediction models.
Besides, we observed that the HER2-positive subgroup and the TNBC subgroup had lower AUC values than the primary cohort, even though the predictive value of the HER2-positive nomogram and the TNBC nomogram was improved compared to the primary cohort. After a specific analysis of the four subgroups, the conclusion was that this phenomenon may be caused by the higher Luminal ratio and the sample size limitation of the HER2 and TNBC subgroups. Further analysis of the luminal subgroup indicated that our medical center determines 1% as the cut-off value of ER/PR. Previous studies have demonstrated that the Luminal subtype has a higher proportion in the People’s Republic of China (Luminal A:42.4% ~ 68.3%, Luminal B:25.6% ~ 74.6%).36,37 Meanwhile, the People’s Republic of China has included luminal breast cancer with large tumors size and positive lymph nodes into the indications of NAC. Further analysis of the luminal subgroup showed that 90% of patients in this group had larger primary tumors size (2–5cm: 74.3% (142); >5cm: 15.7% (30)) and 88.5% (169) were lymph node-positive. In consequence, as mentioned above, the reasons may result in higher luminal subgroup proportions in the primary cohort, and the predictive power of the model constructed specifically for HER2 positive and TNBC is not significantly improved compared with the primary cohort.
In short, we used very simple, easily available, inexpensive, and objective factors to construct nomograms. Despite promising findings, this study has several limitations and shortcomings. First, the study design was retrospective, and the sample size was small. As a result, selection bias was unavoidable, and we will perform further multi-institutional studies with larger sample sizes in the future to tackle this problem. Second, we could not assess this nomogram in terms of survival outcomes because of the short duration of follow-up in patients in the primary cohort. This situation is due to NAC regimens changes in recent years, and there are insufficient events to analyze survival outcomes based on predicted probabilities obtained from nomograms. Finally, although we used the bootstrap method to validate this model internally and independently validate it in another queue, we did not have independent cohorts other than the Harbin Medical University Cancer Hospital to verify the nomogram.
Conclusion
We have developed and validated a universally applicable nomogram to predict and assess the probability of achieving pCR in patients with invasive breast cancer after receiving NAC. This user-friendly tool could enable oncologists to predict pCR for individual patients after NAC more accurately and identify high-risk patients in need of a specific therapeutic scheme. Moreover, we further constructed nomograms of critical subtypes (HER2 positive subgroups and TNBC subgroups), as well as prediction formulas for luminal subgroups. Nevertheless, more data and validation studies are necessary in the future to further improve this model and provide more accurate guidance for clinical treatment.
Disclosure
The authors report no conflicts of interest for this work.
References
1. Li Q, Liu J, Jiang Z, Liu Q. CSCO breast cancer guideline: precise, economical and oriental. Sci China Life Sci. Epub 2020 Jun 12.
2. Mistry KA, Thakur MH, Kembhavi SA. The effect of chemotherapy on the mammographic appearance of breast cancer and correlation with histopathology. Br J Radiol. 2016;89(1057):20150479. doi:10.1259/bjr.20150479
3. Tate SC, Andre V, Enas N, Ribba B, Gueorguieva I. Early change in tumour size predicts overall survival in patients with first-line metastatic breast cancer. Eur J Cancer. 2016;66(01):95–103. doi:10.1016/j.ejca.2016.07.009
4. Alba E, Calvo L, Albanell J, et al. Chemotherapy (CT) and hormonotherapy (HT) as neoadjuvant treatment in luminal breast cancer patients: results from the GEICAM/2006-03, a multicenter, randomized, phase-II study. Ann Oncol. 2012;23(12):3069–3074. doi:10.1093/annonc/mds132
5. Mieog JS, van der Hage JA, van de Velde CJ. Preoperative chemotherapy for women with operable breast cancer. Cochrane Database Syst Rev. 2007;2:CD005002.
6. von Minckwitz G, Untch M, Blohmer JU, et al. Definition and impact of pathologic complete response on prognosis after neoadjuvant chemotherapy in various intrinsic breast cancer subtypes. J Clin Oncol. 2012;30(15):1796–1804. doi:10.1200/JCO.2011.38.8595
7. Cortazar P, Zhang L, Untch M, et al. Pathological complete response and long-term clinical benefit in breast cancer: the CTNeoBC pooled analysis. Lancet. 2014;384(9938):164–172. doi:10.1016/S0140-6736(13)62422-8
8. Fukada I, Araki K, Kobayashi K, et al. Pattern of tumor shrinkage during neoadjuvant chemotherapy is associated with prognosis in low-grade luminal early breast cancer. Radiology. 2018;286(1):49–57. doi:10.1148/radiol.2017161548
9. Xie F, Chen R, Zhang L, et al. Efficacy of two-weekly nanoparticle albumin-bound paclitaxel as neoadjuvant chemotherapy for breast cancer. Nanomedicine (Lond). 2019;14(12):1595–1603. doi:10.2217/nnm-2018-0485
10. Swain SM, Baselga J, Kim SB, et al. Pertuzumab, trastuzumab, and docetaxel in HER2-positive metastatic breast cancer. N Engl J Med. 2015;372(8):724–734. doi:10.1056/NEJMoa1413513
11. Hwang HW, Jung H, Hyeon J, et al. A nomogram to predict pathologic complete response (pCR) and the value of tumor-infiltrating lymphocytes (TILs) for prediction of response to neoadjuvant chemotherapy (NAC) in breast cancer patients. Breast Cancer Res Treat. 2019;173(2):255–266. doi:10.1007/s10549-018-4981-x
12. Jain P, Doval DC, Batra U, et al. Ki-67 labeling index as a predictor of response to neoadjuvant chemotherapy in breast cancer. Jpn J Clin Oncol. 2019;49(4):329–338. doi:10.1093/jjco/hyz012
13. Zhang F, Huang M, Zhou H, et al. A nomogram to predict the pathologic complete response of neoadjuvant chemotherapy in triple-negative breast cancer based on simple laboratory indicators. Ann Surg Oncol. 2019;26(12):3912–3919. doi:10.1245/s10434-019-07655-7
14. Zhang F, Zheng W, Ying L, et al. A nomogram to predict brain metastases of resected non-small cell lung cancer patients. Ann Surg Oncol. 2016;23(9):3033–3039. doi:10.1245/s10434-016-5206-3
15. Ogston KN, Miller ID, Payne S, et al. A new histological grading system to assess response of breast cancers to primary chemotherapy: prognostic significance and survival. Breast. 2003;12(5):320–327. doi:10.1016/S0960-9776(03)00106-1
16. Coates AS, Winer EP, Goldhirsch A, et al. Tailoring therapies–improving the management of early breast cancer: St Gallen international expert consensus on the primary therapy of early breast cancer 2015. Ann Oncol. 2015;26(8):1533–1546. doi:10.1093/annonc/mdv221
17. Wolff AC, Hammond ME, Schwartz JN, et al. American society of clinical oncology/college of American pathologists guideline recommendations for human epidermal growth factor receptor 2 testing in breast cancer. Arch Pathol Lab Med. 2007;131(1):18–43.
18. Goldhirsch A, Winer EP, Coates AS, et al. Personalizing the treatment of women with early breast cancer: highlights of the St Gallen international expert consensus on the primary therapy of early breast cancer 2013. Ann Oncol. 2013;24(9):2206–2223. doi:10.1093/annonc/mdt303
19. Rouzier R, Pusztai L, Delaloge S, et al. Nomograms to predict pathologic complete response and metastasis-free survival after preoperative chemotherapy for breast cancer. J Clin Oncol. 2005;23(33):8331–8339. doi:10.1200/JCO.2005.01.2898
20. Uray IP, Brown PH. Chemoprevention of hormone receptor-negative breast cancer: new approaches needed. Recent Results Cancer Res. 2011;188(01):147–162.
21. Silva LC, Arruda LS, David Filho WJ, et al. Hormone receptor-negative as a predictive factor for pathologic complete response to neoadjuvant therapy in breast cancer. Einstein (Sao Paulo). 2019;17. doi:10.31744/einstein_journal/2019AO3434
22. Park YR, Lee J, Jung JH, et al. Absence of estrogen receptor is associated with worse oncologic outcome in patients who were received neoadjuvant chemotherapy for breast cancer. Asian J Surg. 2020;43(3):467–475. doi:10.1016/j.asjsur.2019.05.010
23. Fujii T, Kogawa T, Wu J, et al. Nomogram to predict pathologic complete response in HER2-positive breast cancer treated with neoadjuvant systemic therapy. Br J Cancer. 2017;116(4):509–514. doi:10.1038/bjc.2016.444
24. Sparano JA, Gray RJ, Makower DF, et al. Prospective validation of a 21-gene expression assay in breast cancer. N Engl J Med. 2015;373(21):2005–2014. doi:10.1056/NEJMoa1510764
25. Baron P, Beitsch P, Boselli D, et al. Impact of tumor size on probability of pathologic complete response after neoadjuvant chemotherapy. Ann Surg Oncol. 2016;23(5):1522–1529. doi:10.1245/s10434-015-5030-1
26. Lai J, Wang H, Peng J, Chen P, Pan Z. Establishment and external validation of a prognostic model for predicting disease-free survival and risk stratification in breast cancer patients treated with neoadjuvant chemotherapy. Cancer Manag Res. 2018;10:2347–2356. doi:10.2147/CMAR.S171129
27. von Minckwitz G, Untch M, Nüesch E, et al. Impact of treatment characteristics on response of different breast cancer phenotypes: pooled analysis of the German neo-adjuvant chemotherapy trials. Breast Cancer Res Treat. 2011;125(1):145–156. doi:10.1007/s10549-010-1228-x
28. von Minckwitz G, Blohmer JU, Costa SD, et al. Response-guided neoadjuvant chemotherapy for breast cancer. J Clin Oncol. 2013;31(29):3623–3630. doi:10.1200/JCO.2012.45.0940
29. Park J, Chae EY, Cha JH, et al. Comparison of mammography, digital breast tomosynthesis, automated breast ultrasound, magnetic resonance imaging in evaluation of residual tumor after neoadjuvant chemotherapy. Eur J Radiol. 2018;108(01):261–268. doi:10.1016/j.ejrad.2018.09.032
30. Sun B, Song ST, Jiang ZF, et al. Analysis of the factors affecting pathologic complete response to neoadjuvant chemotherapy in breast cancer patients. Zhonghua Zhong Liu Za Zhi. 2013;35(1):38–42.
31. Bonsang-Kitzis H, Chaltier L, Belin L, et al. Beyond axillary lymph node metastasis, BMI and menopausal status are prognostic determinants for triple-negative breast cancer treated by neoadjuvant chemotherapy. PLoS One. 2015;10(12):e0144359. doi:10.1371/journal.pone.0144359
32. Eom HJ, Cha JH, Choi WJ, Chae EY, Shin HJ, Kim HH. Predictive clinicopathologic and dynamic contrast-enhanced MRI findings for tumor response to neoadjuvant chemotherapy in triple-negative breast cancer. AJR Am J Roentgenol. 2017;208(6):W225–W230. doi:10.2214/AJR.16.17125
33. Pathak M, Dwivedi SN, Deo S, Thakur B, Sreenivas V, Rath GK. Effectiveness of added targeted therapies to neoadjuvant chemotherapy for breast cancer: a systematic review and meta-analysis. Clin Breast Cancer. 2019;19(6):e690–e700. doi:10.1016/j.clbc.2019.06.001
34. Shi H, Wang XH, Gu JW, Guo GL. Development and validation of nomograms for predicting the prognosis of triple-negative breast cancer patients based on 379 Chinese patients. Cancer Manag Res. 2019;11:10827–10839. doi:10.2147/CMAR.S234926
35. Usiskin I, Li F, Irwin ML, Cartmel B, Sanft T. Association between pre-diagnosis BMI, physical activity, pathologic complete response, and chemotherapy completion in women treated with neoadjuvant chemotherapy for breast cancer. Breast Cancer. 2019;26(6):719–728. doi:10.1007/s12282-019-00974-3
36. Xue C, Wang X, Peng R, et al. Distribution, clinicopathologic features and survival of breast cancer subtypes in Southern China. Cancer Sci. 2012;103(9):1679–1687. doi:10.1111/j.1349-7006.2012.02339.x
37. Li S, Wang X, Yang J, et al. Clinicopathological features and survival of early stage breast cancer in northwest China: a population-based retrospective study of 1287 patients. Thorac Cancer. 2018;9(1):10–18. doi:10.1111/1759-7714.12503
 © 2020 The Author(s). This work is published and licensed by Dove Medical Press Limited. The
full terms of this license are available at https://www.dovepress.com/terms
and incorporate the Creative Commons Attribution
- Non Commercial (unported, 3.0) License.
By accessing the work you hereby accept the Terms. Non-commercial uses of the work are permitted
without any further permission from Dove Medical Press Limited, provided the work is properly
attributed. For permission for commercial use of this work, please see paragraphs 4.2 and 5 of our Terms.
© 2020 The Author(s). This work is published and licensed by Dove Medical Press Limited. The
full terms of this license are available at https://www.dovepress.com/terms
and incorporate the Creative Commons Attribution
- Non Commercial (unported, 3.0) License.
By accessing the work you hereby accept the Terms. Non-commercial uses of the work are permitted
without any further permission from Dove Medical Press Limited, provided the work is properly
attributed. For permission for commercial use of this work, please see paragraphs 4.2 and 5 of our Terms.