Back to Journals » Journal of Inflammation Research » Volume 15
Construction of Autophagy-Related Gene Classifier for Early Diagnosis, Prognosis and Predicting Immune Microenvironment Features in Sepsis by Machine Learning Algorithms
Authors Chen Z ![]() , Zeng L, Liu G
, Zeng L, Liu G ![]() , Ou Y, Lu C, Yang B, Zuo L
, Ou Y, Lu C, Yang B, Zuo L
Received 18 August 2022
Accepted for publication 1 November 2022
Published 8 November 2022 Volume 2022:15 Pages 6165—6186
DOI https://doi.org/10.2147/JIR.S386714
Checked for plagiarism Yes
Review by Single anonymous peer review
Peer reviewer comments 2
Editor who approved publication: Professor Ning Quan
Zhen Chen1 *, Liming Zeng2 *, Genglong Liu,3,4 Yangpeng Ou,5 Chuangang Lu,6 Ben Yang,7 Liuer Zuo1 *
1Department of Intensive Care Unit, Shunde Hospital, Southern Medical University (The First People’s Hospital of Shunde), Foshan, Guangdong Province, 528308, People’s Republic of China; 2Medical Research Center, Shunde Hospital, Southern Medical University (The First People’s Hospital of Shunde), Foshan, Guangdong Province, 528308, People’s Republic of China; 3Department of Pathology, Guangzhou Medical University, Guangzhou, Guangdong Province, 511495, People’s Republic of China; 4Baishideng Publishing Group Inc, Pleasanton, CA, 94566, USA; 5Department of Oncology, Huizhou Third People’s Hospital, Guangzhou Medical University, Huizhou, Guangdong Province, 516000, People’s Republic of China; 6Department of Thoracic Surgery, Sanya Central Hospital, Sanya, Hainan Province, 572000, People’s Republic of China; 7Department of Burn Surgery, Huizhou Municipal Central Hospital, Huizhou, Guangdong Province, 516000, People’s Republic of China
*These authors contributed equally to this work
Correspondence: Zhen Chen; Liuer Zuo, Department of Intensive care Unit, Shunde Hospital, Southern Medical University (The First People’s Hospital of Shunde), Foshan, Guangdong Province, 528308, People’s Republic of China, Email [email protected]; [email protected]
Background: The immune system plays a fundamental role in the pathophysiology of sepsis, and autophagy and autophagy-related molecules are crucial in innate and adaptive immune responses; however, the potential roles of autophagy-related genes (ARGs) in sepsis are not comprehensively understood.
Methods: A systematic search was conducted in ArrayExpress and Gene Expression Omnibus (GEO) cohorts from July 2005 to May 2022. Machine learning approaches, including modified Lasso penalized regression, support vector machine, and artificial neural network, were applied to identify hub ARGs, thereby developing a prediction model termed ARG classifier. Diagnostic and prognostic performance of the model was comprehensively analyzed using multi-transcriptome data. Subsequently, we systematically correlated the ARG classifier/hub ARGs with immunological characteristics of multiple aspects, including immune cell infiltration, immune and molecular pathways, cytokine levels, and immune-related genes. Further, we collected clinical specimens to preliminarily investigate ARG expression levels and to assess the diagnostic performance of ARG classifier.
Results: A total of ten GEO and three ArrayExpress datasets were included in this study. Based on machine learning algorithms, eight key ARGs (ATG4C, BAX, BIRC5, ERBB2, FKBP1B, HIF1A, NCKAP1, and NFKB1) were integrated to establish ARG classifier. The model exhibited excellent diagnostic values (AUC > 0.85) in multiple datasets and multiple points in time and superiorly distinguished sepsis from other critical illnesses. ARG classifier showed significant correlations with clinical characteristics or endotypes and performed better in predicting mortality (AUC = 0.70) than other clinical characteristics. Additionally, the identified hub ARGs were significantly associated with immune cell infiltration (B, T, NK, dendritic, T regulatory, and myeloid-derived suppressor cells), immune and molecular pathways (inflammation-promoting pathways, HLA, cytolytic activity, apoptosis, type-II IFN response, complement and coagulation cascades), levels of several cytokines (PDGFRB, IL-10, IFNG, and TNF), which indicated that ARG classifier/hub ARGs adequately reflected the immune microenvironment during sepsis. Finally, using clinical specimens, the expression levels of key ARGs in patients with sepsis were found to differ significantly from those of control patients, and ARG classifier exhibited superior diagnostic performance, compared to procalcitonin and C-reactive protein.
Conclusion: Collectively, a diagnostic and prognostic model (ARG classifier) based on eight ARGs was developed which may assist clinicians in diagnosis of sepsis and recognizing patient at high risk to guide personalized treatment. Additionally, the ARG classifier effectively reflected the immune microenvironment diversity of sepsis and may facilitate personalized counseling for specific therapy.
Keywords: sepsis, autophagy-related genes, machine learning, model, multi-transcriptome, immune microenvironment
Introduction
Sepsis, a life-threatening end-organ dysfunction characterized by a dysregulated host-response to infection, is a leading cause of death of patients in intensive care units.1 The prognosis of patients with sepsis has improved to some extent in the past decade; however, according to the recommendations of the Surviving Sepsis Campaign, the current mortality rate (25–50%) remains very high.2 Rapid diagnosis and timely intervention are critical to reducing the mortality of sepsis, which increases with each hour of treatment delay.3 Additionally, the classification and identification of high-risk sepsis patients may aid physicians to screen individuals who could benefit from additional monitoring and treatment or to detect immune states which are most likely to benefit from targeted immunomodulatory agents, and thus ultimately improve outcomes.4 Thus, enabling clinicians to diagnose sepsis victims, forecast their survival, and classify sepsis in a timely manner is important for achieving a favorable outcome.
As sepsis is a highly complex disease and its clinical assessment is frequently challenging, additional use of biomarkers for rapid diagnosis and identification of high-risk patients is a promising strategy. So far, no circulating blood biomarkers, clinical scoring systems, or immune response signatures can detect sepsis or recognize high-risk patients with acceptable certainty, which was attributed to the intricate pathophysiology and heterogeneity of sepsis.5 Therefore, there is an extremely urgent need to establish new biomarkers or algorithms for early diagnosis, risk stratification, prognostication, and recognition of immune status during sepsis.
Autophagy is a highly evolutionarily conserved process for the recycling and degradation of cytoplasmic constituents, which includes the formation of the autophagosome, lysosomal fusion of autophagosomes, and degradation of products.6 Autophagy is indispensable for maintaining cellular homeostasis and is involved in the pathophysiology of multiple diseases. In the early stage of sepsis, autophagy is activated by various cellular stressors (pathogen infection and organelle damage) and occurs in various organs, as manifested by enhanced accumulation of autophagic vacuoles and increased expression of autophagy-related molecules.7 Innate and adaptive immune mechanisms are central to the pathophysiology of sepsis. The immune process involves interactions of various immune cells, and any dysfunction may result in the inhibition of immune functioning. Neutrophil autophagy induction primes neutrophil extracellular trap (NET) formation and vice versa.8 Augmentation of autophagy improved survival through a NET-dependent mechanism in a mouse model of sepsis, and mice with lymphocyte-specific ATG5 deletion or ATG5 knockout show increased production of interleukin-10 and apoptosis of CD4+ T cells and down-regulated antigen presentation molecules in immune cells, leading to the occurrence of immunosuppression, or even death.9,10 Thus, autophagy and autophagy-related molecules play an important role in innate and adaptive immune responses during sepsis. Autophagy is a complex process involving multiple signaling pathways, and the various signaling pathways exert various functions during diseases. Currently, the role of most autophagy-related molecules during sepsis remains largely elusive. Therefore, in-depth understanding of the potential roles of autophagy-related molecules during sepsis is crucial for earlier diagnosis, evaluation of the prognosis, and for guiding immunostimulatory therapy.
The availability of a large number of transcriptomic profiling databases provides an unprecedented opportunity for comprehensive characterization of autophagy-related genes (ARGs). We hypothesized that the identification of key ARGs may help identify sepsis before the onset of clinical signs, estimate the prognosis and reflect immune microenvironment of septic patients. To test this, we used machine learning approaches to identify hub ARGs and constructed an algorithm termed ARG classifier. We then comprehensively evaluated the diagnostic and prognostic performance of ARG classifier, and we systematically investigated the relationship between ARG classifier/hub ARGs and the immune microenvironment. Finally, we preliminarily validated the key ARGs expression level and diagnostic value of ARG classifier from clinical specimens.
Materials and Methods
Sample Selection and Dataset Collection and Processing
We conducted a search using the Gene Expression Omnibus (GEO) (http://www.ncbi.nlm.nih.gov/geo) and ArrayExpress (http://www.ncbi.nlm.nih.gov/geo) databases with a range from July 2005 to May 2022 to identify relevant transcriptomic profiling datasets. Datasets that met the following criteria were included: 1) organism: Homo sapiens; 2) expression profiling by array or high throughput sequencing; 3) adult patients (≥18 years old); 4) sample size ≥50. In total, ten GEO and three ArrayExpress cohorts were included for qualitative and quantitative analyses. Dataset details are shown in Table 1. Additionally, 222 ARGs were retrieved from the Human Autophagy Database (http://autophagy.lu/)).11 All data were preprocessed, including background correction, quantile normalization, and summarization, through robust multi-array average analysis.12
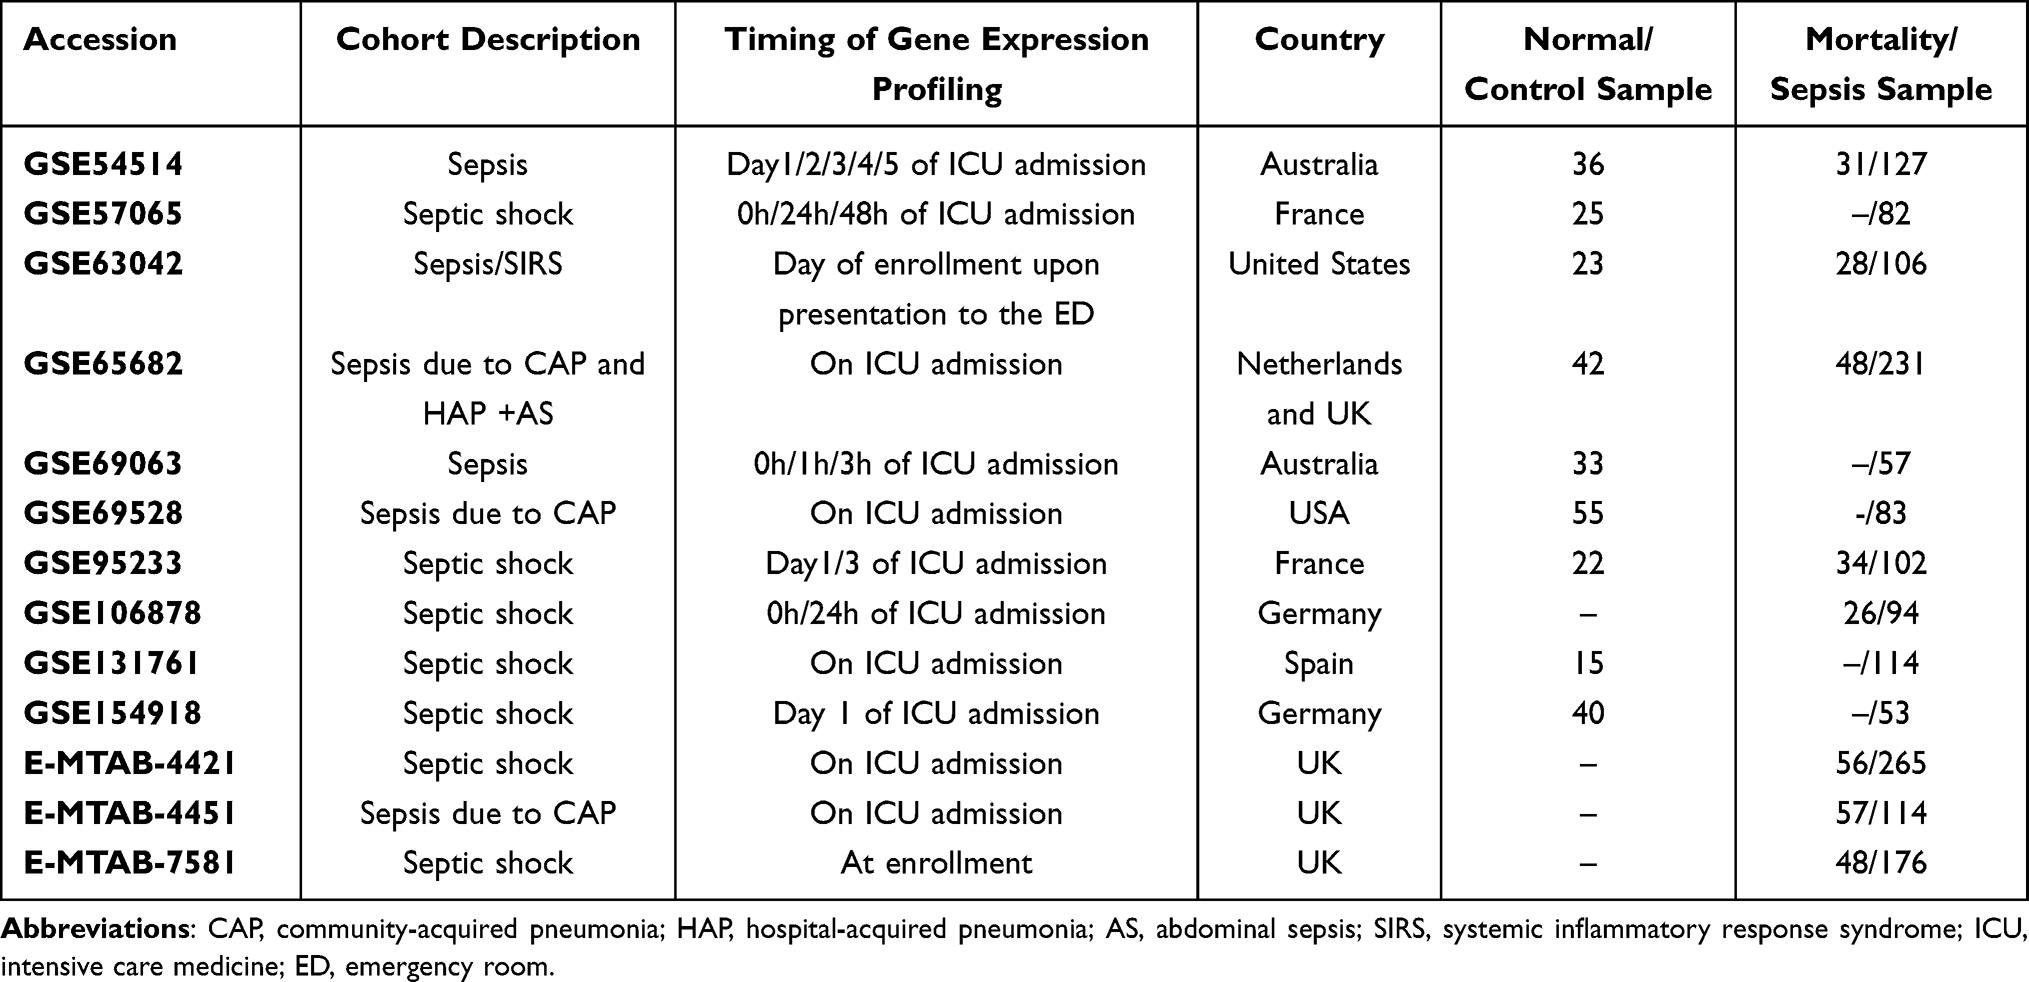 |
Table 1 Dataset Included in the Study |
Clinical Specimens
Forty adult patients in our hospital, including 20 septic patients who were diagnosed with sepsis according to the Third International Consensus Definitions for Sepsis and Septic Shock (Sepsis-3)1 and 20 non-septic patients (13 postoperative patients and 7 cardiovascular patients), were included. All procedures involving human participants were approved by the institutional review board (Ethics Committee) of the Shunde Hospital, Southern Medical University (SRSP2021010). Peripheral blood samples and corresponding clinical data were collected at admission. Peripheral blood mononuclear cells (PBMCs) were isolated within 4 h after collection.
Identification of Differentially Expressed ARGs and Functional Enrichment Analysis
Differential analysis of five transcriptome datasets (GSE57065, GSE65682, GSE69528, GSE69063, and GSE95233) was conducted using the NetworkAnalyst online-Gene Expression Table (https://www.networkanalyst.ca/). Adjusted p-values <0.05, and |log2 FC (fold-change)| >1 were used as thresholds for screening differentially expressed genes (DEGs). The case groups comprised septic patients, according to Sepsis-2 or Sepsis-3,1 and control groups included healthy population or non-sepsis patients, as defined by the different databases. The overlapping differentially expressed ARGs (DEARGs) were visualized using R software with the package UpSetR. Subsequently, principal component analysis (PCA) based on DEARG expression levels was performed on multi-transcriptome data, and we extracted principal components 1 and 2 which acted as X-axis and Y-axis, respectively. Finally, DEARGs were subject to gene ontology (GO) enrichment analysis, including molecular functions, cellular components, and biological processes, and Kyoto Encyclopedia of Genes and Genomes (KEGG) pathway analysis.
Identification of Hub ARGs and Construction of the ARG Classifier Algorithm
To select reliable hub ARGs, machine learning approaches with 10-fold cross-validation, including modified least absolute shrinkage and selection operator (Lasso) penalized regression and support vector machine (SVM), were applied to select feature variables from DEARGs. The hub ARGs were retained from the intersection of the result of Lasso and SVM.
We then built and trained artificial neural network (ANN; input layer, hidden layer, and output layer) models. In each hidden node, we used ReLU (rectified linear unit) as an activation function. In the output layer, we created two nodes (O1 and O2, for survivor and death, respectively). We applied a softmax function to each node and designated y2 (probability of death/sepsis; that is, the O2 node) as Y. We applied cross-entropy error as a loss function (E) and optimized the value of each weight with the Adam method (learning rate 0.001; 1000 epochs).13 After training, we utilized the weights of the nodes (“NeuralNetworkWeight”) to calculate the ARG score according to the following equation:  . Based on the median value of the ARG score, patients were categorized into low ARG and high ARG subgroups.
Diagnostic, Risk Stratification, and Prognostic Performance of ARG Classifier
The diagnostic performance of the ARG classifier was evaluated in multiple datasets and at multiple points in time. Additionally, PCA was used to assess the discrimination ability (sepsis vs other critical illnesses (such as head trauma, SIRS, uninfected control in ICU)).
We explored the correlation of ARG classifier with clinical characteristics (such as age, APACHEII) or phenotypes and compared the ARG score in different sepsis subgroups.
Univariate and multivariate logistic regression analyses were performed to determine whether the predictive power of ARG classifier remained independent of other clinical characteristics.
Clinical Applicability of ARG Classifier
Multiple receiver operating characteristic (ROC) analysis was carried out to compare the prognostic performance of ARG classifier against age, sepsis response signature (SRS), Molecular Diagnosis and Risk Stratification of Sepsis (MARS), and APACHE II. A decision curve analysis (DCA) was applied to evaluate the clinical applicability of ARG classifier.
Immune Cell Infiltration
To improve statistical power in immune microenvironment analysis, we integrated GEO and ArrayExpress datasets for subsequent analysis. Batch effects were adjusted for different datasets using the ComBat function of the “sva” R package.
The relative abundance of infiltrating immune cells was inferred using the CIBERSORTx tool and the ssGSEA algorithm. We investigated the differential composition of immune cells between different ARG subgroups. Spearman correlation analyses were performed to analyze the relationships of ARG classifier/hub ARGs with immune cells.
Immune and Molecular Pathways
Gene set variation analysis (GSVA) of a given dataset was applied to evaluate the enrichment degree of pre-specified biological processes (immune/inflammation-related pathways, apoptosis; Supplementary Table 1). We explored differences in biological processes among different ARG patterns, and we conducted a correlation analysis to further elucidate the association between ARG classifier/hub ARGs and several selected related biological pathways.
Cytokines
A panel of 18 inflammatory cytokines was compiled according to a previous review.14 We compared cytokine expression levels among different ARG subtypes. Additionally, we examined the correlation between ARG classifier/hub ARGs and pivotal cytokines using Spearman correlation analyses.
Correlation Between Hub ARGs, Immune-Related Genes and HLA-Related Genes
To initially illustrate the biological function of hub ARGs in the occurrence and development of sepsis, we tested correlations between hub ARGs, previously published eight immune-related genes15 and 5 HLA-related genes.14 Additionally, we used Cytoscape software to visualize network regulation relations among these genes.
RNA Isolation and Reverse-Transcription Quantitative Polymerase Chain Reaction (RT-qPCR)
Expression of hub ARGs in PBMCs was measured using RT-qPCR. Total RNA was isolated from PBMCs with Trizol reagent (Invitrogen, Carlsbad, CA, USA) and was reverse-transcribed to cDNA using Maxima First Strand cDNA Synthesis Kit (Thermo Fisher Scientific, Waltham, MA, USA). RT-qPCR was conducted using the CFX96TM Real-Time system (Bio-Rad, Hercules, CA, USA). The results were standardized with GAPDH. PCR primers are shown in Supplementary Table 2.
Statistical Analyses
R software (version 4.0.4) and SPSS 22 were used to perform statistical analyses. Student’s t-tests, Wilcoxon tests, Chi-squared tests, and one-way ANOVA were used to test differences. Diagnostic and prognostic ability was evaluated using an ROC curve to assess the area under the curve (AUC). Statistical significance is reported at p < 0.05 (two-sided).
Results
Identification of DEARGs and Functional Enrichment Analysis
A flow diagram of the research design is shown in Figure 1. Using the NetworkAnalyst online-Gene Expression Table, we identified 845 DEGs in GSE57065 datasets, 1194 DEGs in GSE65682 datasets, 1233 DEGs in GSE69528 datasets, 1044 DEGs in GSE69528 datasets, and 949 DEGs in GSE95233. After identifying the overlap of the results of the above datasets and ARG cohorts, we obtained 41 DEARGs shared by ≥5 results (Figure 2A). PCA showed that the expression of these DEARGs completely distinguished sepsis samples from healthy control, uninfected control, and control patient samples (Figure 2B–L). Additionally, the GO term enrichment analysis of DEARGs produced the top 15 significant clusters of enriched sets (Figure 2J), including macroautophagy, autophagy of mitochondria, autophagosome, and autophagosome membrane. Regarding the KEGG enrichment analysis of DEARGs, they were mainly involved in autophagy – animal, autophagy – other, mitophagy – animal, HIF-1 signaling pathways (Figure 2K). The above analyses indicated a crucial role regarding the imbalance of ARGs expression (autophagy) in the development of sepsis.
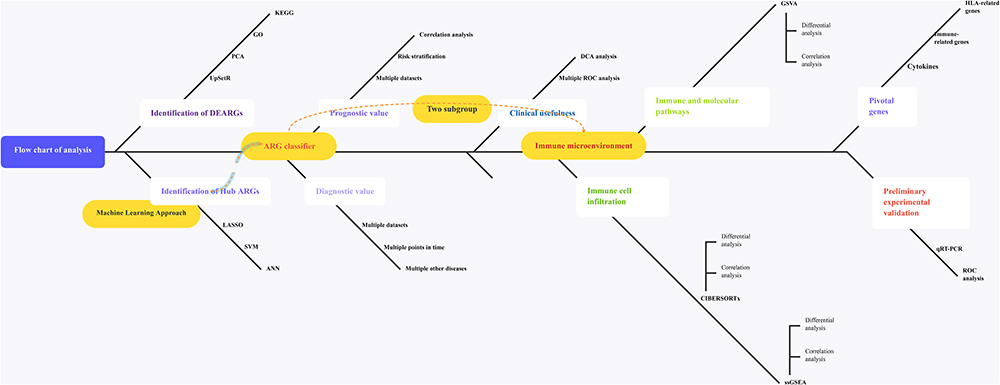 |
Figure 1 The illustrations for this study. The overall protocol utilized in the current study to comprehensively characterize of costimulatory molecule gene for diagnosis, prognosis and recognition of immune microenvironment features in sepsis. Abbreviations: ARGs, autophagy-related genes; DEARGs, differentially expressed autophagy-related genes. |
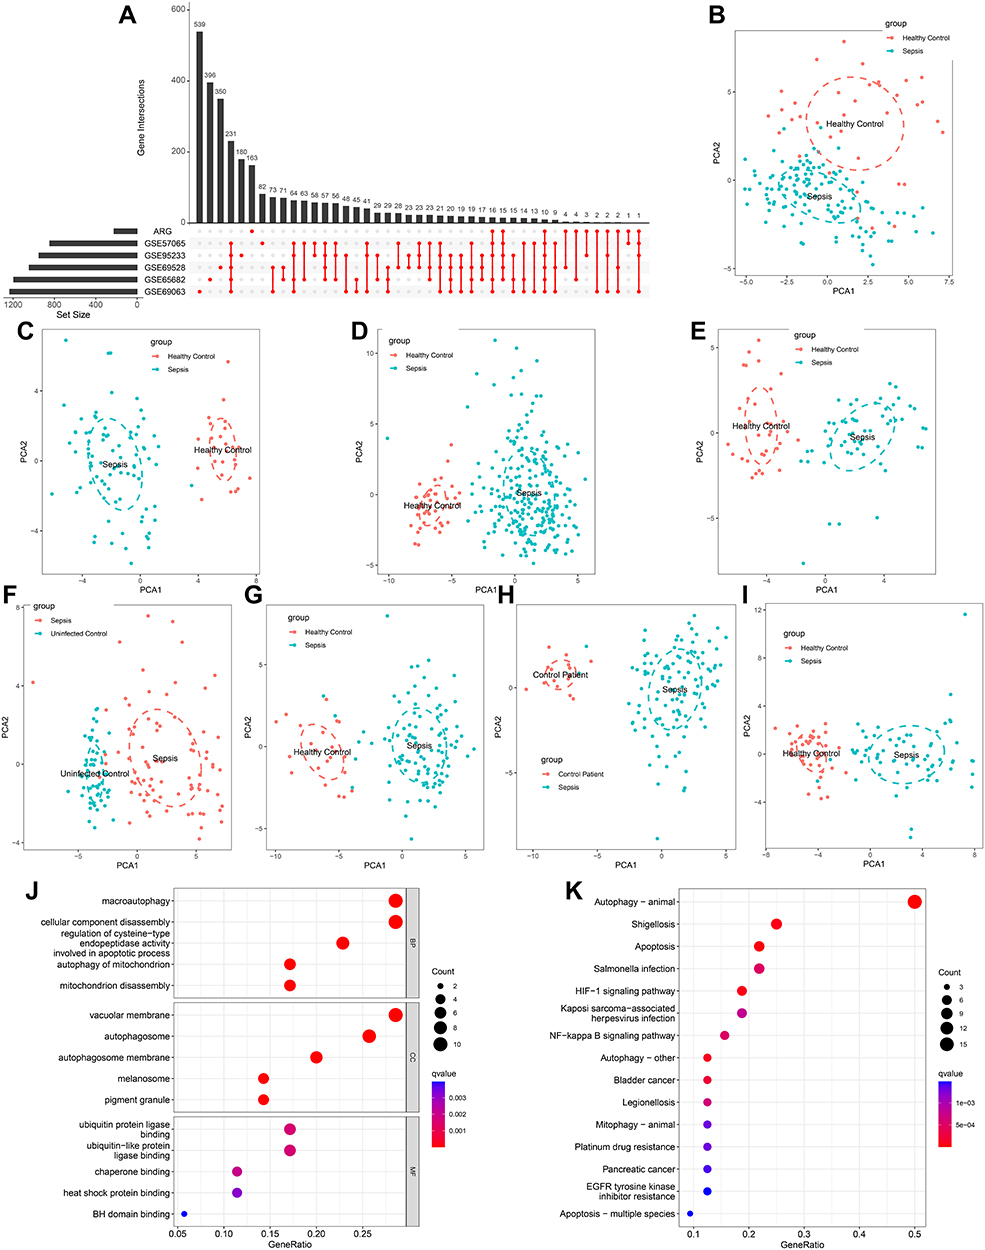 |
Figure 2 Identification of differentially expressed ARGs in sepsis and Functional enrichment analysis. (A) An UpSet diagram exhibited the interactions result of GEO datasets difference analysis and ARG cohorts. (B–I) Principal component analysis for the expression profiles of DEARGs to distinguish sepsis patients from healthy control/uninfected control/control patients in multi-transcriptome cohorts. (B) GSE54514 datasets; (C) GSE57065 datasets; (D) GSE65682 datasets; (E) GSE69063 datasets; (F) GSE69528 datasets; (G) GSE95233 datasets; (H) GSE131761 datasets; (I) GSE154918 datasets. (J and K) Bubble plots illustrating functional enrichment analysis using DEARGs. (J) The top 15 significant terms of Gene Ontology (GO), including the molecular function (MF), cellular component (CC), and biological process (BP). (K) The top 15 significant pathways in Kyoto Encyclopedia of Genes and Genomes (KEGG) enriched. |
Identification of Hub ARGs and Construction of ARG Classifier
To identify prognosis-related genes (sepsis-specific genes), we used the expression data of 41 DEARGs as input for a machine learning model. Modified Lasso penalized regression was used to shrink and select out candidate ARGs in multi-transcriptome cohorts, as shown in Figure 3A (GSE54514 dataset), Figure 3B (GSE63042 dataset), Figure 3C (GSE65682 dataset), and Figure 3D (GSE95233 dataset). SVM was also established to identify candidate ARGs based on minimum root mean square error (Figure 3E–H).
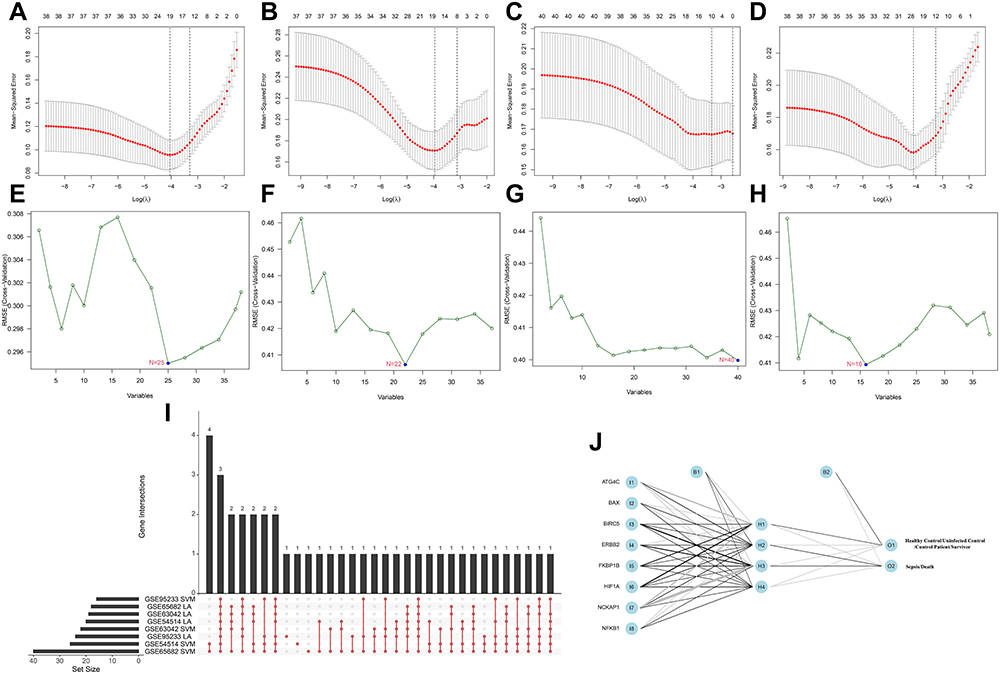 |
Figure 3 Identification of prognosis-related ARGs (sepsis-specific ARGs) and construction of a ARG classifier based on machine learning algorithms (including Lasso, SVM, ANN). (A–D) Modified Lasso was used to identify candidate ARGs with 10-fold cross-validation in multi-transcriptome datasets. The Y-axis shows mean-square error and the X-axis is Log (λ). Dotted vertical lines represent minimum and 1 standard error values of λ. The genes selected at minimum standard error values of λ were finally used for further analysis. (A) GSE54514 datasets (N=20); (B) GSE63042 datasets (N=18); (C) GSE65682 datasets (N=12); (D) GSE95233 datasets (N=24). (E–H) Modified Lasso was used to identify candidate ARGs with 10-fold cross-validation in multi-transcriptome datasets. SVM algorithm was applied to screen candidate ARGs. The red dots indicated the lowest error rate and the highest precision when genes are this number. (E) GSE54514 datasets (N=25); (F) GSE63042 datasets (N=22); (G) GSE65682 datasets (N=40); (H) GSE95233 datasets (N=16). (I) An UpSet diagram exhibited the interactions result of Lasso and SVM in multi-transcriptome datasets. (J) The visualization of artificial neural network (ANN). The neural network contains 8 input layers, 4 hidden layers, and 2 output layers. Abbreviatons: I, input layers; H, hidden layers; O, output layers. |
After combining the ARGs selected by Lasso and SVM, we obtained eight hub ARGs (ATG4C, BAX, BIRC5, ERBB2, FKBP1B, HIF1A, NCKAP1, and NFKB1) shared by ≥7 results (Figure 3I). Based on the eight key ARGs, we constructed a prognostic and diagnostic model, termed ARG classifier.
ANN analysis was performed to optimize the weight of each gene based on the expression transformation of eight hub ARGs (sepsis-specific genes). The ANN model contained eight input layers, four hidden layers, and two output layers (Figure 3J). The sepsis-specific scoring model (ARG score) was calculated by the summation of “GeneExpression” × “NeuralNetworkWeight” for all eight hub ARGs, with the potential value ranging from 0 to 1. Detailed information on ARG scores is shown in Supplementary Table 3.
Diagnostic, Risk Stratification, and Prognostic Performance of ARG Classifier
ARG classifier exhibits excellent diagnostic performance (AUC > 0.85) in multiple datasets and at multiple points in time (Figure 4A–H) and accurately distinguishes sepsis samples from healthy controls, uninfected control, and control patient samples, based on PCA (Supplementary Figure 1). Additionally, the ARG score of sepsis was significantly higher than that of system inflammatory reaction syndrome (SIRS; Figure 4I), uninfected control (Figure 4J), anaphylaxis (Figure 4K), and head trauma (Figure 4L). PCA revealed that the ARG classifier effectively distinguished sepsis from SIRS (Figure 4M), uninfected control (Figure 4N), anaphylaxis (Figure 4O), and head trauma (Figure 4P).
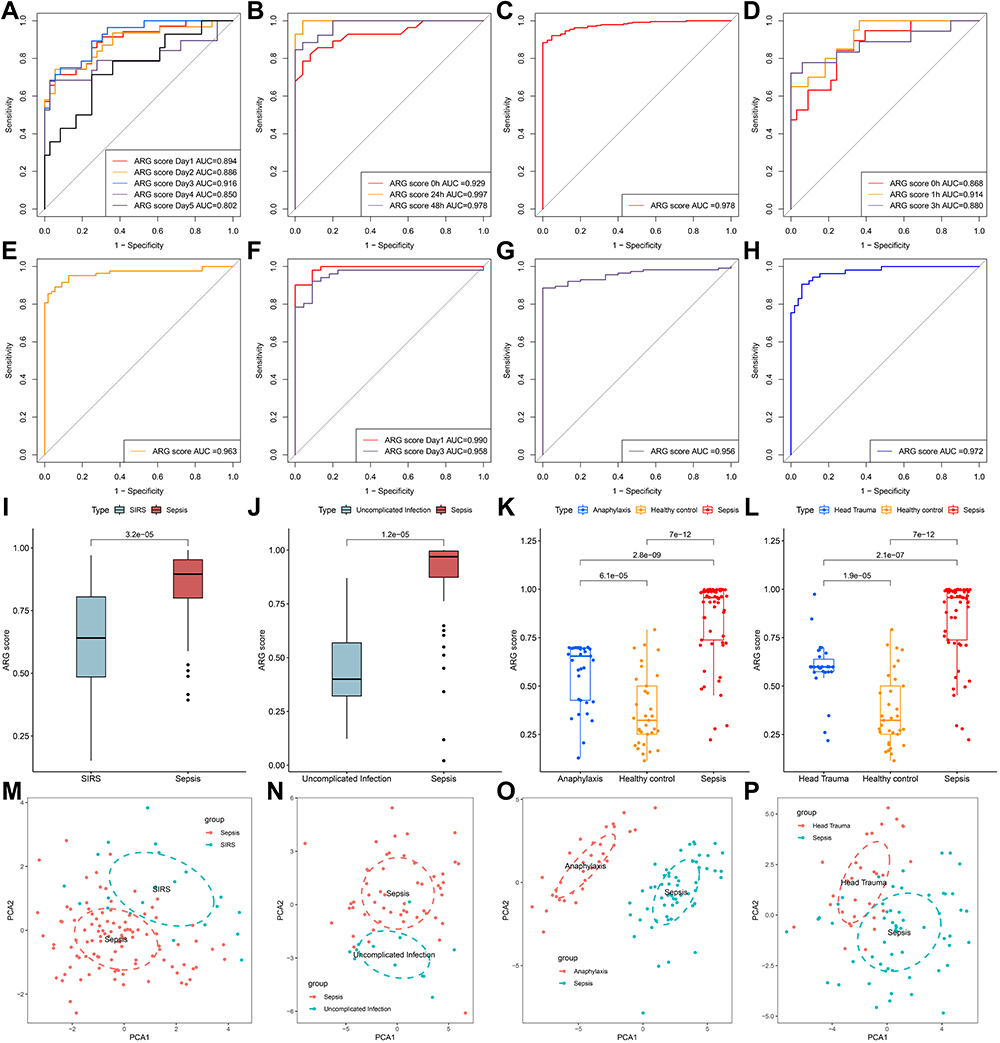 |
Figure 4 The diagnostic efficacy of ARG classifier in multi-transcriptome datasets. (A–H) ROC curves analyzed the diagnostic accuracy of ARG classifier in multiple datasets and time points. (A) GSE54514 datasets; (B) GSE57065 datasets; (C) GSE65682 datasets; (D) GSE69063 datasets; (E) GSE69528 datasets; (F) GSE95233 datasets; (G) GSE131761 datasets; (H) GSE154918 datasets. (I and J) Comparison of the ARG scores between sepsis and SIRS in GSE63042 datasets (I), uncomplicated Infection in GSE154918 datasets (J). p value was calculated using the Wilcoxon test. (K) Comparison of the ARG scores between sepsis, healthy control and anaphylaxis in GSE69063 datasets. p value was calculated using the Kruskal–Wallis test. (L) Comparison of the ARG scores between sepsis, healthy control and head trauma in GSE69063 datasets. p value was calculated using the Kruskal–Wallis test. (M–P) Principal component analysis based on hub ARGs to distinguish sepsis from SIRS (M), uninfected control (N), anaphylaxis (O), and head trauma (P). Abbreviation: SIRS, systemic inflammatory response syndrome. |
ARG classifier showed a favorable prognostic ability in multiple cohorts, with AUC values ranging from 0.750 to 0.919 (Figure 5A). Univariate and multivariate logistic regression analyses confirmed that ARG classifier was an independent predictor of adverse survival outcomes in multiple transcriptome datasets (Table 2), regardless of other clinical characteristics.
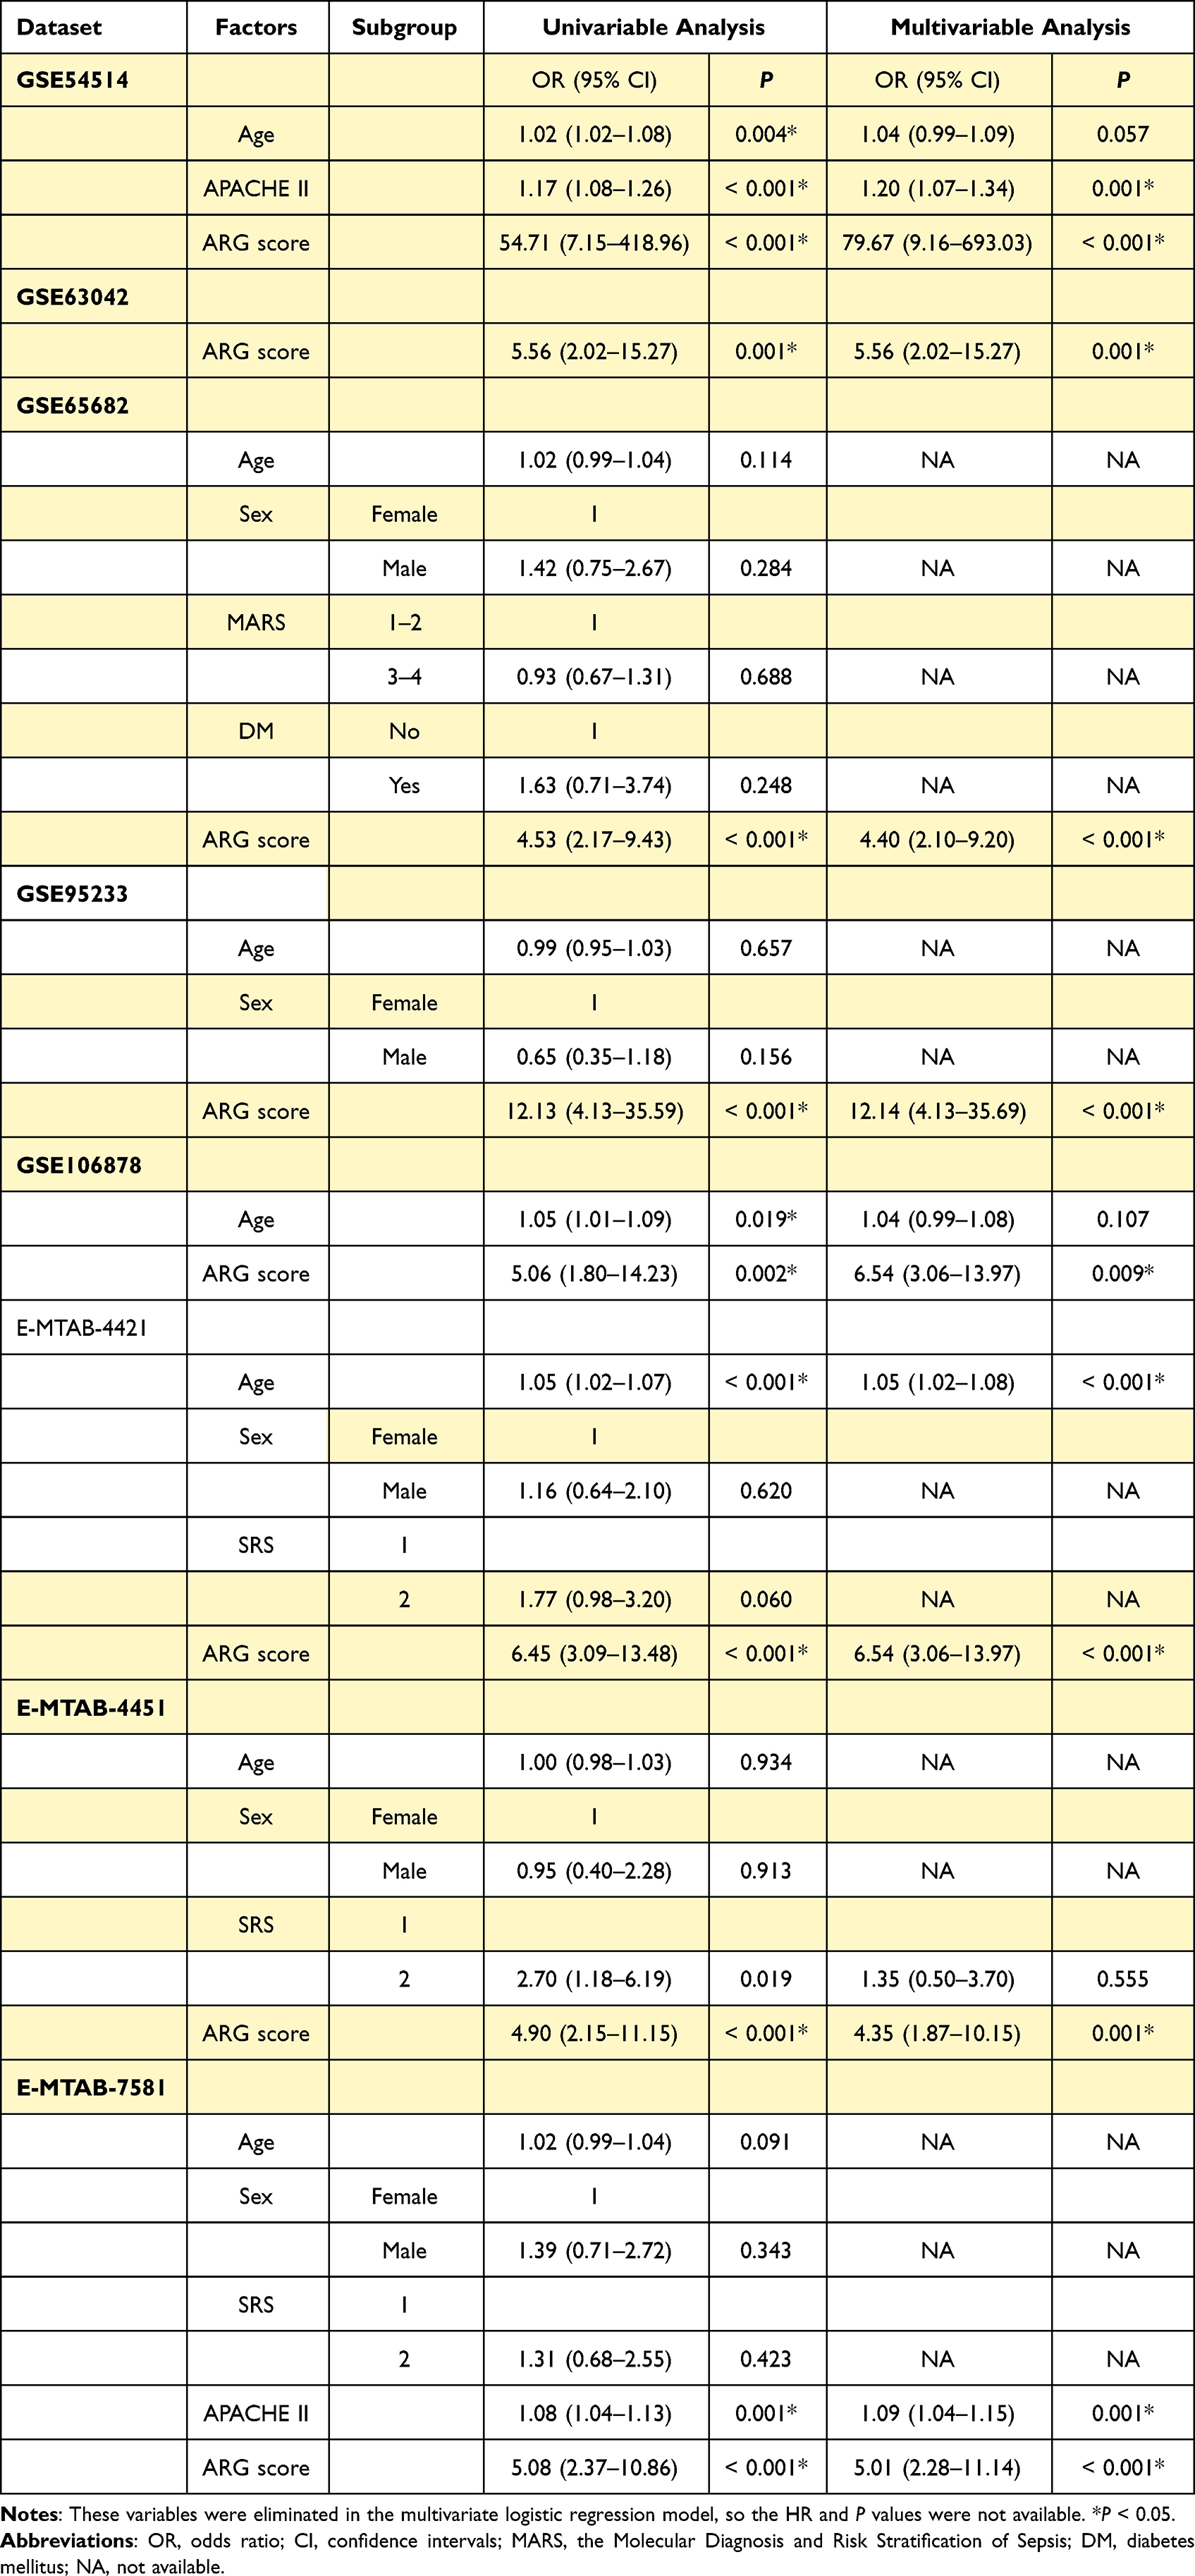 |
Table 2 Univariable and Multivariable Logistic Regression Analysis for Prediction of Survival in GEO and ArrayExpress Databases |
 |
Figure 5 The prognostic efficacy of ARG classifier in multi-transcriptome datasets. (A) An Lollipop chart showed the AUC values of prognostic prediction in multiple datasets. (B and K) Correlation between ARG score and APACHE-II in GSE54514 datasets (B), and E-MTAB-7581 datasets (K). Correlation coefficient and p value were calculated by Spearman correlation analysis. (C, D and F) The distribution of mortality rate between low ARG and high ARG subgroups in GSE54514 datasets (C), GSE63042 datasets (D), and GSE95233 datasets (F). p value was calculated using the Chi-square test. (E) Comparison of the ARG scores between uncomplicated sepsis, severe sepsis and septic shock in GSE63042 datasets. p value was calculated using the Kruskal–Wallis test. (G, I and J) The Sankey diagram depicts the flow from the two subgroups (low ARG and high ARG) to different phenotypes and survival outcomes, in which the width of the flow rate is proportional to the patient number. (G) E-MTAB-4421 datasets; (I) E-MTAB-4451 datasets; (J) GSE65682 datasets. p value was calculated using the Chi-square test. (H and L) The heatmap depicted the distribution of clinical characteristics arranged by the increasing ARG score in GSE106878 datasets (H), and E-MTAB-7581 datasets (L). Comparison of the different clinical characteristics between low ARG and high ARG subgroups. The asterisks indicate a statistically significant p-value calculated using the Chi-square test (*p < 0.05; **p < 0.01; ***p < 0.001). Abbreviation: APACHE-II, Acute Physiology and Chronic Health Evaluation II. |
The ARG score was significantly correlated with APACHE II in GSE54514 datasets (Figure 5C) and in E-MTAB-7581 datasets (Figure 5K). The ARG score of uncomplicated sepsis was significantly lower than that of severe sepsis and septic shock in GSE63042 datasets (Figure 5E). Patients in the low-ARG group showed a significantly higher survival rate than those in the high-ARG group (Chi-square test; Figure 5B, D, and F). A Sankey chart was produced to visualize that the low-ARG group had a lower proportion of MARS 1 and SRS1 endotypes (representing immunosuppression), whereas the high-ARG group had a higher proportion of MARS 4 and SRS2 endotypes (representing immunoactivation; Figure 5G, I, and J). According to ARG scores, the patients were categorized to produce a landscape plot of corresponding clinical characteristics (Figure 5H and L). The ARG scores were significantly higher in elder patients, in those receiving adrenocorticotropic hormone (ACTH; non-responders), patients with higher APACHE II scores, SRS1 subtypes, and deceased patients.
Clinical Applicability of ARG Classifier
ARG classifier performed better in predicting mortality than age, APACHE II, SRS, or MARS endotypes in multiple databases (Figure 6A–H). The DCA diagram indicated that ARG classifier outperformed age, APACHE II, MARS, and SRS, according to the continuity of potential death threshold (x-axis) and the net benefit of risk stratification using the model (y-axis; Figure 6I–P).
 |
Figure 6 Clinical usefulness of ARG classifier. (A–H) Multiple ROC analysis was performed to compare the prognostic performance of the ARG classifier against clinical features in multiple cohorts. (A) GSE54514 datasets; (B) GSE63042 datasets; (C) GSE65682 datasets; (D) GSE95233 datasets; (E) GSEGSE106878 datasets; (F) E-MTAB-4421 datasets; (G) E-MTAB-4451 datasets; (H) E-MTAB-7581 datasets. (I–P) Decision curve analysis was applied to evaluate the clinical usefulness of ARG classifier against clinical features in multiple cohorts. The Y-axis represents the net benefit. The black line represents the hypothesis that no patients die. The X-axis represents the threshold probability. The threshold probability is where the expected benefit of treatment is equal to the expected benefit of avoiding treatment. (I) GSE54514 datasets; (J) GSE63042 datasets; (K) GSE65682 datasets; (L) GSE95233 datasets; (M) GSEGSE106878 datasets; (N) E-MTAB-4421 datasets; (O) E-MTAB-4451 datasets; (P) E-MTAB-7581 datasets. |
Immune Cell Infiltration
To investigate the differential composition of immune cells between different ARG patterns, the CIBERSORTx tool and the ssGSEA algorithm were utilized to evaluate the fraction of immune cells in immune microenvironment. In GEO and ArrayExpress datasets, the CIBERSORTx results showed that, compared with the ARG high-expression subgroup, CD8 T cells and activated NK cells were more abundant in the ARG low-expression subgroup, whereas regulatory T cells (Tregs), resting mast cells, and eosinophils were more abundant in the ARG high-expression than in the ARG low-expression subgroup (Figures 7A and 8A).
 |
Figure 7 Analyzing the correlation between ARG classifier/hub ARGs and infiltrating immune cells in GEO datasets. (A) Comparison of infiltrating immune cells between ARG different subgroups based on CIBERSORTx tool. p value was calculated using the Wilcoxon test. (B) Comparison of infiltrating immune cells between ARG different subgroups based on ssGSEA algorithms. p value was calculated using the Wilcoxon test. (C) Correlation between ARG classifier/hub ARGs and immune cells. Correlation coefficient and p value were calculated by Spearman correlation analysis. |
 |
Figure 8 Analyzing the correlation between ARG classifier/hub ARGs and infiltrating immune cells in ArrayExpress datasets. (A) Comparison of infiltrating immune cells between ARG different subgroups based on CIBERSORTx tool. p value was calculated using the Wilcoxon test. (B) Comparison of infiltrating immune cells between ARG different subgroups based on ssGSEA algorithms. p value was calculated using the Wilcoxon test. (C) Correlation between ARG classifier/hub ARGs and immune cells. Correlation coefficient and p value were calculated by Spearman correlation analysis. |
The ssGSEA results demonstrated that B cells, CD4 T cells, CD8 T cells, dendritic cells, NK cells, and infiltrating lymphocyte (IL) were relatively more abundant in ARG low-expression subgroup than in the ARG high-expression subgroup, whereas compared to the ARG low-expression subgroup, the ARG low-expression subgroup generally contained a higher proportion of Tregs and myeloid-derived suppressor cells (MDSCs; Figures 7B and 8B).
In addition, Figures 7C and 8C show that ARG scores were significantly negatively correlated with B cells, CD4 T cells, CD8 T cells, dendritic cells, NK cells, and ILs but were significantly positively correlated with Tregs and MDSCs. Eight hub ARGs were significantly correlated to infiltration of pivotal immune cells, particularly ATG4C, BIRC5, ERBB2, HIF1A, and NFKB1.
Immune and Molecular Pathways
To determine the molecular pathways potentially involved in the pathophysiology of sepsis, GSVA was conducted to determine the enrichment score of pre-defined biological processes. In GEO and ArrayExpress datasets, the GSVA results showed that compared with the ARG high-expression subgroup, inflammation-promoting pathways, HLA, and cytolytic activity were enriched in the ARG low-expression subgroup, whereas apoptosis, type-II IFN response, and complement and coagulation cascades were mainly enriched in the ARG high-expression subgroup (Figure 9A and C).
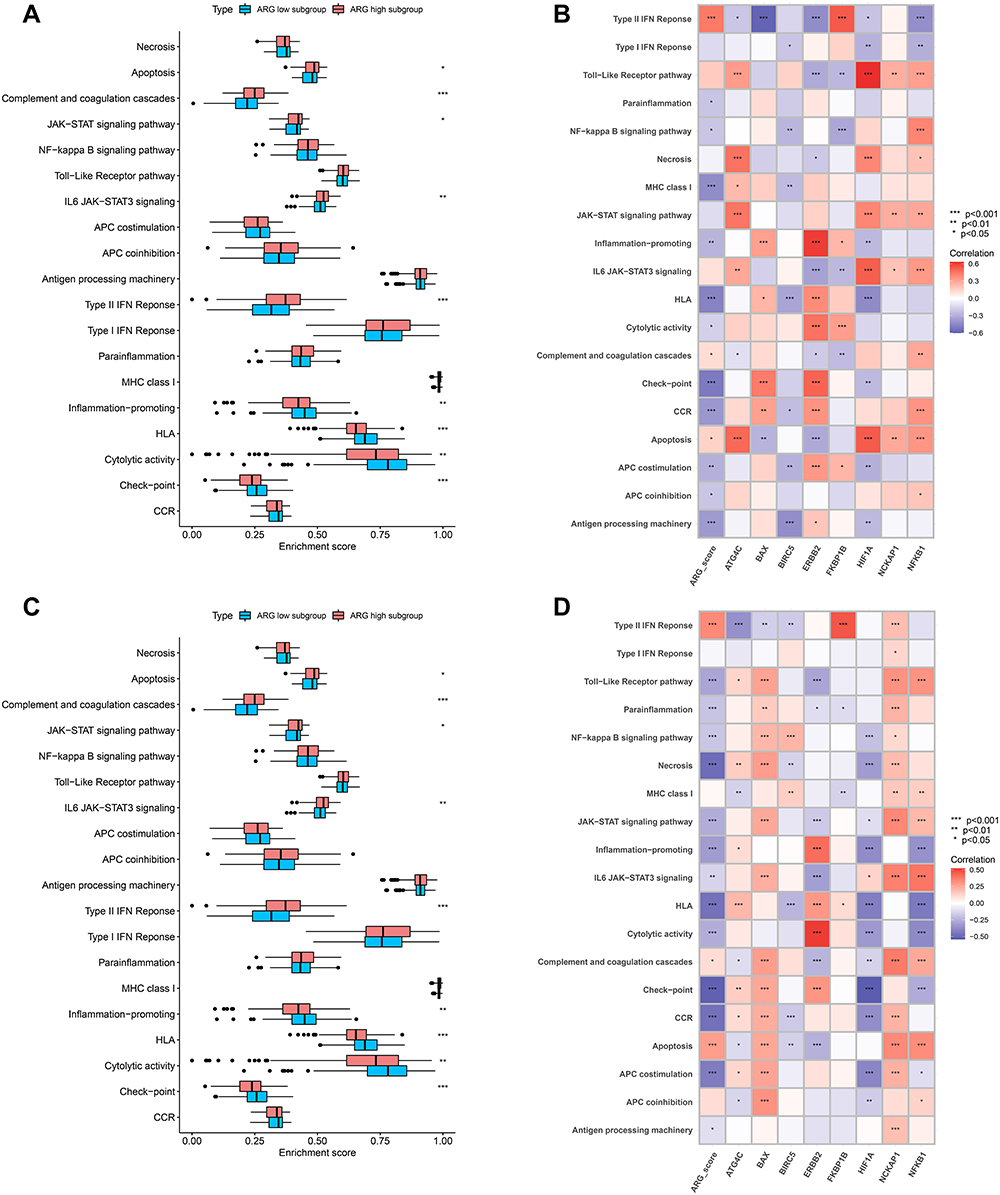 |
Figure 9 Analyzing the correlation between ARG classifier/hub ARGs and biological pathways in GEO and ArrayExpress datasets based on Gene set variation analysis (GSVA). (A and C) Comparison of biological pathways between ARG different subgroups in GEO datasets (A), and ArrayExpress datasets (C). (B and D) Correlation between ARG classifier/hub ARGs and biological pathways in GEO datasets (B), and ArrayExpress datasets (D). Correlation coefficient and p value were calculated by Spearman correlation analysis. |
Further, ARG scores were significantly negatively correlated with inflammation-promoting pathways, HLA, and cytolytic activity but significantly positively correlated with apoptosis, type-II IFN response, and complement and coagulation cascades. Eight hub ARGs were significantly associated with critical molecular pathways, especially ATG4C, ERBB2, and NFKB1 (Figure 9B and D).
Analyses of Cytokines, Immune-Related Genes, and HLA-Related Genes
Wilcoxon tests were used to compare cytokine expression levels in different HLA subtypes. The expression levels of IFNG, TNF, and PDGFRB were significantly down-regulated in the ARG high-expression subgroup, and those of IL10 were significantly up-regulated (Figure 10A and B).
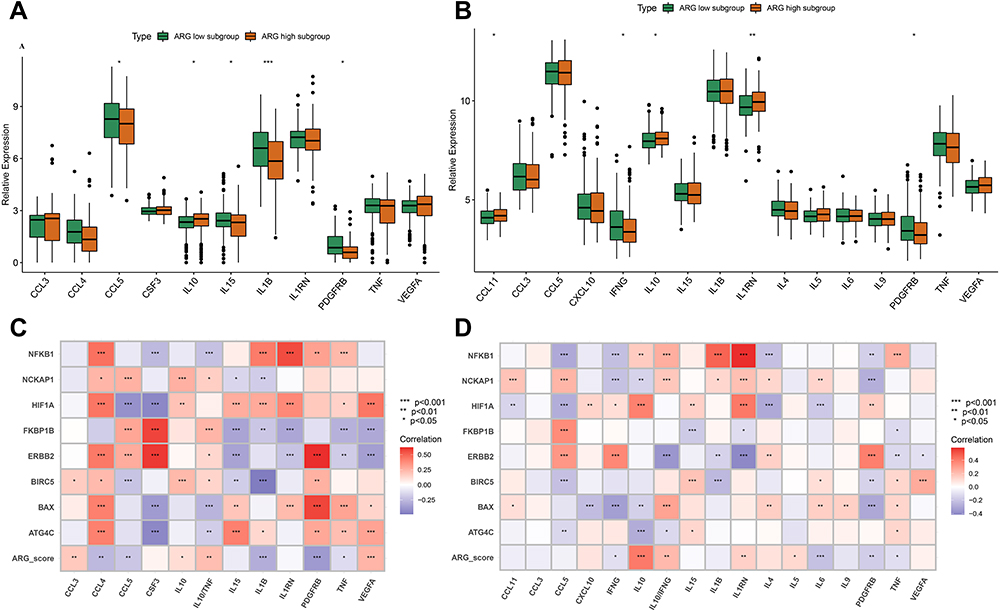 |
Figure 10 Analyzing the correlation between ARG classifier/hub ARGs and cytokines expression levels in GEO and ArrayExpress datasets. (A and C) Differential expression of cytokines between ARG different subgroups in GEO datasets (A), and ArrayExpress datasets (C). The asterisks indicate a significant statistical p value calculated using the Wilcoxon test (*p < 0.05; **p < 0.01; ***p < 0.001). (B and D) Correlation between ARG classifier/hub ARGs and cytokines in GEO datasets (B), and ArrayExpress datasets (D). Correlation coefficient and p value were calculated by Spearman correlation analysis. |
The ARG score was significantly negatively correlated with IFNG, TNF, and PDGFRB but was significantly positively correlated with IL10, IL10/TNF, and IL10/IFNG. The eight hub ARGs were significantly associated with the key cytokines, especially ATG4C, ERBB2, HIF1A, NCKAP1 and NFKB1 (Figure 10C and D).
Further, the eight hub ARGs, eight immune-related genes, and five HLA-related genes showed a high expression correlation and close interaction with each other (Figure 11A and B). Figure 11C shows a regulation relation network among these genes.
 |
Figure 11 Correlation between Hub ARGs, immune-related genes and HLA-related genes and Preliminary experimental validation. (A and B) Correlation between Hub ARGs, immune-related genes and HLA-related genes in GEO datasets (A), and ArrayExpress datasets (B). Correlation coefficient and p value were calculated by Spearman correlation analysis (*p < 0.05; **p < 0.01; ***p < 0.001). (C) Cytoscape software depicted visually the gene-gene network regulation relation. Pink lines represent a significant positive correlation. Green lines represent a significant negative correlation. (D) Differential expression of hub ARGs between sepsis patients and control patients by qRT-PCR. The asterisks indicate a significant statistical p value calculated using the Wilcoxon test (*p < 0.05; **p < 0.01; ***p < 0.001). (E) ROC curves compared the diagnostic efficacy of ARG classifier, PCT and CRP based on clinical specimens. |
Preliminary Experimental Validation
To further validate the eight hub ARG expression levels, we conducted RT-qPCR using 40 clinical blood specimens. The expression levels of ATG4C, and ERBB2 were significantly down-regulated in patients with sepsis, compared to controls, whereas BIRC5, FKBP1A, HIF1A, NCKAP1, and NFKB1 were significantly up-regulated (Figure 11D). ARG classifier (AUC = 0.865) exhibited superior diagnostic performance, compared to PCT (AUC = 0.705) and CRP (AUC = 0.641; Figure 11E).
Discussion
The present study, which involved ten GEO and three ArrayExpress datasets, comprehensively characterized the potential effects of ARGs during sepsis. Based on machine learning algorithms, the ARG classifier model was constructed by integrating eight hub ARGs (ATG4C, BAX, BIRC5, ERBB2, FKBP1B, HIF1A, NCKAP1, and NFKB1). ARG classifier exhibited excellent diagnostic performance across multiple datasets and time points, and it was able to distinguish sepsis from other critical diseases. ARG classifier was significantly associated with clinical characteristics and endotypes, and it performed better in predicting mortality than other clinical characteristics. More importantly, the expression levels of key ARGs differed significantly between septic and control patients, based on clinical specimens, and ARG classifier showed superior diagnostic performance compared to that of PCT and CRP. Further, the ARG classifier/hub ARGs were significantly correlated with immune cell infiltration, pivotal immune and molecular pathways, and several cytokines, which indicated that ARG classifier/hub ARGs can precisely reflect the immune microenvironment of sepsis patients.
To the best of our knowledge, this is the first full-scale study to investigate autophagy-related molecules based on multiple transcriptomes in all-cause sepsis, to apply machine learning for identifying novel biomarkers for a diagnostic and prognostic model, and to elucidate the relationship between model and key markers and the immune microenvironment to establish clinical applicability.
Several studies previously established predictive and prognostic models based on genome-wide expression profiling during sepsis.16–20 However, these studies developed diagnostic/prognostic models involving dozens and hundreds of genes, thus making them difficult to apply in practice.16,17,19,20 Furthermore, other previous studies mainly focused on single-expression profiling,17,18,20 whereas multiple transcriptome analysis can increase sample size and thus improve statistical power and model generalizability. In addition, most studies only reported that these subclasses of models showed good diagnostic ability or had different survival outcomes, but further clinical applicability of the respective models was not investigated.16,18–20 The current study focused on specific genes (ie, ARGs) to assess additional clinical applications based on their biological characteristics. Importantly, our results revealed that the predictive performance of ARG classifier was superior to the classical SRS endotypes17 and MARS phenotypes.18
In recent years, medicine has witnessed the emergence of machine learning as a novel tool to analyze large amounts of data.21 Machine learning techniques allow for non-linear correlations and are better suited to extracting additional information from continuous variables. Thus, they can identify more important variables and enhance model prediction performance, which is an important advantage over traditional prediction models based on logistic regression analysis for sepsis.22 Most previous studies adopted unsupervised machine learning for clustering analysis to build models of sepsis, which typically involve tens of thousands of genes and is thus not practical for clinical application.18–20 Additionally, models are not easily quantified for individual septic patients, and impractical for personalized patient management.
ARG classifier showed excellent diagnostic performance across multiple datasets and time points. In multiple time point datasets, we observed only a slight decline in AUC values over time, suggesting that the ARG classifier may be suitable for early diagnosis of sepsis. According to the definition of SIRS and sepsis, patients with both conditions show similar signs and symptoms. Thus, it is challenging to differentiate between sepsis and SIRS or severe trauma. In the current study, ARG classifier was found to discriminate effectively between sepsis and SIRS, head trauma, anaphylaxis, and uninfected patients. More importantly, RT-qPCR on clinical specimens confirmed that ATG4C, and ERBB2 showed significantly lower expression in septic than in control patients; however, BIRC5, FKBP1A, HIF1A, NCKAP1, and NFKB1 were significantly higher expressed, and ARG classifier exhibited better diagnostic accuracy than common clinical biomarkers (ie, PCT and CRP). This may be ascribed to the following reasons: 1) due to the heterogeneity of sepsis, very few biomarkers produce consistently acceptable diagnostic performance in all-cause sepsis, whereas machine learning methods and transcriptomics can account for the heterogeneity of the disease.24 2) Large-scale data analysis will help identify stable biomarkers. 3) The effective combination of multiple biomarkers is preferable to a single biomarker. Taken together, ARG classifier may be a robust tool for early diagnosis of sepsis.
Additionally, multivariate logistic regression analyses verified that ARG classifier is an independent prognostic factor in multiple transcriptome datasets. Patients in the ARG high-expression subgroup showed older age, higher APACHE II scores, more severe sepsis subtypes, and poorer survival outcome and included fewer ACTH responders, a higher proportion of SRS 1 endotypes17 and MARS 1 phenotypes.18 This suggests that ARG classifier found distinct distribution patterns in sepsis, which will help assist risk stratification and guide personalized therapy. In several cohorts, we observed that the prognosis accuracy of several clinical characteristics, such as APACHE II score and age, were comparably high. As each characteristic reflects different pathophysiological aspects, we combined other clinical information for ARG classifier to further improve the prediction precision. Taken together, the ARG classifier can help identify patients at risk of a poor or even fatal outcome in sepsis.
So far, prognostic biomarkers and models have mainly been utilized for overall prognosis, which has proven insufficient.25 The process of autophagy is fundamentally important in cellular development, function, and homeostasis, and increasing evidence suggests that autophagy plays an important regulatory role in immune cell activities and cytokine release. Suppression or deficiency of autophagy results in immune cell dysfunction and depletion, followed by disturbed immunity and increased mortality under septic conditions.26 Thus, we speculated that the identification of key ARGs and the model based on ARGs may be closely related to the immune microenvironment of sepsis. Sepsis-induced immunoparalysis is characterized by dysfunction of antigen-presenting cells, decreased expression of MHC class II molecules, abundant apoptosis of various immune cells, inhibition of T cell proliferation, a drift from pro-inflammatory response to anti-inflammatory response, and increased abundance of Tregs.27
The current study showed that the low ARG subgroup was significantly positively associated with activated immune cells (B cells, CD4 T cells, CD8 T cells, dendritic cells, NK cells, and ILs), immune/inflammation-related pathways (inflammation-promoting pathways, HLA, and cytolytic activity), and pro-inflammatory cytokines (TNF, IFNG, and PDGFRB), suggesting that low ARG expression was attributable to the immune-activated microenvironment and was in accordance with the prior identification of SRS 1 endotypes17 and MARS 1 phenotypes.18 However, the ARG high-expression subgroup was significantly associated with immunosuppressive cells (Tregs and MDSCs), apoptosis, complement and coagulation cascades, anti-inflammatory cytokines (IL10, IL10, TNF, IL10, and IFNG), suggesting that this subgroup shows immunocompromised microenvironments, consistent with the previously published SRS 2 endotypes17 and MARS 4 phenotypes.18 Similarly, these hub ARGs were also closely correlated with infiltrating immune cells, immune/inflammation-related pathways, and cytokines. Overall, ARG classifier efficiently reflected the immune microenvironment during sepsis, which may help guide immune-modulating agents to achieve immune homeostasis.
The pathophysiological mechanism of sepsis is complex. Currently, the recognized mechanism is the imbalance of host immune response and coagulation system dysfunction.28 Abnormal blood coagulation is the basic event eliciting sepsis complications and multiple organ failure in humans, thus it should be strategically targeted for therapeutic purposes.29 In the current study, we found that the complement and coagulation cascades were mainly enriched in the ARG high-expression subtypes that are associated with unfavorable survival outcome. Hence, we speculated that eight ARGs of the ARG classifier may participate in complement and coagulation cascades to affect the progress of patients with sepsis. Accordingly, when investigating the relationship between the hub ARGs and biological pathways, we found that ATG4C, ERBB2, and NFKB1 were significantly associated with the complement and coagulation cascades. Additionally, we found that ATG4C was significantly positively correlated with immune cells (macrophages and Th1 cells) and cytokines (IL15 and TNF). In fact, macrophages secrete IL15, and Th1 cells produce TNF.30 Thus, we deduced that ATG4C, ERBB2, and NFKB1 molecular play a critical role in regulating immunocoagulation during sepsis and are promising therapeutic targets. The current study thus provides data support for the clinical application of ATG4C/NFKB1/ERBB2; however, the specific mechanisms require further study.
Despite promising results, there are some limitations to our study. First, our model demonstrated impressive performance regarding prediction; however, it is not yet suitable for general use prior to validation using external datasets with large sample sizes in prospective cohorts. Second, autophagy frequently shows dynamic changes during sepsis. Most cohorts provided transcriptome data at a single point in time, thus we need to explore the effects of dynamic expression of these hub ARGs during sepsis. Third, CIBERSORTx deconvolution and ssGSEA algorithm with metagenes may not accurately evaluate immune cell subpopulations, even though the different methods and different datasets validate each other. It is necessary to apply single-cell RNA sequencing or fluorescence-activated cell sorting to verify our results. Further, in vitro and in vivo experiments to explore the molecular mechanism will help further identify the exact role of hub genes in the regulation of the immune cell and related immunocoagulation pathways during sepsis.
Conclusion
In conclusion, a diagnostic and prognostic model (ARG classifier) based on eight ARGs was constructed which will help aid clinicians in the diagnosis of sepsis and identify high-risk patients for intervention. Additionally, ARG classifier can accurately reflect the immune microenvironment complex of sepsis and may facilitate personalized therapy.
Abbreviations
ARGs, autophagy-related genes; SVM, support vector machine; GEO, Gene Expression Omnibus; ANN, artificial neural network; ssGSEA, single-sample gene set enrichment analysis; GSVA, Gene set variation analysis; HLA, human leukocyte antigen; IL, infiltrating lymphocyte; MDSC, myeloid-derived suppressor cells; CRP, C-reactive protein; PCT, procalcitonin; PCA, principal component analysis; DEGs, differentially expressed genes; GO, Gene ontology; MF, molecular function; BP, biological process; CC, cellular component; KEGG, Kyoto Encyclopedia of Genes and Genomes; PBMC, peripheral blood mononuclear cells; SRS, sepsis response signature; MARS, Molecular Diagnosis and Risk Stratification of Sepsis; APACHE II, Acute Physiology and Chronic Health Evaluation; ACTH, adrenocorticotropic hormone; DCA, decision curve analysis; RT-qPCR, real-time quantitative polymerase chain reaction; ROC, receiver operating characteristic; AUC, area under the curve.
Data Sharing Statement
The data that support the findings of this study are provided in Supplementary Materials and are also made available in the GEO (https://www.ncbi.nlm.nih.gov/geo/) and ArrayExpress (https://www.ebi.ac.uk/arrayexpress/).
Ethics Approval and Consent to Participate
All data were obtained from the GEO and ArrayExpress databases, and informed consent had been obtained from the patients before the study. Experiments involving human blood samples were reviewed and approved by the Research Ethics Committee of Shunde Hospital, Southern Medical University (The First people’s hospital of Shunde) and complied with the Declaration of Helsinki.
Acknowledgments
We thank Bullet Edits Limited for the linguistic editing and proofreading of the manuscript.
Funding
Financial support for the research from Guangdong Medical Science and Technology Research Fund (grant no. 202011131077944) and Scientific Research Start Plan of Shunde Hospital, Southern Medical University (grant no. SRSP2021010 and CRSP2022006).
Disclosure
The authors have no competing interests to declare in this work.
References
1. Singer M, Deutschman CS, Seymour CW, et al. The third international consensus definitions for sepsis and septic shock (sepsis-3). JAMA. 2016;315(8):801–810. doi:10.1001/jama.2016.0287
2. Rudd KE, Johnson SC, Agesa KM, et al. Global, regional, and national sepsis incidence and mortality, 1990–2017: analysis for the global burden of disease study. Lancet. 2020;395(10219):200–211. doi:10.1016/S0140-6736(19)32989-7
3. Ferrer R, Martin-Loeches I, Phillips G, et al. Empiric antibiotic treatment reduces mortality in severe sepsis and septic shock from the first hour: results from a guideline-based performance improvement program. Crit Care Med. 2014;42(8):1749–1755. doi:10.1097/CCM.0000000000000330
4. Beltrán-García J, Osca-Verdegal R, Romá-Mateo C, et al. Epigenetic biomarkers for human sepsis and septic shock: insights from immunosuppression. Epigenomics. 2020;12(7):617–646. doi:10.2217/epi-2019-0329
5. Barichello T, Generoso JS, Singer M, et al. Biomarkers for sepsis: more than just fever and leukocytosis-a narrative review. Crit Care. 2022;26(1):14. doi:10.1186/s13054-021-03862-5
6. Dikic I, Elazar Z. Mechanism and medical implications of mammalian autophagy. Nat Rev Mol Cell Biol. 2018;19(6):349–364. doi:10.1038/s41580-018-0003-4
7. Feng Y, Liu B, Zheng X, et al. The protective role of autophagy in sepsis. Microb Pathog. 2019;131:106–111. doi:10.1016/j.micpath.2019.03.039
8. Park SY, Shrestha S, Youn YJ, et al. Autophagy primes neutrophils for neutrophil extracellular trap formation during sepsis. Am J Respir Crit Care Med. 2017;196(5):577–589. doi:10.1164/rccm.201603-0596OC
9. Neumann Y, Bruns SA, Rohde M, et al. Intracellular Staphylococcus aureus eludes selective autophagy by activating a host cell kinase. Autophagy. 2016;12(11):2069–2084. doi:10.1080/15548627.2016.1226732
10. Oami T, Watanabe E, Hatano M, et al. Suppression of T cell autophagy results in decreased viability and function of T cells through accelerated apoptosis in a murine sepsis model. Crit Care Med. 2017;45(1):e77–e85. doi:10.1097/CCM.0000000000002016
11. He S, Deng Z, Li Z, et al. Signatures of 4 autophagy-related genes as diagnostic markers of MDD and their correlation with immune infiltration. J Affect Disord. 2021;295:11–20. doi:10.1016/j.jad.2021.08.005
12. Lu TP, Tsai MH, Lee JM, et al. Identification of a novel biomarker, SEMA5A, for non-small cell lung carcinoma in nonsmoking women. Cancer Epidemiol Biomarkers Prev. 2010;19(10):2590–2597. doi:10.1158/1055-9965.EPI-10-0332
13. Shimizu H, Nakayama KI. A 23 gene-based molecular prognostic score precisely predicts overall survival of breast cancer patients. EBioMedicine. 2019;46:150–159. doi:10.1016/j.ebiom.2019.07.046
14. Chen Z, Chen R, Ou Y, et al. Construction of an HLA classifier for early diagnosis, prognosis, and recognition of immunosuppression in sepsis by multiple transcriptome datasets. Front Physiol. 2022;13:870657. doi:10.3389/fphys.2022.870657
15. Lu J, Chen R, Ou Y, et al. Characterization of immune-related genes and immune infiltration features for early diagnosis, prognosis and recognition of immunosuppression in sepsis. Int Immunopharmacol. 2022;107:108650. doi:10.1016/j.intimp.2022.108650
16. Pena OM, Hancock DG, Lyle NH, et al. An endotoxin tolerance signature predicts sepsis and organ dysfunction at initial clinical presentation. EBioMedicine. 2014;1(1):64–71. doi:10.1016/j.ebiom.2014.10.003
17. Davenport EE, Burnham KL, Radhakrishnan J, et al. Genomic landscape of the individual host response and outcomes in sepsis: a prospective cohort study. Lancet Respir Med. 2016;4(4):259–271. doi:10.1016/S2213-2600(16)00046-1
18. Scicluna BP, van Vught LA, Zwinderman AH, et al. Classification of patients with sepsis according to blood genomic endotype: a prospective cohort study. Lancet Respir Med. 2017;5(10):816–826. doi:10.1016/S2213-2600(17)30294-1
19. Sweeney TE, Azad TD, Donato M, et al. Unsupervised analysis of transcriptomics in bacterial sepsis across multiple datasets reveals three robust clusters. Crit Care Med. 2018;46(6):915–925. doi:10.1097/CCM.0000000000003084
20. Lukaszewski RA, Jones HE, Gersuk VH, et al. Presymptomatic diagnosis of postoperative infection and sepsis using gene expression signatures [published online ahead of print, 2022 Jul 13]. Intensive Care Med. 2022;48(9):1133–1143. doi:10.1007/s00134-022-06769-z
21. Beam AL, Kohane IS, Data B. Machine learning in health care. JAMA. 2018;319(13):1317–1318. doi:10.1001/jama.2017.18391
22. Shankar-Hari M, Datta D, Wilson J, et al. Early PREdiction of sepsis using leukocyte surface biomarkers: the ExPRES-sepsis cohort study. Intensive Care Med. 2018;44(11):1836–1848. doi:10.1007/s00134-018-5389-0
23. Banerjee S, Mohammed A, Wong HR, Palaniyar N, Kamaleswaran R. Machine learning identifies complicated sepsis course and subsequent mortality based on 20 genes in peripheral blood immune cells at 24 H post-ICU admission. Front Immunol. 2021;12:592303. doi:10.3389/fimmu.2021.592303
24. Baniasadi A, Rezaeirad S, Zare H, et al. Two-step imputation and adaboost-based classification for early prediction of sepsis on imbalanced clinical data. Crit Care Med. 2021;49(1):e91–e97. doi:10.1097/CCM.0000000000004705
25. Jensen JU, Bouadma L. Why biomarkers failed in sepsis. Intensive Care Med. 2016;42(12):2049–2051. doi:10.1007/s00134-016-4531-0
26. Kumar V. T cells and their immunometabolism: a novel way to understanding sepsis immunopathogenesis and future therapeutics. Eur J Cell Biol. 2018;97(6):379–392. doi:10.1016/j.ejcb.2018.05.001
27. Cheng Z, Abrams ST, Toh J, et al. The critical roles and mechanisms of immune cell death in sepsis. Front Immunol. 2020;11:1918. doi:10.3389/fimmu.2020.01918
28. Tang D, Wang H, Billiar TR, et al. Emerging mechanisms of immunocoagulation in sepsis and septic shock. Trends Immunol. 2021;42(6):508–522. doi:10.1016/j.it.2021.04.001
29. Ryan TAJ, O’Neill LAJ. Innate immune signaling and immunothrombosis: new insights and therapeutic opportunities. Eur J Immunol. 2022;52(7):1024–1034. doi:10.1002/eji.202149410
30. Yao YM, Osuchowski MF, Wang JH, et al. Editorial: immune dysfunction: an update of new immune cell subsets and cytokines in sepsis. Front Immunol. 2021;12:822068. doi:10.3389/fimmu.2021.822068
 © 2022 The Author(s). This work is published and licensed by Dove Medical Press Limited. The
full terms of this license are available at https://www.dovepress.com/terms
and incorporate the Creative Commons Attribution
- Non Commercial (unported, 3.0) License.
By accessing the work you hereby accept the Terms. Non-commercial uses of the work are permitted
without any further permission from Dove Medical Press Limited, provided the work is properly
attributed. For permission for commercial use of this work, please see paragraphs 4.2 and 5 of our Terms.
© 2022 The Author(s). This work is published and licensed by Dove Medical Press Limited. The
full terms of this license are available at https://www.dovepress.com/terms
and incorporate the Creative Commons Attribution
- Non Commercial (unported, 3.0) License.
By accessing the work you hereby accept the Terms. Non-commercial uses of the work are permitted
without any further permission from Dove Medical Press Limited, provided the work is properly
attributed. For permission for commercial use of this work, please see paragraphs 4.2 and 5 of our Terms.