
Back to Journals » International Journal of Women's Health » Volume 18
Construction of a Risk Identification Model Based on Electrolytes and Related Factors for Nausea and Vomiting in Pregnancy: A Secondary Analysis of Clinical Trial Data
Authors Gao Z  , Feng J, Liu Y, Gao Q, Yu J, Liu Y, Li Z, Duan Y, Jiang S, Wu X, Gao J
Received 22 April 2026
Accepted for publication 5 July 2026
Published 15 July 2026 Volume 2026:18 618603
DOI https://doi.org/10.2147/IJWH.S618603
Checked for plagiarism Yes
Review by Single anonymous peer review
Peer reviewer comments 4
Editor who approved publication: Dr Everett Magann
Zhuwei Gao,1 Jiaxing Feng,2 Yue Liu,1 Qing Gao,3 Jiannan Yu,1 Yang Liu,4 Zihan Li,1 Yuqi Duan,1 Shan Jiang,1 Xiaoke Wu,2,4 Jingshu Gao4
1Graduate School, Heilongjiang University of Chinese Medicine, Harbin, Heilongjiang, 150000, People’s Republic of China; 2Department of Gynecology, First Affiliated Hospital, Heilongjiang University of Chinese Medicine, Harbin, Heilongjiang, 150000, People’s Republic of China; 3School of Life Sciences, Zhejiang University of Traditional Chinese Medicine, Hangzhou, Zhejiang, 310053, People’s Republic of China; 4Center for Evidence-Based Medicine in Obstetrics and Gynecology, Zhejiang Provincial Hospital of Chinese Medicine, and Zhejiang Chinese Medical University, Hangzhou, Zhejiang, 310053, People’s Republic of China
Correspondence: Xiaoke Wu, First Affiliated Hospital, Heilongjiang University of Chinese Medicine, Harbin, Heilongjiang, People’s Republic of China, Email [email protected] Jingshu Gao, Zhejiang Provincial Hospital of Chinese Medicine, Zhejiang Chinese Medical University, Hangzhou, Zhejiang, People’s Republic of China, Email [email protected]
Background: Nausea and vomiting in pregnancy (NVP) is one of the most common symptoms during early gestation. A subset of affected women may progress to severe NVP, which is frequently accompanied by electrolyte disturbances, impaired nutritional status, and adverse pregnancy outcomes. However, the relationships between multiple electrolyte-related factors and the severity of NVP have not been systematically investigated.
Objective: To explore the statistical associations between multiple electrolytes, related laboratory indicators, and NVP severity, and to develop a risk identification model integrating electrolyte, nutritional, and psychological factors for the risk stratification of severe NVP.
Methods: This study was a secondary analysis of data derived from a multicenter randomized controlled trial and included 351 women with moderate-to-severe NVP during early pregnancy. Baseline demographic characteristics, biochemical parameters (including electrolytes, vitamins, and liver and renal function indicators), and psychological assessment scores from the Self-Rating Anxiety Scale (SAS) and the Self-Rating Depression Scale (SDS) were considered candidate variables. Variable selection was performed using least absolute shrinkage and selection operator (LASSO) regression, followed by multivariable logistic regression to construct two risk identification models: an electrolyte-based model (Model 1) and a multidimensional model integrating psychological and nutritional factors (Model 2). Model performance was evaluated using the receiver operating characteristic (ROC) curve, calibration curve, and decision curve analysis (DCA).
Results: LASSO regression identified nine variables for inclusion in the final analysis, including Calcium (Ca), Potassium (K), Iron (Fe), Chloride (Cl), Zinc (Zn), Urea, SAS, SDS, and Pyridoxal (PL). Compared with Model 1, Model 2 demonstrated superior discriminatory performance (area under the ROC curve [AUC]: 0.717 vs. 0.655). Both models showed acceptable calibration. DCA indicated that Model 2 provided a slightly greater net clinical benefit than Model 1 across threshold probabilities ranging from 0.10 to 0.40.
Conclusion: Electrolytes and related laboratory indicators were statistically associated with the severity of NVP, and integrating psychological and nutritional factors further improved risk identification performance. Because this study was based on cross-sectional baseline data, the findings reflect associations rather than causal relationships. The proposed model may serve as a preliminary tool for the risk stratification of severe NVP; however, its clinical utility requires further validation in independent external cohorts.
Keywords: nausea and vomiting in pregnancy, hyperemesis gravidarum, electrolyte imbalance, risk identification model, risk stratification, secondary analysis
Introduction
Nausea and vomiting are among the most common symptoms during early pregnancy, affecting approximately 90% of pregnant women, and generally resolve before 20 weeks of gestation.1 Hyperemesis gravidarum (HG) is a severe form of NVP and occurs in 0.3–10.8% of pregnant women.2 It is characterized by severely impaired oral intake and a loss of at least 5% of prepregnancy body weight and may be accompanied by dehydration and/or electrolyte abnormalities.3 If left uncontrolled, HG increases the risk of adverse maternal and fetal outcomes and may also negatively affect emotional and psychological health.4 Therefore, the early identification of women at high risk for severe NVP and the implementation of targeted management strategies are of considerable clinical importance. At present, no universally accepted diagnostic criteria for NVP exist in clinical practice; consequently, the Pregnancy-Unique Quantification of Emesis and Nausea (PUQE) score is widely used for standardized assessment.5 The PUQE score quantifies the severity of NVP based on the duration of nausea, the frequency of vomiting episodes, and the frequency of retching. It has been shown to correlate well with maternal well-being, the risk of hospitalization, and other relevant clinical outcomes, making it one of the most commonly used instruments for evaluating NVP severity in both clinical research and follow-up studies.6
In recent years, the pathogenesis of NVP has been primarily attributed to genetic factors, hormonal alterations, regulation of gastrointestinal motility, and gut–brain axis signaling. Previous studies have suggested that gastrointestinal mechanosensation and neural reflexes play pivotal roles in regulating food intake, vomiting, and gastrointestinal fluid movement, a process that depends on the complex interactions between the enteric and central nervous system.7 In contrast, systematic investigations into the potential role of fluid homeostasis and electrolyte balance in the pathogenesis of NVP remain limited. Persistent and severe vomiting in patients with NVP can result in substantial fluid loss, subsequently leading to electrolyte disturbances characterized by reductions in serum potassium, sodium (Na), and chloride concentrations. Such abnormalities are generally regarded as secondary consequences of disease progression,8 suggesting that fluctuations in gastrointestinal-related electrolytes may indeed influence physiological function. More importantly, electrolyte homeostasis extends beyond the maintenance of simple fluid and ionic balance and plays a fundamental role in regulating gastrointestinal smooth muscle activity, bioelectrical signaling, and neurotransmission. For example, potassium is a critical determinant of the resting membrane potential and normal generation of action potentials. Potassium imbalance can markedly alter the firing frequency and contractile behavior of gastrointestinal smooth muscle, thereby affecting gastric emptying and intestinal motility.9 Calcium serves as a central mediator of intracellular signal transduction and smooth muscle contraction, and calcium signaling pathways are involved in multiple enteric neuroregulatory feedback mechanisms.10 Chloride, through its participation in gastric acid secretion and intestinal fluid homeostasis, represents one of the fundamental ions required for the normal transport of gastrointestinal contents.11 In addition, trace nutrients such as iron are closely involved in neurotransmitter metabolism and may therefore contribute to the regulation of nausea and emotional symptoms.12 Collectively, both biological mechanisms and clinical manifestations provide a theoretical basis for the involvement of these indicators in gastrointestinal function and symptom severity, warranting further investigation of their associations with severe NVP.
Regarding the relationship between electrolytes and NVP, existing studies have mainly focused on individual electrolytes or single biochemical indicators. In contrast, electrolyte disturbances encountered in clinical practice often involve the simultaneous imbalance of multiple ions, and their combined effects have not been systematically evaluated.13 Beyond studies of electrolyte-related factors, research on risk identification in NVP is also relatively limited. Current research on NVP has largely focused on epidemiology, disease prevention, and clinical management,14,15 whereas studies on risk identification remain relatively limited. Existing risk identification studies have primarily focused on individual risk factors or specific clinical outcomes, whereas studies on multidimensional risk identification models remain insufficient. For instance, Ismail16 systematically reviewed potential associated factors such as prior HG history, Helicobacter pylori infection, body mass index (BMI), and hormone levels, but the evidence remained inconsistent, and no unified risk identification framework has been established. Boelig17 developed a rehospitalization risk-scoring index for patients with HG, but the model demonstrated only moderate discriminatory performance. Abubakar18 compared discriminant analysis with logistic regression for classifying HG severity, showing that discriminant analysis performed better in small samples, although without calibration or validation of net clinical benefit. Fiaschi,19 based on a national cohort, identified recurrence-related factors such as multiple pregnancies, female fetus, and prior HG, but did not further develop a risk identification tool for clinical risk stratification based on these findings. Overall, studies that integrate multidimensional variables, including electrolytes, nutritional status, and psychological factors, to develop NVP risk identification models and subsequently apply them to the risk stratification of severe NVP remain relatively scarce.
Therefore, systematically evaluating the associations between multiple electrolytes and related factors and the severity of NVP, as well as developing a risk identification tool with strong discriminative performance, remain important research priorities. Accordingly, using baseline data from a multicenter randomized controlled trial, the present study systematically analyzed multiple electrolytes and related laboratory indicators to investigate their statistical associations with the severity of severe NVP. Furthermore, nutritional, metabolic, and psychological factors were integrated to develop a risk identification model, and the discriminatory performance and calibration of different models were compared to provide evidence to support risk stratification and clinical management of severe NVP.
Methods and Materials
Participants
This study was a secondary retrospective analysis of data from the multicenter, prospective, randomized controlled trial NVPAct (ClinicalTrials.gov identifier: NCT04401384). The NVPAct trial was a large-scale, multicenter study conducted across 13 centers in mainland China between 2020 and 2022. A total of 533 women were screened for eligibility in the parent trial, of whom 351 participants were included in the present secondary analysis. The original study was approved by the institutional review board of the coordinating center and the ethics committees of all participating sites. All participants provided written informed consent prior to enrollment. The present study is an exploratory secondary analysis of baseline data from the NVPAct trial and was not prespecified in the original trial protocol. Furthermore, all candidate variables and the outcome variable were measured at the same time point. Therefore, the primary objective of this study was to identify characteristics associated with severe NVP and to develop a risk identification model, rather than to predict future clinical outcomes.
Inclusion and Exclusion Criteria
The inclusion criteria of the parent randomized controlled trial were as follows: women aged 20–45 years, gestational age between 7 and 14 weeks, a PUQE score ≥6, less than 20% weight loss from pre-pregnancy body weight in early pregnancy, and a confirmed singleton intrauterine pregnancy by ultrasound. The exclusion criteria included severe systemic diseases, uncontrolled chronic diseases, other conditions that could cause vomiting, use of antiemetic medications within the previous week (such as vitamin B6, ondansetron, metoclopramide, corticosteroids, and related traditional Chinese medicines), or relevant contraindications. Detailed inclusion and exclusion criteria have been described in the original trial report.20 For the present secondary analysis, an additional eligibility criterion of PUQE score ≥7 was applied.
Outcome Variable
In the original study, PUQE scores were assessed at multiple time points throughout the study period. In this secondary analysis, only the baseline PUQE score obtained before randomization was included. Specifically, the initial PUQE assessment was completed during the screening visit and served as the primary eligibility criterion for enrollment as well as the baseline measure for subsequent analyses. This score reflected the severity of nausea, vomiting, and retching experienced by the participants during the preceding 24 hours at the time of enrollment. PUQE scores collected during or after treatment were not included in the present analysis. The PUQE score21 is an internationally recognized instrument for assessing NVP. The total score ranges from 3 to 15, with higher scores indicating greater symptom severity. According to the modified PUQE classification, scores of ≤6 indicate mild NVP, scores of 7–12 indicate moderate NVP, and scores of ≥13 indicate severe NVP. To ensure that the study population had clinically significant symptoms, only women with PUQE scores ≥7 were included. Participants with PUQE scores ≥13 were classified into the severe NVP group, whereas those with PUQE scores of 7–12 were classified into the moderate NVP group. Severe NVP was defined as the outcome of interest and served as the basis for developing the risk identification model. All assessment results were entered into the electronic case report form system and uploaded to the Data Coordinating Committee. All investigators received standardized training to ensure the consistency and reliability of data collection.
Candidate Variables and Their Measurements
In this secondary analysis, all candidate variables and the outcome variable were derived from baseline assessments completed on the day of enrollment (Day 0), before the initiation of study treatment. These included laboratory parameters, such as electrolyte measurements, as well as the PUQE assessment and other clinical data collected at the same time point. Although laboratory parameters were measured both at baseline and at the end of treatment in the original randomized controlled trial, only baseline laboratory results were included in the present analysis; end-of-treatment measurements and data collected during the subsequent treatment period were excluded.
General Information
At baseline, biological and demographic data from participants, including age, anthropometric measures (height, weight, BMI, gestational weeks, and History of HG/NVP), socioeconomic factors (educational level, occupation, household income, and living arrangement), and smoking status (participant and partner), were collected.
Laboratory Measurements
Laboratory analyses encompassed electrolytes, vitamins, liver function, renal function, and serotonin (5-HT). The electrolyte panel included serum Na, K, Ca, Mg, Cl, Fe, and phosphorus. Vitamin profiling included vitamin B1, two vitamin B6 forms—PL and pyridoxal-5′-phosphate (PLP)—and vitamin B12. Liver function indices included serum aspartate aminotransferase (AST), alanine aminotransferase (ALT), and alkaline phosphatase (ALP). Renal function was assessed using serum creatinine (CREA) and urea. All blood samples were collected at participating centers and analyzed centrally in a certified laboratory.
Questionnaire-Based Scales
The study employed the following validated questionnaires for assessment: (1) Zung SAS (range: 25–100), with higher scores indicating greater anxiety severity; and (2) Zung SDS (range: 25–100), where increased scores denote more severe depressive symptoms.
Development and Validation of the Risk Identification Model for Severe NVP
Preprocessing of Candidate Variables
To develop the risk identification model for severe NVP, this study adopted a stepwise selection, validation, and optimization strategy. Demographic characteristics, biochemical parameters (including electrolytes, vitamins, and liver and renal function indicators), and psychological assessment scores (SAS and SDS) were considered candidate variables. Missing data (Supplementary Table 1) were handled using multiple imputation. Assuming the data were missing at random, 20 imputed datasets were generated, including all candidate variables and the outcome variable in the imputation model. Subsequent variable selection, model development, and model validation were all performed using the multiply imputed datasets, and the final estimates were combined according to Rubin’s rules. Before applying LASSO regression, all continuous variables (eg, electrolytes and vitamin levels) were standardized using z-scores (mean-centered and divided by the standard deviation) to ensure comparability across variables on a common scale. Categorical variables were converted into dummy variables and included as candidate variables. All preprocessing steps were performed within the training data to avoid potential data leakage.
Variable Selection and Development of the Risk Identification Models
Severe NVP was defined as the outcome event in this study, while demographic characteristics, biochemical parameters, and psychological assessment scores were considered candidate variables. Variable selection was first performed using the LASSO regression to reduce redundant variables and minimize the risk of model overfitting. The variables retained after LASSO selection were subsequently entered into multivariable logistic regression models. The optimal penalty parameter (λ) was determined by 10-fold cross-validation, and the discriminatory performance of the models corresponding to λ.min and λ.1se was compared.
NVP, particularly among women with moderate-to-severe symptoms, is frequently accompanied by dehydration and fluid–electrolyte imbalance. Therefore, the monitoring and assessment of electrolyte levels have been widely used in the clinical evaluation of disease severity and treatment management.22 Based on this clinical rationale, electrolyte-related indicators identified by LASSO regression were extracted to construct an electrolyte-based model (Model 1) to evaluate the ability of electrolyte disturbances to identify severe NVP. In addition, to compare the performance of electrolyte indicators alone with that of multidimensional clinical information in identifying severe NVP, and to evaluate the discriminatory ability of electrolyte indicators when used independently, all variables retained by LASSO regression were incorporated into a comprehensive model (Model 2). Both models were developed using multivariable logistic regression.
Model Evaluation and Validation
The performance of the models was systematically evaluated using ROC curves, calibration curves, nomograms, and DCA. DCA was performed to assess the net clinical benefit of the models across different threshold probabilities. The threshold range considered to have potential clinical utility was determined according to the DCA results, namely the probability interval in which the model curve was higher than both the “treat all” and “treat none” strategies. In addition, to further evaluate model robustness and correct for optimism bias, internal validation was performed using bootstrap resampling. Specifically, 500 bootstrap resamples (B = 500) were generated. For each iteration, a bootstrap sample was created by sampling with replacement from the original dataset, the model was refitted, and the apparent area under the ROC curve (AUC) was calculated. Model performance was subsequently evaluated in the corresponding out-of-bag (OOB) sample, and the OOB AUC was calculated. Optimism bias was estimated by comparing the apparent AUC obtained from the bootstrap sample with the corresponding OOB AUC, and the optimism-corrected AUC was subsequently derived. The main model performance metrics were reported using pooled estimates across the 20 imputed datasets, while optimism-corrected AUCs based on bootstrap resampling were additionally calculated to assess model robustness.
Statistical Analysis
Statistical analyses were performed using IBM SPSS Statistics version 25.0 (IBM Corp., Armonk, NY, USA) and R version 4.5.0 (R Foundation for Statistical Computing, Vienna, Austria) within the RStudio environment. Normality of continuous variables was assessed using the Shapiro–Wilk test. Normally distributed variables are presented as the mean ± standard deviation (SD) and were compared using the independent-samples t test. When the assumption of equal variances was violated, Welch’s t test was applied, and the mean difference with its 95% confidence interval (CI) was reported. Non-normally distributed variables are presented as the median (interquartile range, IQR) and were compared using the Mann–Whitney U test. The median difference and its 95% CI were estimated using the bootstrap method with 2,000 resamples in R. Categorical variables are presented as frequencies (percentages) and were compared using the chi-square test or Fisher’s exact test, as appropriate.
Missing data were handled using multiple imputation for continuous variables to reduce potential bias associated with missing values. Before model development, all continuous variables were standardized using z-score transformation, and categorical variables were converted into dummy variables. Least absolute shrinkage and selection operator (LASSO) regression with 10-fold cross-validation was used to determine the optimal penalty parameter (λ) and perform variable selection. Model discrimination was evaluated using receiver operating characteristic (ROC) curves and the area under the curve (AUC). Calibration performance was assessed using calibration curves and the Hosmer–Lemeshow goodness-of-fit test. Clinical utility was evaluated using decision curve analysis (DCA). Internal validation was performed using bootstrap resampling (B = 500), and optimism-corrected AUC values were calculated to assess model robustness. All statistical tests were two-sided, and P < 0.05 was considered statistically significant.
Results
Comparison of Baseline Characteristics Between Moderate and Severe NVP
In the baseline comparison, 351 pregnant women were included: 249 in the moderate NVP group and 102 in the severe NVP group. No significant differences were observed between the two groups for age, height, weight, BMI, gestational weeks, occupation, smoking status, spouse’s smoking status, household income, or living arrangement (all P > 0.05). However, education level differed significantly between groups (P = 0.018), with a higher proportion of women having a university degree or above and a lower proportion having a technical school education or below in the severe NVP group, suggesting that education level may be associated with NVP severity(Table 1).
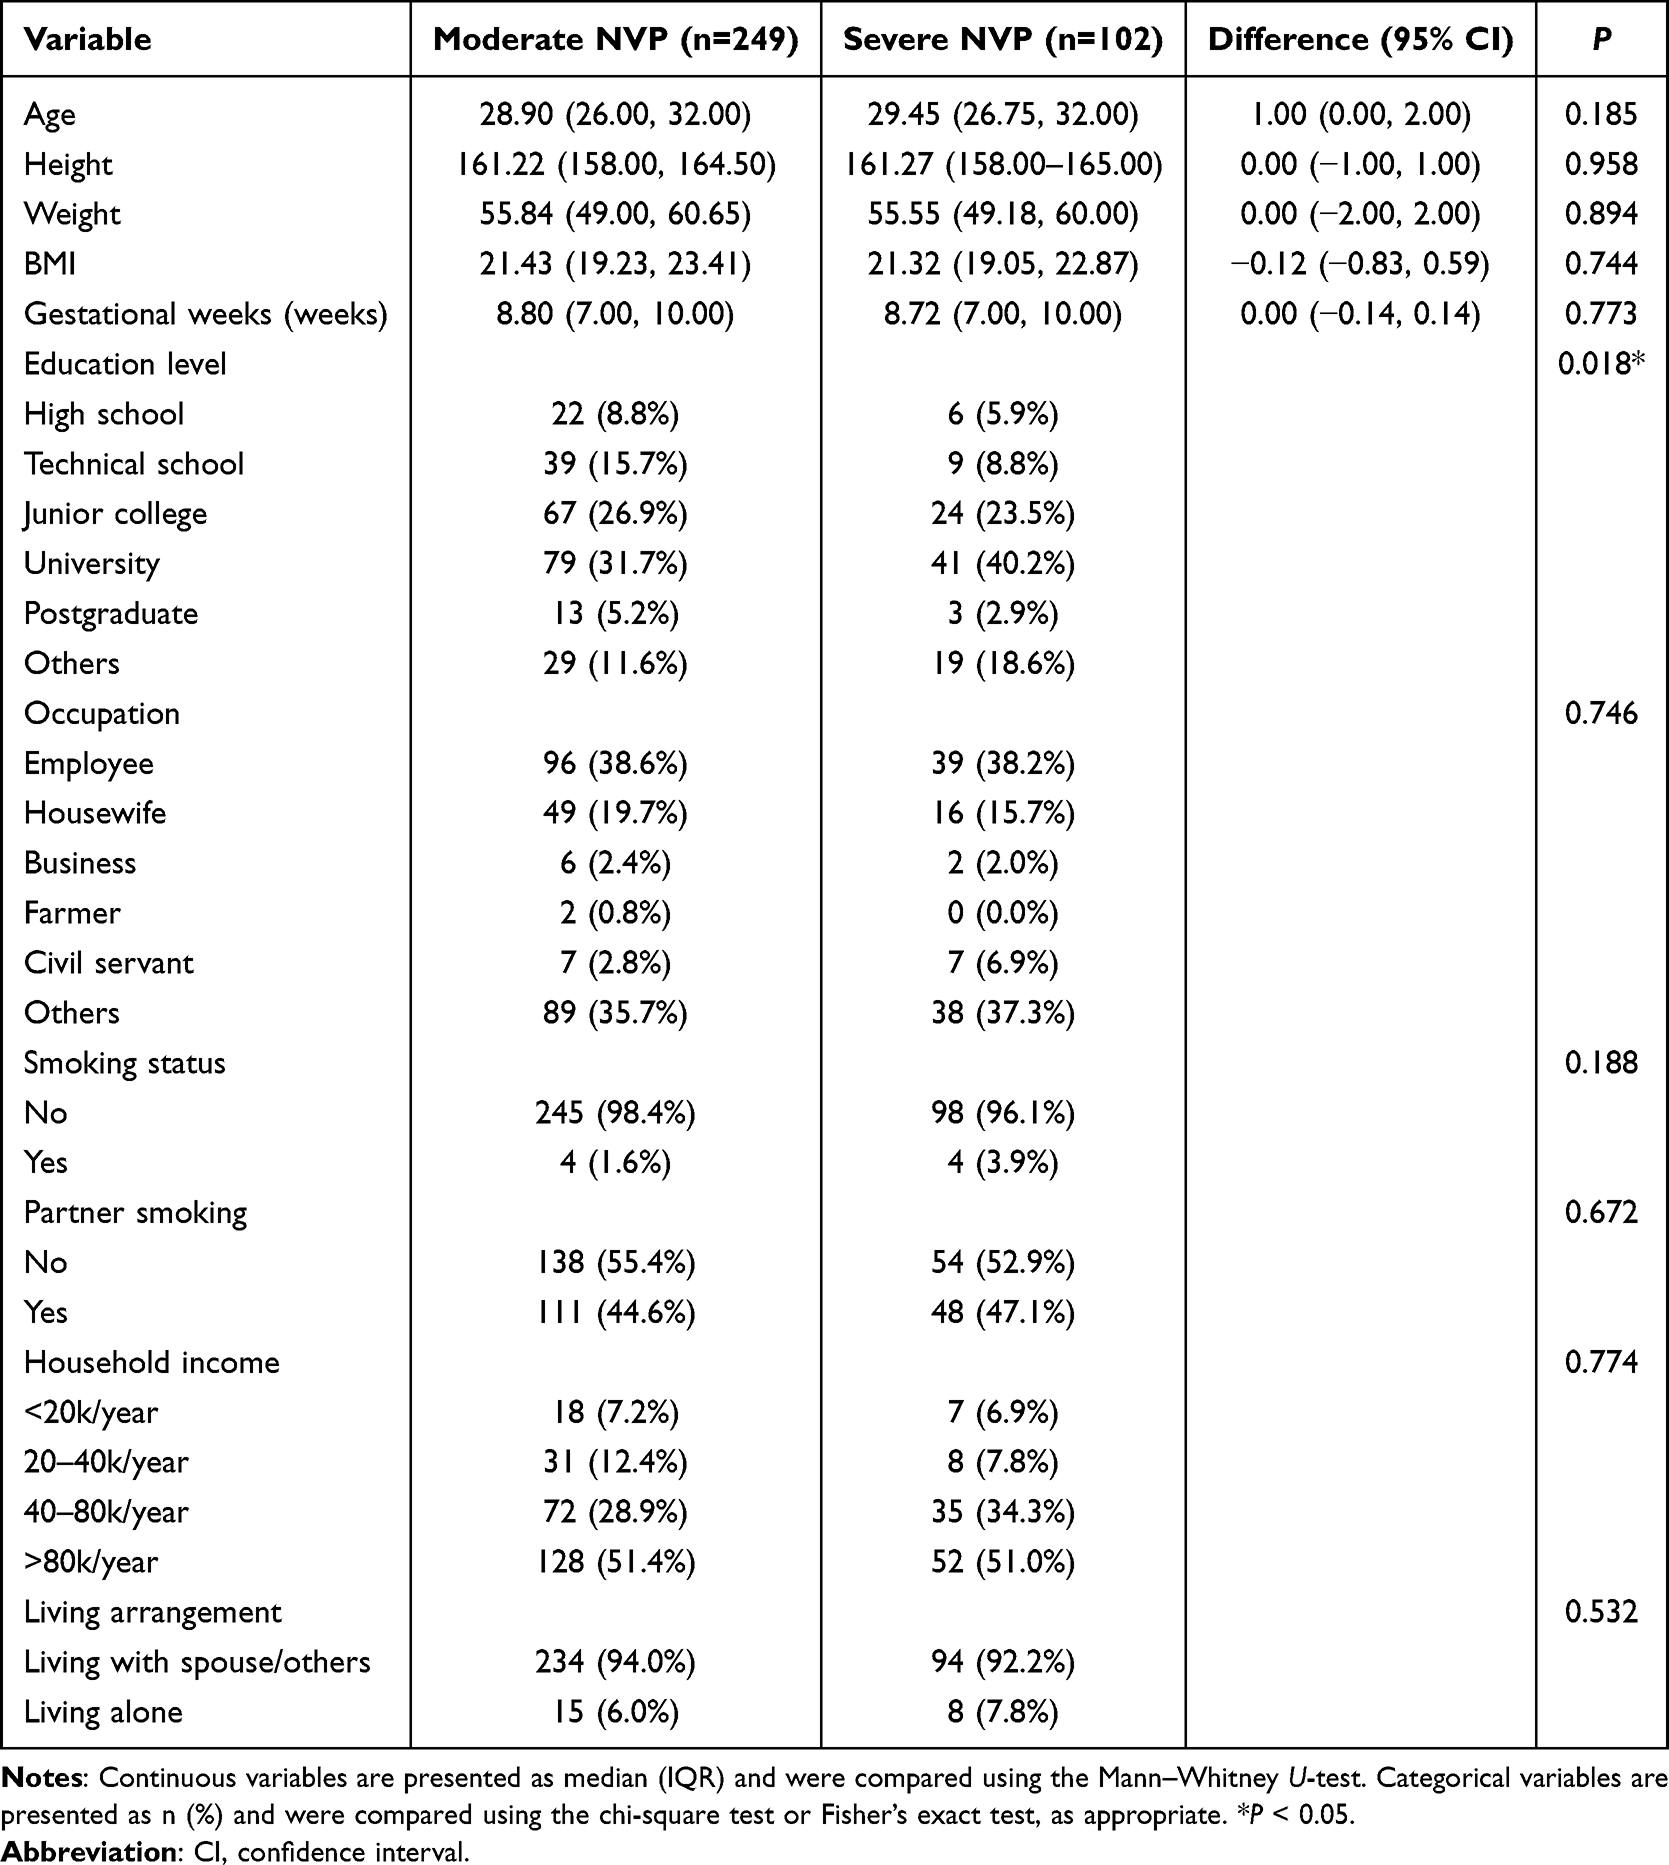 |
Table 1 Baseline Characteristics of Patients with Moderate and Severe NVP |
Selection of Variables Associated with Severe NVP Risk Identification Based on LASSO Regression
LASSO regression analysis identified two candidate penalty parameters (λ.min and λ.1se) through 10-fold cross-validation. Based on the LASSO model corresponding to λ.min, a total of nine variables (Ca, K, Fe, Cl, Zn, Urea, SDS, SAS, and PL) were retained (Table 2). In contrast, the λ.1se model retained only six variables (Ca, K, Fe, Cl, SDS, and SAS). Comparison of the discriminatory performance showed that the λ.min model achieved an AUC of 0.717 (95% CI: 0.711–0.727), which was slightly higher than that of the λ.1se model (AUC = 0.701, 95% CI: 0.691–0.714); however, the difference was not statistically significant (DeLong test, P = 0.244) (Supplementary Tables 2 and 3). Internal validation was further performed using bootstrap resampling. After optimism bias correction, the AUCs of the λ.min and λ.1se models were 0.648 and 0.651, respectively, indicating that both candidate models maintained acceptable discriminatory performance. Considering the overall discriminatory performance, the number of retained variables, and the clinical relevance to the objectives of the present study, the variables selected by the λ.min model were ultimately chosen for subsequent model development.
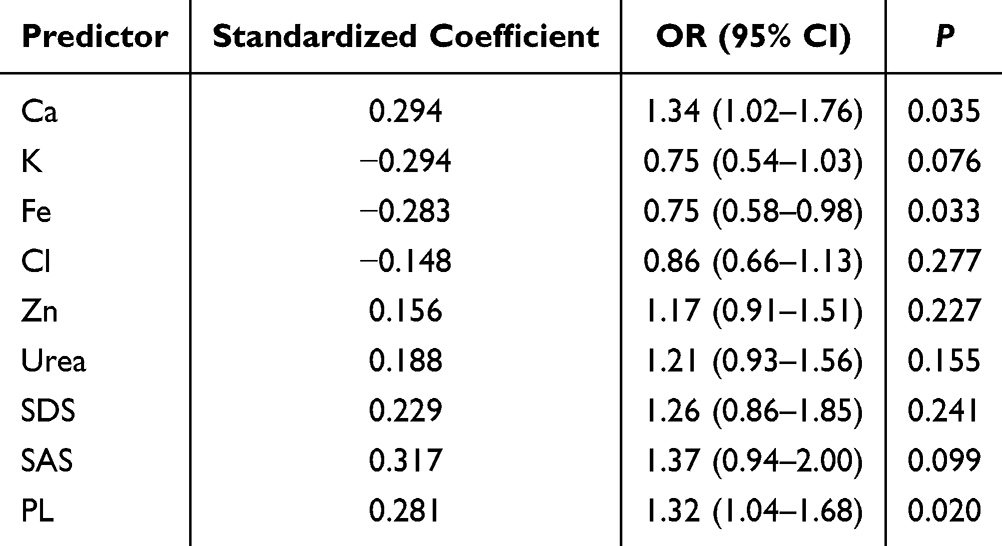 |
Table 2 Pooled Multivariable Logistic Regression Results for Variables Selected by LASSO |
Two candidate penalty parameters were identified according to the minimum criteria and the one-standard-error (1-SE) rule, namely λ.min = 0.037 and λ.1se = 0.091 (Figure 1A). The coefficient shrinkage paths of the candidate variables across different values of log(λ) are illustrated (Figure 1B). As the penalty parameter increased, the coefficients of some variables gradually shrank toward zero, whereas only those variables with greater contributions to the model were retained.
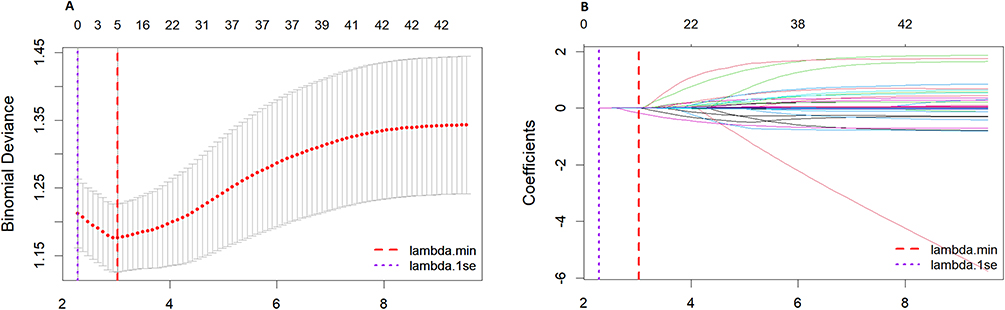 |
Figure 1 Results of LASSO regression for feature selection. Notes: (A) Cross-validation curve of LASSO regression; (B) Coefficient path plot of LASSO regression. |
Model Construction and Performance Comparison
Based on the variables selected by LASSO regression, Model 1 and Model 2 were constructed, and their performances were compared. Model 1, developed using electrolyte-related indicators, achieved an AUC of 0.655 (95% CI: 0.592–0.718) and a Brier score of 0.192. DCA demonstrated that the model provided a net benefit across threshold probabilities ranging from 0.10 to 0.40. In contrast, Model 2 integrated multidimensional variables, including electrolytes, urea, psychological assessment scores, and vitamins, and achieved an AUC of 0.717 (95% CI: 0.657–0.778), representing an increase of 0.062 compared with Model 1 (ΔAUC = 0.062). Meanwhile, the Brier score decreased to 0.178 (ΔBrier = −0.014). Further comparison of the ROC curves using the DeLong test demonstrated that the discriminatory performance of Model 2 was significantly superior to that of Model 1 (Z = −2.361, P = 0.019).
Regarding calibration performance, the Hosmer–Lemeshow test showed no significant lack of fit for either model (Model 1: P = 0.641; Model 2: P = 0.609), indicating good agreement between the model-estimated probabilities and the observed outcomes. Both models had a calibration intercept of 0.00 and a calibration slope of 1.00, further indicating good agreement between the model-estimated probabilities and the observed outcomes, with satisfactory overall model fit (Table 3 and Figure 2). In addition, to further illustrate the results of the multivariable logistic regression analysis, the odds ratios (ORs) and corresponding 95% confidence intervals for each variable are presented as a forest plot (Supplementary Figure S1).
 |
Table 3 Performance of the Risk Identification Models |
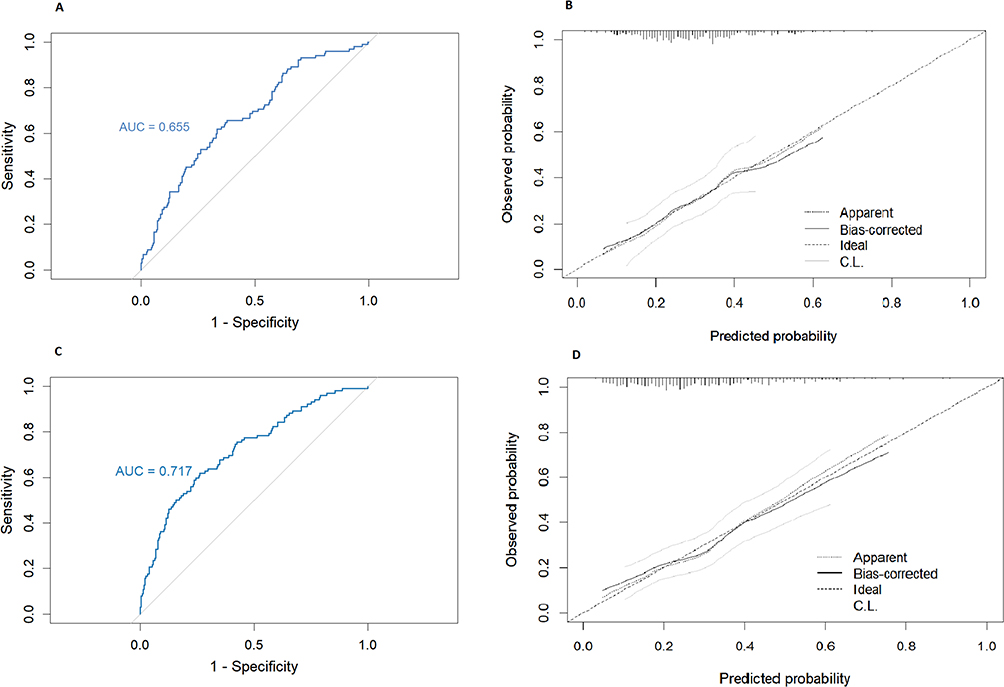 |
Figure 2 ROC Curves and Calibration Curves of the Two Risk Identification Models. Notes: (A) Model 1 ROC curve; (B) Model 1 calibration plot; (C) Model 2 ROC curve; (D) Model 2 calibration plot. |
Validation of the Risk Identification Models
To further evaluate the stability and internal validation performance of the models, internal validation was performed using bootstrap resampling. After bootstrap resampling and optimism bias correction, the models maintained acceptable discriminatory performance, indicating satisfactory internal stability. A nomogram based on the multivariable regression model was subsequently developed to identify the individualized risk of severe NVP (Figure 3). Each variable corresponds to a specific point scale, and the probability of severe NVP can be visually estimated by summing the points assigned to each variable and projecting the total score onto the bottom probability scale. The clinical applicability of the two models was further evaluated using DCA (Figure 4). The results showed that, compared with Model 1, Model 2 provided a greater net benefit across threshold probabilities ranging from 0.10 to 0.40, suggesting that the risk identification model integrating multidimensional variables offers superior net benefit within this threshold range and may serve as a useful reference for the risk identification of severe NVP.
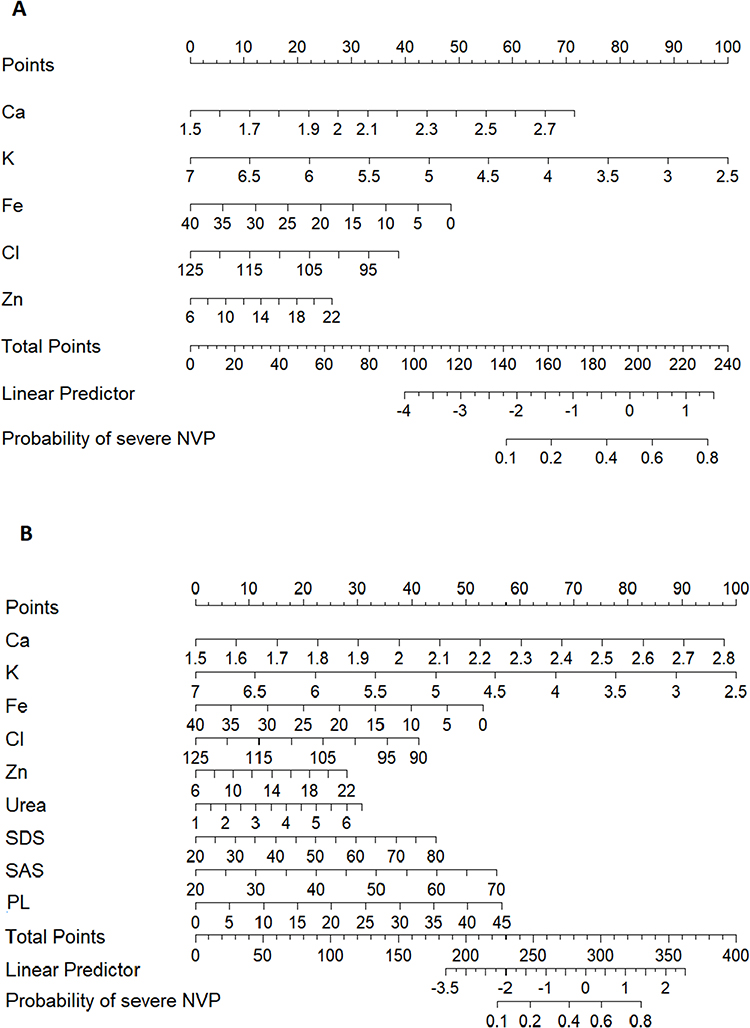 |
Figure 3 Nomogram of the Severe NVP Risk Identification Model. Notes: (A) Nomogram of Model 1; (B) Nomogram of Model 2. |
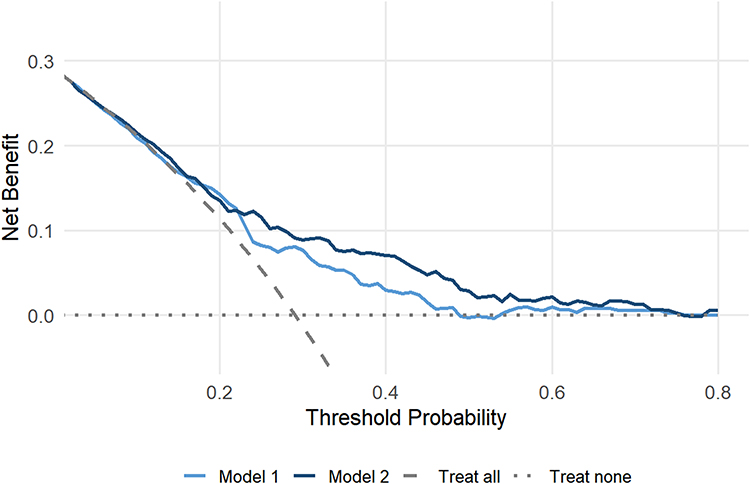 |
Figure 4 DCA of the Risk Identification Models. |
Discussion
Based on clinical data from 351 women with moderate-to-severe NVP, this study identified nine variables associated with NVP severity, including Ca, K, Fe, Cl, Zn, Urea, SDS, SAS, and PL. Using these nine variables, we constructed Model 1, which was centered on electrolyte-related indicators, and Model 2, which integrated electrolytes, nutritional indicators, and psychological factors. A nomogram was subsequently developed and validated. Both models demonstrated moderate discriminatory ability and acceptable calibration, suggesting that electrolyte disturbances and related clinical indicators are statistically associated with severe NVP and may serve as important components of a risk identification model. These findings may provide a reference for clinical risk stratification; however, the clinical utility of the proposed models requires further external validation.
Baseline Demographic Characteristics
In baseline comparisons (Table 1), most demographic and socioeconomic variables—including age, height, weight, BMI, gestational weeks, occupation, smoking status, spouse smoking status, household income, and living arrangements—showed no significant differences between the moderate and severe NVP groups. This suggests that these standard demographic features do not substantially influence NVP severity. However, a significant difference was observed in educational attainment, with a higher proportion of women holding university-level or above degrees in the severe NVP group. Previous studies23 similarly noted that women with higher education levels reported greater prevalence of NVP (72.1% vs 66.8%) and higher rates of medication use, which may reflect socioeconomic status and healthcare accessibility rather than purely biological mechanisms. This underscores the importance of addressing the differentiated needs of women from varied educational backgrounds in antenatal care.
Mechanistic Interpretation of Variables Selected by LASSO Regression
It is well known that as NVP progresses, patients often develop hyponatremia, hypokalemia, hypochloremia, hypomagnesemia, and low serum urea, sometimes accompanied by metabolic hypochloremic alkalosis. Importantly, the relationship between electrolyte disturbances and NVP severity may be bidirectional rather than unidirectional. Therefore, in the present study, all laboratory parameters were uniformly collected on the day of enrollment before the initiation of study treatment and were analyzed together with the PUQE scores obtained at the same time point, thereby minimizing the potential influence of disease progression and subsequent treatment on laboratory measurements. Accordingly, the findings of this study reflect the statistical associations between electrolyte levels and baseline NVP severity measured simultaneously. However, because all variables were assessed at the same baseline time point, it was not possible to determine whether electrolyte abnormalities preceded the development of severe NVP or resulted from the physiological changes accompanying severe NVP. Therefore, no causal relationship between these variables can be inferred.
Using LASSO regression, we identified nine variables associated with severe NVP and incorporated them into the final Model 2 (Table 2 and Figure 1). Serum Ca emerged as a significant risk factor (OR = 1.34). Previous research has shown that hypercalcemia often presents with nonspecific symptoms overlapping with pregnancy discomforts, including fatigue, nausea, and vomiting.24 Rey et al similarly reported that elevated calcium levels may trigger or aggravate gastrointestinal symptoms in pregnant women,25 potentially through Ca2⁺-mediated smooth muscle contraction, which is fundamentally driven by intracellular calcium signaling.26 However, the association between serum Ca and severe NVP observed in the present study is only statistical, and its underlying mechanism remains unclear. Patients with severe vomiting frequently experience dehydration, hemoconcentration, disturbances in acid–base balance, and alterations in nutritional status, all of which may influence calcium homeostasis. Consequently, the observed changes in serum Ca may reflect disease-related physiological alterations and may also be associated with symptom severity. Because all measurements were obtained at the same baseline time point, the temporal sequence and causal relationship between Ca changes and severe NVP could not be established. Further, longitudinal and mechanistic studies are needed to clarify their biological significance. In the multivariable model, higher serum K levels were associated with a lower risk of severe NVP (OR = 0.75). Reduced potassium levels may suppress Na⁺–K⁺ pump activity in gastrointestinal smooth muscle, thereby weakening smooth muscle contractility and gastrointestinal motility, delaying gastric emptying, and consequently inducing or aggravating nausea and vomiting.27–29 However, the present study identified only a statistical association and cannot demonstrate that hypokalemia precedes disease onset. Higher serum Fe levels were also negatively associated with severe NVP (OR = 0.75), and this relationship may be related to the synthesis of 5-HT. Antagonists of the 5-HT3 receptor are currently among the most effective pharmacological treatments for vomiting.30 Iron serves as an essential cofactor for aromatic amino acid hydroxylases, including tryptophan hydroxylase, which catalyzes the conversion of tryptophan to 5-hydroxytryptophan, the rate-limiting step in 5-HT synthesis. Therefore, iron deficiency may reduce the activity of this enzyme, resulting in impaired central 5-HT synthesis and, subsequently, affecting emotional regulation, sleep–wake function, and even the activity of the vomiting center.31,32 Accordingly, the present findings primarily support an association between iron metabolism and NVP severity rather than demonstrating a direct pathogenic role. Serum Cl was also retained in the model (OR = 0.86) and exhibited a modest protective effect. Chloride plays a central role in maintaining gastric acid secretion, nutrient absorption, and gastrointestinal fluid balance. Animal studies have shown that abnormal Cl levels may impair gastric–pyloric motility, thereby inducing nausea and vomiting.33 Serum Zn also demonstrated a modest risk effect in the model (OR = 1.17). Current evidence suggests that zinc homeostasis may influence gastrointestinal function and symptom perception by maintaining intestinal mucosal barrier integrity and suppressing oxidative stress and inflammatory responses.34,35 Nevertheless, there is currently insufficient evidence from human studies to establish a causal relationship between zinc status and NVP severity; the present findings should therefore be interpreted as a statistical association.
Urea was also positively associated with NVP severity (OR = 1.21). Within the statistical model, elevated urea levels may be positively associated with severe NVP; however, this finding is more likely to represent a concomitant marker rather than a driving factor. Elevated urea may primarily reflect the dehydration that frequently accompanies severe NVP, resulting in a relative prerenal increase in blood urea nitrogen, while dehydration itself may further aggravate disease severity. However, from both a pathogenic perspective and in routine clinical practice, severe and persistent NVP more commonly leads to protein–energy malnutrition, thereby resulting in reduced or relatively low blood urea nitrogen levels.36 Both SAS and SDS were statistically associated with severe NVP in the present study, with ORs of 1.37 and 1.26, respectively, suggesting that higher anxiety and depression scores may reflect a greater symptom burden. These findings are generally consistent with previous studies showing that NVP is frequently accompanied by impaired quality of life and increased levels of anxiety and depressive symptoms.37,38 Some studies have suggested that changes in psychological status may be related to activation of the hypothalamic–pituitary–adrenal axis,39 and temporal associations between anxiety scores and nausea severity have also been reported.40 However, because both psychological assessment scores and NVP severity were obtained during the same baseline assessment, the present study cannot determine whether psychological changes preceded symptom onset or whether persistent nausea and vomiting resulted in elevated anxiety and depression scores. Therefore, these variables should currently be interpreted as indicators associated with severe NVP rather than as pathogenic factors or risk markers with a defined temporal sequence. Their temporal relationship and causal associations require further clarification through longitudinal studies. The recently proposed “brain–gut–psychological axis” framework provides a conceptual basis for understanding the interplay between psychological status and gastrointestinal symptoms.41 However, its specific role in NVP remains to be further elucidated. Dekkers et al further suggested in a “psychobiological integrated model” that elevated human chorionic gonadotropin levels and depressive states may synergistically aggravate NVP symptoms, underscoring the need for integrated management of physiological and psychological factors.42 Elevated PL levels were associated with severe NVP (OR = 1.32). PL is one of the circulating forms of vitamin B6 and plays a key role in amino acid metabolism and neurotransmitter synthesis. Increased PL levels may reflect a compensatory physiological response to persistent nausea and vomiting. In clinical practice, vitamin B6 is widely recommended as a first-line pharmacological treatment for NVP.43 The present findings suggest that changes in endogenous PL levels may be associated with symptom severity and may reflect alterations in the metabolic status related to NVP. However, these results do not support using endogenous PL levels as an indicator of therapeutic response to exogenous vitamin B6 administration, and their clinical significance warrants further investigation.
Model Performance Validation and Clinical Visualization
In the comparison of the two models (Table 3 and Figure 2), Model 1, which was based primarily on electrolyte-related indicators, demonstrated only moderate discriminatory ability (AUC = 0.655), suggesting that although electrolyte disturbances may play an important role in the pathophysiology of NVP, a single biochemical dimension is insufficient to capture the complexity of the disease fully. In contrast, Model 2, which integrated psychological assessment scores and metabolic indicators, showed superior risk identification performance compared with Model 1, with the AUC increasing from 0.655 to 0.717 and the Brier score decreasing from 0.192 to 0.178. These findings suggest that integrating multidimensional variables provides a statistical advantage. However, an AUC of approximately 0.717 still indicates only moderate discriminatory performance, suggesting that although the model has some capacity for risk stratification, its overall discrimination performance remains insufficient to support its use as an independent clinical decision-making tool. Therefore, further optimization and validation are warranted. In addition, the calibration curves of both models showed good agreement between the models’ estimated probabilities and the observed outcomes, with calibration intercepts of 0 and slopes of 1, indicating no apparent systematic bias. These findings suggest that the models provide acceptable probability estimation and overall goodness of fit; however, their stability and generalizability should be further evaluated in different populations. The nomogram provides a visual representation of the cumulative contributions of the selected variables to the identification of severe NVP risk and offers an intuitive approach to individualized risk assessment. Clinicians may assign points based on patient-specific characteristics and calculate a cumulative score to estimate the individualized probability of severe NVP, thereby facilitating risk stratification. Further evaluation of clinical applicability using DCA demonstrated that Model 2 provided a slightly greater overall net benefit than Model 1 across threshold probabilities ranging from 0.10 to 0.40. Although the magnitude of this difference was limited, it nevertheless suggests that the multidimensional integrated model may offer a statistical advantage within this specific risk interval. However, it should be emphasized that the DCA results indicate only potential clinical value from a statistical perspective and should not be interpreted as evidence that the model is ready for routine clinical implementation. Although the comprehensive model demonstrated moderate discriminatory performance (AUC = 0.717) and acceptable calibration, only internal validation was performed in the present study, and validation in an independent external population is still lacking. Consequently, its generalizability and clinical applicability remain to be established. Therefore, before independent external validation is available, the model should not be used directly for routine clinical decision-making but rather be regarded as a risk identification tool with potential clinical utility that requires further external validation and refinement.
In clinical practice, electrolyte disturbances are generally considered secondary changes resulting from persistent vomiting rather than the primary pathogenic factor. However, relevant studies indicate that electrolyte abnormalities may either contribute to symptom exacerbation or represent a physiological response following recurrent vomiting and dehydration. Future longitudinal studies are needed to evaluate dynamic changes in electrolyte levels during treatment and during symptom resolution, to clarify their potential role in disease progression. Moreover, previous studies have suggested that severe NVP or HG is associated with maternal nutritional decline and certain adverse pregnancy outcomes.44 In clinical management, patients with moderate to severe symptoms often receive vitamin B6, doxylamine, or other antiemetic therapies, although treatment responses vary among individuals.45 Therefore, before establishing causal relationships, early risk stratification and comprehensive assessment of high-risk individuals may help optimize clinical management strategies and inform subsequent therapeutic decision-making.
Strengths and Limitations
This study has several strengths and novel aspects. First, it was based on real-world clinical data from a large multicenter cohort, ensuring the representativeness and reliability of the findings. Second, LASSO regression was employed to develop the model, reducing the subjectivity associated with traditional variable selection methods and improving model robustness. More importantly, electrolyte indicators, nutritional and metabolic indicators, and psychological assessment scores were incorporated into a single analytical framework. Based on these variables, we developed both an electrolyte-based risk identification model and a multidimensional model that integrates multiple domains. Compared with the model containing only electrolyte-related indicators, the multidimensional model demonstrated superior discriminative ability and overall fit, suggesting that a comprehensive assessment across multiple dimensions may offer advantages for the risk stratification of severe NVP. In addition, the model was comprehensively evaluated using ROC curves, calibration curves, a nomogram, and DCA, thereby assessing its discriminatory performance, calibration, and potential clinical utility, and providing a reference for the further optimization of future risk identification models.
Nevertheless, several limitations should be acknowledged. First, this study was an exploratory secondary analysis based on data from a randomized controlled trial and should therefore be regarded as an observational modeling study. Although all variables included in the model were obtained from baseline assessments before the initiation of the study intervention, thereby avoiding the influence of treatment on the analytical results, the original trial was not specifically designed to develop a risk identification model. Consequently, unmeasured factors and limitations inherent to the original study design may still exist. The present findings primarily reflect statistical associations between the selected variables and severe NVP and should not be interpreted as evidence of causality. Second, because all candidate variables and PUQE scores were collected simultaneously on the day of enrollment (baseline, Day 0), the model developed in this study more accurately reflects baseline risk stratification rather than representing true longitudinal prediction. Therefore, the temporal sequence between electrolyte abnormalities, psychological status, other related indicators, and severe NVP cannot be determined, nor can the possibility that severe NVP itself may have contributed to changes in these indicators be excluded. Third, only bootstrap internal validation and optimism bias correction were performed in this study, and the model has not yet been validated in an independent external population. Consequently, its generalizability across different regions, healthcare settings, and populations remains to be established. Before independent external validation is available, the model should not be applied directly to routine clinical decision-making; instead, it should be regarded as a risk identification tool with potential clinical utility that requires further validation and refinement. Finally, although multiple imputation was used to address missing data and reduce potential bias arising from missing values, and multiple clinical and laboratory indicators were included in the analysis, the influence of unmeasured factors and residual confounding cannot be completely excluded. In addition, the original study did not systematically collect information on dietary intake; therefore, dietary variables could not be incorporated into the present analysis. Considering that nutritional status and dietary patterns may influence the occurrence and severity of NVP, further validation of the present findings in prospective studies and independent external cohorts is warranted.
Conclusion
Based on baseline data from a randomized controlled trial, the present study identified statistical associations between severe NVP and multiple factors, including electrolytes, nutritional and metabolic indicators, and psychological assessment scores. On this basis, we developed an electrolyte-based risk identification model and a multidimensional risk identification model integrating multiple indicators. The comprehensive model demonstrated moderate discriminative ability and acceptable calibration, suggesting that integrating multidimensional indicators may be valuable for risk stratification of severe NVP. However, because this study was a secondary analysis based on data collected at a single baseline time point, the findings primarily reflect statistical associations between the selected variables and severe NVP, as well as baseline risk stratification. They cannot be used to infer temporal sequence or causality. Moreover, only internal validation was performed, and independent external validation is still lacking. Therefore, before further prospective studies and external validation are completed, the proposed model should not be applied directly to routine clinical practice; instead, it should be considered a risk identification tool with potential clinical utility that requires additional validation and refinement.
AI Statement
The author(s) declared that Generative AI was used in the creation of this manuscript. Generative artificial intelligence (ChatGPT) was used to assist in improving the clarity, grammar, and flow of the manuscript text and in refining the English translation of some sections. All intellectual content, data interpretation, and conclusions were conceived, verified, and approved by the authors, who take full responsibility for the final version of the manuscript.
Ethics Approval
The study was conducted in accordance with the Declaration of Helsinki (2013) for medical research involving human subjects. Ethical approval was obtained from the Institutional Review Board of the First Affiliated Hospital, Heilongjiang University of Chinese Medicine (HZYLLKY201902301), and all ethics committees of the 13 recruitment sites. Written informed consent was obtained from all participants prior to data collection.
Consent to Participate
Informed consent was obtained from all individual participants included in the study.
Consent to Publish
All authors have reviewed the final version of the manuscript and consent to its publication in the journal. The authors affirm that the work is original, has not been published previously, and is not under consideration for publication elsewhere.
Author Contributions
All authors made a significant contribution to the work reported, whether that is in the conception, study design, execution, acquisition of data, analysis and interpretation, or in all these areas; took part in drafting, revising or critically reviewing the article; gave final approval of the version to be published; have agreed on the journal to which the article has been submitted; and agree to be accountable for all aspects of the work.
Funding
This work is supported by (1) The National key R&D Program of China (2019YFC1709500); (2) The National Collaboration Project of Critical Illness by Integrating Chinese Medicine and Western Medicine; (3) Project of Heilongjiang Province Innovation Team “TouYan” (LH2019H046); (4) Heilongjiang Provincial Clinical Research Centre for Ovary Diseases (LC2020R009); (5) Traditional Chinese Medicine Research Project of Heilongjiang Administration of Traditional Chinese Medicine (ZHY2022-124); (6) The project of Evidence-based capacity in Traditional Chinese Medicine (TCM Sci-Tech Internal Letter [2023] No. 24).
Disclosure
The authors have no relevant financial or non-financial interests to disclose for this work.
References
1. Rosenfeld CS. Placental serotonin signaling, pregnancy outcomes, and regulation of fetal brain development. Biolo reprod. 2020;102(3):532–16. doi:10.1093/biolre/ioz204
2. Liu C, Zhao G, Qiao D, et al. Emerging progress in nausea and vomiting of pregnancy and hyperemesis gravidarum: challenges and opportunities. Front Med. 2022;8:809270. doi:10.3389/fmed.2021.809270
3. Lowe SA, Steinweg KE. Management of hyperemesis gravidarum and nausea and vomiting in pregnancy. Emerg Med Australasia. 2022;34(1):9–15. doi:10.1111/1742-6723.13909
4. Koot M. Hyperemesis Gravidarum: Definition, Treatment, Prognosis and Offspring Outcome. Universiteit van Amsterdam; 2019.
5. Fejzo MS, Trovik J, Grooten IJ, et al. Nausea and vomiting of pregnancy and hyperemesis gravidarum. Nat Rev Dis Prim. 2019;5(1):62. doi:10.1038/s41572-019-0110-3
6. Jansen L, Koot M, Van’t Hooft J, et al. The windsor definition for hyperemesis gravidarum: a multistakeholder international consensus definition. Eur J Obstetrics Gynecol Reprod Biol. 2021;266:15–22. doi:10.1016/j.ejogrb.2021.09.004
7. Kim M, Heo G, Kim S-Y. Neural signalling of gut mechanosensation in ingestive and digestive processes. Nat Rev Neurosci. 2022;23(3):135–156. doi:10.1038/s41583-021-00544-7
8. Jansen LA, Shaw V, Grooten IJ, Koot MH, Dean CR, Painter RC. Diagnosis and Treatment of Hyperemesis Gravidarum. Cmaj. 2024;196(14):E477–E4485. doi:10.1503/cmaj.221502
9. Yang H, Hou C, Xiao W, Qiu Y. The role of mechanosensitive ion channels in the gastrointestinal tract. Front Physiol. 2022;13. doi:10.3389/fphys.2022.904203
10. Mercado-Perez A, Beyder A. Gut feelings: mechanosensing in the gastrointestinal tract. Nat Rev Gastroenterol Hepatol. 2022;19(5):283–296. doi:10.1038/s41575-021-00561-y
11. Negussie AB, Dell AC, Davis BA, Geibel JP. Colonic fluid and electrolyte transport 2022: an update. Cells. 2022;11(10):1712. doi:10.3390/cells11101712
12. Charlebois E, Pantopoulos K. Nutritional aspects of iron in health and disease. Nutrients. 2023;15(11):2441. doi:10.3390/nu15112441
13. Worede A, Deress T, Wondifraw H, Fetene G, Berie A. Electrolyte imbalance and liver function test abnormalities among pregnant women with hyperemesis gravidarum at Wag-Himra Zone Public Hospitals, Northeast Ethiopia, 2023: a comparative cross-sectional study. Front Med. 2024;11:1451036. doi:10.3389/fmed.2024.1451036
14. Fiaschi L, Nelson-Piercy C, Deb S, King R, Tata L. Clinical management of nausea and vomiting in pregnancy and hyperemesis gravidarum across primary and secondary care: a population-based study. BJOG. 2019;126(10):1201–1211. doi:10.1111/1471-0528.15662
15. Dunbar K, Yadlapati R, Konda V. Heartburn, nausea, and vomiting during pregnancy. Off J Am College Gastroenterol. 2022;117(10S):10–15. doi:10.14309/ajg.0000000000001958
16. Ioannidou P, Papanikolaou D, Mikos T, Mastorakos G, Goulis DG. Predictive factors of hyperemesis gravidarum: a systematic review. Eur J Obstetrics Gynecol Reprod Biol. 2019;238:178–187. doi:10.1016/j.ejogrb.2019.04.043
17. Morris ZH, Azab AN, Harlev S, Plakht Y. Developing and validating a prognostic index predicting re-hospitalization of patients with hyperemesis gravidarum. Eur J Obstetrics Gynecol Reprod Biol. 2018;225:113–117. doi:10.1016/j.ejogrb.2018.04.028
18. Mohammed J, Yakubu A, Garba J. Comparison of discriminant analysis and logistic re-gression in modelling health status of hyperemesis gravidarum patient. Int J Clin Biostat Biom. 2025;11:057. doi:10.23937/2469-5831/1510057
19. Fiaschi L, Nelson-Piercy C, Tata LJ. Hospital admission for hyperemesis gravidarum: a nationwide study of occurrence, reoccurrence and risk factors among 8.2 million pregnancies. Hum Reprod. 2016;31(8):1675–1684. doi:10.1093/humrep/dew128
20. Wu XK, Gao JS, Ma HL, et al. Acupuncture and doxylamine–pyridoxine for nausea and vomiting in pregnancy: a randomized, controlled, 2× 2 factorial trial. Ann Internal Med. 2023;176(7):922–933. doi:10.7326/M22-2974
21. Lowe SA, Armstrong G, Beech A, et al. Somanz position paper on the management of nausea and vomiting in pregnancy and hyperemesis gravidarum. Aust N Z J Obstetrics Gynaecol. 2020;60(1):34–43. doi:10.1111/ajo.13084
22. Nana M, Painter R, Williamson C, Nelson-Piercy C. Hyperemesis Gravidarum. Lancet. 2026;407(10523):78–89. doi:10.1016/S0140-6736(25)01454-0
23. Schrager NL, Adrien N, Werler MM, et al. Trends in first-trimester nausea and vomiting of pregnancy and use of select treatments: findings from the national birth defects prevention study. Paediatric Perinatal Epidemiol. 2021;35(1):57–64. doi:10.1111/ppe.12705
24. Tonon CR, Silva TAAL, Pereira FWL, et al. A review of current clinical concepts in the pathophysiology, etiology, diagnosis, and management of hypercalcemia. Med Sci Monit. 2022;28:e935821. doi:10.12659/MSM.935821
25. Ahmed A. Fetomaternal acid–base balance and electrolytes during pregnancy. Ind J Crit Care Med. 2021;25(Suppl 3):S193. doi:10.5005/jp-journals-10071-24030
26. Rey E, Jacob CE, Koolian M, Morin F. Hypercalcemia in pregnancy–a multifaceted challenge: case reports and literature review. Clin Case Rep. 2016;4(10):1001. doi:10.1002/ccr3.646
27. Abdel-Aziz EZ, Elfeky HAA, AboSeda A. Electrolytes imbalance among patients with oncologic emergencies at a university hospital. Int Acad J Health Med Nurs. 2019;1(2):58–83.
28. Kardalas E, Paschou SA, Anagnostis P, Muscogiuri G, Siasos G, Vryonidou A. Hypokalemia: a Clinical Update. Endocr Connections. 2018;7(4):R135–R46. doi:10.1530/EC-18-0109
29. Palmer BF, Clegg DJ. Physiology and pathophysiology of potassium homeostasis. Adv Physiol Educ. 2016;40(4):480–490. doi:10.1152/advan.00121.2016
30. Cengiz H, Dagdeviren H, Caypinar SS, Kanawati A, Yildiz S, Ekin M. Plasma serotonin levels are elevated in pregnant women with hyperemesis gravidarum. Arch Gynecol Obstetrics. 2015;291(6):1271–1276. doi:10.1007/s00404-014-3572-2
31. Zuo L-J, Yu S-Y, Hu Y, et al. Serotonergic dysfunctions and abnormal iron metabolism: relevant to mental fatigue of Parkinson Disease. Sci Rep. 2016;6(1):19. doi:10.1038/s41598-016-0018-z
32. Berthou C, Iliou JP, Barba D. Iron, neuro-bioavailability and depression. EJHaem. 2022;3(1):263–275. doi:10.1002/jha2.321
33. Pfortmueller CA, Uehlinger D, von Haehling S, Schefold JC. Serum chloride levels in critical illness—the hidden story. Int Care Med Exp. 2018;6(1):10. doi:10.1186/s40635-018-0174-5
34. Prasad AS, Bao B. Molecular mechanisms of zinc as a pro-antioxidant mediator: clinical therapeutic implications. Antioxidants. 2019;8(6):164. doi:10.3390/antiox8060164
35. Wan Y, Zhang B. The impact of zinc and zinc homeostasis on the intestinal mucosal barrier and intestinal diseases. Biomolecules. 2022;12(7):900. doi:10.3390/biom12070900
36. Erick M, Cox JT, Mogensen KM. Acog practice bulletin 189: nausea and vomiting of pregnancy. Obstetrics Gynecol. 2018;131(5):935. doi:10.1097/AOG.0000000000002604
37. Fiurašková K, Havlíček J, Roberts SC. Dietary and psychosocial correlates of nausea and vomiting in pregnancy. Food Quality and Preference. 2021;93:104266. doi:10.1016/j.foodqual.2021.104266
38. Mitchell-Jones N, Lawson K, Bobdiwala S, et al. Association between hyperemesis gravidarum and psychological symptoms, psychosocial outcomes and infant bonding: a two-point prospective case–control multicentre survey study in an inner city setting. BMJ Open. 2020;10(10):E039715. doi:10.1136/bmjopen-2020-039715
39. Kasap E, Aksu EE, Gur EB, et al. Investigation of the relationship between salivary cortisol, dehydroepiandrosterone sulfate, anxiety, and depression in patients with hyperemesis gravidarum. J Matern Fetal Neonatal Med. 2016;29(22):3686–3689. doi:10.3109/14767058.2016.1140741
40. Tan A, Lowe S, Henry A. Nausea and vomiting of pregnancy: effects on quality of life and day-to-day function. Aust N Z J Obstetrics Gynaecol. 2018;58(3):278–290. doi:10.1111/ajo.12714
41. González Valdivia C. The gut microbiome and nausea in pregnancy; 2023.
42. Dekkers GW, Broeren MA, Truijens SE, Kop WJ, Pop VJ. Hormonal and psychological factors in nausea and vomiting during pregnancy. Psychol Med. 2020;50(2):229–236. doi:10.1017/S0033291718004105
43. Nelson-Piercy C, Dean C, Shehmar M, et al. The management of nausea and vomiting in pregnancy and hyperemesis gravidarum (Green-Top Guideline No. 69). BJOG. 2024;131(7):e1–e30. doi:10.1111/1471-0528.17739
44. Hsieh Y-L, Chiang C-J, Yu T. Association between nausea and vomiting during pregnancy and adverse pregnancy outcomes: findings from the Numom2b study. Arch Gynecol Obstetrics. 2025;312(5):1695–1704. doi:10.1007/s00404-025-08176-3
45. Gerede A, Stavros S, Moustakli E, et al. Hyperemesis in pregnancy: complications and treatment. Med Sci. 2025;13(3):132. doi:10.3390/medsci13030132
 © 2026 The Author(s). This work is published and licensed by Dove Medical Press Limited. The
full terms of this license are available at https://www.dovepress.com/terms
and incorporate the Creative Commons Attribution
- Non Commercial (unported, 4.0) License.
By accessing the work you hereby accept the Terms. Non-commercial uses of the work are permitted
without any further permission from Dove Medical Press Limited, provided the work is properly
attributed. For permission for commercial use of this work, please see paragraphs 4.2 and 5 of our Terms.
© 2026 The Author(s). This work is published and licensed by Dove Medical Press Limited. The
full terms of this license are available at https://www.dovepress.com/terms
and incorporate the Creative Commons Attribution
- Non Commercial (unported, 4.0) License.
By accessing the work you hereby accept the Terms. Non-commercial uses of the work are permitted
without any further permission from Dove Medical Press Limited, provided the work is properly
attributed. For permission for commercial use of this work, please see paragraphs 4.2 and 5 of our Terms.
Recommended articles
Prediction of Cervical Cancer Progression Leveraging HPV16 Integration-Related Genes
Yang Y, Sun C, Wang H
International Journal of Women's Health 2025, 17:3745-3760
Published Date: 22 October 2025