")
Back to Journals » International Journal of General Medicine » Volume 15
Construction of a Pyroptosis-Related Genes Signature to Improve the Prognostic Prediction and Therapeutic Drugs Selection in Patients with Pancreatic Cancer
Authors Li C, Wang M , Wei J, Zhang W , Liu H , Zhao D
Received 6 April 2022
Accepted for publication 25 July 2022
Published 2 August 2022 Volume 2022:15 Pages 6387—6403
DOI https://doi.org/10.2147/IJGM.S369209
Checked for plagiarism Yes
Review by Single anonymous peer review
Peer reviewer comments 3
Editor who approved publication: Dr Scott Fraser
Changjuan Li,1,2 Min Wang,3 Junwei Wei,2 Wenjuan Zhang,2 Haitao Liu,2 Dongqiang Zhao1
1Department of Gastroenterology, The Second Hospital of Hebei Medical University, Shijiazhuang, Hebei Province, People’s Republic of China; 2Department of Gastroenterology, The First Hospital of Handan City, Handan, Hebei Province, People’s Republic of China; 3Department of Anorectal Surgery, The First Hospital of Handan City, Handan, Hebei Province, People’s Republic of China
Correspondence: Dongqiang Zhao, Department of Gastroenterology, The Second Hospital of Hebei Medical University, No. 215, He ping West Road, Xinhua District, Shijiazhuang, Hebei, People’s Republic of China, Email [email protected]
Background: Effective prognostic assessment and appropriate drug selection are important for the clinical management of pancreatic cancer (PaC). Here, we aimed to establish a pyroptosis-associated genes (PRGs) signature to predict the prognostic outcomes of PaC and guide clinical drug therapy.
Methods: We identified the differentially expressed PRGs between pancreatic adenocarcinoma (n = 178) and control pancreas samples (n = 171) obtained from different databases, and performed Lasso and Cox regression analysis to create a prognosis signature. Kaplan–Meier (K-M) survival curves and time-dependent receiver operating characteristics were further constructed to assess the utility of the risk model. The International Cancer Genome Consortium (ICGC) PACA-AU cohort (n = 95) was used as a validation dataset to examine the validity of this prognostic model. The correlations of risk score (RS) with clinical features, immune cell infiltration, tumor mutation burden and half-maximal inhibitory concentrations (IC50) of chemotherapeutic drugs were analyzed, and the expression levels of PRGs in cell lines were detected.
Results: A prognostic signature was constructed, which consisted of 4 PRGs (AIM2, IL18, GSMDC and PLCG1). K-M analysis demonstrated a remarkable difference in overall survival (OS) time between low-risk (LR) and high-risk (HR) groups (P < 0.001). The RS contributed to the progression of PaC, and could be a significant independent factor for prognostic prediction. The validation of the ICGC cohort confirmed the effectiveness of the proposed signature. The patients with a HR score in the TCGA cohort had higher tumor mutation burden and more sensitivity to paclitaxel, gemcitabine, 5-fluorouracil and cisplatin than those with a LR score. The differential expression levels of signature genes were verified in vitro.
Conclusion: The PRGs signature can be applied for predicting the prognosis of PaC, and may provide useful information for selection of therapeutic drugs.
Keywords: pancreatic cancer, pyroptosis-related genes, TCGA, prognosis, bioinformatics analysis, tumor mutation burden
Introduction
Pancreatic cancer (PaC) is one of the deadliest cancers with insidious onset, rapid progression and poor prognosis. Based on the data reported by the National Cancer Society in 2020,1 PaC is the 4th most common cause of death, and the 5-year survival rate is only 9%. It is estimated to become the second leading cause of cancer‐related death in the United States until 2030.2 More than 80% of PaC patients show a locally advanced or distant metastasis at diagnosis, and lose the chance of radical surgery.3 For resectable PaC, even after surgical resection, the prognosis of those patients is still poor, with a 5-year overall survival (OS) of 10–20%.4 Despite the use of surgery, chemotherapeutic drugs and immunotherapy for PaC, the prognosis of this disease has not improved significantly over recent decades. Therefore, it is crucial to detect PaC earlier, monitor the prognostic outcomes, and select precise and personal treatment for patients with PaC.
Pyroptosis is a form of necrotic cell death, which was first proposed by Cookson et al5 in 2001. The cell death signaling pathways, including caspase-1, −4, −5 and −11,6 are involved in the production of N-terminal and C-terminal by cleaving Gasdermin D (GSDMD). The N-terminal domain of GSDMD binds to phosphoinositides in the cell membrane, and generate many small membrane pores, which causes a disruption of osmotic potential, and eventually leads to membrane rupture, cell swelling, cell content release, and inflammatory responses.7 A growing body of evidence indicates that chemotherapeutic drugs can stimulate pyroptotic cell death via caspase-3 cleavage of gasdermin E (GSDME) to inhibit the malignant progression of several cancers.8–10 Pyroptosis is closely associated with tumorigenesis, metastasis and chemotherapeutic drug treatment, and can serve a new therapeutic target for tumors.11,12 However, the prognostic effect of pyroptosis-related genes (PRGs) on PaC remains largely unclarified.
Herein, bioinformatics analysis was conducted to identify a novel PRGs signature for predicting the prognostic outcomes of PaC according to the Genotype-Tissue Expression project (GTEx) and The Cancer Genome Atlas (TCGA) databases. This signature was further validated by the International Cancer Genome Consortium (ICGC) cohort. Additionally, we assessed the predictive value of the risk score (RS) model, and determined the correlations among RS, tumor immune cell infiltration (ICI), tumor mutation burden (TMB) and chemotherapy sensitivity. This study may provide useful information to predict the prognostic outcomes of PaC and guide the precise treatment.
Materials and Methods
Data Sources
The RNA-seq data of TCGA pancreatic adenocarcinoma (PAAD) cohort (n = 182, involving 178 tumor and 4 control specimens) and GTEx normal pancreas samples (n = 167) were retrieved using the UCSC XENA browser (https://xenabrowser.net/datapages/).13 The FPKM (Fragments Per Kilobase of exon-model per Million reads mapped) gene expression values were log2 (FPKM+1) transformed for further analysis. The corresponding clinical information and marked somatic mutation of TCGA PAAD patients were retrieved from TCGA GDC data portal (https://portal.gdc.cancer.gov/). The RNA-seq data and corresponding clinical data of ICGC-PACA-AU (n = 96), as a validation set, were also download form UCSC XENA. In total, 35 PRGs were selected based on the latest studies,14,15 which are shown in Supplementary Table S1. All information is publicly available and does not require ethics committee approval. The flow chart is presented in Figure 1.
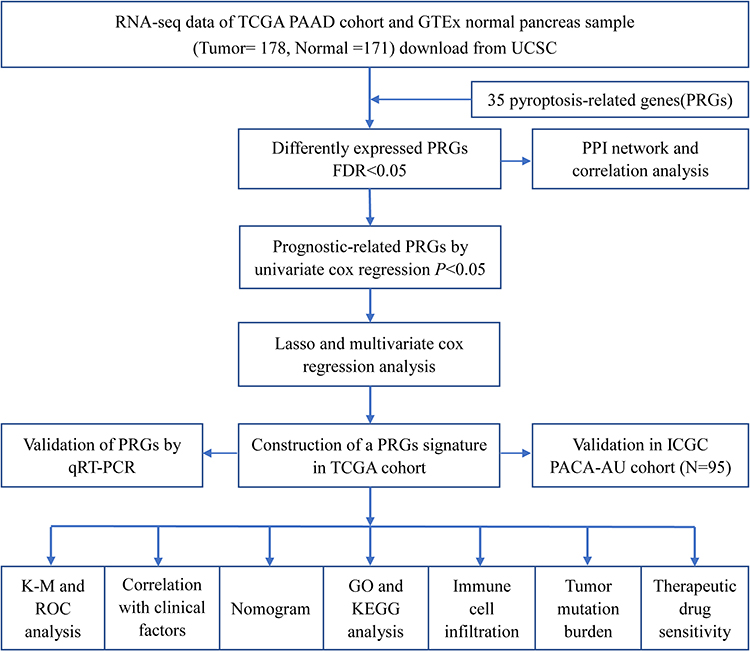 |
Figure 1 Flow diagram of the research. |
Differentially Expressed and Prognosis-Associated Genes
The differential expression levels of 35 PRGs between the PAAD and normal pancreas specimens were analyzed by “limma” R package, with the cut-off false discovery rate (FDR) of <0.05. To explore the associations between these differential expressed genes (DEGs), the protein–protein interaction (PPI) network was achieved with STRING v11.0 (https://www.string-db.org/), and correlation network was performed by “igraph” and “reshape2” R packages. Univariate Cox regression (CR) was employed to discriminate the prognosis-associated genes of PRGs, and P-values <0.05 was deemed statistically significant.
Establishment of a PRGs Signature in TCGA PAAD Cohort
The PRGs were used for construction of a prognosis signature. To further narrow the range and remove overfitting between genes, we performed lasso regression with “glmnet” R package, selected 1000 times ten-fold cross validation, and then applied multivariate CR to build the risk model. The RS was calculated as follows: Σ(coefficienti × gene expressioni). The TCGA PAAD tumor samples (train set) were categorized into high-risk (HR) and low-risk (LR) groups based on the median RS. The differences in OS time between LR and HR groups were compared using the Kaplan–Meier (K-M) plots and Log rank test. Time-dependent Receiver Operating Characteristic (ROC) curves and Area Under the Curve (AUC) for 12-, 24- and 36-month OS were constructed using the “survival”, “timeROC” and “survminer” R packages. Uni- and multi-variate CR analyses were utilized to determine the significant independent factors for predicting the prognosis of PaC.
Validation of the Signature in ICGC PACA-AU Cohort
ICGC-PACA-AU was used as validation set for evaluating the application of the signature. First, the RS was estimated based on the formula provided by TCGA cohort. Then, the samples were categorized into LR and HR groups based on the median RS of the ICGC cohort. Time-dependent ROC and K-M survival curves were constructed to verify the predictive values of the RS model. Uni- and multi-variate CR analyses were carried out to determine the independent prognostic significance of the model.
Correlation Analysis of the Signature with Clinicopathological Features in TCGA and ICGC Cohorts
The correlations between RS and clinicopathological features (eg, age, gender, grade and stage) were analyzed. Then, boxplot and heatmap were established using the “ggpubr” and “ComplexHeatmap” packages in R. To further assess the stability of the risk model, stratified survival analysis was conducted by dividing the patients into different subgroups according to their clinicopathological features.
Construction of Survival Predictive Nomogram
We incorporated the RS and clinicopathological factors into a nomogram to determine the 12-, 24- and 36-month OS of PaC. The benefit of the nomogram is that it can accurately assess the OS rate of each patient and guide clinical management. The accuracy of the risk model was evaluated by “rms” R package according to the calibration plots of the nomogram.
Principal Component Analysis and Enrichment Analysis of the Signature
To determine whether the PRGs signature can differentiate LR and HR groups, t-distributed Stochastic Neighbor Embedding (t-SNE) plots and principal component analysis (PCA) were conducted using the “Rtsne” R package. The significant DEGs between the LR and HR groups were detected by the cut-off filter of |log2FC| > 1 and FDR < 0.05. Kyoto Encyclopedia of Genes and Genomes (KEGG) pathways and Gene ontology (GO) analysis were carried out using the “cluster Profiler” and “enrich plot” with FDR < 0.05 and p < 0.05, and the result was visualized by “ggplot2” and “GOplot” packages in R.
Correlation Analysis Between Immune Infiltration and RS
The ICI estimation for TCGA samples were downloaded from TIMER v2.0 (http://timer.comp-genomics.org/),16 which were executed by TIMER,17 CIBERSORT,18 quanTIseq,19 xCell,20 MCP-counter21 and EPIC22 algorithms. We explored the relationships between immune infiltration and RS, and compared the immune cell expression between LR and HR groups.
Tumor Mutation Burden Between the Two Risk Groups
The TMB values were calculated, and then compared between LR and HR groups. The PRG somatic mutations of the two groups were visualized with “maftools” package in R.
Chemotherapy Drug Sensitive of the Two Risk Groups
The half-maximal inhibitory concentrations (IC50) of drugs were derived from the Genomics of Drug Sensitivity in Cancer (GDSC, https://www.cancerrxgene.org/),23 and then the IC50 of drugs in each PAAD specimen was calculated by ridge regression using the “pRRophetic” R package.24 Then, we compared the IC50 values of paclitaxel, gemcitabine, 5-fluorouracil and cisplatin between LR and HR groups, in order to explore the sensitivity of each drug.
Cell Culture
Human PaC cell cDNA chip was supplied by Shanghai Outdo Biotech Co., Ltd. (CGt No: MecDNA-HPanC007Ce01; Lot No: 8*R100-M-20181128**-**), which contained the cDNA of seven human PaC cells: CFPAC-1, BxPC-3, Aspc-1, HPAF-2, MIAPaCa, SW1990 and Panc-1. Human pancreatic ductal epithelial (hTERT-HPNE) cell line was procured from Meisen CTCC, and then cultured in DMEM containing 10% fetal bovine serum, 100 μg/mL streptomycin and 100 U/mL penicillin at 37°C and 5% CO2.
Quantitative Real-Time Polymerase Chain Reaction (qRT-PCR)
Total RNA was isolated using the TRIzol reagent, and then reverse-transcribed into cDNA using the cDNA Reverse Transcription Kit. SYBR Green-based real-time PCR analysis was conducted to assess the expression levels of the signature genes. B-actin was employed as an internal control for normalization, and the relative expression was calculated by 2-ΔΔCt method. The primers of each gene are shown in Supplementary Table S2. All assays were repeated 3 times.
Statistical Analysis
Statistical tests were performed through R v4.0.2 and the corresponding R packages. Mann–Whitney U-test was applied for different group comparisons, and the correlation analysis was conducted by Pearson’s correlation analysis. A two-tailed p-value of <0.05 was deemed statistically significant.
Results
Differentially Expressed and Prognosis-Associated Genes
We identified 29 differentially expressed PRGs between the 178 tumor and 171 control specimens of pooled TCGA PAAD cohort and GTEx normal pancreas. Among them, 22 genes (GZMA, GZMB, AIM2, CASP1, CASP3, CASP5, CASP6, CASP8, IL6, IL18, IL1B, NOD1, NOD2, NLRP3, NLRC4, NLRC7, GSDMA, GSDMC, GSDME, TNF, GPX4 and PYCARD) were upregulated, while 7 genes (PLCG1, SCAF11, CASP9, PJVK, GSDMD, CASP4 and TIRAP) were downregulated (Figure 2A). To examine the relationship of these genes, PPI network and correlation analyses were conducted (Figure 2B and C, respectively). A total of 176 tumor samples with complete survival information were obtained, and the baseline information of those patients is presented in Supplementary Table S3. The univariate CR results demonstrated that 9 PRGs could predict the prognostic outcomes of PaC (Figure 2D).
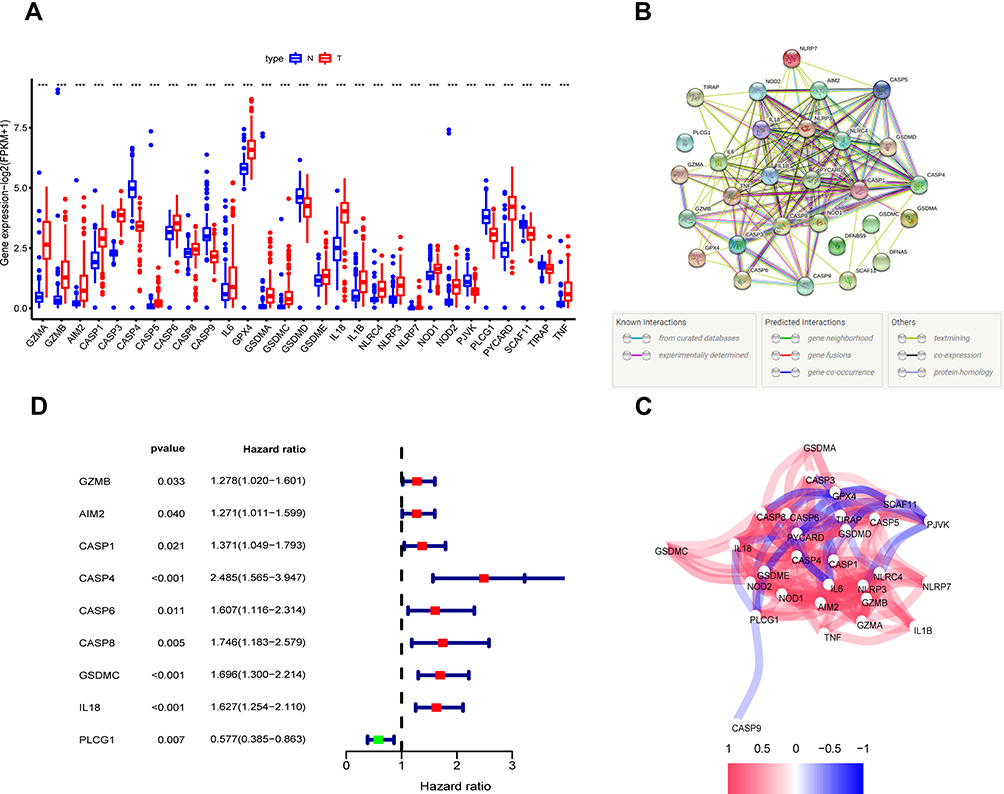 |
Figure 2 Differently expressed and prognosis-associated PRGs in TCGA PAAD cohort. (A) Differential expression of PRGs in PAAD and control pancreas tissues, Tumor, red; Normal, blue. (B) The PPI network of DEGs (interaction score = 0.4). (C) The correlation network of the DEGs. Blue and red lines indicate negative and positive correlations, respectively. (D) Univariate CR analysis of prognosis-associated genes. *** P < 0.001. Abbreviations: PRGs, pyroptosis-related genes; PAAD, pancreatic adenocarcinoma; PPI, protein–protein interaction. |
Construction of a PRGs Signature in TCGA PAAD Cohort
LASSO and multivariate CR analysis were further conducted on the 9 differentially expressed and prognosis-associated genes, and a total of 4 genes were selected for the PRGs signature (Figure 3A–C). The RS was estimated as follows: RS = (0.305*AIM2 exp.) + (0.438*GSDMC exp.) + (0.424*IL18 exp.) + (−0.879*PLCG1 exp.). Based on the median RS, all specimens were categorized into the LR and HR groups (n = 88 in each group). An obvious difference in OS time was observed between LR and HR groups (P < 0.001, Figure 3D). Time-dependent ROC curves indicated that the AUCs for 12-, 24- and 36-month OS were 0.783, 0.680 and 0.711, respectively (Figure 3E). The survival status and time were better in LR group than in HR group (Figure 3F). Uni- and multi-variate CR analyses demonstrated that the RS was a significant independent factor for predicting the prognosis of PaC, and N stage was another independent prognostic factor (Figure 3G and H).
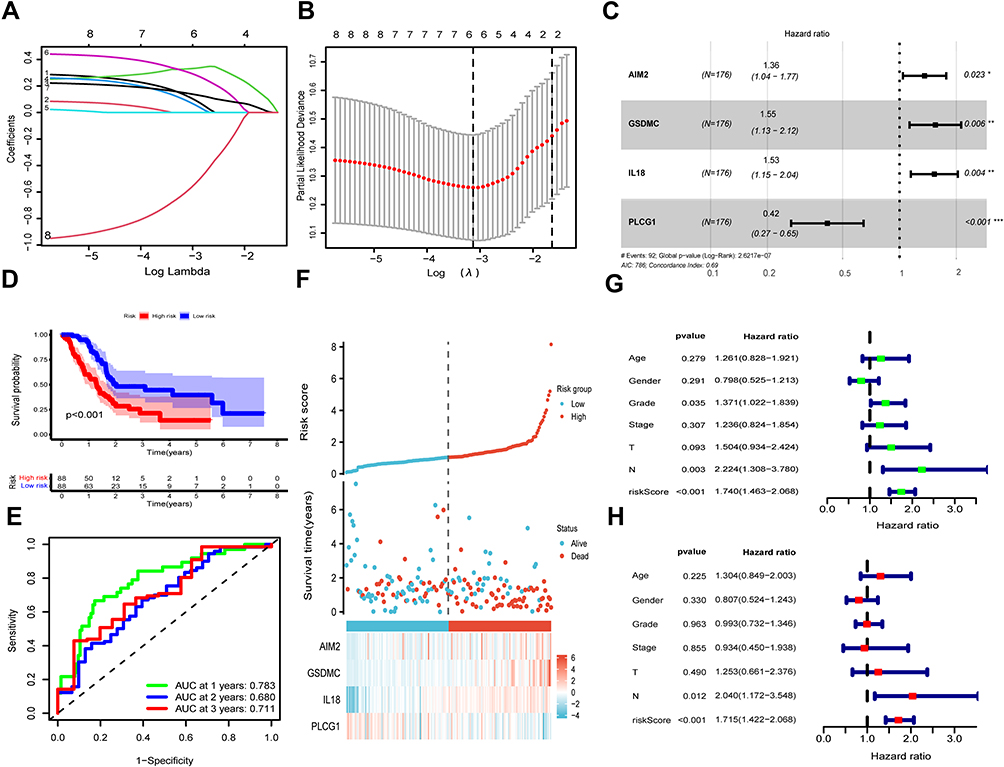 |
Figure 3 Establishment of a PRGs signature in TCGA PAAD cohort. (A) LASSO regression of the 9 prognosis-associated PRGs. (B) Cross-validation for limiting the gene selection. (C) Multivariate CR of the PRGs signature. (D) K-M curves for comparing the OS times between LR and HR groups. (E) Time-dependent ROC of risk model to estimate the 12-, 24- and 36-month OS. (F) Distribution of RS, patients’ survival status, survival time and signature genes’ expression in the two risk groups. Uni- (G) and multi-variate (H) CR analyses of RS and clinicopathological factors. |
Validation of the Signatures in ICGC PACA-AU Cohort
A total of 95 ICGC-PACA-AU cohort samples were used as a validation set, and the clinical features of these patients are presented in Supplementary Table S4. The TCGA risk model formula was used to calculate RS. According to the median RS of the ICGC cohort, 47 and 48 patients were categorized into HR and LR groups, respectively. The OS time of patients in LR and HR groups was dramatically different (P < 0.001, Figure 4A). The AUCs for 12-, 24- and 36-month OS were 0.711, 0.682 and 0.742, respectively (Figure 4B). The risk plot demonstrated that the survival status and time were greater in LR group than in HR group (Figure 4C). Combined with clinicopathological factors, Uni- and multi-variate CR analyses revealed that the RS and N stage were significant independent factors for prognostic prediction (Figure 4D and E).
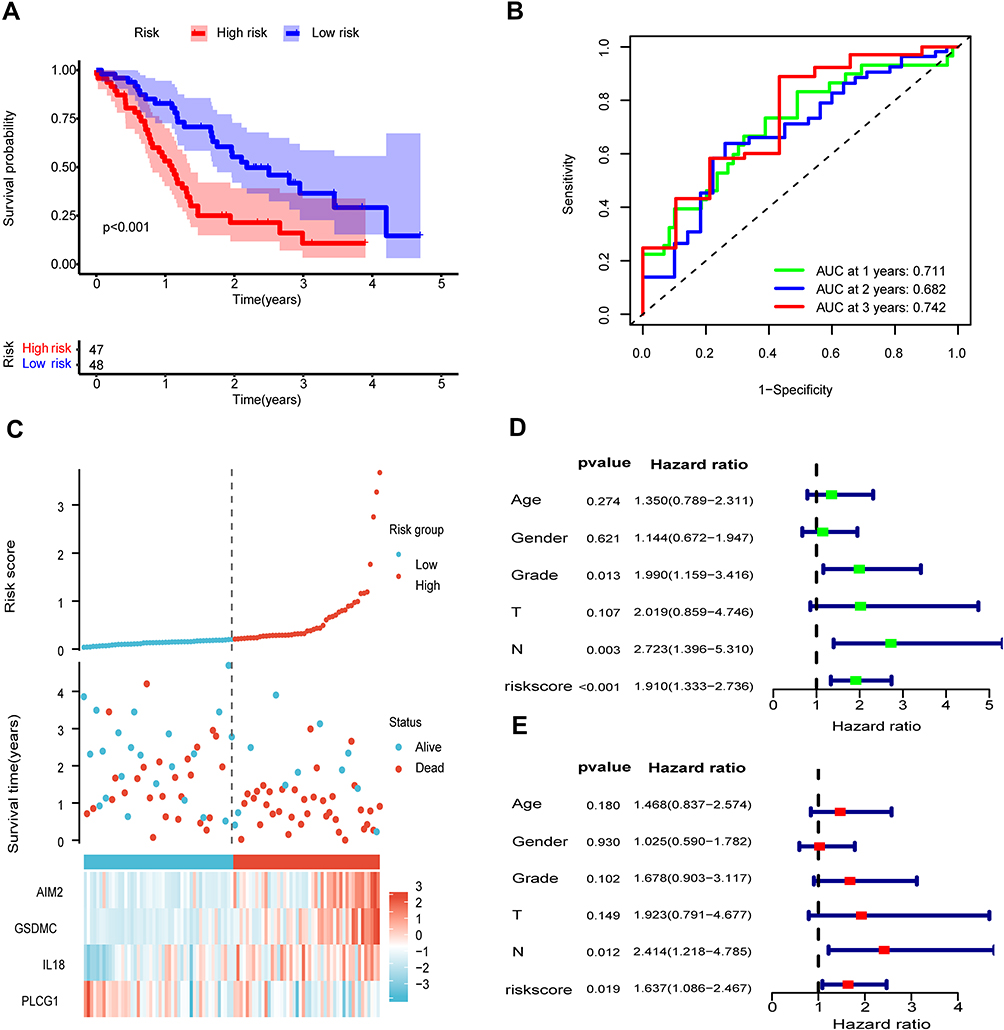 |
Figure 4 Validation of the signature in ICGC AU cohort. (A) K-M curves for comparing the OS times between LR and HR groups. (B) Time-dependent ROC of risk model. (C) Distribution of RS, patients’ survival status, and signature genes’ expression in the two risk groups. Uni- (D) and multi-variate (E) CR analyses of RS and clinicopathological factors. |
The Signature is Associated with Clinicopathological Factors in TCGA and ICGC Cohorts
All patients were stratified into various subgroups according to their clinical characteristics, and the stratified survival analysis was conducted to examine the stability of the signature. The OS time of the two risk groups was remarkably different between subgroups in TCGA PAAD cohort (Figure 5A–H). In addition, we determined the correlations between RS and clinicopathological features, and the results indicated that the RS increased with increasing Grade values. Moreover, there were significant differences between distinct Grades, of which Grade-1 vs Grade-2, P = 0.0015; Grade-1 vs Grade-3, P = 0.00017; Grade-1 vs Grade-4, P = 0.045; Grade-2 vs Grade-3, P = 0.029 (Figure 5I). The relationships between RS and clinicopathological features are shown in Figure 5J. As for ICGC AU cohort, K-M survival analysis revealed significant differences among distinct subgroups, except for patients in G3-G4 group (Figure 6A–F). The AUC value for RS was higher than other clinicopathological factors such as age, gender, grade, T and N stage (Figure 6G). Furthermore, the correlation results demonstrated that the RS was markedly related to Grade (Figure 6H). This indicates that the RS may contribute to the progression of PaC, and can effectively estimate the prognosis of this disease.
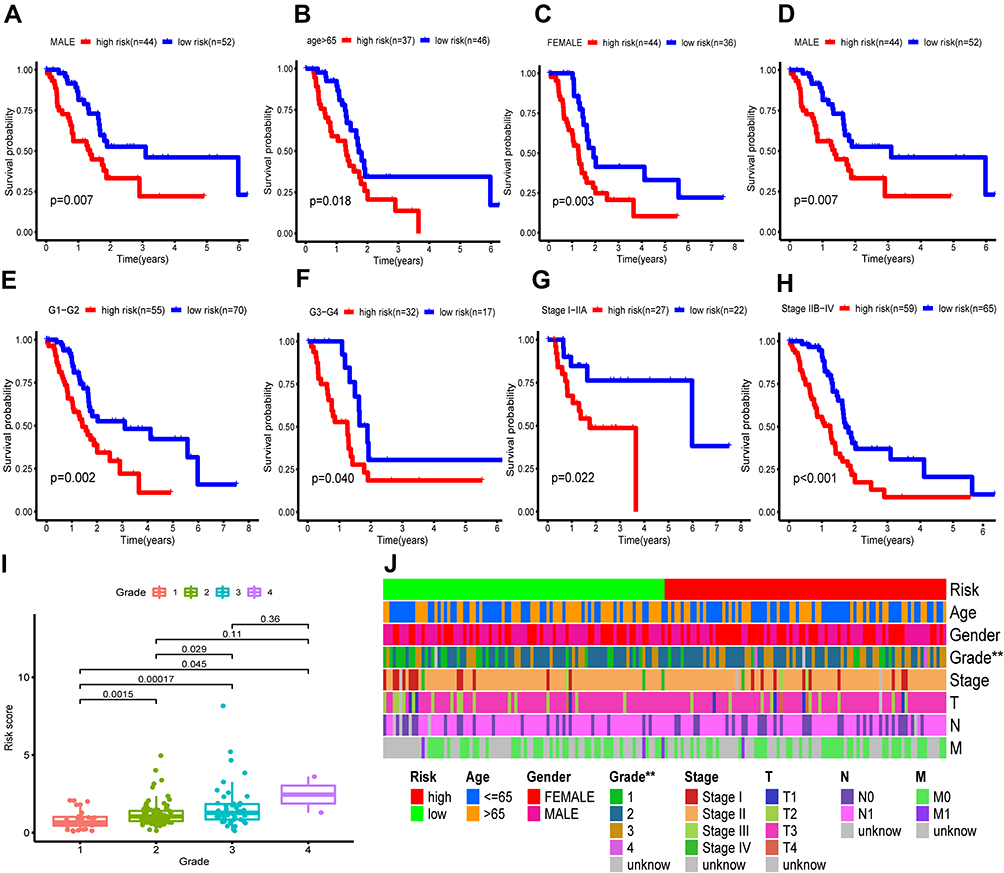 |
Figure 5 Subgroup analysis and correlation between RS and clinicopathological features in TCGA PAAD cohort. (A–H) K-M curves for comparing the OS times between LR and HR groups stratified by various subgroups: age≤65 (A), age>65 (B), female (C), male (D), G1-G2 (E), G3-G4 (F), stage I–IIA (G), and stage IIB-IV (H). (I) Correlation between RS and distinct grade. (J) Relationships among the demographic and clinicopathological characteristics in the two risk groups. ** P < 0.01. |
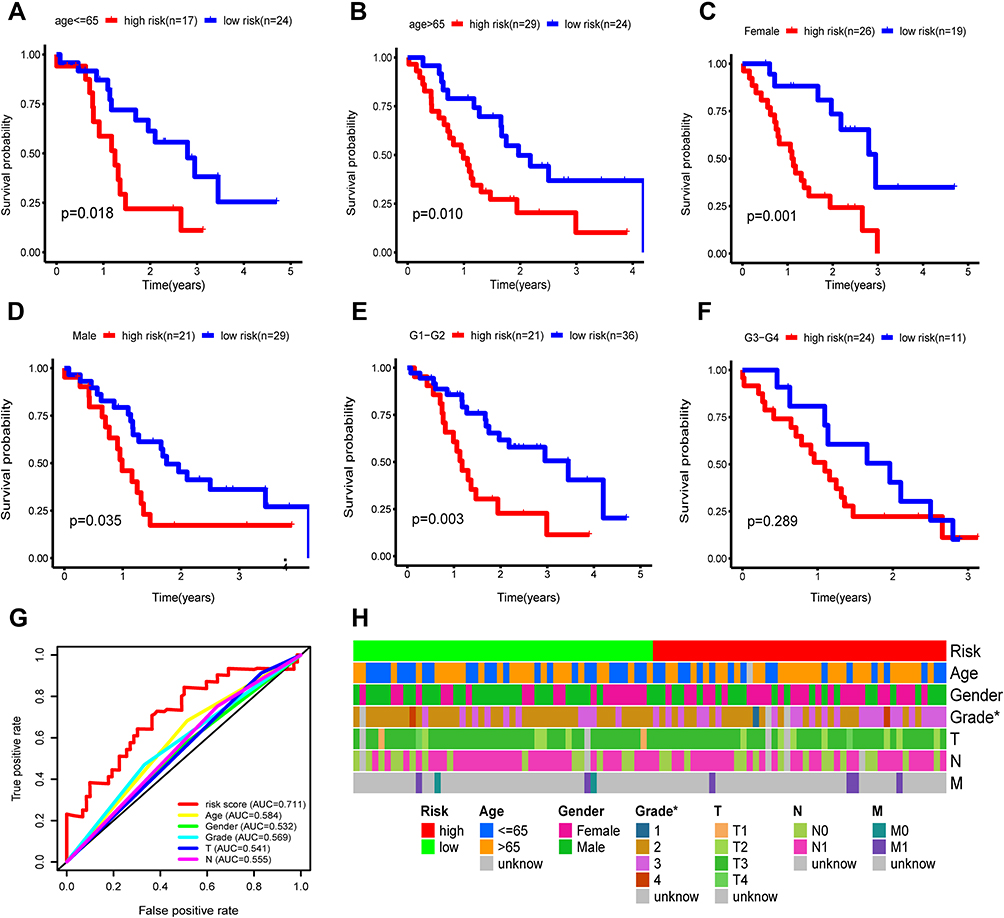 |
Figure 6 Subgroup analysis and correlation between RS and clinicopathological features in ICGC AU cohort. (A–F) K-M curves for comparing the OS times between LR and HR groups stratified by various subgroups: age≤65 (A), age>65 (B), female (C), male (D), G1-G2 (E), and G3-G4 (F). G. ROC curves of RS, demographic characteristics and clinicopathological factors. H. Relationships among the demographic and clinicopathological characteristics in LR and HR groups. * P < 0.05. |
Construction of a Clinical Risk Nomogram
The predictive values of RS for 12-, 24- and 36-month OS of TCGA PAAD samples were higher than those of other clinicopathological factors (Figure 7A–C). The AUC of RS for 1-year OS was higher (0.764) compared with age (AUC = 0.499), gender (AUC = 0.558), Grade (AUC = 0.596), Stage (AUC = 0.471), T stage (AUC = 0.505) and N stage (AUC = 0.549). To predict the OS rate of each patient, a nomogram was developed based on the RS and clinicopathological factors (Figure 7D). Calibration curves for the nomogram of 12, 24 and 36 months indicated a good prognostic significance of the PRGs signature (Figure 7E–G).
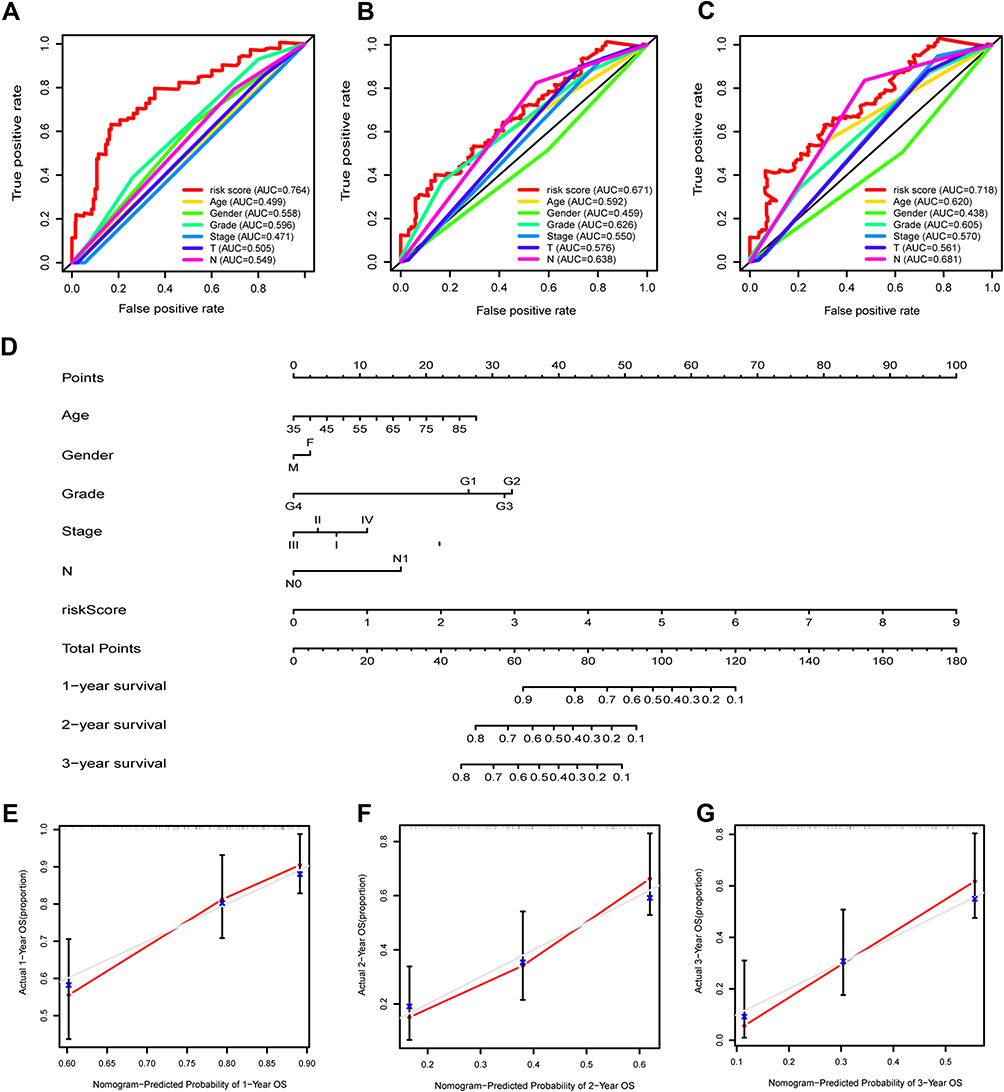 |
Figure 7 Establishment of a risk-clinical nomogram in TCGA PAAD cohort. (A–C) ROC curves of RS, demographic characteristics and clinicopathological factors for the prediction of 12-, 24- and 36-month OS. (D) (A) Nomogram was created based on RS, demographic characteristics and clinicopathological factors to estimate the survival status of PAAD patients. (E–G) Nomogram calibration curves of 12-, 24- and 36-month OS, respectively. |
PCA, t-SNE and Enrichment Analysis of the Two Risk Groups
The PCA and t-SNE results demonstrated the uneven distribution between LR and HR groups (Figure 8A and B). Notably, the clusters of HR group were distinguished from LR group without apparent crossover. To further assess the differences between LR and HR groups, a total of 559 DEGs were identified (Figure 8C). GO analysis revealed the enrichment of the DEGs in “vesicle-mediated transport in synapse”, “regulation of trans-synaptic signaling”, “modulation of chemical synaptic transmission”, “presynapse”, “synaptic membrane”, “metal ion transmembrane transporter activity”, “neuronal cell body”, etc. (Figure 8D). KEGG pathway enrichment indicated that the DEGs in “cAMP pathway”, “MAPK pathway”, “cGMP-PKG pathway”, “pancreatic and insulin secretion”, etc. (Figure 8E), which were associated with tumor genesis, progression and prognosis.
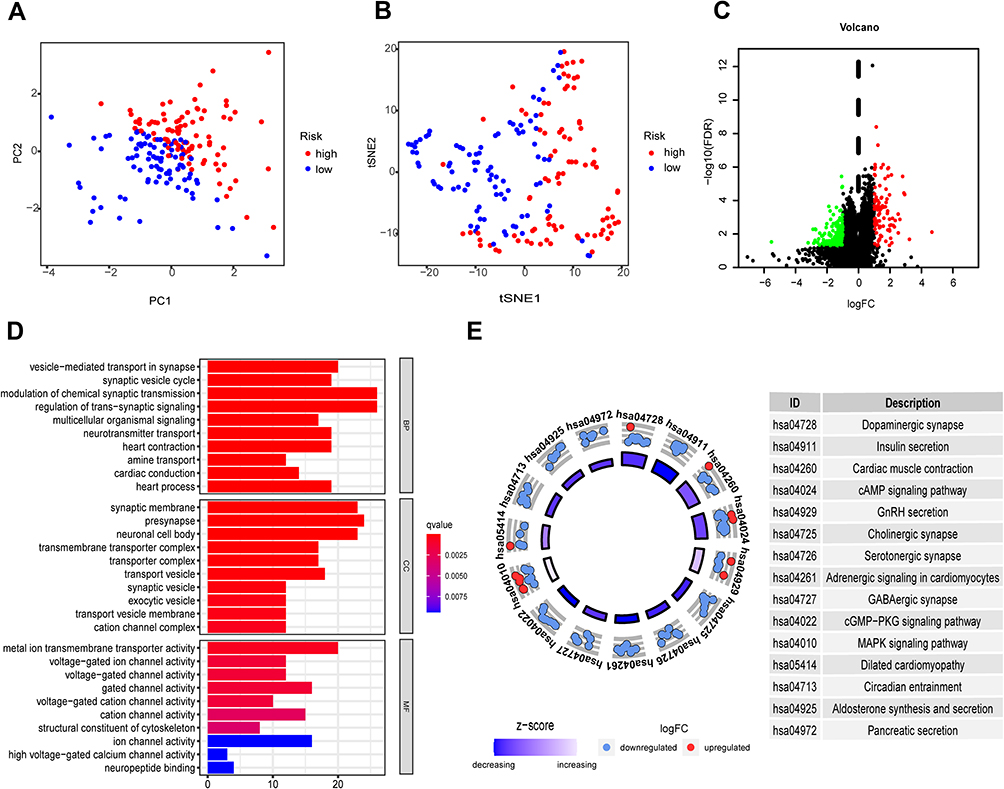 |
Figure 8 PCA, t-SNE and DEG enrichment of the two risk groups in TCGA PAAD cohort. (A) PCA plot for clustering the RS of PAAD patients. (B) t-SNE plot for analyzing the RS of PAAD patients. (C) DEGs of the LR and HR groups. Red: upregulation, green: downregulation, black: NS. (D) Bar plot graph for GO enrichment. The longer bars indicate more gene enrichment and the darker red indicates more pronounced differences, q-value: the adjusted p-value. (E) Circle plot graph for KEGG pathway. The inner circle denotes the prominence of KEGG terms (log10-adjusted P-value). The outer circle denotes the expression (log FC) of DEGs in each enriched pathway; blue and red dots denote the downregulation and upregulation of DEGs enriched in the pathway, respectively. The table on the right of the circle plot shows the top-fifteen most prominent KEGG pathways and their annotations. |
Association Between RS and Immune Infiltration
We analyzed the relationship between RS and ICI through multiple algorithms. The results indicated that RS was positively related to activated neutrophils and myeloid dendritic cells, while negatively related to CD4+ T cells, NK cells and macrophage M2 cells (Figure 9A). Tregs, NK cells and macrophages were remarkably enriched in LR group (Figure 9B–D), suggesting that the patients in LR group may exhibit greater immune responses to attack tumor cells.
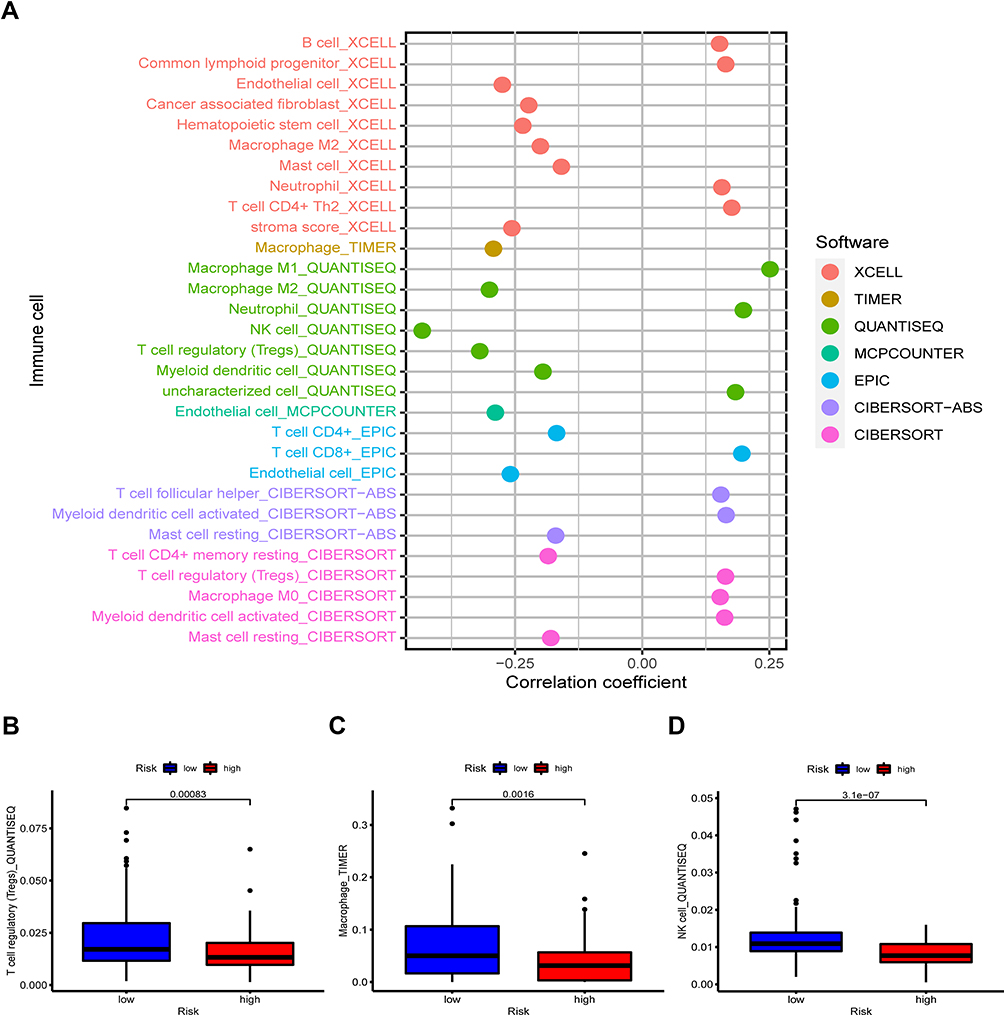 |
Figure 9 Correlation between immune infiltration and RS. (A) RS was negatively related to NK cells, Tregs, macrophage M2 and CD4+ T cells, while positively associated with myeloid dendritic cells, activated neutrophils and CD8+ T cells. (B–D) Significant enrichment of Tregs, macrophages and NK cells in LR group. |
Tumor Mutation Burden Between the Two Risk Groups
The somatic mutations in TCGA PAAD cohort were obtained and analyzed, and the TMB scores of the two risk groups were then calculated. The findings revealed that the TMB scores were remarkably elevated in HR group compared with those in LR group (P = 0.044, Figure 10A). For single mutated genes, the mutation frequencies of KRAS, TP53 and CDKN2A were markedly different between the two risk groups (Figure 10B). Somatic mutations were found in 72 out of 78 samples (92.31%) in HR group, while 62 out of 79 (78.48%) samples in LR group. The top 10 altered genes in the two groups are presented in Figure 10C and D.
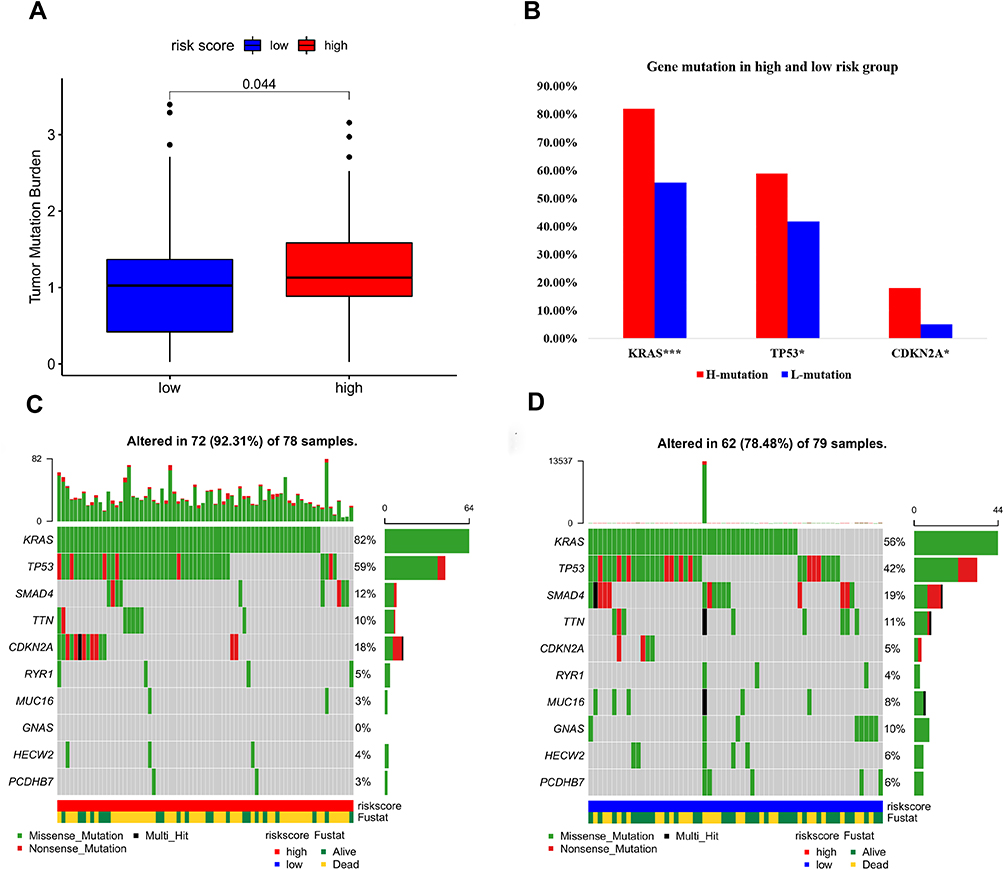 |
Figure 10 Tumor mutation burden of the two risk groups. (A) TMB scores in the two risk groups. (B) KRAS, TP53 and CDKN2A with significantly different mutations in LR and HR groups, ***P < 0.001, *P < 0.05. (C) Top 10 mutated genes in the high risk group. (D) Top 10 mutated genes in the low risk group. |
Chemotherapy Sensitive of the Two Risk Groups
Chemotherapeutic drug responses were estimated based on the drug sensitivity (IC50) and gene expression profiles of each cancer cell line.25 The IC50 values of gemcitabine, 5-fluorouracil, cisplatin and paclitaxel were obtained to assess the chemotherapeutic drug sensitive of the two risk groups. The results demonstrated that the IC50 values of these four drugs were lower in HR group than in LR group (Figure 11A–D). This indicates that the patients in HR group are more susceptible to these drugs.
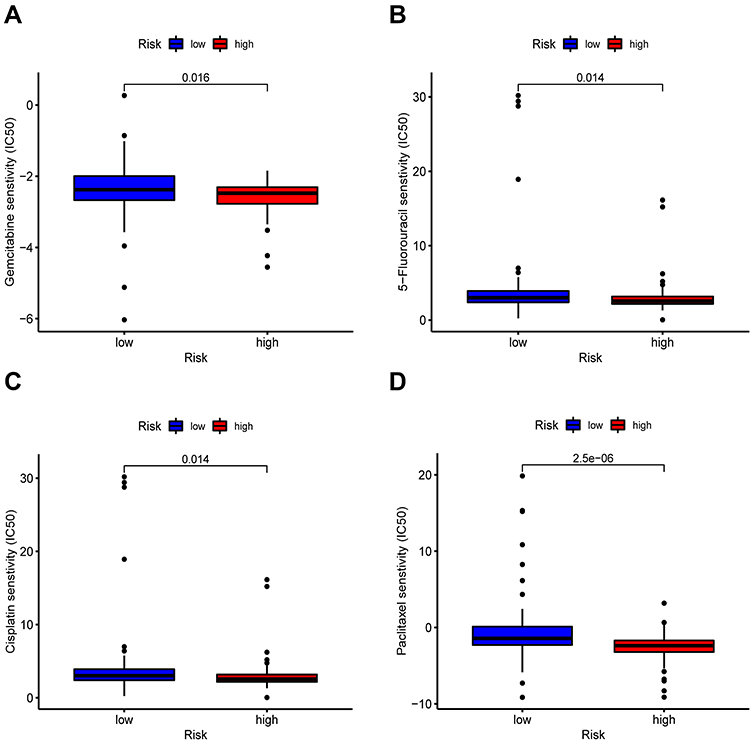 |
Figure 11 Chemotherapy drugs sensitivity of the two risk groups. Patients with lower IC50 of chemotherapeutic drugs such as gemcitabine (A), 5-fluorouracil (B), cisplatin (C) and paclitaxel (D) in HR group. |
Expression Patterns of the 4 Signature Genes in Different Cell Lines
The expression levels of IL18, AIM2, and GSDMC were higher in most of the human PaC cell lines compared to hTERT-HPNE cell line (Figure 12A–C). On the contrary, the expression of PLCG1 was lower in most of the human PaC cells (Figure 12D). These qPCR results are consistent with the differential expression levels of the signature genes in our study.
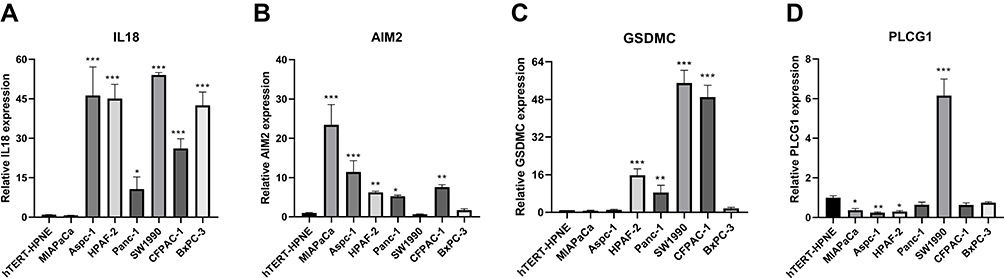 |
Figure 12 The relative expression level of signature genes in cell lines. The relative expression level of IL18 (A), AIM2 (B), GSDMC (C) and PLCG1 (D) in human pancreatic ductal epithelial cell hTERT-HPNE and human PaC cells: MIAPaCa, Aspc-1, HPAF-2, Panc-1, SW1990, CFPAC-1 and BxPC-3 (***P < 0.001, **P < 0.01, *P < 0.05). |
Discussion
PaC is still a deadly disease with extremely poor prognosis. With the rapid development of next-generation sequencing technologies and bioinformatics tools, several molecular signatures were constructed to improve the prognostic prediction and clinical management of PaC.26–28 Recently, PRGs signatures have been established to predict the prognostic outcomes of gastric, ovarian and lung cancers.14,15,29 These signatures not only can predict the prognostic outcomes but also guide the clinical therapy. However, the functional and prognostic roles of PRGs in PaC have not been investigated. Thus, we conducted bioinformatics analysis to construct a novel PRGs signature and explore its prognostic potential in PaC.
Based on the 35 PRGs reported in previous literature, we first identified 29 DEGs in PaC, and 9 prognosis-associated DEGs were used to construct the signature. Through LASSO and multivariate Cox analysis, we developed the signature consisting of four genes (AIM2, IL18, PLCG1 and GSDMC), and the RS model was then established. All samples were categorized into LR and HR groups based on the median RS. The OS time of LR group was markedly improved compared with HR group. Time-dependent ROC curves demonstrated that the signature had a promising prognostic value in PaC. Uni- and multi-variate Cox analyses further confirmed that RS was a significant independent prognostic factor. To evaluate the stability and effectiveness of the signature, we performed stratified survival analysis of RS in various subgroups according to the clinical features. A significant difference was observed in the OS time between LR and HR groups. Correlation analysis of different clinicopathological factors indicated that the RS was positively related to the grade of PaC. In addition, the RS had a greater AUC value compared with age, gender, grade, AJCC stage, N and T stage. Furthermore, we established a nomogram combined with RS and clinicopathological factors, which demonstrated a good prognostic significance. The predictive values of the signature were validated in ICGC PACA-AU cohort. The differential expression of signature genes between pancreatic tumor cell lines and pancreatic ductal epithelial cells was verified by qPCR experiments.
Pyroptosis is a form of necrotic cell death regulated by GSDMs.7 GSDMs consist of GSDMA, GSDMB, GSDMC, GSDMD, GSDME and PJVK in humans, which play a crucial role in regulating immune responses30,31 and are associated with the development of autoimmune diseases and certain cancers.32,33 In our study, GSDMC was enrolled to be one of the gene signatures. Previous research has focused mainly on GSDMB and GSDME, while the molecular mechanism of GSDMC and related diseases are less studied. In recent years, few studies34,35 reported that the activated caspase-8 could mediate cleavage of GSDMC to induce pyroptosis, and the overexpression of GSDMC was correlated with poor survival in breast cancer. In a hypoxic state, PD-L1 could upregulate the expression of GSDMC, and subsequently cleaved by macrophage-derived TNFα-activated caspase-8, thereby leading to pyroptosis and tumor necrosis.34 More importantly, the study identified that four antibiotics (ie, actinomycin-D, epirubicin, doxorubicin and daunorubicin) could activate caspase-8 and regulate GDSMC-induced pyroptosis cell death, suggesting that those drugs are involved in the antitumor immunity and prognosis of GSDMC+ cancer patients. Our bioinformatics analysis demonstrated that GSDMC was upregulated in PaC tissues compared to healthy pancreas tissues, and was related to poor prognosis in PaC patients.
Another critical finding in this study was that the signature may guide the selection of appropriate treatments for patients with PaC. Previous research has shown that TMB is associated with response to immunotherapy in many cancers,36,37 including PaC.38 In our study, the TMB scores were remarkably higher in HR group than in LR group, suggesting that patients with high RS may benefit from immunotherapy. At present, cisplatin, gemcitabine, 5-fluorouracil and paclitaxel are considered as the first-line chemotherapeutic drugs for PaC patients.39 We compared the IC50 values of these four drugs between the two risk groups, and found that the patients in HR group had lower IC50 values, suggesting that the patients in HR groups are more sensitive to these drugs. Collectively, these findings may provide useful information for selecting chemotherapeutic drugs in PaC patients.
Nevertheless, this study has inevitable limitations. Bioinformatics analysis was conducted based on public databases, of which the limited geographic variability of the samples analyzed, and more clinical samples are still needed to validate the usefulness of the signature. Thus, the expression of PRGs enrolled in the signature, and their roles in the progression of PaC, should be verified by further experimental studies.
Conclusion
In summary, a PRGs signature was established to predict the prognostic outcome of PaC, and the signature performed well in TCGA PAAD and ICGC PACA-AU cohorts. Further analysis indicated that the signature could contribute to the progression of PaC, TMB score and chemotherapy sensitivity. Additionally, the signature could provide useful information for the selection of personal therapy in PaC patients.
Abbreviations
AUC, area under the curve; CR, Cox regression; DEG, differential expressed gene; FDR, false discovery rate; FPKM, Fragments Per Kilobase of exon-model per Million reads mapped; GDSC, Genomics of Drug Sensitivity in Cancer; GO, Gene Ontology; GTEx, genotype-tissue expression comprehensive database; ICGC, International Cancer Genome Consortium; ICI, tumor immune cell infiltration; IC50, half-maximal inhibitory concentrations; KEGG, Kyoto Encyclopedia of Genes and Genomes; KM, Kaplan-Meier; LASSO, Least Absolute Shrinkage and Selection Operator; OS, overall survival; PAAD, pancreatic adenocarcinoma; PaC, pancreatic cancer; PCA, plots and principal component analysis; PPI, protein–protein interaction; PRG, pyroptosis-related gene; ROC, receiver operating characteristic; RS, risk score; TCGA, The Cancer Genome Atlas; TMB, tumor mutation burden; t-SNE, t-distributed Stochastic Neighbor Embedding.
Data Sharing Statement
All data were obtained from the public database (https://xenabrowser.net/datapages/) and (https://portal.gdc.cancer.gov/).
Ethics Exemption
The date from TCGA, GTEx and ICGC are both publicly available, so there were no ethical issues and other conflicts of interest. Thus, the current study was exempted from ethic approval. It has been confirmed of Research Ethics Committees of the First Hospital of Handan.
Acknowledgments
We thank all participants included in the present study of TCGA, GTEx and ICGC cohort.
Author Contributions
All authors made a significant contribution to the work reported, whether that is in the conception, study design, execution, acquisition of data, analysis and interpretation, or in all these areas; took part in drafting, revising or critically reviewing the article; gave final approval of the version to be published; have agreed on the journal to which the article has been submitted; and agree to be accountable for all aspects of the work.
Funding
The research was funded by the Medical Science Research Project of Hebei Province (20220487).
Disclosure
The authors report no conflicts of interest in this work.
References
1. Siegel RL, Miller KD, Jemal A. Cancer statistics, 2020. CA Cancer J Clin. 2020;70(1):7–30. doi:10.3322/caac.21590
2. Lola Rahib BD, Smith RA, Rosenzweig AB, Fleshman JM, Matrisian LM, Matrisian LM. Projecting cancer incidence and deaths to 2030: the unexpected burden of thyroid, liver, and pancreas cancers in the United States. Clin Cancer Res. 2014;74(11):2913–2921. doi:10.1158/0008-5472.CAN-14-0155
3. Kleeff J, Korc M, Apte M, et al. Pancreatic cancer. Nat Rev Dis Primers. 2016;2:16022. doi:10.1038/nrdp.2016.22
4. Mizrahi JD, Surana R, Valle JW, Shroff RT. Pancreatic cancer. Lancet. 2020;395(10242):2008–2020. doi:10.1016/s0140-6736(20)30974-0
5. Brad T, Cookson MAB. Pro-inflammatory programmed cell death. Trends Microbiol. 2001;9(3):113–114.
6. Shi J, Zhao Y, Wang K, et al. Cleavage of GSDMD by inflammatory caspases determines pyroptotic cell death. Nature. 2015;526(7575):660–665. doi:10.1038/nature15514
7. Shi J, Gao W, Pyroptosis: SF. Gasdermin-mediated programmed necrotic cell death. Trends Biochem Sci. 2017;42(4):245–254. doi:10.1016/j.tibs.2016.10.004
8. Yu J, Li S, Qi J, et al. Cleavage of GSDME by caspase-3 determines lobaplatin-induced pyroptosis in colon cancer cells. Cell Death Dis. 2019;10(3):193. doi:10.1038/s41419-019-1441-4
9. Zhang CC, Li CG, Wang YF, et al. Chemotherapeutic paclitaxel and cisplatin differentially induce pyroptosis in A549 lung cancer cells via caspase-3/GSDME activation. Apoptosis. 2019;24(3–4):312–325. doi:10.1007/s10495-019-01515-1
10. Wang Y, Gao W, Shi X, et al. Chemotherapy drugs induce pyroptosis through caspase-3 cleavage of a gasdermin. Nature. 2017;547(7661):99–103. doi:10.1038/nature22393
11. Ruan J, Wang S, Wang J. Mechanism and regulation of pyroptosis-mediated in cancer cell death. Chem Biol Interact. 2020;323:109052. doi:10.1016/j.cbi.2020.109052
12. Wang YY, Liu XL, Zhao R. Induction of pyroptosis and its implications in cancer management. Front Oncol. 2019;9:971. doi:10.3389/fonc.2019.00971
13. Navarro Gonzalez J, Zweig AS, Speir ML, et al. The UCSC Genome Browser database: 2021 update. Nucleic Acids Res. 2021;49(D1):D1046–D57. doi:10.1093/nar/gkaa1070
14. Shao W, Yang Z, Fu Y, et al. The pyroptosis-related signature predicts prognosis and indicates immune microenvironment infiltration in gastric cancer. Front Cell Dev Biol. 2021:9. doi:10.3389/fcell.2021.676485
15. Ye Y, Dai Q, Qi H. A novel defined pyroptosis-related gene signature for predicting the prognosis of ovarian cancer. Cell Death Discov. 2021;7(1):71. doi:10.1038/s41420-021-00451-x
16. Li T, Fu J, Zeng Z. TIMER2.0 for analysis of tumor-infiltrating immune cells. Nucleic Acids Res. 2020;48:509–514. doi:10.1093/nar/gkaa407
17. Li B, Severson E, Pignon JC, et al. Comprehensive analyses of tumor immunity: implications for cancer immunotherapy. Genome Biol. 2016;17(1):174. doi:10.1186/s13059-016-1028-7
18. Newman AM, Liu CL, Green MR, et al. Robust enumeration of cell subsets from tissue expression profiles. Nat Methods. 2015;12(5):453–457. doi:10.1038/nmeth.3337
19. Finotello F, Mayer C, Plattner C, et al. Molecular and pharmacological modulators of the tumor immune contexture revealed by deconvolution of RNA-seq data. Genome Med. 2019;11(1):34. doi:10.1186/s13073-019-0638-6
20. Aran D, Hu Z, Butte AJ. xCell: digitally portraying the tissue cellular heterogeneity landscape. Genome Biol. 2017;18(1):220. doi:10.1186/s13059-017-1349-1
21. Becht E, Giraldo NA, Lacroix L, et al. Estimating the population abundance of tissue-infiltrating immune and stromal cell populations using gene expression. Genome Biol. 2016;17(1):218. doi:10.1186/s13059-016-1070-5
22. Racle J, de Jonge K, Baumgaertner P, Speiser DE, Gfeller D. Simultaneous enumeration of cancer and immune cell types from bulk tumor gene expression data. Elife. 2017;6. doi:10.7554/eLife.26476
23. Yang W, Soares J, Greninger P, et al. Genomics of Drug Sensitivity in Cancer (GDSC): a resource for therapeutic biomarker discovery in cancer cells. Nucleic Acids Res. 2013;41:D955–D61. doi:10.1093/nar/gks1111
24. Geeleher P, Cox N, Huang RS. pRRophetic: an R package for prediction of clinical chemotherapeutic response from tumor gene expression levels. PLoS One. 2014;9(9):e107468. doi:10.1371/journal.pone.0107468
25. Geeleher P, Cox NJ, Huang RS. Clinical drug response can be predicted using baseline gene expression levels and in vitro drug sensitivity in cell lines. Genome Biol. 2014;15(3):R47. doi:10.1186/gb-2014-15-3-r47
26. Zhang C, Zou Y, Zhu Y, et al. Three immune-related prognostic mRNAs as therapeutic targets for pancreatic cancer. Front Med. 2021;8:649326. doi:10.3389/fmed.2021.649326
27. Xu D, Wang Y, Liu X, et al. Development and clinical validation of a novel 9-gene prognostic model based on multi-omics in pancreatic adenocarcinoma. Pharmacol Res. 2021;164:105370. doi:10.1016/j.phrs.2020.105370
28. Huo J, Wu L, Development ZY. Validation of a novel metabolic-related signature predicting overall survival for pancreatic cancer. Front Genet. 2021;12. doi:10.3389/fgene.2021.561254
29. Lin W, Chen Y, Wu B, Chen Y, Li Z. Identification of the pyroptosis related prognostic gene signature and the associated regulation axis in lung adenocarcinoma. Cell Death Discov. 2021;7(1):161. doi:10.1038/s41420-021-00557-2
30. Feng S, Fox D, Man SM. Mechanisms of gasdermin family members in inflammasome signaling and cell death. J Mol Biol. 2018;430(18):3068–3080. doi:10.1016/j.jmb.2018.07.002
31. Orning P, Lien E, Fitzgerald KA. Gasdermins and their role in immunity and inflammation. J Exp Med. 2019;216(11):2453–2465. doi:10.1084/jem.20190545
32. Zheng Z, Deng W, Lou X, et al. Gasdermins: pore-forming activities and beyond. Acta Biochim Biophys Sin (Shanghai). 2020;52(5):467–474. doi:10.1093/abbs/gmaa016
33. Wu J, Sun J, Meng X. Pyroptosis by caspase-11 inflammasome-Gasdermin D pathway in autoimmune diseases. Pharmacol Res. 2021;165:105408. doi:10.1016/j.phrs.2020.105408
34. Hou J, Zhao R, Xia W, et al. PD-L1-mediated gasdermin C expression switches apoptosis to pyroptosis in cancer cells and facilitates tumour necrosis. Nat Cell Biol. 2020;22(10):1264–1275. doi:10.1038/s41556-020-0575-z
35. Zhang JY, Zhou B, Sun RY, et al. The metabolite alpha-KG induces GSDMC-dependent pyroptosis through death receptor 6-activated caspase-8. Cell Res. 2021;31:980–997. doi:10.1038/s41422-021-00506-9
36. Samstein RM, Lee CH, Shoushtari AN, et al. Tumor mutational load predicts survival after immunotherapy across multiple cancer types. Nat Genet. 2019;51(2):202–206. doi:10.1038/s41588-018-0312-8
37. Boumber Y. Tumor mutational burden (TMB) as a biomarker of response to immunotherapy in small cell lung cancer. J Thorac Dis. 2018;10(8):4689–4693. doi:10.21037/jtd.2018.07.120
38. Lawlor RT, Mattiolo P, Mafficini A, et al. Tumor mutational burden as a potential biomarker for immunotherapy in pancreatic cancer: systematic review and still-open questions. Cancers. 2021;13:13. doi:10.3390/cancers13133119
39. Tempero MA. NCCN guidelines updates: pancreatic cancer. J Natl Compr Canc Netw. 2019;17(5.5):603–605. doi:10.6004/jnccn.2019.5007
 © 2022 The Author(s). This work is published and licensed by Dove Medical Press Limited. The full terms of this license are available at https://www.dovepress.com/terms.php and incorporate the Creative Commons Attribution - Non Commercial (unported, v3.0) License.
By accessing the work you hereby accept the Terms. Non-commercial uses of the work are permitted without any further permission from Dove Medical Press Limited, provided the work is properly attributed. For permission for commercial use of this work, please see paragraphs 4.2 and 5 of our Terms.
© 2022 The Author(s). This work is published and licensed by Dove Medical Press Limited. The full terms of this license are available at https://www.dovepress.com/terms.php and incorporate the Creative Commons Attribution - Non Commercial (unported, v3.0) License.
By accessing the work you hereby accept the Terms. Non-commercial uses of the work are permitted without any further permission from Dove Medical Press Limited, provided the work is properly attributed. For permission for commercial use of this work, please see paragraphs 4.2 and 5 of our Terms.