Back to Journals » Risk Management and Healthcare Policy » Volume 15
Construction of a Personalized Insulin Resistance Risk Assessment Tool in Xinjiang Kazakhs Based on Lipid- and Obesity-Related Indices
Authors Yu L, Li Y, Ma R, Guo H, Zhang X, Yan Y, He J ![]() , Wang X, Niu Q, Guo S
, Wang X, Niu Q, Guo S ![]()
Received 3 December 2021
Accepted for publication 22 March 2022
Published 13 April 2022 Volume 2022:15 Pages 631—641
DOI https://doi.org/10.2147/RMHP.S352401
Checked for plagiarism Yes
Review by Single anonymous peer review
Peer reviewer comments 2
Editor who approved publication: Professor Haiyan Qu
Linzhi Yu,1,* Yu Li,1,* Rulin Ma,1 Heng Guo,1 Xianghui Zhang,1 Yizhong Yan,1 Jia He,1 Xinping Wang,1 Qiang Niu,1 Shuxia Guo1,2
1Department of Public Health, Shihezi University School of Medicine, Shihezi, Xinjiang, People’s Republic of China; 2Department of NHC Key Laboratory of Prevention and Treatment of Central Asia High Incidence Diseases, The First Affiliated Hospital of Shihezi University Medical College, Shihezi, Xinjiang, People’s Republic of China
*These authors contributed equally to this work
Correspondence: Shuxia Guo; Qiang Niu, Tel +86-1800-9932-625; 86-993-2057153, Fax +86-993-2057-153, Email [email protected]; [email protected]
Purpose: This study aimed to explore the relationship between obesity- and lipid-related indices and insulin resistance (IR) and construct a personalized IR risk model for Xinjiang Kazakhs based on representative indices.
Methods: This cross-sectional study was performed from 2010 to 2012. A total of 2170 Kazakhs from Xinyuan County were selected as research subjects. IR was estimated using the homeostasis model assessment of insulin resistance. Multivariable logistic regression analysis, least absolute shrinkage and selection operator penalized regression analysis, and restricted cubic spline were applied to evaluate the association between lipid- and obesity-related indices and IR. The risk model was developed based on selected representative variables and presented using a nomogram. The model performance was assessed using the area under the ROC curve (AUC), the Hosmer–Lemeshow goodness-of-fit test, and decision curve analysis (DCA).
Results: After screening out 25 of the variables, the final risk model included four independent risk factors: smoking, sex, triglyceride-glucose (TyG) index, and body mass index (BMI). A linear dose–response relationship was observed for the BMI and TyG indices against IR risk. The AUC of the risk model was 0.720 based on an independent test and 0.716 based on a 10-fold cross-validation. Calibration curves showed good consistency between actual and predicted IR risks. The DCA demonstrated that the risk model was clinically effective.
Conclusion: The TyG index and BMI had the strongest association with IR among all obesity- and lipid-related indices, and the developed model was useful for predicting IR risk among Kazakh individuals.
Keywords: lipid-related indices, obesity-related indices, insulin resistance, Xinjiang Kazakhs
Introduction
Insulin resistance (IR) is the core link and initiator of various metabolic diseases, including diabetes, metabolic syndrome, and cardiovascular disease.1 Thus, an early assessment of IR is critical for the prevention and treatment of these metabolic diseases. The homeostasis model assessment of insulin resistance (HOMA-IR) has been widely used in epidemiologic studies. Given that insulin measurement is expensive, HOMA-IR is not routinely measured in clinical practice. Obesity and lipid metabolism disorders are the primary causes of IR,2,3 which often precede the development of IR. Conventional lipid- and obesity-related indices include the body mass index (BMI), waist circumference (WC), triglycerides (TG), total cholesterol (TC), high-density lipoprotein (HDL-C), and low-density lipoprotein (LDL-C). Additionally, some novel indices such as the triglyceride-glucose (TyG) index, metabolic score for IR (METS-IR), single point insulin sensitivity estimator (SPISE), lipid accumulation product (LAP), TG/HDL-C, visceral fat index (VAI), body roundness index (BRI), conicity index (CoI), and a body shape index (ABSI) have been proven to be closely associated with IR.4–8 However, the representative markers of IR are different owing to variations in region, age, and metabolic status of the study objects. Kazakhs live in remote rural areas of Xinjiang, and the prevalence and incidence of metabolic diseases among this population are high.1,9 An economical and simplified IR assessment method has important implications for the primary prevention of metabolic disorders in the Kazakh population. Therefore, our study aimed to screen lipid- and obesity-related indices closely associated with IR and construct an IR risk model suitable for Kazakhs.
Methods
Study Population
This was a cross-sectional study conducted from 2010 to 2012 in Xinyuan County, Yili region, Xinjiang, Northwest China. A four-stage stratified (prefecture-county-township-village) random cluster sampling method was adopted. First, a prefecture (Yili) that represented the Kazakhs population in Xinjiang was selected. Second, a county (Xinyuan) was randomly selected from the prefecture and then a township (Nalati) from the county. Finally, six villages were selected from the township using a stratified sampling method. After excluding subjects with severe liver and kidney dysfunction, heart failure, and cancer; those with missing data, taking medications known to affect lipid levels, and younger than 18 years in age; and those who were pregnant, a total of 2170 participants were recruited for the study. The study was approved by the Ethics Committee of Shihezi University (reference number 2014LL22). All participants provided written informed consent at the beginning of the study. All procedures in this study followed the principles of the Declaration of Helsinki.
Data Collection
As part of an epidemiological survey, a questionnaire was conducted through one-on-one, in-person interviews to collect data on general characteristics such as age, gender, smoking, drinking and personal medical histories. During a physical examination, the subjects’ height, weight, WC, and blood pressure were measured by trained personnel according to standardized methods. The subjects wore light clothes and removed their shoes when the height and weight were measured. Their WC was measured at the midpoint between the lower border of the rib cage and the superior iliac crest during minimal respiration. The measurement accuracies for height, weight, and WC were 1 mm, 0.1 kg, and 1 mm, respectively. Sitting blood pressure was measured three times using an electronic blood pressure meter after the subject rested for 5 min, and the average was recorded. Biochemical parameters (plasma glucose and lipids) were estimated using an automatic biochemical analyzer (Olympus AU2700). Fasting serum insulin levels were determined using an enzyme-linked immunosorbent assay (Atomic Tech Co. Ltd, Beijing, China).
Calculation Formula for Related Indices
The related indices used in this study were BMI, VAI, LAP, TyG, CI, BRI, ABSI, METS-IR, SPISE, waist-hip ratio (WHR), and waist-to-height ratio (WHtR). The calculation formulas are provided below:
(1) BMI: weight (kg)/height (m2)
(2) VAI:10
VAI (male) = [WC (cm)/39.68−1.88 × BMI (kg/m2)] × [TG (mmol/L)/1.03] × [1.31/HDL-C (mmol/L)]
VAI (female) = [WC (cm)/36.58−1.89 × BMI (kg/m2)] × [TG (mmol/L)/0.81] × [1.52/HDL-C (mmol/L)]
(3) LAP:11
LAP (male) = [WC (cm)-65] × TG (mmol/L)
LAP (female) = [WC (cm)−58] × TG (mmol/L)
(4) TyG:12 Ln[(TG (mg/dl) × FPG (mg/dl)/2]
(5) CoI:13 0.109−1 × WC (m) × [weight (kg)/height (m)]1/2
(6) BRI:14. 364.2–365.5 × [1-π−2 × WC2 (m)/height2 (m)]1/2
(7) ABSI:15 WC (m)/[BMI2/3 (kg/m2) × height1/2 (m)]
(8) METS-IR:8 Ln [(2 × FPG (mg/dL)) + TG (mg/dL)] × BMI/Ln (HDL-C (mg/dL))
(9) SPISE:7 [600 × HDL^0.185 (mg/dL)/(TG^0.2 (mg/dL)× BMI^1.338)]
(10) WHR: WC (cm)/hip circumference (cm)
(11) WHtR: WC (cm)/height (cm)
Definitions
(1) IR was estimated using the homeostasis model assessment (HOMA) formula: [fasting glucose (mmol/L) × fasting insulin (μU/mL)]/22.5, and IR was defined as HOMA-IR values ≥ 75th percentile (3.45 in Kazakh population).16
(2) Smoking referred to subjects who smoked 100 cigarettes or more, or regularly smoked for more than 6 months.17
(3) Drinking was defined as drinking at least once a week on average for more than 6 months.18
Statistical Analysis
The general characteristics were described as the mean ± standard deviation (SD) or median (interquartile range) for continuous variables, and as the frequency (percentage) for categorical variables. Continuous variables were compared using the Student’s t-test or Mann–Whitney U-test according to the distribution of continuous variables, whereas the categorical variables were compared using a chi-square test. Association analyses were carried out in three steps: First, the least absolute shrinkage and selection operator (LASSO) regression model was applied to select the most representative variables. Second, multivariate logistic regression was applied to determine independent variables and use them to develop the IR risk model. Finally, the dose–response relationship between the continuous variables in the risk model and IR was investigated using restricted cubic splines. Multicollinearity was assessed using a variance inflation factor (VIF): a VIF value of >5 indicated multicollinearity.19 The discriminative ability of the risk model was evaluated using the area under the ROC curve, namely AUC. Furthermore, the calibration was investigated using a Hosmer–Lemeshow test, and a calibration plot was constructed for visual inspection. In addition, the DCA was used to determine clinical practicability. SPSS 23.0 and R 4.1.0 were also used for the statistical analysis. The LASSO regression was conducted using the “glmnet” package (version 2.0–16). The multivariate logistic regression analysis and calibration plots were applied using the “rms” package (version 5.1–3.1). The developed risk model was further presented using “DynNom” packages. The DCA was conducted using the “DCA” package (version 2.0). The original AUC and the AUC based on a 10-fold cross-validation were assessed using the pROC (version 1.18.0) and the cvAUC (version 1.1.0) packages, respectively. A value of P < 0.05 was considered statistically significant.
Results
Basic Characteristics of Study Subjects
The analysis included a total of 2170 subjects with a mean age of 44.19 ± 13.29, among which 1141 (52.58%) were female (Table 1). Age, proportion of smokers and drinkers, systolic blood pressure, diastolic blood pressure, TC, TG, LDL-C, TG/HDL-C, TC/HDL-C, WC, BMI, HP, WHR WHtR, VAI, LAP, CoI, BRI, TyG index, and METS-IR were higher in participants with IR (P < 0.05). By contrast, HDL-C and SPISE were lower in participants with IR (P < 0.05). Proportion of females and ABSI were not significantly different between the non-IR and IR groups.
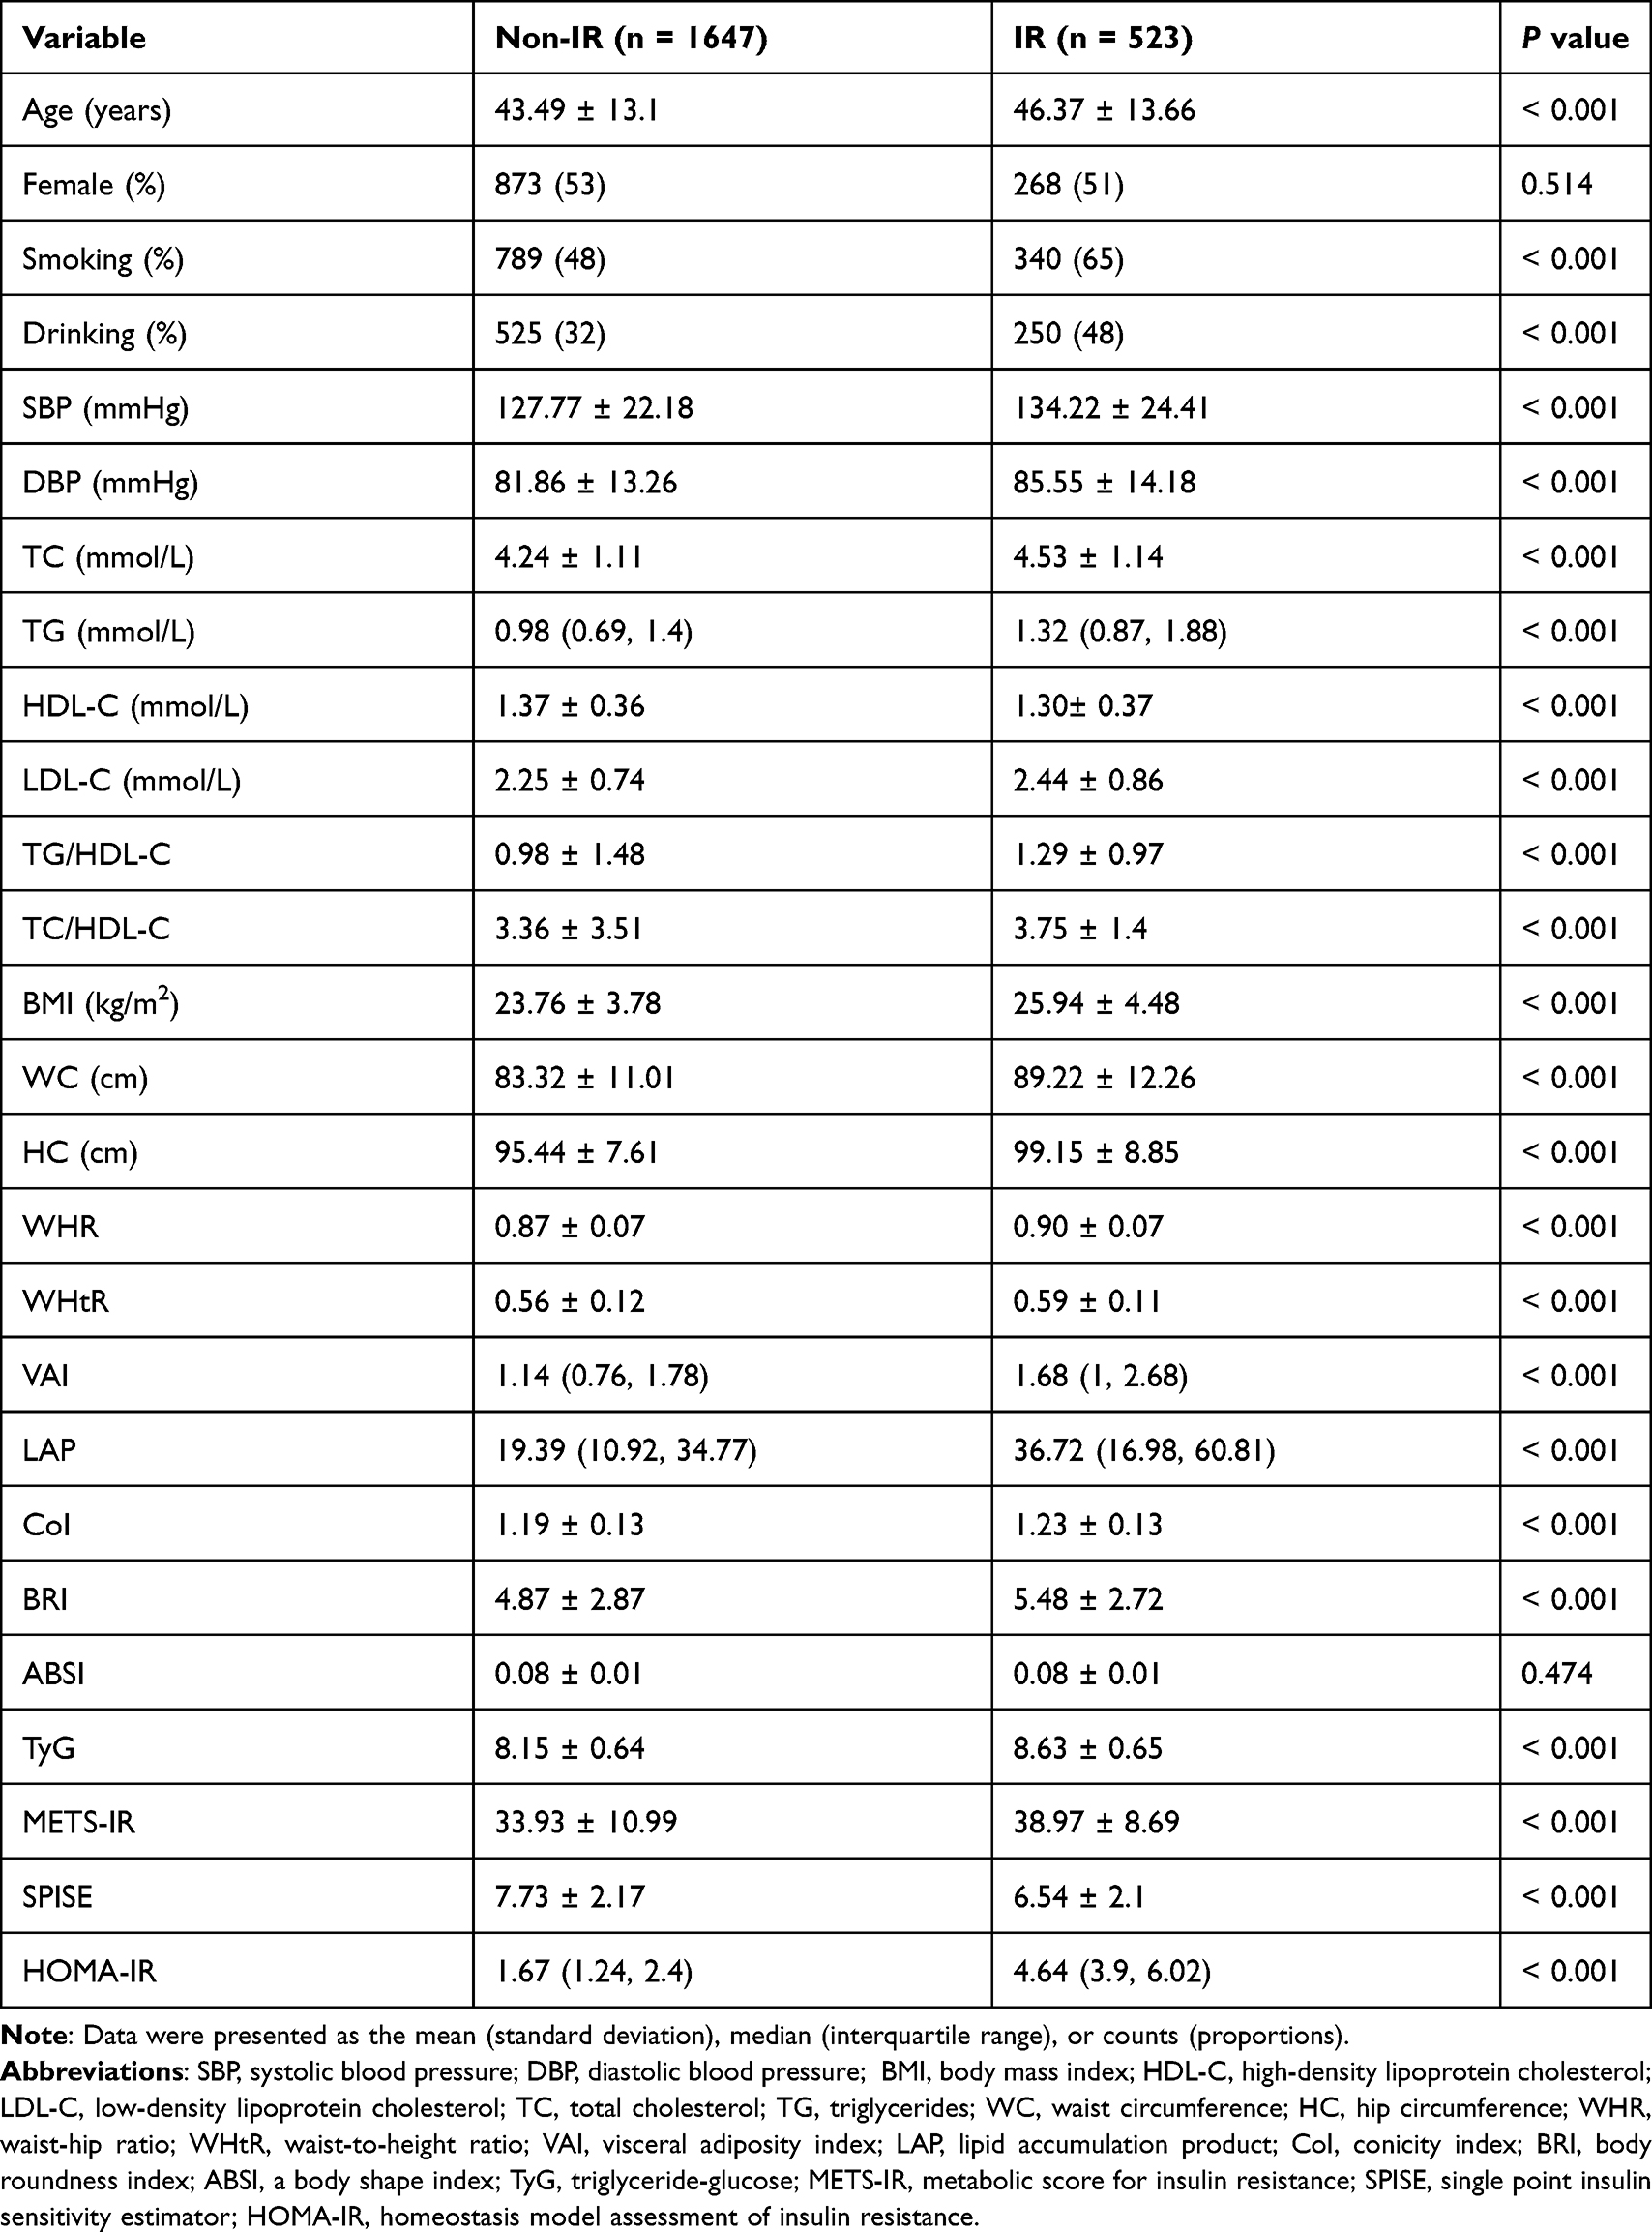 |
Table 1 Basic Characteristics of the Study Subjects |
Screening of Variables
LASSO regression was used to select the representative risk factors among the 25 variables listed in Table 1. The LASSO regression reduces the complexity of the model by adjusting the penalty term (lambda). As the value of lambda increased, the coefficients of some unimportant variables were close to zero (Figure 1B). To obtain a stripped-down model with high prediction performance, an optimal lambda value of 0.0128 was selected. The optimal lambda resulted in seven risk factors with non-zero coefficients: TG, WC, drinking, smoking, sex, TyG index, and BMI (Figure 1A).
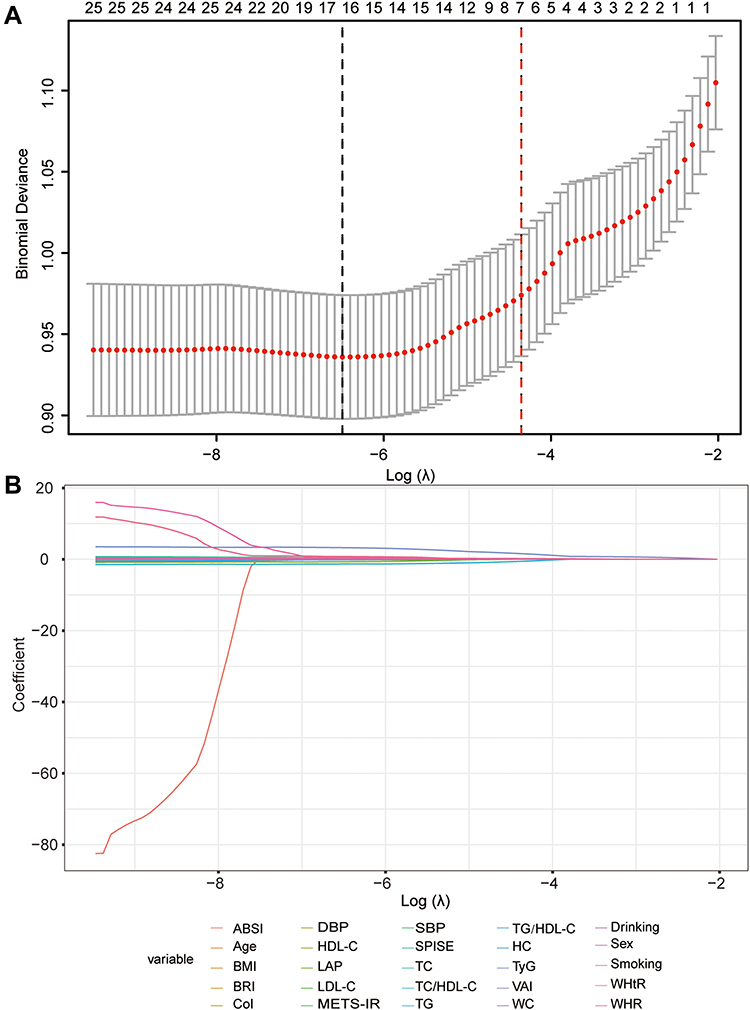 |
Figure 1 (A) Plot of deviance versus log (lambda). The optimal lambda was selected in the LASSO regression using a 10-fold cross-validation. The black and red dotted lines are drawn at the lambda value by the minimum criteria and one standard error above the minimum criterion. The red dotted line is the optimal lambda at which the model was the most parsimonious but with a high predictive performance. (B) LASSO regression coefficient path for 25 variables. The coefficient variation of the 25 variables with an increasing value of log (lambda). Abbreviations: LASSO, least absolute shrinkage and selection operator; SBP, systolic blood pressure; DBP, diastolic blood pressure; BMI, body mass index; HDL-C, high-density lipoprotein cholesterol; LDL-C, low-density lipoprotein cholesterol; TC, total cholesterol; TG, triglycerides; WC, waist circumference; HC, hip circumference; WHR, waist-hip ratio; WHtR, waist-to-height ratio; VAI, visceral adiposity index; LAP, lipid accumulation product; CoI, conicity index; BRI, body roundness index; ABSI, a body shape index; TyG, triglyceride-glucose; METS-IR, metabolic score for insulin resistance; SPISE, single point insulin sensitivity estimator. |
Multivariate Logistic Analysis
Multivariate logistic regression analyses were further conducted to determine independent risk factors of IR. TG was removed from the multivariate model owing to its collinearity with the TyG index variable. As shown in Table 2, four variables, ie, the TyG index, BMI, sex, and smoking status, were independent risk factors for IR (P < 0.05).
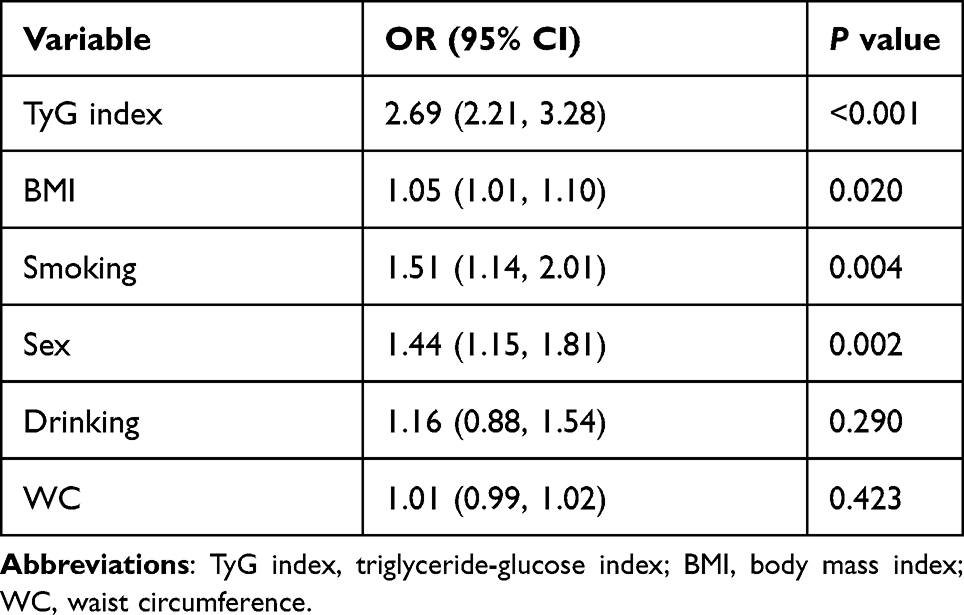 |
Table 2 Multivariate Logistic Regression Analyses for IR Risk |
Restricted Cubic Splines of Continuous Variables Associated with Risk of IR
Multivariable logistic regression with restricted cubic splines was used to evaluate the dose–response relationship of the continuous variables with IR risk. The results revealed that there was a linear association between BMI (P = 0.053 for nonlinearity) and the TyG index (P= 0.486 for nonlinearity) with IR risk (Figure 2).
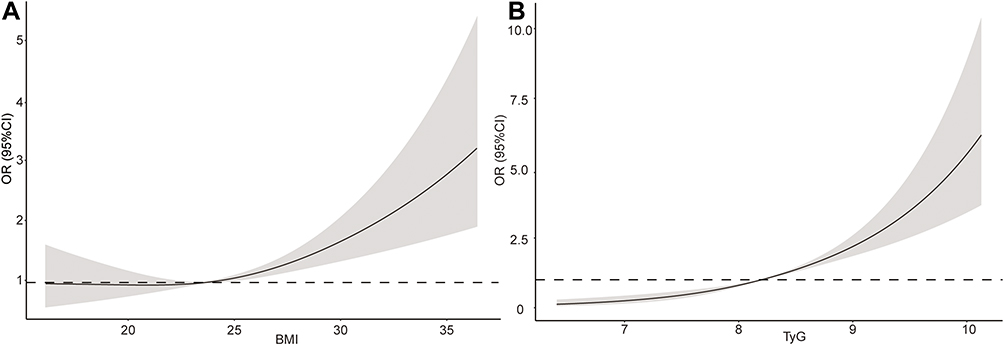 |
Figure 2 Cubic spline plots for (A) BMI and (B) TyG index. The black solid line shows the multivariate-adjusted odds ratio (OR), and the gray area shows a 95% confidence interval (CI), adjusted for variables in the multivariable logistic model. Abbreviations: TyG index, triglyceride-glucose index; BMI, body mass index. |
Risk Model Development
The final risk model presented using a nomogram included four independent risk factors: TyG index, BMI, sex, and smoking status (Figure 3). To better facilitate the clinical use of the model, an interactive web application was developed using the shiny package (https://proguo.shinyapps.io/DynNomapp/). To illustrate with an example, for a male non-smoker with a BMI of 23 kg/m2 and TyG of 8, the risk of developing IR was estimated to be 11%.
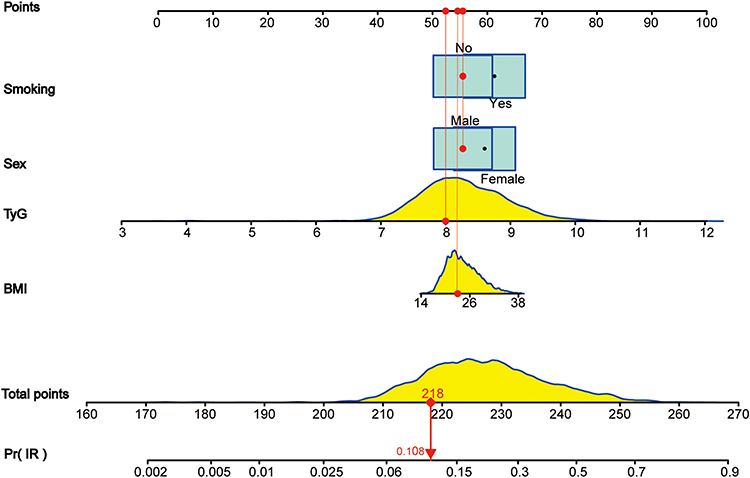 |
Figure 3 Development of IR risk nomogram. The box size indicates the distribution of the categorical variables (for smoking, a tiny box indicates smokers, and the giant box indicates non-smokers). To use the nomogram, the value of an individual subject is located on each variable axis, and we were able to determine the points of each variable by drawing a vertical line upward. The sum of the points of each variable is located on the “Total points” axis, and a red line downward determines the probability of IR risk. Abbreviations: TyG index, triglyceride-glucose index; BMI, body mass index. |
Risk Model Validation
The AUC values of our risk model was 0.720 (95% CI, 0.694–0.746) (Figure 4) based on an independent test and the (AUC) was 0.716 (95% CI, 0.690–0.743) based on a 10-fold cross-validation, indicating a good discriminative ability. The calibration plot displayed a good fit between the predicted and observed probabilities of the risk model (Figure 5). Furthermore, the Hosmer–Lemeshow goodness-of-fit-statistic was 12.69 (P = 0.123), indicating good calibration. The DCA shows that if the threshold probability of IR is between 0.16 and 0.62, the net benefit of the risk model is significantly higher than that of the two extreme strategies (Figure 6).
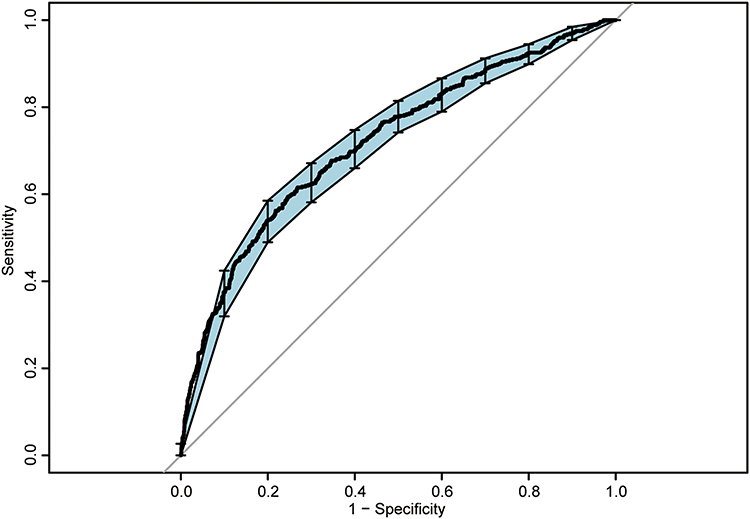 |
Figure 4 The area under the curve (AUC) for determining the discriminatory ability of the risk model. The AUC achieved was 0.720 (95% confidence interval (CI) 0.694–0.746). |
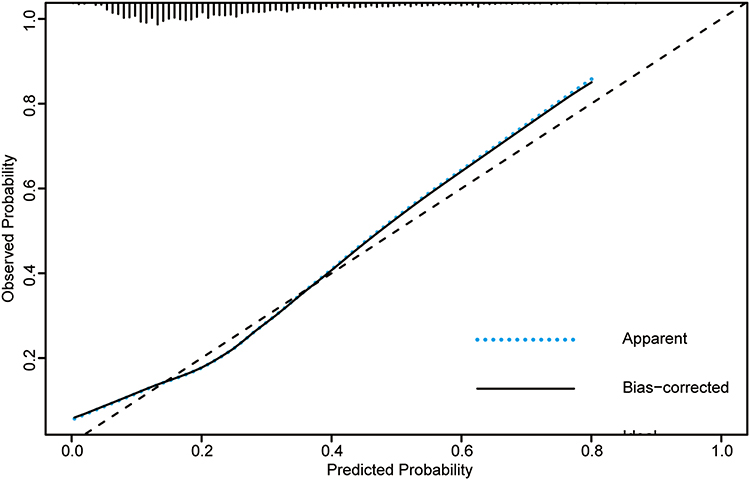 |
Figure 5 Calibration plot of the IR risk model. The x-axis shows the predicted risk of IR, and the y-axis shows the actual IR risk. The dashed 45° line is the reference of the calibration representing a perfect prediction by an ideal model. The figure shows two curves, ie, apparent (blue dotted line) and bias-corrected (black dotted line). The blue dotted line shows the performance of the IR risk model using the same data that were fit to the model, whereas the black line shows the performance of the IR risk model using data generated from 1000 bootstrap samples. |
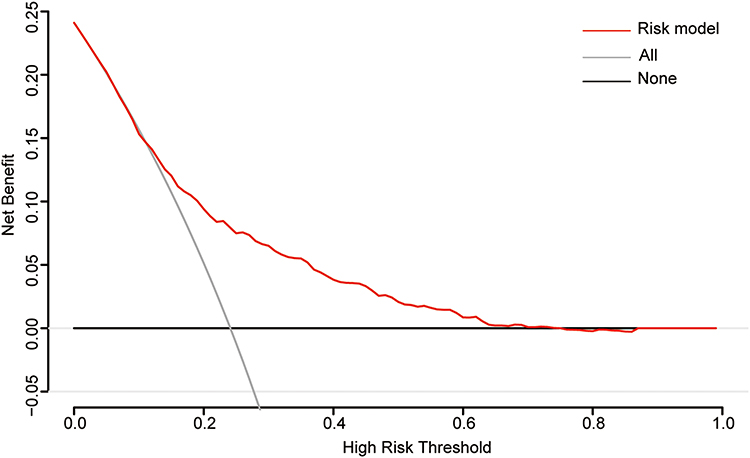 |
Figure 6 Decision curve analysis (DCA) of the risk model. The red line represents the risk model. The gray line represents the assumption that all people have IR (treat-all strategy), and the black line represents the assumption that no one has IR (treat-no one strategy). This demonstrates that when the threshold probability of IR is between 0.16 and 0.62, using this model would add more net benefit than the treat-all or treat-no-one strategies. |
Discussion
The Kazakh population in Xinjiang is at a high risk of contracting IR-driven diseases, such as cardiovascular diseases and metabolic syndrome, owing to their unique genetic background and eating habits characterized by high salt, carbohydrates, and animal fat.20,21 The hyperinsulinemic-euglycemic clamp and HOMA are both effective methods to assess IR. However, these methods are demanding, expensive, and time-consuming. In this context, our study aimed to provide a practical tool for IR evaluation among the Kazakh population to better intervene and treat IR-driven diseases.
A final risk model was established through LASSO regression analysis and multivariate logistic regression analysis, to select four significant variables, including the TyG index, BMI, gender, and smoking status, among the 25 potential risk factors. Spline analyses clarified the positive linear relationship between BMI, TyG index, and IR.
Our results suggest that smokers are at a higher risk of IR than non-smokers, similar to the results of Risque et al.22 Therefore, quitting smoking is vital in reducing IR risk. Consistent with our findings, a study by Mittendorf et al23 showed that women are at a high risk of IR, and this study also revealed that gender differences in terms of IR risk might be partially explained by sex-specific gene expression and sex hormones.
In addition to the general demographic characteristics, the BMI and TyG indices are also significant risk factors for IR. Established models based on data from polycystic ovary syndrome patients and the high-risk metabolic disorder populations both include BMI, as shown by Takahara et al24 and Jiang et al.25 BMI is closely associated with IR, and its association is even higher than body fat percentage.26 A 20-year cohort study by Risérus et al27 found that BMI was the best predictor of IR after comparing the predictive value of BMI, blood lipid level, exercise, socioeconomic status, and insulin levels for long-term IR. BMI has been more associated with IR than new lipid- and obesity-related indicators such as TG/HDL, LAP, VAI, and ABSI, consistent with several previous studies.5,28,29 However, not all studies support this view.30 Thus, further studies are required to investigate whether the novel lipid-and obesity-related indicators performed better than BMI for IR prediction. Most previous studies that included BMI as a categorical variable in the analysis, fail to observe the potential dose–response association between BMI and disease outcomes. A study in low cardiometabolic risk populations reported an increased risk of IR when BMI was ≥ 23 kg/m,231 which indicates that an increase in BMI has a significant association with an increased risk of IR even within the normal range, and some high-risk individuals may be ignored if the risk of IR is assessed based on the BMI categories. The results of the restricted cubic spline in this study show that the relationship between BMI and IR is linearly positive, and there is no significant threshold effect, suggesting that an appropriate weight loss is beneficial for reducing the risk of IR regardless of the presence or absence of obesity.
Several studies have shown that the TyG index is an independent predictor of IR-related diseases, such as diabetes, metabolic syndrome, and cardiovascular disease.32–34 Moreover, the TyG index can identify individuals with higher metabolic risk among people with normal BMI.35 Although METS-IR, SPISE, VAI, and LAP include four parameters, their performance in diagnosing metabolic abnormalities was lower than TyG composed of two indicators.36–38 The above studies suggested that the TyG index has a strong ability to identify metabolic disorders. A cross-sectional study with a large-scale sample in China showed that the TyG index has the most significant association with HOMA-IR.4 However, novel obesity-related indices such as BRI, ABSI, and CI were not accounted for in the study of Du et al,4 and only the Han population was involved. To the best of our knowledge, this association has not yet been explored in the Kazakh population. Compared to other lipid-related and obesity-related indicators, our study confirmed that the TyG index has the highest association with IR. There are three possible reasons why the TyG index outperformed the other indices. First, the TyG index combines TG and FPG levels, which are both hallmarks of IR. Second, the TyG index is closely related to cytokines such as adiponectin and C-reactive proteins,39 which play a crucial role in IR progression. Third, visceral fat accumulation, characterized by intense lipolytic activity, seems to be the reason for IR,40 and the TyG index is a good marker of visceral fat accumulation.
A risk model that uses low-cost, easy-to-measure variables was developed and validated, and at the same time, an application was developed to facilitate the use of the model in clinical practice, to help with individual evaluation of IR. This study has a few limitations. First, it was not possible to determine the causality between the studied variables and IR because of the cross-sectional design. Second, the subjects in the present study were Kazakhs from Northwest China. Therefore, the generalizability of our results to other ethnicities remains uncertain. Finally, we only analyzed limited number of factors, and the inclusion such as family history of diabetes and physical activity might prove to be valuable.
Conclusion
Overall, among all lipid- and obesity-related markers investigated, the TyG index and BMI were most strongly correlated with IR. Our model, including smoking, gender, BMI, and the TyG index as risk factors, had a reasonable degree of discrimination, calibration, and clinical usefulness. Furthermore, to diagnose IR in the early stages and thereby prevent IR-related diseases, close attention should be paid to people with these risk factors.
Abbreviations
CVD, cardiovascular disease; LASSO, least absolute shrinkage and selection operator; SBP, systolic blood pressure; DBP, diastolic blood pressure; WC, waist circumference; BMI, body mass index; HDL-C, high-density lipoprotein cholesterol; LDL-C, low-density lipoprotein cholesterol; TC, total cholesterol; TG, triglycerides; BMI, body mass index; WC, waist circumference; HC, hip circumference; WHR, waist-hip ratio; WHtR, waist-to-height ratio; VAI, visceral adiposity index; LAP, lipid accumulation product; CoI, conicity index; BRI, body roundness index; ABSI, a body shape index; TyG, triglyceride-glucose; METS-IR, metabolic Score for Insulin Resistance; SPISE, single point insulin sensitivity estimator.
Data Sharing Statement
The data are available on request from the corresponding author at [email protected].
Ethics Approval and Informed Consent
Ethical approval for the research was obtained from the Ethical Review Board of the First Affiliated Hospital of Shihezi University School of Medicine with identification number: SHZ2010LL01. All participants provided written informed consent at the beginning of the study. All procedures in this study followed the principles of the Declaration of Helsinki.
Acknowledgments
We sincerely thank all individuals who participated in this study and staff members from the clinical laboratory of the First Affiliated Hospital of Shihezi University School. Shuxia Guo and Qiang Niu are co-corresponding authors in the present study. Linzhi Yu and Yu Li are co-first authors for this study.
Funding
The Key Areas of Science and Technology Program (No. 2021AB030) Shihezi University independently funded and supported school-level scientific research projects (No.ZZZC202018A).
Disclosure
The authors report no conflict of interest in this work.
References
1. Jiang J, Cai X, Pan Y, et al. Relationship of obesity to adipose tissue insulin resistance. BMJ Open Diabetes Res Care. 2020;8(1):e000741. doi:10.1136/bmjdrc-2019-000741
2. Lei LM, Lin X, Xu F, et al. Exosomes and obesity-related insulin resistance. Front Cell Dev Biol. 2021;9:651996. doi:10.3389/fcell.2021.651996
3. Li Q, Gu W, Ma X, et al. Amino acid and biogenic amine profile deviations in an oral glucose tolerance test: a comparison between healthy and hyperlipidaemia individuals based on targeted metabolomics. Nutrients. 2016;8(6):379. doi:10.3390/nu8060379
4. Du T, Yuan G, Zhang M, Zhou X, Sun X, Yu X. Clinical usefulness of lipid ratios, visceral adiposity indicators, and the triglycerides and glucose index as risk markers of insulin resistance. Cardiovasc Diabetol. 2014;13(1):146. doi:10.1186/s12933-014-0146-3
5. Li G, Wu HK, Wu XW, et al. The feasibility of two anthropometric indices to identify metabolic syndrome, insulin resistance and inflammatory factors in obese and overweight adults. Nutrition. 2019;57:194–201. doi:10.1016/j.nut.2018.05.004
6. Nkwana MR, Monyeki KD, Lebelo SL. Body roundness index, a body shape index, conicity index, and their association with nutritional status and cardiovascular risk factors in South African rural young adults. Int J Environ Res Public Health. 2021;18(1):281. doi:10.3390/ijerph18010281
7. Paulmichl K, Hatunic M, Højlund K, et al. Modification and validation of the triglyceride-to-HDL cholesterol ratio as a surrogate of insulin sensitivity in white juveniles and adults without diabetes mellitus: the Single Point Insulin Sensitivity Estimator (SPISE). Clin Chem. 2016;62(9):1211–1219. doi:10.1373/clinchem.2016.257436
8. Bello-Chavolla OY, Almeda-Valdes P, Gomez-Velasco D, et al. METS-IR, a novel score to evaluate insulin sensitivity, is predictive of visceral adiposity and incident type 2 diabetes. Eur J Endocrinol. 2018;178(5):533–544. doi:10.1530/EJE-17-0883
9. Mazidi M, Kengne AP, Katsiki N, Mikhailidis DP, Banach M. Lipid accumulation product and triglycerides/glucose index are useful predictors of insulin resistance. J Diabetes Complications. 2018;32(3):266–270. doi:10.1016/j.jdiacomp.2017.10.007
10. Amato MC, Giordano C, Galia M, et al. Visceral Adiposity Index: a reliable indicator of visceral fat function associated with cardiometabolic risk. Diabetes Care. 2010;33(4):920–922. doi:10.2337/dc09-1825
11. Kahn HS. The “lipid accumulation product” performs better than the body mass index for recognizing cardiovascular risk: a population-based comparison. BMC Cardiovasc Disord. 2005;5(1):26. doi:10.1186/1471-2261-5-26
12. Guerrero-Romero F, Simental-Mendia LE, Gonzalez-Ortiz M, et al. The product of triglycerides and glucose, a simple measure of insulin sensitivity. Comparison with the euglycemic-hyperinsulinemic clamp. J Clin Endocrinol Metab. 2010;95(7):3347–3351. doi:10.1210/jc.2010-0288
13. Valdez R. A simple model-based index of abdominal adiposity. J Clin Epidemiol. 1991;44(9):955–956. doi:10.1016/0895-4356(91)90059-I
14. Thomas DM, Bredlau C, Bosy-Westphal A, et al. Relationships between body roundness with body fat and visceral adipose tissue emerging from a new geometrical model. Obesity. 2013;21(11):2264–2271. doi:10.1002/oby.20408
15. Krakauer NY, Krakauer JC. A new body shape index predicts mortality hazard independently of body mass index. PLoS One. 2012;7(7):e39504. doi:10.1371/journal.pone.0039504
16. Sun K, Lin D, Feng Q, et al. Assessment of adiposity distribution and its association with diabetes and insulin resistance: a population-based study. Diabetol Metab Syndr. 2019;11(1):51. doi:10.1186/s13098-019-0450-x
17. From the Centers for Disease Control and Prevention. Cigarette smoking among adults–United States, 1997. JAMA. 1999;282(22):2115–2116.
18. Che Q, Yang Y, Cheng G, et al. Decreased GFR and its joint association with type 2 diabetes and hypertension with prevalence and severity of carotid plaque in a community population in China. Diabetes Metab Syndr Obes. 2019;12:1263–1273. doi:10.2147/DMSO.S203545
19. Kim JH. Multicollinearity and misleading statistical results. Korean J Anesthesiol. 2019;72(6):558–569. doi:10.4097/kja.19087
20. Iwasaki M, Kobayashi K, Suzuki H, et al. Polymorphism of the ABO blood group genes in Han, Kazakh and Uygur populations in the Silk Route of northwestern China. Tissue Antigens. 2000;56(2):136–142. doi:10.1034/j.1399-0039.2000.560204.x
21. Zhai F, He Y, Wang Z, Hu Y. [Status and characteristic of dietary intake of 12 minority nationalities in China]. Wei Sheng Yan Jiu. 2007;36(5):539–541. Chinese.
22. Haj Mouhamed D, Ezzaher A, Neffati F, Douki W, Gaha L, Najjar MF. Effect of cigarette smoking on insulin resistance risk. Ann Cardiol Angeiol. 2016;65(1):21–25. doi:10.1016/j.ancard.2014.12.001
23. Mittendorfer B. Insulin resistance: sex matters. Curr Opin Clin Nutr Metab Care. 2005;8(4):367–372. doi:10.1097/01.mco.0000172574.64019.98
24. Takahara M, Katakami N, Kaneto H, Noguchi M, Shimomura I. Prediction of the presence of insulin resistance using general health checkup data in Japanese employees with metabolic risk factors. J Atheroscler Thromb. 2014;21(1):38–48. doi:10.5551/jat.18622
25. Jiang F, Wei K, Lyu W, Wu C. Predicting risk of insulin resistance in a Chinese population with polycystic ovary syndrome: designing and testing a new predictive nomogram. Biomed Res Int. 2020;2020:8031497. doi:10.1155/2020/8031497
26. Martinez KE, Tucker LA, Bailey BW, LeCheminant JD. Expanded normal weight obesity and insulin resistance in US adults of the national health and nutrition examination survey. J Diabetes Res. 2017;2017:9502643. doi:10.1155/2017/9502643
27. Risérus U, Arnlöv J, Berglund L. Long-term predictors of insulin resistance: role of lifestyle and metabolic factors in middle-aged men. Diabetes Care. 2007;30(11):2928–2933. doi:10.2337/dc07-0360
28. Huang X, Wang Q, Liu T, et al. Body fat indices as effective predictors of insulin resistance in obese/non-obese polycystic ovary syndrome women in the Southwest of China. Endocrine. 2019;65(1):81–85. doi:10.1007/s12020-019-01912-1
29. Tuo X, Yuan J, Wang XH, Xin Z. Identifying the insulin resistance index in nondiabetic Chinese subjects. Medicine. 2020;99(5):e19023. doi:10.1097/MD.0000000000019023
30. Ramezani Tehrani F, Minooee S, Azizi F. Comparison of various adiposity indexes in women with polycystic ovary syndrome and normo-ovulatory non-hirsute women: a population-based study. Eur J Endocrinol. 2014;171(2):199–207. doi:10.1530/EJE-14-0094
31. Okura T, Nakamura R, Fujioka Y, et al. Body mass index ≥23 is a risk factor for insulin resistance and diabetes in Japanese people: a brief report. PLoS One. 2018;13(7):e0201052. doi:10.1371/journal.pone.0201052
32. Liu EQ, Weng YP, Zhou AM, Zeng CL. Association between triglyceride-glucose index and type 2 diabetes mellitus in the Japanese population: a secondary analysis of a retrospective cohort study. Biomed Res Int. 2020;2020:2947067. doi:10.1155/2020/2947067
33. Chiu TH, Huang YC, Chiu H, et al. Comparison of various obesity-related indices for identification of metabolic syndrome: a population-based study from Taiwan Biobank. Diagnostics. 2020;10(12):1081. doi:10.3390/diagnostics10121081
34. Sánchez-íñigo L, Navarro-González D, Fernández-Montero A, Pastrana-Delgado J, Martínez JA. The TyG index may predict the development of cardiovascular events. Eur J Clin Invest. 2016;46(2):189–197. doi:10.1111/eci.12583
35. Morales-Gurrola G, Simental-Mendía LE, Castellanos-Juárez FX, Salas-Pacheco JM, Guerrero-Romero F. The triglycerides and glucose index is associated with cardiovascular risk factors in metabolically obese normal-weight subjects. J Endocrinol Invest. 2020;43(7):995–1000. doi:10.1007/s40618-020-01184-x
36. Yu XW, Wang L, Zhang WC, et al. Fasting triglycerides and glucose index is more suitable for the identification of metabolically unhealthy individuals in the Chinese adult population: a nationwide study. J Diabetes Investig. 2019;10(4):1050–1058. doi:10.1111/jdi.12975
37. Lee SY. Letter: cut-off values and clinical utility of surrogate markers for insulin resistance and beta-cell function to identify metabolic syndrome and its components among Southern Indian adults. J Obes Metab Syndr. 2021;30(4):403–404. doi:10.7570/jomes21065
38. Ahn N, Baumeister SE, Amann U, et al. Visceral adiposity index (VAI), lipid accumulation product (LAP), and product of triglycerides and glucose (TyG) to discriminate prediabetes and diabetes. Sci Rep. 2019;9(1):9693. doi:10.1038/s41598-019-46187-8
39. Vasques AC, Novaes FS, de Oliveira Mda S, et al. TyG index performs better than HOMA in a Brazilian population: a hyperglycemic clamp validated study. Diabetes Res Clin Pract. 2011;93(3):e98–e100. doi:10.1016/j.diabres.2011.05.030
40. Bullón-Vela V, Abete I, Tur JA, et al. Relationship of visceral adipose tissue with surrogate insulin resistance and liver markers in individuals with metabolic syndrome chronic complications. Ther Adv Endocrinol Metab. 2020;11:2042018820958298. doi:10.1177/2042018820958298
 © 2022 The Author(s). This work is published and licensed by Dove Medical Press Limited. The
full terms of this license are available at https://www.dovepress.com/terms
and incorporate the Creative Commons Attribution
- Non Commercial (unported, 3.0) License.
By accessing the work you hereby accept the Terms. Non-commercial uses of the work are permitted
without any further permission from Dove Medical Press Limited, provided the work is properly
attributed. For permission for commercial use of this work, please see paragraphs 4.2 and 5 of our Terms.
© 2022 The Author(s). This work is published and licensed by Dove Medical Press Limited. The
full terms of this license are available at https://www.dovepress.com/terms
and incorporate the Creative Commons Attribution
- Non Commercial (unported, 3.0) License.
By accessing the work you hereby accept the Terms. Non-commercial uses of the work are permitted
without any further permission from Dove Medical Press Limited, provided the work is properly
attributed. For permission for commercial use of this work, please see paragraphs 4.2 and 5 of our Terms.