Back to Journals » Journal of Inflammation Research » Volume 18
Construction of a Nomogram Model Based on the Pan-Immune-Inflammation Value for Prediction of Adverse Clinical Outcomes in Patients with Acute Exacerbation of Chronic Obstructive Pulmonary Disease
Authors Weng S, Huang Y, Wu X, Chen Q
Received 27 June 2025
Accepted for publication 10 October 2025
Published 17 October 2025 Volume 2025:18 Pages 14353—14364
DOI https://doi.org/10.2147/JIR.S546857
Checked for plagiarism Yes
Review by Single anonymous peer review
Peer reviewer comments 2
Editor who approved publication: Dr Cynthia Koziol-White
Shunhua Weng,1,* Yanjin Huang,2,* Xuejuan Wu,3 Qiong Chen4
1Department of Intensive Care Medicine, Xiamen Haicang Hospital, Xiamen, Fujian, People’s Republic of China; 2Department of Nursing, Xiamen Haicang Hospital, Xiamen, Fujian, People’s Republic of China; 3Department of Respiratory Medicine, Xiamen Haicang Hospital, Xiamen Haicang Hospital, Xiamen, Fujian, People’s Republic of China; 4Department of Rehabilitation Medicine, Xiamen Haicang Hospital, Xiamen, Fujian, People’s Republic of China
*These authors contributed equally to this work
Correspondence: Qiong Chen, Department of Rehabilitation Medicine, Xiamen Haicang Hospital, No. 89 Haiyu Road, Haicang District, Xiamen, Fujian, 361026, People’s Republic of China, Tel +86 177 50612461, Email [email protected]
Purpose: This study evaluated the predictive value of the pan-immune-inflammation value (PIV) and developed a nomogram that integrated the PIV to predict adverse clinical outcomes in patients with acute exacerbation of chronic obstructive pulmonary disease (AECOPD).
Patients and Methods: In a retrospective, single-center study, 522 patients with AECOPD were randomized 7:3 into the training and validation cohorts. Univariate and multivariate logistic regression were used to determine independent predictors of adverse clinical outcomes. After the optimal cutoff value for the PIV was determined, the training cohort was divided into the high-PIV and low-PIV groups. Receiver operating characteristic (ROC) curve, calibration curve, and decision curve analysis (DCA) were then performed to construct and validate the nomogram.
Results: The regression results identified age, serum albumin (ALB) level, partial pressure of carbon dioxide (PaCO2) level, and the PIV as independent predictors of adverse clinical outcomes, and they were included in the nomogram model. The AUCs of the nomogram model that included these four variables in the training and validation cohorts were 0.720 (95% confidence interval [CI]: 0.658– 0.783) and 0.733 (95% CI: 0.626– 0.840), respectively. The calibration curves of the two cohorts showed good prediction accuracy (Hosmer-Lemeshow test: both P > 0.05), and the DCA proved that the prediction model has some clinical value.
Conclusion: Age, ALB level, PaCO2 level, and the PIV are independent predictors of adverse clinical outcomes in patients with AECOPD and may help healthcare providers identify patients at high risk of adverse outcomes during early admission. Although promising, the nomogram model has only moderate predictive performance. Further studies are required to identify additional significant factors to develop a higher-performing prediction model with which to make more accurate decisions in clinical practice.
Keywords: pan-immune-inflammation value, nomogram, acute exacerbation of chronic obstructive pulmonary disease
Introduction
Chronic obstructive pulmonary disease (COPD) is a respiratory disorder characterized by persistent respiratory tract symptoms and partially irreversible airflow limitation.1 According to World Health Organization statistics, COPD is the third leading cause of death globally.2 Due to persistent exposure to COPD risk factors by global populations and worldwide aging, the incidence and disease burden of COPD are projected to increase continuously through 2030.3 Data from the 2025 Global Initiative for COPD (GOLD) Report indicate that the economic costs of COPD account for 56% of the total cost of respiratory diseases,4 with the economic cost of COPD exacerbation accounting for a large proportion of these costs.
Acute exacerbation of chronic obstructive pulmonary disease (AECOPD) refers to worsening of respiratory symptoms in patients with COPD due to infection, allergen, or air pollution, causing patients to seek additional treatment.4 There are many causes of AECOPD, including increased systemic inflammation,5,6 oxidative stress,7 and airway structure damage.8 Previous studies have shown that patients with AECOPD usually experience worsening of physical function, resulting in decreased quality of life. Compared with patients with stable COPD, patients with AECOPD are more prone to non-invasive/invasive advanced respiratory support and transfer to the intensive care unit (ICU). These risks not only increase their medical and economic burden but are also associated with increased risk of death.9–12 Therefore, identification of easily obtainable and clinically relevant prognostic markers to identify patients at risk of adverse outcomes may help in early prevention and improve the prognosis of patients with AECOPD.
The pan-immune-inflammation value (PIV) is a newly developed biomarker related to systemic inflammation. Derived by calculation of neutrophil (NEU), lymphocyte (LYM), monocyte (MON), and platelet (PLT) counts, the PIV can be obtained by a simple peripheral blood routine test.13 The PIV was first used to predict the survival outcomes of patients with different types of cancers.14 Subsequently, its correlation with clinical outcomes such as aortic calcification,15 myocardial infarction,16 pulmonary embolism,17 and other immune- and inflammation-related diseases has been validated. NEUs, LYMs, MONs, and PLTs are involved in many of the pathologic mechanisms in COPD (eg, inflammation, protease–antiprotease imbalance, and oxidative stress).18 Compared with other highly regarded composite measures (eg, BODE index, ADO index, and DOSE index),19–21 the PIV does not require a 6-minute walk test or pulmonary function test, making it more convenient for use in both routine and non-routine clinical settings. Two recent studies showed that the PIV was found to be associated with the prevalence and all-cause mortality of patients with COPD.22,23 However, to our knowledge, no study has examined the relationship between the PIV and adverse clinical outcomes in patients with AECOPD. To fill this research gap, this study first evaluated the predictive value of the PIV for the prognosis of patients with AECOPD. It then developed a nomogram that combined clinical characteristics easily obtainable during early hospitalization to predict adverse clinical outcomes in patients with AECOPD.
Materials and Methods
Study Design and Population
The data of patients with AECOPD who met all the inclusion criteria and none of the exclusion criteria were retrospectively collected from the Respiratory Medicine Department of Xiamen Haicang Hospital from January 2017 to November 2022 (before China implemented the COVID-19 category B policy). This study was approved by the Ethics Committee of Xiamen Haicang Hospital (LW-2024004), and the requirement for informed consent was exempted due to its retrospective design. This study was registered in the Chinese Clinical Trial Registry (ChiCTR2400079792).
Definitions
COPD diagnosis was based on the criteria in the GOLD Report, ie, a ratio of forced expiratory volume in the first second (FEV1) to forced vital capacity (FVC) (FEV1/FVC) of < 0.7 after bronchodilation.4 AECOPD was defined as a history of COPD and worsening of respiratory symptoms such as dyspnea, cough, and expectoration within 14 days of onset.24
Inclusion and Exclusion Criteria
The inclusion criteria were (1) hospitalization for AECOPD and (2) age ≥ 18 years. The exclusion criteria were (1) multiple hospital admissions for AECOPD (other than the first time); (2) length of hospitalization < 48 hours; (3) comorbid respiratory disorders such as bronchial asthma, pulmonary tuberculosis, or bronchiectasis; (4) comorbid malignant tumor or acquired human immunodeficiency virus infection; (5) use of immunosuppressants; and (5) missing > 20% data.
Measurement and Results
All clinical data were extracted from the Xiamen Haicang Hospital electronic medical record system and included demographic data and information regarding lifestyle habits, comorbidities, vital signs upon first measurement on admission, blood test results, and clinical outcomes. Data measured within 24 hours of admission were used for blood test results, including complete blood count and biochemical and blood gas analysis. For repeated measurement results within 24 hours, the results of the first measurement were used for analysis. The clinical outcomes included use of advanced respiratory support (non-invasive ventilation or invasive mechanical ventilation, length of hospitalization, ICU treatment status, and in-hospital mortality rate. Adverse clinical outcomes were defined as use of advanced respiratory support, transfer to the ICU, length of hospitalization > 14 days, or death during hospitalization. The following formula was used to calculate the PIV: neutrophil count (109/L) × platelet count (109/L) × monocyte count (109/L)/lymphocyte count (109/L).13
Statistical Analysis
Statistical analysis began by addressing missing data. Missing values were processed, and variables with a > 20% missing rate, including weight, body mass index, and serum procalcitonin, were excluded. When Little’s missing completely at random (MCAR) test was used to test whether there were random missing data in the samples, the test result was P < 0.001, meaning data were randomly missing. Subsequently, multiple imputation by chained equations (MICE) was used to construct 20 imputed datasets,25 and the mean values across these imputation datasets were used to represent the missing data.
Next, formation of the high- and low-PIV groups and identification of potential predictors were performed. Qualitative variables were expressed as the number and percentage, and the chi-square test was used for intergroup comparison. Quantitative variables were expressed as the mean ± standard deviation if they were normally distributed or the median (interquartile range) if they were non-normally distributed, and the t-test or Mann–Whitney U-test was used for inter-group comparison. The receiver operating characteristic (ROC) curve was used to calculate the Youden index based on the training cohort data. The PIV corresponding to the maximum Youden index was used as the optimal cutoff value to divide the cohort into the low-PIV and high-PIV groups. Univariate logistic regression was conducted to identify potential predictor variables, and the multicollinearity test was performed on variables with P < 0.05. Variables without severe multicollinearity were included in the multivariate logistic regression.
Lastly, the nomogram was developed. The “rms”, “nomogramFormula”, “Proc”, “ResourceSelection”, and “rmda” packages were used to construct the nomogram model, plot the ROC curve to measure the predictive power of the model, plot the calibration curve, perform the Hosmer-Lemeshow test to evaluate the goodness of fit of the model, and plot the decision curve analysis (DCA) curve to evaluate the clinical application results of the model. All data were input into Excel, and R 4.5.0 (R Foundation for Statistical Computing, https://www.r-project.org/) was used for data processing and analysis, nomogram plotting, and validation. P < 0.05 was considered statistically significant.
Results
Baseline Characteristics
Based on the inclusion and exclusion criteria, a total of 522 patients were included in this study, 70% of whom (n = 365) were randomized into the training cohort and 30% (n = 157) into the validation cohort (Figure 1). Poor outcomes were experienced by 24.9% (91/128) of the training cohort and 23.6% (37/128) of the validation cohort. The baseline characteristics of the cohorts (Table 1) were balanced and comparable, and no significant differences were observed between them (P >0.05 for all characteristics).
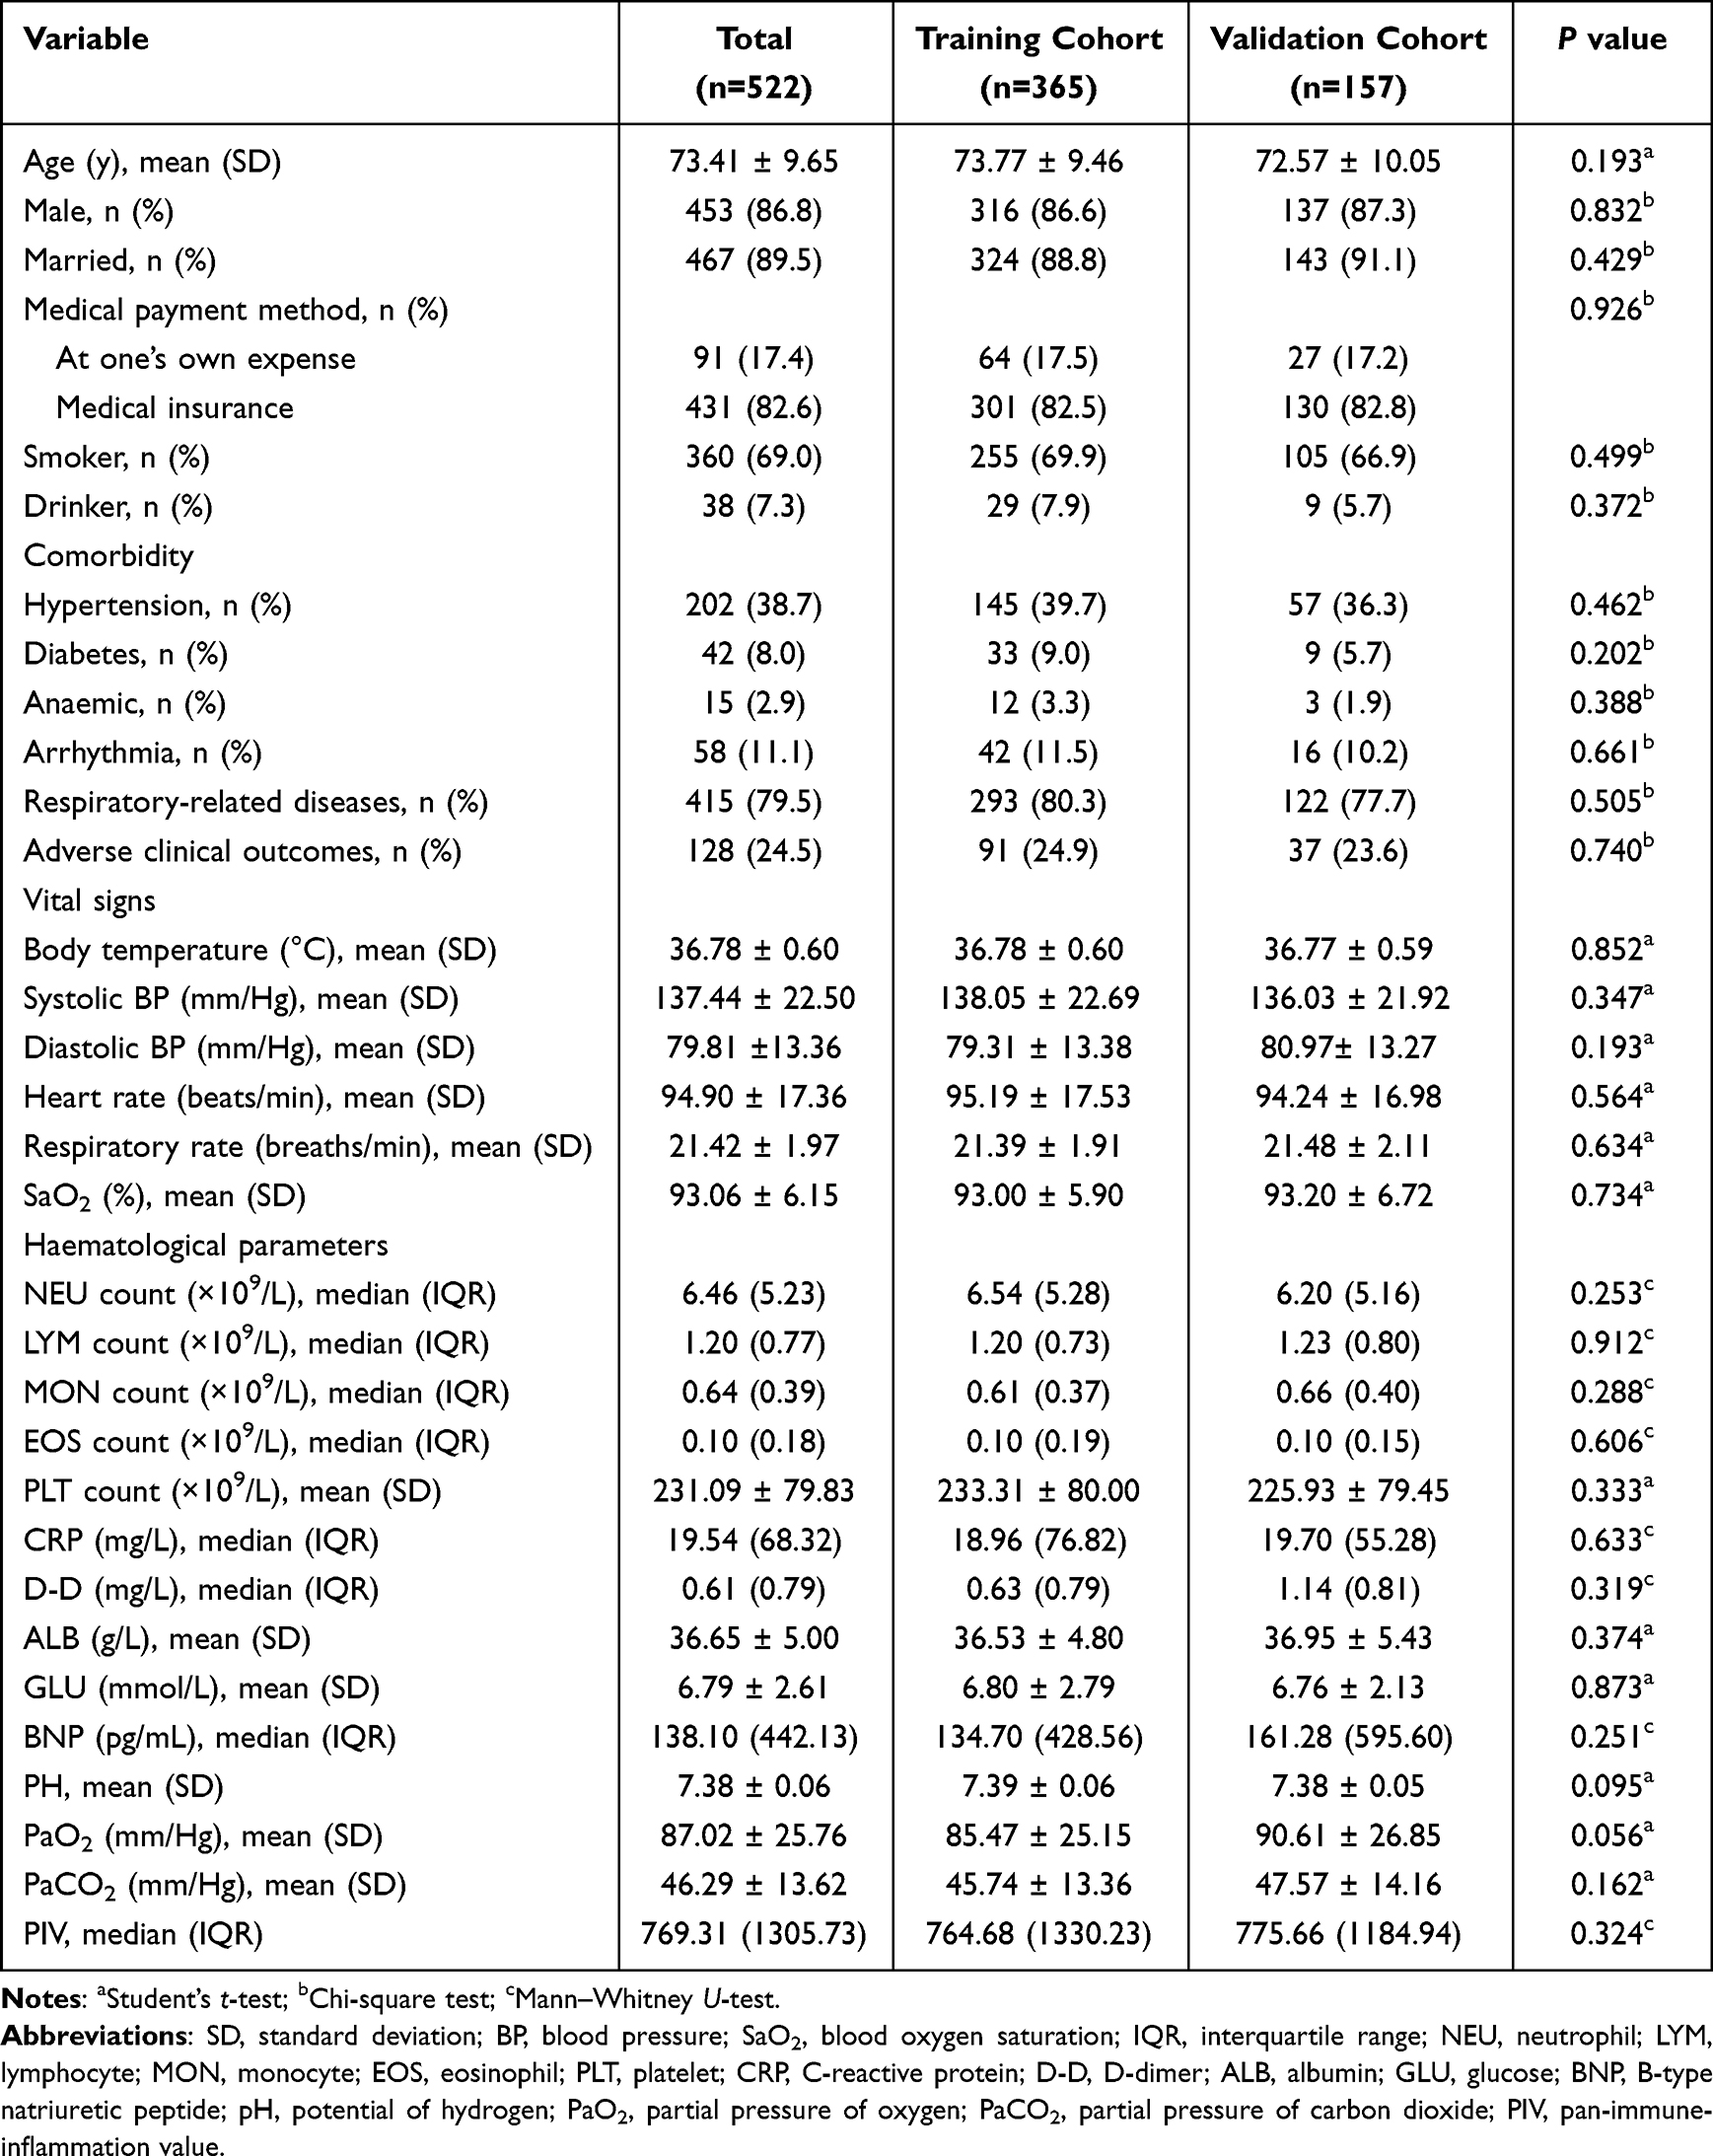 |
Table 1 Comparison of Baseline Characteristics of the Training and Validation Cohorts (N = 522) |
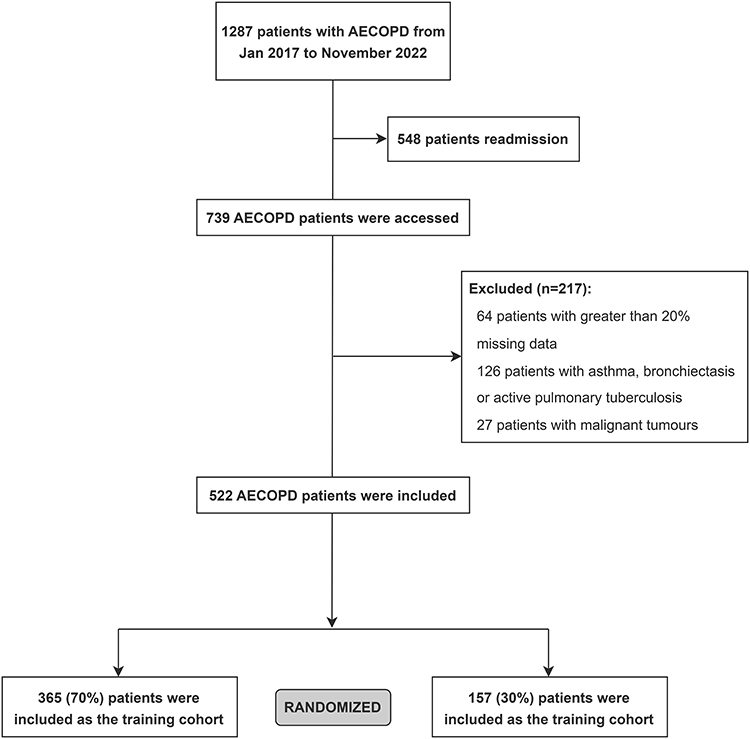 |
Figure 1 Recruitment flowchart. Abbreviation: AECOPD, acute exacerbation of chronic obstructive pulmonary disease. |
Correlation Between PIV and Clinical Characteristics
Based on the optimal cutoff value for the PIV, which was found to be 2515.027 (sensitivity: 28.6%, specificity: 89.8%; Figure S1), the training cohort was divided into the high-PIV group (PIV > 2515.027) and the low-PIV group (PIV ≤ 2515.027). Table 2 shows that the PIV level of patients with AECOPD was significantly correlated with age, adverse clinical outcomes, respiratory rate, neutrophil (NEU) count, lymphocyte (LYM) count, monocyte (MON) count, eosinophil (EOS) count, platelet (PLT) count, C-reactive protein (CRP) level, D-dimer (D-D) level, serum albumin (ALB) level, and partial pressure of carbon dioxide (PaCO2) level (all P < 0.05). Whereas the incidence of adverse clinical outcomes was 20.9% (65/311) in the low-PIV group, it was 48.1% (26/54) in the high-PIV group.
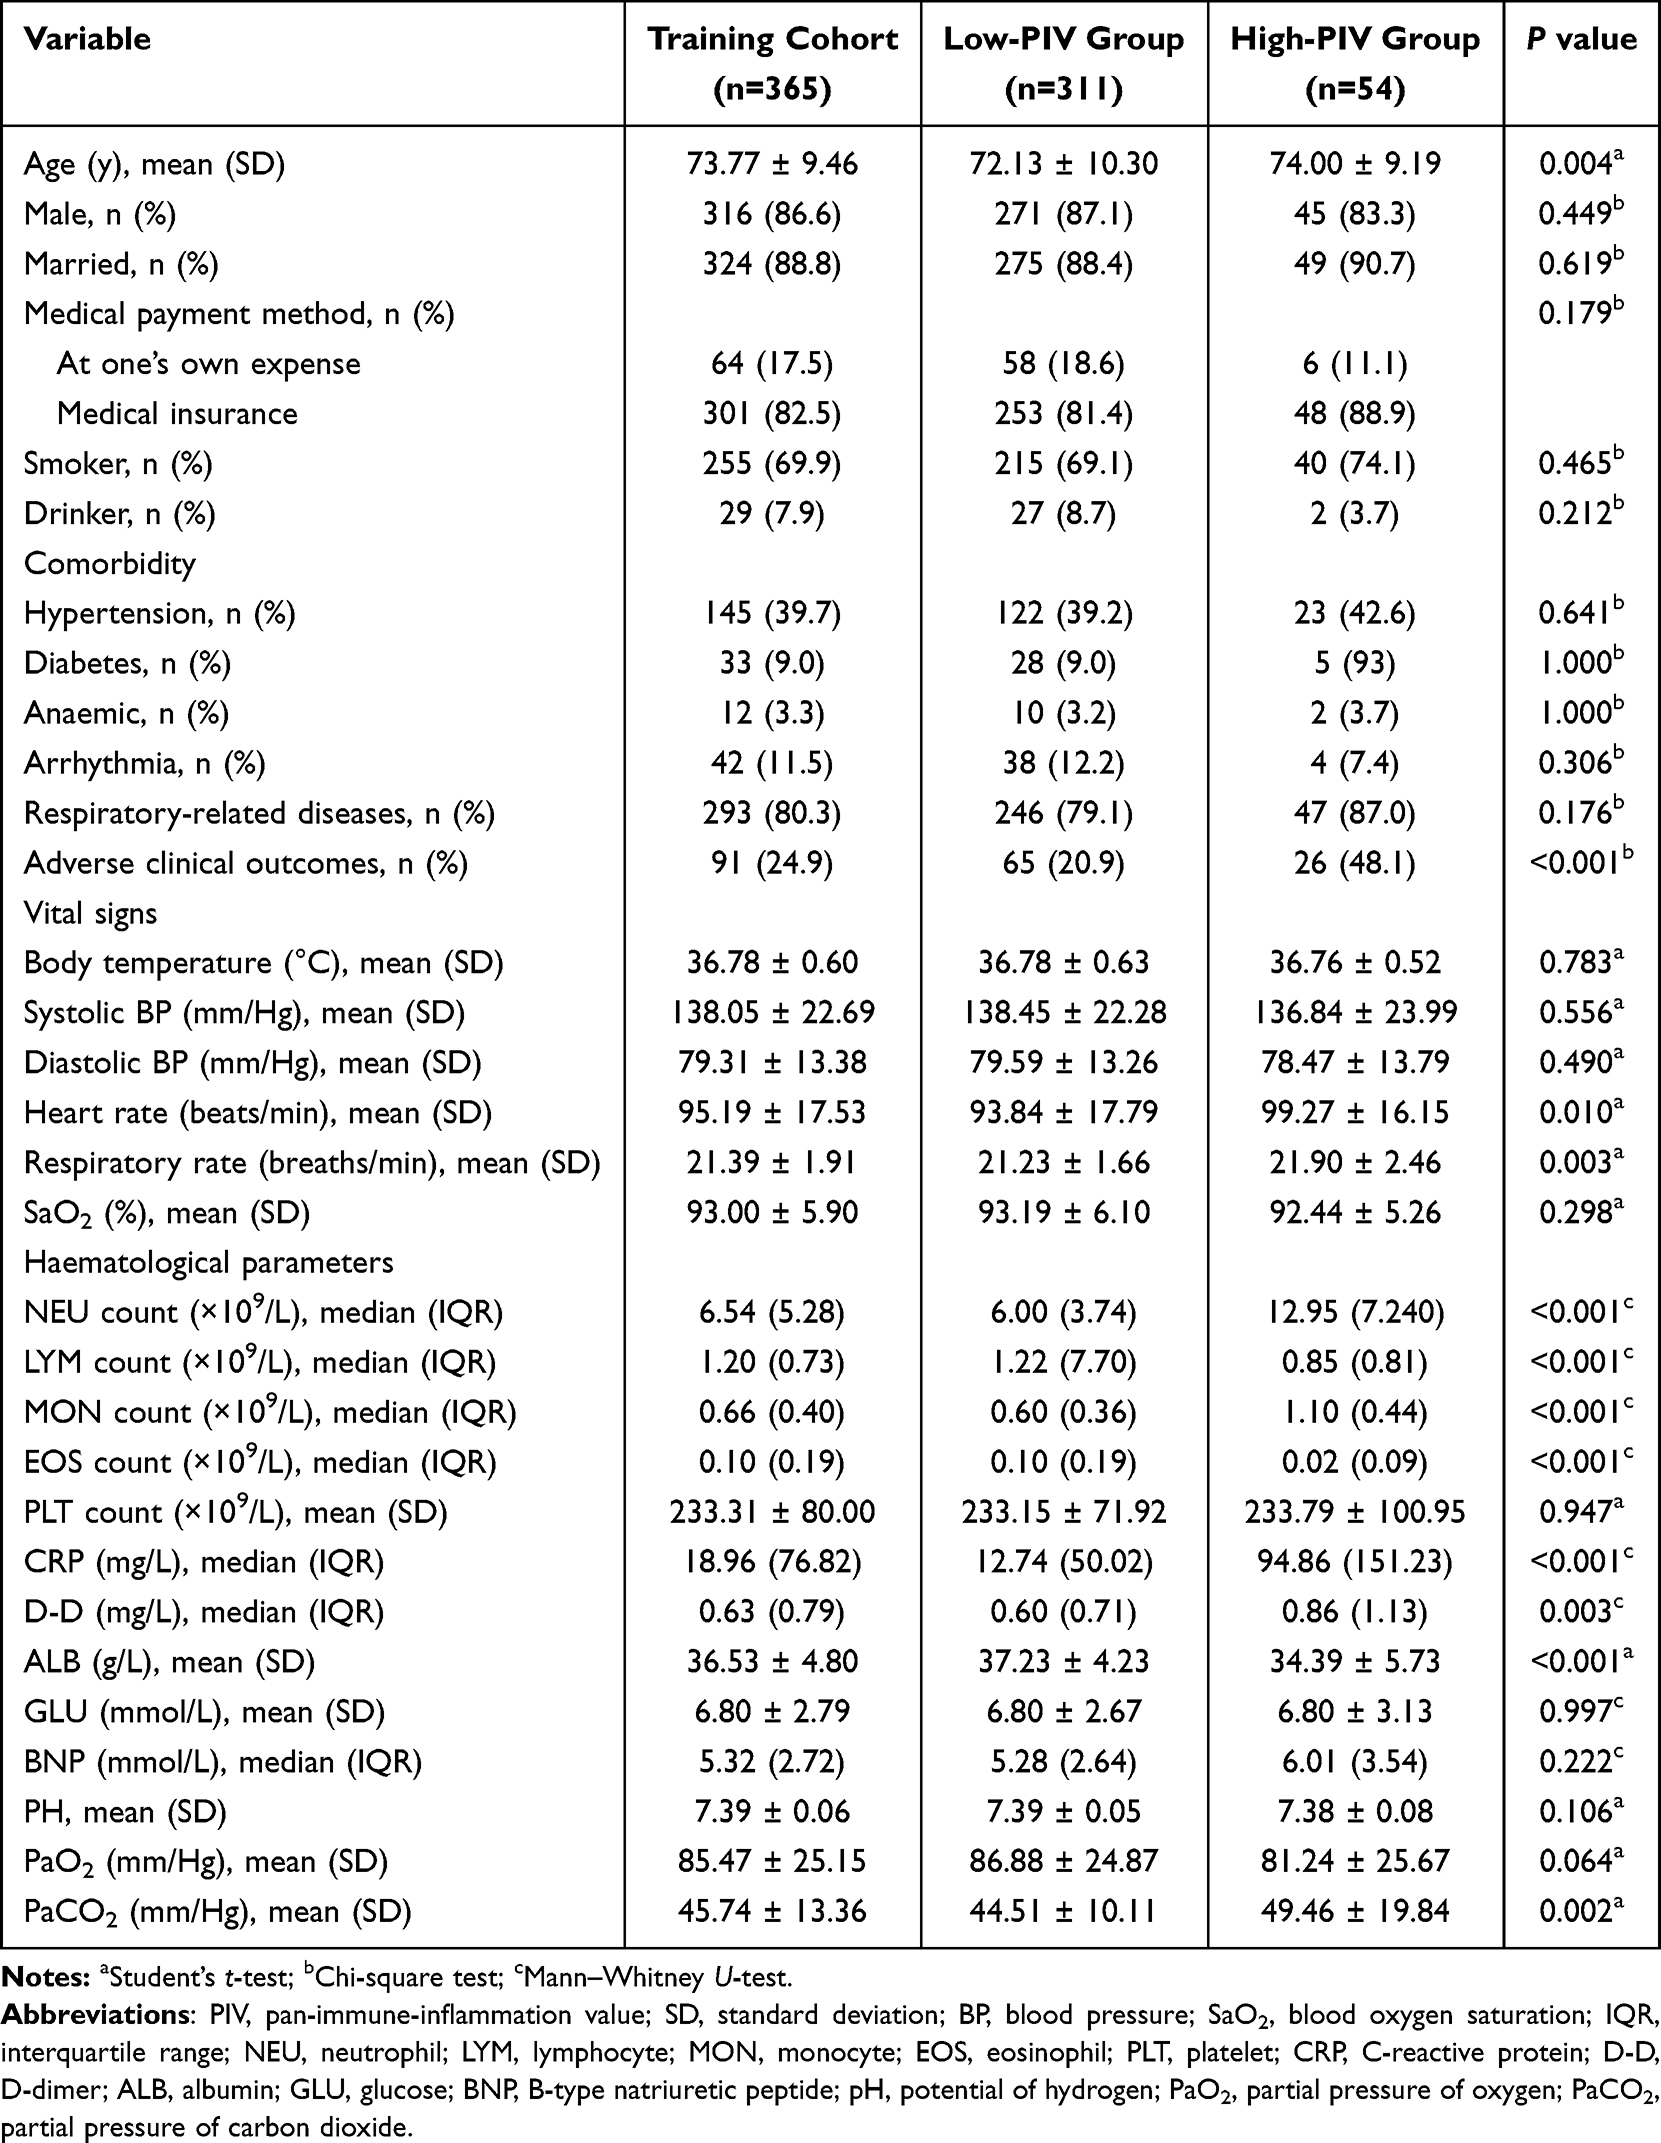 |
Table 2 Comparison of Clinical Characteristics of the High-PIV and Low-PIV Groups in the Training Cohort (N = 365) |
Independent Factors Affecting Adverse Clinical Outcomes
Univariate logistic regression (Table 3) showed that age, heart rate, respiratory rate, NEU count, LYM count, MON count, PLT count, CRP level, D-D level, ALB level, PaCO2 level, and PIV are significant factors associated with adverse clinical outcomes (all P < 0.05). When variables other than those used to calculate the PIV (NEU, LYM, MON, and PLT counts) were used for multicollinearity analysis, the resulting correlation matrix (Figure S2) revealed that multicollinearity was absent between these variables. Therefore, these variables were included in the multivariate logistic regression analysis. The results (Table 3) showed that age (odds ratio [OR]: 1.033, 95% confidence interval [CI]: 1.003–1.065, P = 0.033), ALB level (OR: 0.906, 95% CI: 0.852–0.964, P = 0.002), PaCO2 level (OR: 1.032, 95% CI: 1.012–1.052, P = 0.002), and high-PIV (OR: 2.132, 95% CI: 1.021–4.450, P = 0.044) are independent factors affecting adverse clinical outcomes in patients with AECOPD.
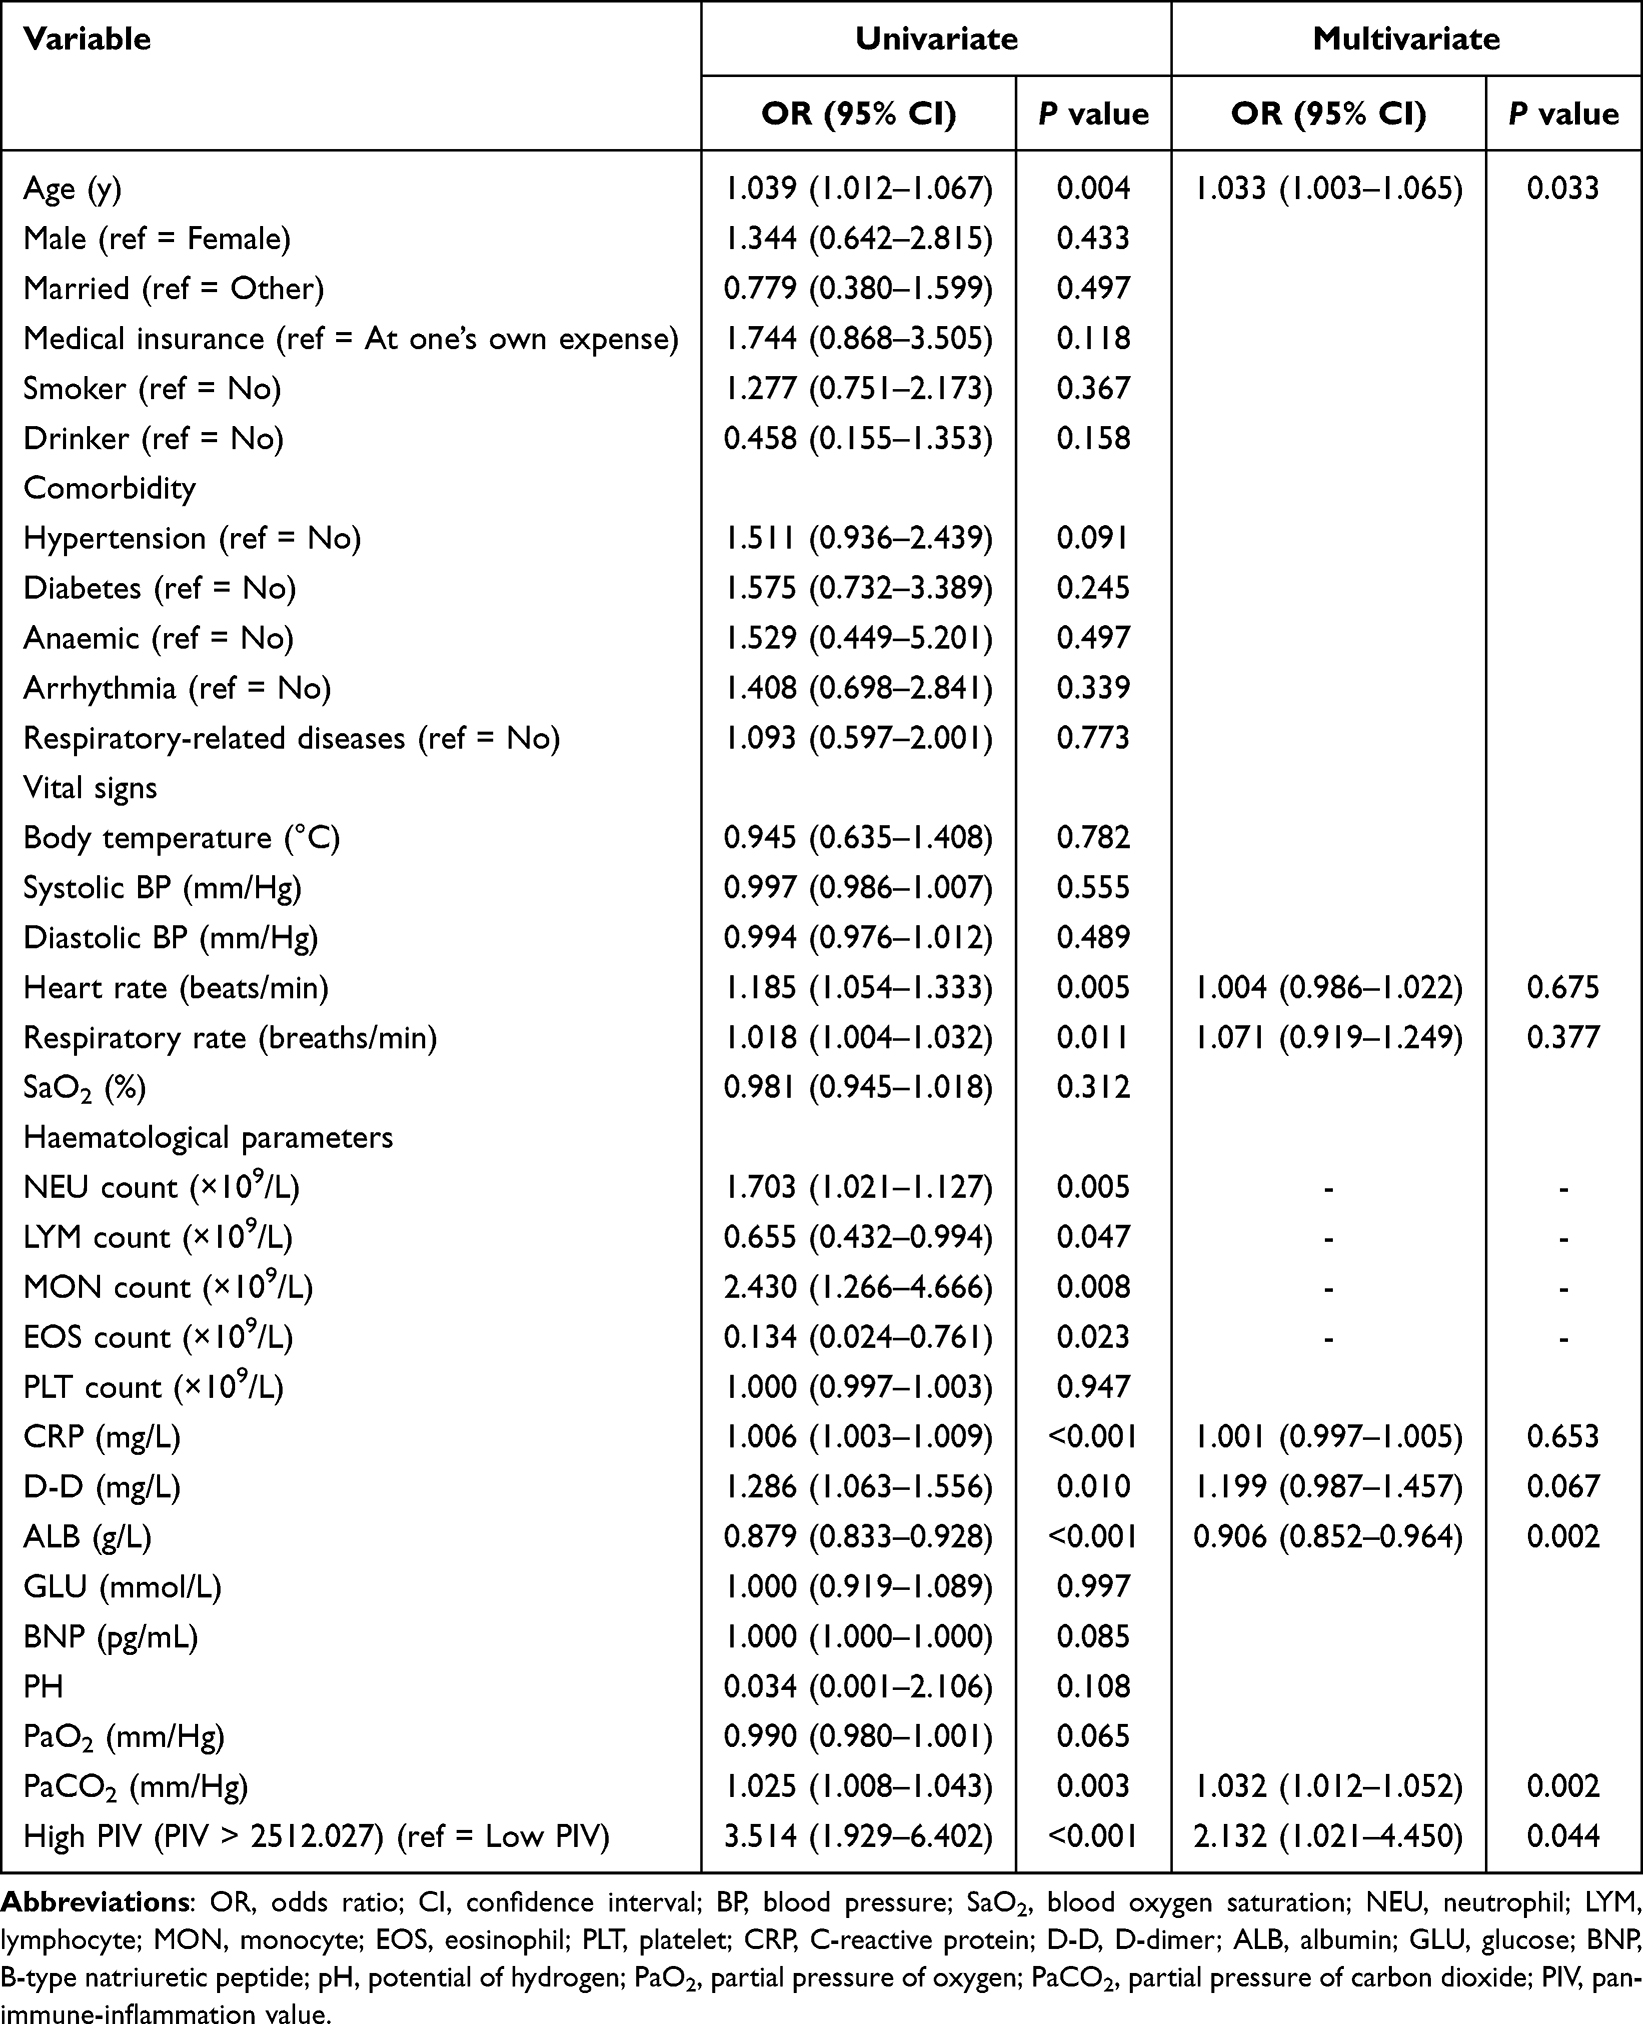 |
Table 3 Univariate and Multivariate Logistic Regression Analysis of Adverse Clinical Outcomes in the Training Cohort |
Nomogram Predictive Model Construction and Assessment
The four critical variables obtained from screening were used to construct the nomogram (Figure 2). In the nomogram, corresponding scores were determined based on the variables, and the sum of these values corresponded to the prediction probability of adverse clinical outcomes. In the training cohort, the area under the curve (AUC) of the nomogram for the prediction of adverse clinical outcomes was 0.720 (95% CI: 0.658–0.783), with a sensitivity of 0.593 and a specificity of 0.770 (Figure 3A). The calibration curve showed that the actual curve was close to the ideal curve, and the prediction probability of the model was consistent with the actual probability height (Hosmer-Lemeshow test: P = 0.690) (Figure 3B). These results proved that the model has some discrimination capacity and good calibration. Furthermore, the DCA curve demonstrated that this model exhibits good clinical effectiveness within the range of 0.2 to 0.8 (Figure 3C).
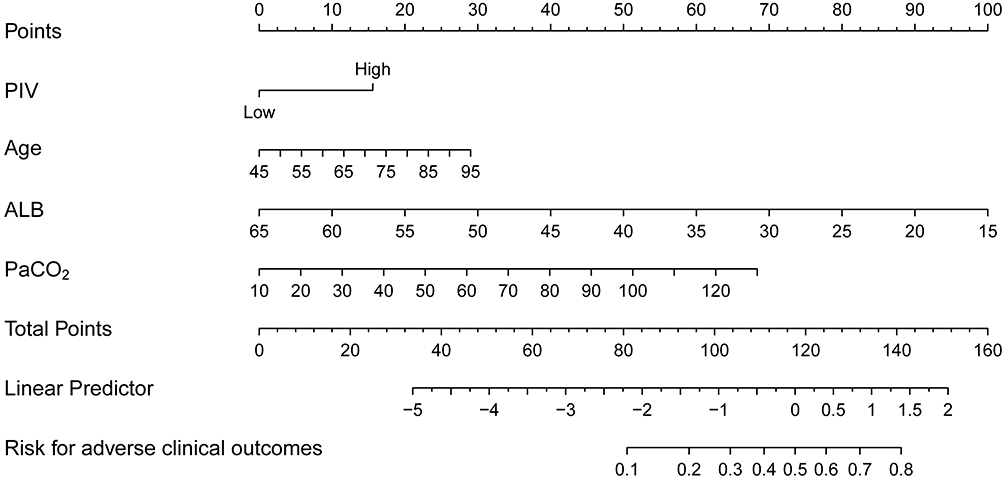 |
Figure 2 Nomogram for prediction of adverse clinical outcomes in patients with AECOPD. Abbreviations: AECOPD, acute exacerbation of chronic obstructive pulmonary disease; PIV, pan-immune-inflammation value; ALB, serum albumin; PaCO2, partial pressure of carbon dioxide. |
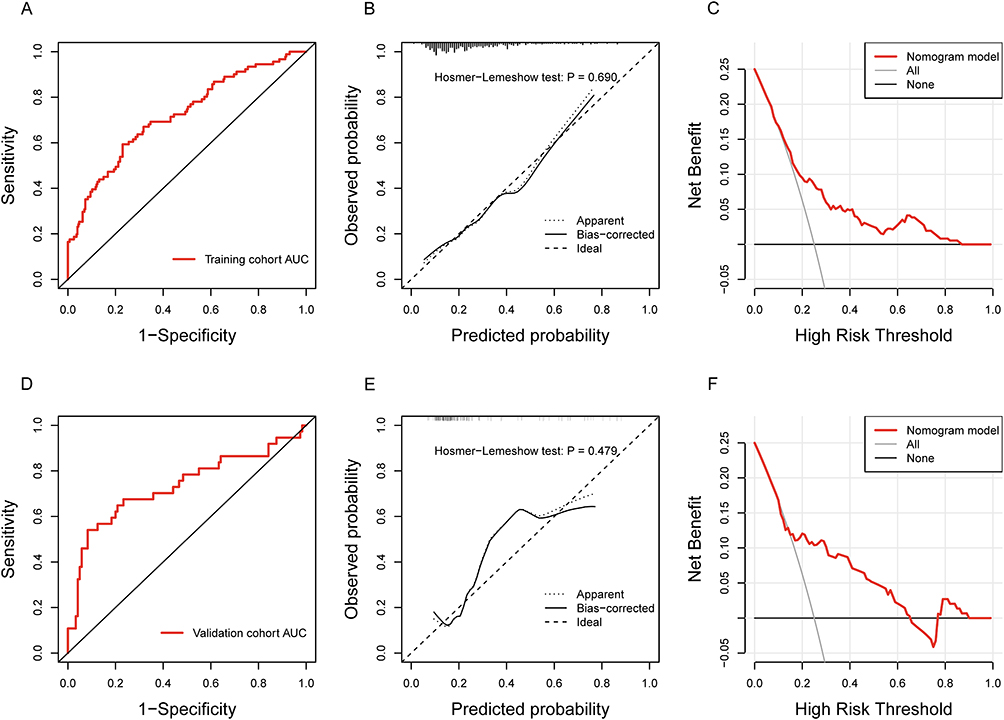 |
Figure 3 Development and validation of nomogram prediction model for adverse clinical outcomes in patients with AECOPD. Abbreviations: AECOPD, acute exacerbation of chronic obstructive pulmonary disease; AUC, area under the curve; ROC, receiver operating characteristic; DCA, decision curve analysis. Notes: (A) ROC curve of training cohort. (B) Calibration curve and Hosmer-Lemeshow test results of training cohort. (C) DCA curve of training cohort. (D) ROC curve of validation cohort. (E) Calibration curve and Hosmer-Lemeshow test results of validation cohort. (F) DCA curve of validation cohort. |
Validation of Nomogram Model
To validate the model, internal data from the same hospital were used for prediction and comparison with the findings of the training cohort. The model showed similar predictive power as the training cohort, with an AUC of 0.733 (95% CI: 0.626–0.840), sensitivity of 0.541, and specificity of 0.917 (Figure 3D). The calibration curve showed that the prediction probability of the model was consistent with the actual probability height (Hosmer-Lemeshow test: P = 0.479) (Figure 3E). In addition, the DCA curve demonstrated good net benefits within the range of 0.2 to 0.6 (Figure 3F). In summary, this model’s performance with the validation cohort was similar to that with the training cohort.
Discussion
Using real-world data for retrospective analysis, this study revealed that a high PIV is correlated with a higher probability of adverse clinical outcomes. This finding provides new clinical evidence for using the PIV to predict adverse clinical outcomes in patients with AECOPD. We then developed a combination model that includes four markers (age, ALB level, PaCO2 level, and high PIV) that can predict the risk of adverse clinical outcomes in patients with AECOPD.
The chronic inflammatory microenvironment in COPD is a complex ecosystem that involves different inflammatory cells, including neutrophils, macrophages, and eosinophils, and their secreted inflammatory mediators. Changes in these components jointly participate and cause related pathological changes that play vital roles in the occurrence and progression of AECOPD. Therefore, measurement of systemic inflammation can provide important information for evaluating and predicting the prognosis of patients with AECOPD. Recent studies have shown that patients with COPD have higher PIVs than patients without COPD, as well as that the survival probability of patients with COPD with high PIVs was significantly lower than those with low PIVs.22,23 In our study, the probability of adverse clinical outcomes was higher in patients with AECOPD in the high-PIV group compared with patients in the low-PIV group, showing that a high PIV is an independent risk factor for adverse outcomes in patients with AECOPD. These findings are consistent with those of previous studies, providing further evidence of the predictive power of the PIV in AECOPD.
Some novel and easily accessible inflammatory indicators based on the complete blood count at admission, such as the neutrophil-to-lymphocyte ratio (NLR) and platelet-to-lymphocyte ratio (PLR), are among the most frequently discussed AECOPD prognostic indicators. A literature review including 28 studies published in 2022 showed that AUC ranges of the NLR and the PLR to predict adverse clinical outcomes in AECOPD were 0.642–0.960 and 0.560–0.750, respectively.26 The variability in ranges was related to differences in NLR and PLR cut-off values and whether they were combined with other indicators (eg, CRP/ALB, NT-proBNP). Our AUC results (0.720) also fall within this range. It is worth noting that combining NLR with the PLR can further improve the predictive performance.27 Indeed, combination of NLR and PLR brings the categorization of inflammatory cells closer to that achieved with PIV.
The current consensus states that the acute inflammatory response is a main source of pathogenesis in AECOPD.28 From the perspective of PIV, neutrophils account for 70% of peripheral blood leukocytes. As an integral part of the immune system, neutrophils can secrete many proteases, release large amounts of oxygen-free radicals, and disrupt the dynamic oxidant-antioxidant equilibrium, which aggravates tissue damage and airway inflammation.29 Lymphocytes can secrete inflammatory mediators such as interleukin-4, interleukin-5, and interferon γ, thereby promoting tissue damage and emphysema during the acute exacerbation phase.30 Monocytes can increase macrophage count in the airways of patients with COPD during inflammation and promote the secretion of inflammatory mediators such as interleukin-1β and tumor necrosis factor α, which directly or indirectly participate in airway remodeling.31 In addition, activated platelets can release interleukin-1β to drive oxidative stress and chronic inflammation.32 As this previous research has demonstrated, four cellular components—neutrophils, lymphocytes, monocytes, and platelets—jointly participate in and affect the body’s inflammation and immune status. Therefore, the PIV, which combines measurement of these four main inflammatory/immune cells, can comprehensively reflect systemic inflammation and immune activation status. As such, the PIV has some role in predicting the prognosis of patients with AECOPD.
A large, retrospective, multicenter study in China observed that age > 80 years is an independent risk factor for in-hospital mortality in patients with AECOPD (OR: 3.82, 95% CI: 2.36–6.18, P < 0.001).33 Similarly, a prospective study found that older age (68–76 years) is an independent predictor of 90-day in-hospital mortality in patients with AECOPD (hazard ratio: 6.6, 95% CI: 1.5–28.8, P = 0.013).34 In agreement with these studies, our study showed that advanced age is an independent risk factor for poor outcomes in patients with AECOPD. This correlation between advanced age and poor outcomes may be attributed to the fact that increases in age lead to telomere shortening, increased cellular senescence, and DNA damage, which in turn lead to lung aging, which causes changes in lung function, lung remodeling, and decreased regeneration capacity, increasing susceptibility to lung diseases.35
Low levels of ALB, a widely used marker for evaluation of clinical malnutrition, can cause malnutrition and/or hypoproteinemia. Wang et al showed that low ALB level (OR: 0.92, 95% CI: 0.87–0.97, P = 0.001) is associated with prolongation of hospitalization in patients with AECOPD.36 Hu et al found that hypoproteinemia is an independent risk factor for mortality in patients with AECOPD who visited the emergency department.37 These findings, which are similar to our study results, may be attributed to the fact that continuous inflammatory responses lead to progressive loss of important protein components, thereby leading to adverse outcomes.38 A study of 4434 patients also demonstrated that ALB levels are negatively correlated with different inflammation markers, including CRP and leukocyte levels.39 Therefore, ALB can be considered a marker of inflammatory response to some extent, and a decrease in ALB level can reflect a worsening of clinical status or an increase in inflammation in patients with AECOPD.40,41
In an investigation of 508 patients with AECOPD, Hu et al found that PaCO2 > 50 mmHg could predict prognosis.37 Other studies also reported that higher PaCO2 is significantly correlated with a longer length of hospitalization. A recent meta-analysis observed that out of 53 studies that aimed to predict AECOPD prognosis, 20.8% included PaCO2 in their prediction model. This observation accords with our inclusion of PaCO2 in our model, which was based on our finding that PaCO2 reflected the severity of respiratory failure.
Although our study was the first to develop a PIV-based nomogram model to predict adverse clinical outcomes in patients with AECOPD, it has several limitations. First, the performance of the prediction model was not as high as we expected; with an AUC of 0.720, it has a moderate prediction value. The moderate performance of the model may be due to the lack of inclusion of important predictors. Their absence can be attributed to our limitation of variables to those easily measured during the early stage of hospitalization, such as laboratory test markers measured within 24 hours, and our limitation of participants to patients hospitalized for AECOPD for the first time. In addition, we removed several variables because the missing data rate was > 20%, which may have caused us to miss potential predictors that could not be obtained during the early stage of hospitalization. Second, some of our participants were missing important data, such as the PIV and ALB levels, which may have led to bias. However, we used Little’s MCAR test and MICE to minimize the impact of missing data on the study results as much as possible and did not directly exclude patients with incomplete data. A third limitation is that we only conducted internal validation. In future studies, cohorts from different time periods and different institutions should be selected for external validation. The fourth limitation was that, considering the relatively small number of patients in the high-PIV group, the association between different PIV levels and specific pathologies in AECOPD patients was not explored. Lastly, the risk of selection bias was unavoidable due to the retrospective design of this study. Prospective studies with large sample sizes are needed to validate the effectiveness of PIV in predicting the prognosis of patients with AECOPD.
Conclusion
This study demonstrated that the PIV is an independent predictor of adverse clinical outcomes in patients with AECOPD. Therefore, use of the PIV may help healthcare providers in the identification of patients with AECOPD with adverse outcomes and promptly adjust and optimize their treatment strategies. The prediction model constructed in this study using four markers with independent predictive value (age, ALB level, PaCO2 level, and high PIV) has moderate predictive value, with the validation cohort and training cohort showing similar performance. Further studies are needed to optimize the model for better application in clinical practice.
Patient Data Confidentiality Statement
This study acknowledges and respects the privacy rights of all patients or research participants under the laws of the People’s Republic of China, and the researchers will maintain confidentiality of any personal information of all patients or research participants in accordance with legal provisions and common practices in the medical industry. The use of the data obtained in this study was limited to the following purposes: statistical analysis of risk factors for adverse clinical outcomes in patients with acute exacerbation of chronic obstructive pulmonary disease, and construction and validation of prediction models. The medical records of patients or research participants are kept in the hospital according to regulations. All statistical analyses in this retrospective study were conducted based on anonymized patient data. Due to the retrospective nature of this study, the Ethics Committee of Xiamen Haicang Hospital approved the study and determined that written informed consent was not required.
Data Sharing Statement
The data will be shared on reasonable request to the corresponding author.
Ethics Approval and Informed Consent
All procedures performed in this study adhered to the ethical standards of the Ethics Committee of Xiamen Haicang Hospital and the 1964 Helsinki Declaration and its later amendments or comparable ethical standards. To preserve patient privacy and data confidentiality, identifiable patient information was removed from the data before analysis. All analyses in this retrospective study were performed based on anonymized patient data. Due to the retrospective design, the ethics committee waived the requirement for written informed consent.
Acknowledgments
We thank LetPub (www.letpub.com) for its linguistic assistance during the preparation of this manuscript.
Funding
This study was supported by the Xiamen Medical and Health Guidance Project, China (No.3502Z20244ZD1362).
Disclosure
The authors declare that they have no conflicts of interest related to this work.
References
1. Agustí A, Celli BR, Criner GJ, et al. Global initiative for chronic obstructive lung disease 2023 report: GOLD executive summary. Am J Respir Crit Care Med. 2023;207(7):819–837. doi:10.1164/rccm.202301-0106PP
2. World Health Organization. The top 10 causes of death; 2022. Available from: https://www.who.int/news-room/fact-sheets/detail/the-top-10-causes-of-death.
3. Mathers CD, Loncar D. Projections of global mortality and burden of disease from 2002 to 2030. PLoS Med. 2006;3(11):e442. doi:10.1371/journal.pmed.0030442
4. Global Initiative for Chronic Obstructive Lung Disease. GLOBAL STRATEGY FOR PREVENTION, DIAGNOSIS AND MANAGEMENT OF COPD: 2025 report; 2025. Available from: https://goldcopd.org/2025-gold-report/.
5. Papi A, Bellettato CM, Braccioni F, et al. Infections and airway inflammation in chronic obstructive pulmonary disease severe exacerbations. Am J Respir Crit Care Med. 2006;173(10):1114–1121. doi:10.1164/rccm.200506-859OC
6. Aaron SD, Angel JB, Lunau M, et al. Granulocyte inflammatory markers and airway infection during acute exacerbation of chronic obstructive pulmonary disease. Am J Respir Crit Care Med. 2001;163(2):349–355. doi:10.1164/ajrccm.163.2.2003122
7. Rahman I, MacNee W. Oxidative stress and regulation of glutathione in lung inflammation. Eur Respir J. 2000;16(3):534–554. doi:10.1034/j.1399-3003.2000.016003534.x
8. Barnes PJ. Cellular and molecular mechanisms of chronic obstructive pulmonary disease. Clin Chest Med. 2014;35(1):71–86. doi:10.1016/j.ccm.2013.10.004
9. Fang X, Wang X, Bai C. COPD in China: the burden and importance of proper management. Chest. 2011;139(4):920–929. doi:10.1378/chest.10-1393
10. Mathioudakis AG, Janssens W, Sivapalan P, et al. Acute exacerbations of chronic obstructive pulmonary disease: in search of diagnostic biomarkers and treatable traits. Thorax. 2020;75(6):520–527. doi:10.1136/thoraxjnl-2019-214484
11. Donaldson GC, Seemungal TA, Bhowmik A, Wedzicha JA. Relationship between exacerbation frequency and lung function decline in chronic obstructive pulmonary disease. Thorax. 2002;57(10):847–852. doi:10.1136/thorax.57.10.847
12. Ornek T, Tor M, Altın R, et al. Clinical factors affecting the direct cost of patients hospitalized with acute exacerbation of chronic obstructive pulmonary disease. Int J Med Sci. 2012;9(4):285–290. doi:10.7150/ijms.4039
13. Fucà G, Guarini V, Antoniotti C, et al. The Pan-Immune-Inflammation Value is a new prognostic biomarker in metastatic colorectal cancer: results from a pooled-analysis of the Valentino and TRIBE first-line trials. Br J Cancer. 2020;123(3):403–409. doi:10.1038/s41416-020-0894-7
14. Hai-Jing Y, Shan R, Jie-Qiong X. Prognostic significance of the pretreatment pan-immune-inflammation value in cancer patients: an updated meta-analysis of 30 studies. Front Nutr. 2023;10:1259929. doi:10.3389/fnut.2023.1259929
15. Jin C, Li X, Luo Y, Zhang C, Zuo D. Associations between pan-immune-inflammation value and abdominal aortic calcification: a cross-sectional study. Front Immunol. 2024;15:1370516. doi:10.3389/fimmu.2024.1370516
16. Murat B, Murat S, Ozgeyik M, Bilgin M. Comparison of pan-immune-inflammation value with other inflammation markers of long-term survival after ST-segment elevation myocardial infarction. Eur J Clin Invest. 2023;53(1):e13872. doi:10.1111/eci.13872
17. Zhao W, Liao Q, Feng Y, et al. Association of pan-immune inflammation value with mortality in patients with pulmonary embolism: a cohort study. Sci Rep. 2025;15(1):6571. doi:10.1038/s41598-025-90951-y
18. Xu J, Zeng Q, Li S, Su Q, Fan H. Inflammation mechanism and research progress of COPD. Front Immunol. 2024;15:1404615. doi:10.3389/fimmu.2024.1404615
19. Marin JM, Carrizo SJ, Casanova C, et al. Prediction of risk of COPD exacerbations by the BODE index. Respir Med. 2009;103(3):373–378. doi:10.1016/j.rmed.2008.10.004
20. Puhan MA, Garcia-Aymerich J, Frey M, et al. Expansion of the prognostic assessment of patients with chronic obstructive pulmonary disease: the updated BODE index and the ADO index. Lancet. 2009;374(9691):704–711. doi:10.1016/S0140-6736(09)61301-5
21. Jones RC, Donaldson GC, Chavannes NH, et al. Derivation and validation of a composite index of severity in chronic obstructive pulmonary disease: the DOSE Index. Am J Respir Crit Care Med. 2009;180(12):1189–1195. doi:10.1164/rccm.200902-0271OC
22. Qiu S, Jiang Q, Li Y. The association between pan-immune-inflammation value and chronic obstructive pulmonary disease: data from NHANES 1999-2018. Front Physiol. 2024;15:1440264. doi:10.3389/fphys.2024.1440264
23. Liu X, Guo Y, Qi W. Prognostic value of composite inflammatory markers in patients with chronic obstructive pulmonary disease: a retrospective cohort study based on the MIMIC-IV database. PLoS One. 2025;20(1):e0316390. doi:10.1371/journal.pone.0316390
24. Celli BR, Fabbri LM, Aaron SD, et al. An updated definition and severity classification of chronic obstructive pulmonary disease exacerbations: The Rome proposal. Am J Respir Crit Care Med. 2021;204(11):1251–1258. doi:10.1164/rccm.202108-1819PP
25. Heymans MW, Twisk JWR. Handling missing data in clinical research. J Clin Epidemiol. 2022;151:185–188. doi:10.1016/j.jclinepi.2022.08.016
26. Zinellu A, Zinellu E, Mangoni AA, et al. Clinical significance of the neutrophil-to-lymphocyte ratio and platelet-to-lymphocyte ratio in acute exacerbations of COPD: present and future. Eur Respir Rev. 2022;31(166):220095. doi:10.1183/16000617.0095-2022
27. Yao C, Liu X, Tang Z. Prognostic role of neutrophil-lymphocyte ratio and platelet-lymphocyte ratio for hospital mortality in patients with AECOPD. Int J Chron Obstruct Pulmon Dis. 2017;12:2285–2290. doi:10.2147/COPD.S141760
28. Sapey E, Stockley RA. COPD exacerbations. 2: aetiology. Thorax. 2006;61(3):250–258. doi:10.1136/thx.2005.041822
29. Jasper AE, McIver WJ, Sapey E, Walton GM. Understanding the role of neutrophils in chronic inflammatory airway disease. F1000Research. 2019;8:F1000–aculty.
30. Barczyk A, Pierzchała W, Kon OM, Cosio B, Adcock IM, Barnes PJ. Cytokine production by bronchoalveolar lavage T lymphocytes in chronic obstructive pulmonary disease. J Allergy Clin Immunol. 2006;117(6):1484–1492. doi:10.1016/j.jaci.2006.02.013
31. Wang Y, Xu J, Meng Y, Adcock IM, Yao X. Role of inflammatory cells in airway remodeling in COPD. Int J Chron Obstruct Pulmon Dis. 2018;13:3341–3348. doi:10.2147/COPD.S176122
32. Zouaoui Boudjeltia K, Kotsalos C, de Sousa DR, et al. Spherization of red blood cells and platelet margination in COPD patients. Ann N Y Acad Sci. 2021;1485(1):71–82. doi:10.1111/nyas.14489
33. Peng LG, Zhou C, Zhou HX, et al. Risk factors associated with in-hospital mortality in hospitalized patients with acute exacerbation of chronic obstructive pulmonary disease: a multicenter retrospective study. Zhonghua Yi Xue Za Zhi. 2021;101(48):3932–3937. doi:10.3760/cma.j.cn112137-20210709-01542
34. Crisafulli E, Manco A, Guerrero M, et al. Age is a determinant of short-term mortality in patients hospitalized for an acute exacerbation of COPD. Intern Emerg Med. 2021;16(2):401–408. doi:10.1007/s11739-020-02420-1
35. Cho SJ, Stout-Delgado HW. Aging and lung disease. Annual Rev Physiol. 2020;82:433–459. doi:10.1146/annurev-physiol-021119-034610
36. Wang Y, Stavem K, Dahl FA, Humerfelt S, Haugen T. Factors associated with a prolonged length of stay after acute exacerbation of chronic obstructive pulmonary disease (AECOPD). Int J Chron Obstruct Pulmon Dis. 2014;9:9. doi:10.2147/COPD.S50860
37. Hu D, Huang J, Zhao W, et al. A low eosinophil to platelet ratio as a worse prognostic index for emergency department attendance in acute exacerbation of COPD. Int J Chron Obstruct Pulmon Dis. 2024;19:139–147. doi:10.2147/COPD.S442715
38. McMillan DC, Watson WS, O’Gorman P, Preston T, Scott HR, McArdle CS. Albumin concentrations are primarily determined by the body cell mass and the systemic inflammatory response in cancer patients with weight loss. Nutr Cancer. 2001;39(2):210–213. doi:10.1207/S15327914nc392_8
39. Sheinenzon A, Shehadeh M, Michelis R, Shaoul E, Ronen O. Serum albumin levels and inflammation. Int J Biol Macromol. 2021;184:857–862. doi:10.1016/j.ijbiomac.2021.06.140
40. Barbosa-Silva MCG. Subjective and objective nutritional assessment methods: what do they really assess? Curr Opin Clin Nutr Metab Care. 2008;11(3):248–254. doi:10.1097/MCO.0b013e3282fba5d7
41. Gunen H, Hacievliyagil SS, Kosar F, et al. Factors affecting survival of hospitalised patients with COPD. Eur Respir J. 2005;26(2):234–241. doi:10.1183/09031936.05.00024804
 © 2025 The Author(s). This work is published and licensed by Dove Medical Press Limited. The
full terms of this license are available at https://www.dovepress.com/terms
and incorporate the Creative Commons Attribution
- Non Commercial (unported, 4.0) License.
By accessing the work you hereby accept the Terms. Non-commercial uses of the work are permitted
without any further permission from Dove Medical Press Limited, provided the work is properly
attributed. For permission for commercial use of this work, please see paragraphs 4.2 and 5 of our Terms.
© 2025 The Author(s). This work is published and licensed by Dove Medical Press Limited. The
full terms of this license are available at https://www.dovepress.com/terms
and incorporate the Creative Commons Attribution
- Non Commercial (unported, 4.0) License.
By accessing the work you hereby accept the Terms. Non-commercial uses of the work are permitted
without any further permission from Dove Medical Press Limited, provided the work is properly
attributed. For permission for commercial use of this work, please see paragraphs 4.2 and 5 of our Terms.